Article

Correlation Modeling between Morphology and Compression Behavior of Closed-Cell Al Foams Based on X-ray Computed Tomography Observations

1
Department of Industrial Engineering, University of Roma-Tor Vergata, 00133 Roma, Italy
2
Department of Civil Engineering and Architecture, University of Catania, 95123 Catania, Italy
3
Department of Engineering, University of Messina, 98166 Messina, Italy
*
Author to whom correspondence should be addressed.
Metals 2021, 11(9), 1370; https://doi.org/10.3390/met11091370
Submission received: 29 July 2021 / Revised: 26 August 2021 / Accepted: 27 August 2021 / Published: 30 August 2021
(This article belongs to the Special Issue Metal Foams 2021)

Abstract

:
In the last decades, great attention has been focused on the characterization of cellular foams, because of their morphological peculiarities that allow for obtaining effective combinations of structural properties. A predictive analytical model for the compressive behavior of closed-cell Al foams, based on the correlation between the morphology of the cellular structure and its mechanical response, was developed. The cells’ morphology of cylindrical specimens was investigated at different steps of compression by X-ray computed tomography, in order to detect the collapse evolution. The structure, typically inhomogeneous at local level, was represented by developing a global virtual model consisting of homogeneous cells ordered in space, that was fitted on the experimentally detected structure at each deformation step. As a result, the main parameters characterizing the two-dimensional cells morphology (equivalent diameter, circularity), processed by the model, allowed to simulate the whole compression stress–strain curve by enveloping those obtained for each step. The model, fitted on the previous foam, was validated by comparing the simulated stress–strain curve and the corresponding experimental one, detected for similar foams obtained by different powder compositions. The effectiveness in terms of an accurate prediction of the compression response up to the final densification regime has been confirmed.

1. Introduction

Due to their cellular microstructure, metal foams have attracted considerable interest in several industrial applications for their unique morphological characteristics, which allow for joining in a single material an effective combination of structural properties (low density, high capability to absorb energy during deformation), and various functional properties [1]. The field of possible applications has been further expanded by additive manufacturing technologies, which have revealed a marked capability in fabricating structures characterized by almost all types of cell shapes [2].
Regarding the mechanical behavior, in the last decades great attention has been focused on the characterization and modelling of closed-cell aluminum foams. Uniaxial stress–strain behavior has been investigated extensively [3,4,5], also taking strain rate sensitivity into consideration [6,7], and exploiting the advantages of new manufacturing technologies in cellular structures optimization, in order to obtain greater mechanical efficiency without increasing the relative density [8].
The compressive properties of cellular materials, which can be expressed by some key parameters of the stress–strain curve, such as the elastic modulus, plateau stress, and final deformation values, are particularly important for the mechanical design of components [9]. It is a matter of fact that the cellular structure determines an important effect on the compression behavior [10,11], because the amount of energy absorbed is directly related to the way the cells collapse [12]. As a consequence, the aforementioned compression properties are strictly connected to the morphological characteristics of foams, as cells’ size, shape, and wall thickness, which undergo an evolution during deformation, and affect the deformation modes [13]. This evidence suggests investigating the potential of the morphological properties for predicting the mechanical behavior of cellular structures.
With specific reference to closed-cell Al alloy foams, various models have been proposed to describe their behavior by means of constitutive laws which represent the cellular structures as solid materials, and are based on empirical equations, formulated by processing experimental results [14].
The representative models for closed-cell foams, instead, allow for the representation of regular periodic structures, by using polyhedra to model the cells and fill the 3D space of the structure. The reference study by Gibson and Ashby [15] proposes a skeleton cubic cell model, which allows to establish a well-known set of equations to calculate the main parameters of the stress–strain curve of the foam, by performing a dimensional analysis and introducing empirical constants to be fitted on the experimental data depending on the specific foam. Although the equations resulting from this model can be considered widely validated and are frequently used, the geometric schematization of the cellular structure is not very representative of the real structure of some types of foams. For this reason, other representative models have been proposed. The truncated cube model by Santosa and Weirzbicki [16] assumes the foam to consist of a packed lattice of small and large cells, obtained by assembling symmetric cubic cells truncated at the vertices, and allows to formulate an analytical solution for the crushing strength. As an improvement of the truncated cube model, the cruciform-hemisphere model proposed by Meguid et al. [17] replaces the pyramidal sections obtained at the vertex of the truncated cubes with hemispherical sections, obtaining a more realistic geometric representation.
The representative models described above are the basis of the most known analytical formulations that allow for calculating the key parameters of the compressive behavior of the closed-cell structures (elastic modulus, plateau stress, and densification strain) [9]. By means of these parameters it is possible just to construct schematic and approximate stress–strain curves. This is due to the limited number of points in the curve that can be derived by these parameters, and to the significant deviations between their values predicted by analytical calculation and the corresponding values detected experimentally [18]. Furthermore, these basic formulations do not allow to correlate the mechanical behavior with the morphological properties of the structure, as they are direct functions of the relative density of the foam.
To obtain a complete simulation of the mechanical behavior extended to the whole compression process, these formulations have been widely implemented in Finite Element (FE) numerical models. Numerical computation is, therefore, the tool most used for studying the behavior of cellular structures by representative modeling. This is true not only for geometries based on polyhedra [19], but also in the case of models that use basic cell shapes (circular, elliptic, rectangular, square) [20], or combinations of them [21], and models obtained by positioning spherical cells in cubic units, according to the arrangements that characterize the well-known crystal structures [22].
However, even in investigations based on numerical modeling, the cases in which the mechanical behavior is directly related to the morphological properties of the structure are limited. The size, aspect ratio, orientation, and anisotropy of the cells, as well as the length, straightness, inclination, and thickness of the cell walls were correlated to the deformation mechanism of closed-cell foam, with particular regard to the initiation of collapse [23]. A FE model with Representative Volume Elements was set to investigate the effects of cells height and wall thickness on the compressive behavior [24]. A similar modeling approach was used to obtain a morphological control on cell size, wall thickness, and curvature distributions on metal closed-cell structures, and to simulate their behavior under compressive loading up to the densification stage [25].
The most complex numerical models used to represent random cells arrangements and geometrical properties variability by means of a large number of elements generated by tessellation algorithms, constitute an advanced approach to the modeling of cellular structures, and requires high computational capacity. They have been recently used for investigating the effects of various morphological properties focusing on some aspects of mechanical behavior. Random Laguerre tessellations was used to generate model foams with strongly varying cell sizes and simulate the effect on elastic stiffness of the structure [26]. The cell size effects on the compressive properties of Al foams were investigated by Voronoi modeling and statistical analysis of the relationship between the micro-structure parameters and the macro-properties of foams [27]. The compression behavior of the Voronoi model was also simulated to investigate the influence of cell irregularity on elastic and plastic behavior of closed-cell foams [28]. The effects of cell-size dispersity on the Young’s modulus of foam were investigated through numerical simulations on polydispersed model obtained by the random Laguerre tessellation algorithm [29]. Different magnitudes of pore size and misalignment was simulated by imposing random displacement in irregular Voronoi models, so to assess the effects on the compressive response [30].
As a general observation, the more complex computational approaches based on FE modeling are hardly able to accurately simulate the whole spectrum of regimes that arise during the compression of cellular structures (linear elastic deformation, plastic collapse, densification), generally achieving greater accuracy in the second one, although there are examples in which a good fit of the experimental curve in the densification zone [31] or an acceptable agreement in the linear elastic region [32] is obtained.
Therefore, the predictive simulation of the whole stress–strain curve based on the geometrical properties of the cellular structure remains a challenging task, and the analytical approach has not been pushed to this direction.
Focusing on closed-cell Al foams, the present work proposes an analytical model aimed for the prediction of the compressive behavior, by calculating the main parameters of the stress–strain curve and simulating it up to the final densification, based on the two-dimensional analysis of the morphological characteristics of the cellular structure, and their evolution during the collapse process.
Considering that the precursor conditions to produce the metal foams (powder composition and the parameters of the foaming process) can be correlated to the morphological properties of the final cellular structures [33], the applicative purpose of the model can be addressed to predict with good approximation the mechanical behavior of the structure, by means of a basic two-dimensional detection and analysis of the morphology resulting from the foaming conditions set.
With these purposes, the relationship between the distributions of morphological characteristics of the foam sections longitudinal to the load direction and the mechanical response of the cellular structure, during the compressive progression, was searched for. As a result, an analytical model for morphology–behavior correlation, comprising a procedure for constructing the stress–strain curve, was defined, with the objective of simulating the whole compressive behavior, up to the final densification.
Starting from the consideration that foams generally show a typical non-homogeneous morphology, being characterized by cells having geometry and size different from each other [34,35], the correlation between the morphological properties of the foam and the characteristic parameters of the stress–strain curve (elastic modulus, plastic plateau stress, strain parameters of densification) needs to transform the real cellular structure, non-homogeneous at local level, into a virtual reference model consisting of cells ordered in space, with global homogeneous geometric properties. The translation of the local morphological parameters into the global parameters of the reference model was obtained by introducing an intermediate model to consider the asymmetry of the cells and their orientation with respect to the direction of compression.
To investigate the potential of the model for the prediction of compressive behavior based on the morphological analysis, it was first fitted on the experimentally detected behavior for a specific foam, following the evolution of morphology during the progression of deformation; subsequently, it was used to simulate the compression behavior of similar foams. For this purpose, closed-cell Al foams were produced by an in-house process based on the compacted powder method, starting from Al and SiC powders with the addition of TiH2 powder as foaming agent at various contents. By this way it was possible to fit the model on the experimentally detected compression behavior for a foam with a specific powder composition and evaluate its potential in predicting the same behavior for similar foams obtained by different powder compositions.
The morphology of the cellular structure, expressed by the distribution of the values of the equivalent diameters and circularities of the cells through the specimen sections, was investigated by X-ray computed tomography (CT), a technique that, together with basic radioscopy, has already proved particularly suitable for the internal investigation of metal foams, focusing on different aspects: foaming process efficiency [36], morphological analysis, and microstructural characterization of foamed structures [34,35], and their mechanical behavior [37,38]. Specifically, in [39], significant changes in the structure of the internal cells during the deformation process were documented by means of CT images, overcoming previous approaches based on combination of metallographic images and static theory application [13].
For the specimen used for model fitting, the tomographic observations were carried out at different levels of compression in order to study the evolution of cells’ morphology during deformation up to the final densification, according to an experimental procedure first presented in [40] for Al foam, and in [41] for a Cu tube filled with an Al alloy foam.
Once fitted on the basis of the CT observations as compression progresses, the analytical model was used to predict the mechanical behavior of the other similar foams, produced by varying the content of the TiH2 forming agent, and was validated by means of comparison between simulated and experimentally detected stress–strain curves.
The paper has been structured according to three main sections. In Section 2, the materials and methods are detailed. Particularly, the approach to experimental investigation is treated, specifying specimens’ fabrication and characteristics, the statement of compression testing and tomographic observations, and the method of conducting the morphology analysis. Section 3 is dedicated to the theoretical development of the morphology–behavior correlation model, reported according to its main steps: the modeling of cellular structure, the simulation of compressive behavior, and the fitting of the correlation model. Section 4 reports the application of the model and the results obtained, focusing on the predictive use of the fitted model. The significance and implications of the main results are discussed.

2. Materials and Methods

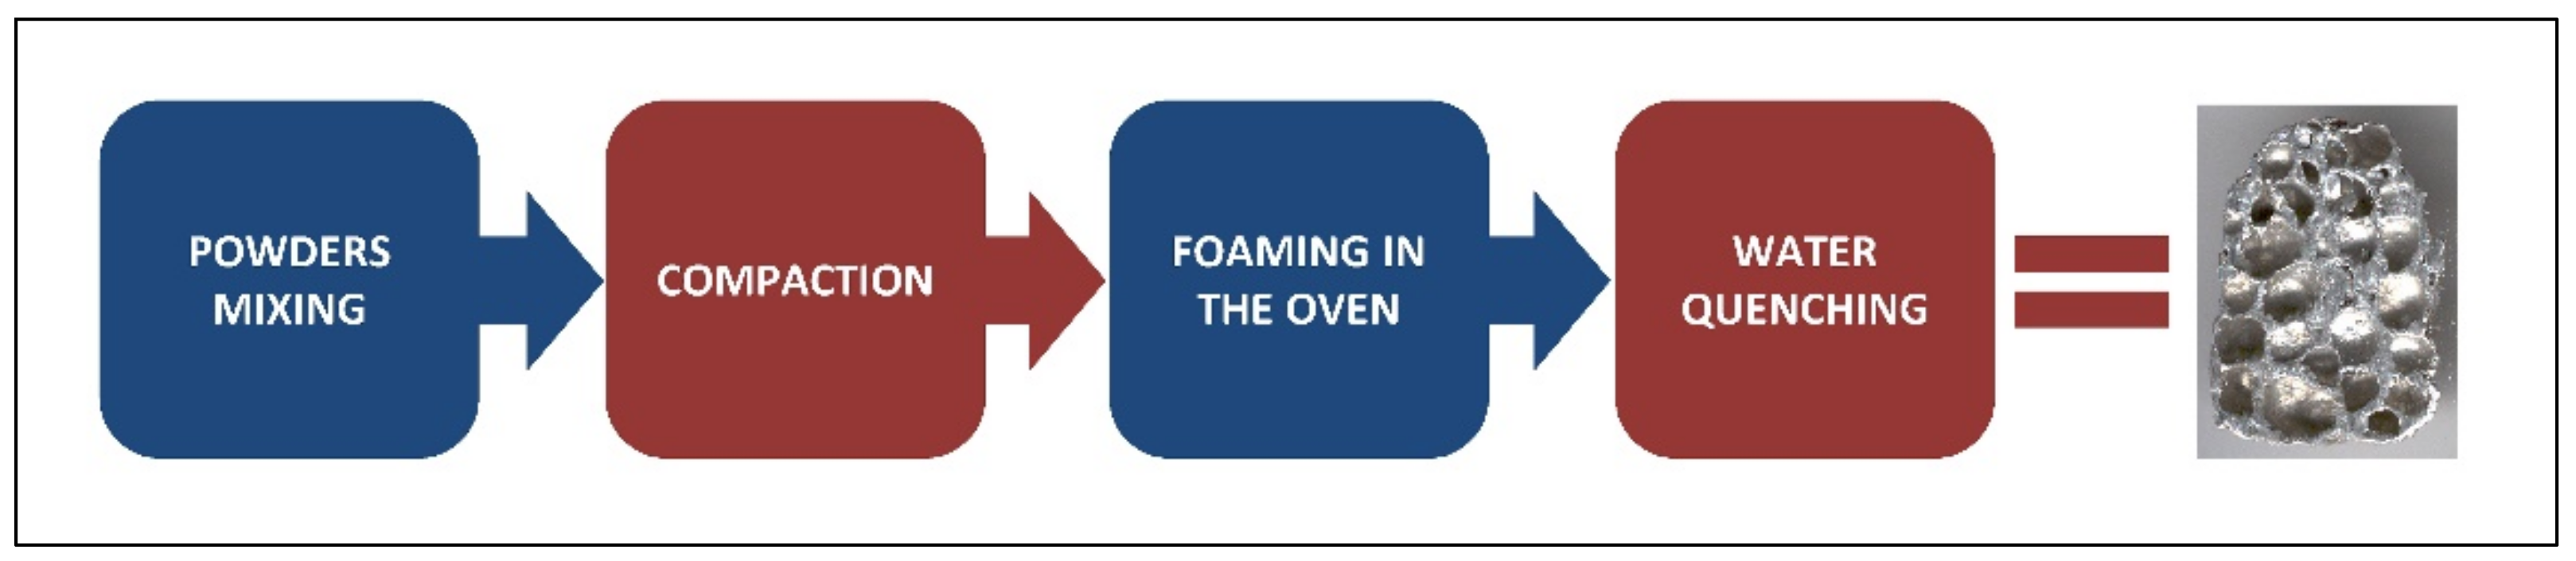
2.1. Specimens Production

The cylindrical specimens, made of Al foam with closed cells, were produced through the compacted powder method (Figure 1), assuming the process parameters developed in previous work [42]. Commercially pure Al powder (44 µm average diameter) was mixed with TiH2 powder as a foaming agent (5 μm average diameter) and SiC powder (37 μm average diameter), added to increase viscosity and stabilize porosity by acting at the interface metal-bubble.
Three different powder compositions were considered, by varying the forming agent content: TiH2 at 0.1–0.2–0.4 weight %, SiC at 2.8 weight %, and commercially pure Al to balance. The powders were carefully mixed to produce after pressing homogeneous precursors, because, especially for the TiH2 particles, this is a fundamental requirement to produce foams of good quality [43].
The powders were blended in a rotating jar and compacted at room temperature in a mold, by means of a hydraulic press, at a uniaxial pressure of about 270 MPa to get cylindrical foaming precursors (diameter 15 mm, height 8 mm), ready to be foamed. The precursors were subsequently placed in a copper crucible inside an oven and heated from room temperature to the foaming temperature of 700 °C in 120 s to avoid an initial excessive gas dispersion. After a holding time equal to 5 min, the specimens were water cooled.
The foaming temperature was not much higher than the melting point of pure Al (660 °C). This combination of temperature and holding time inside the mold was chosen because it determines a good compromise between viscosity in the liquid state (melt viscosity would be too low at higher temperatures) and foam growth.
Finally, in order to obtain a cylindrical geometry suitable for the compression test, the foamed specimens were post-processed by slight compression between two planes, in order to flatten their bases (Step 0 state).

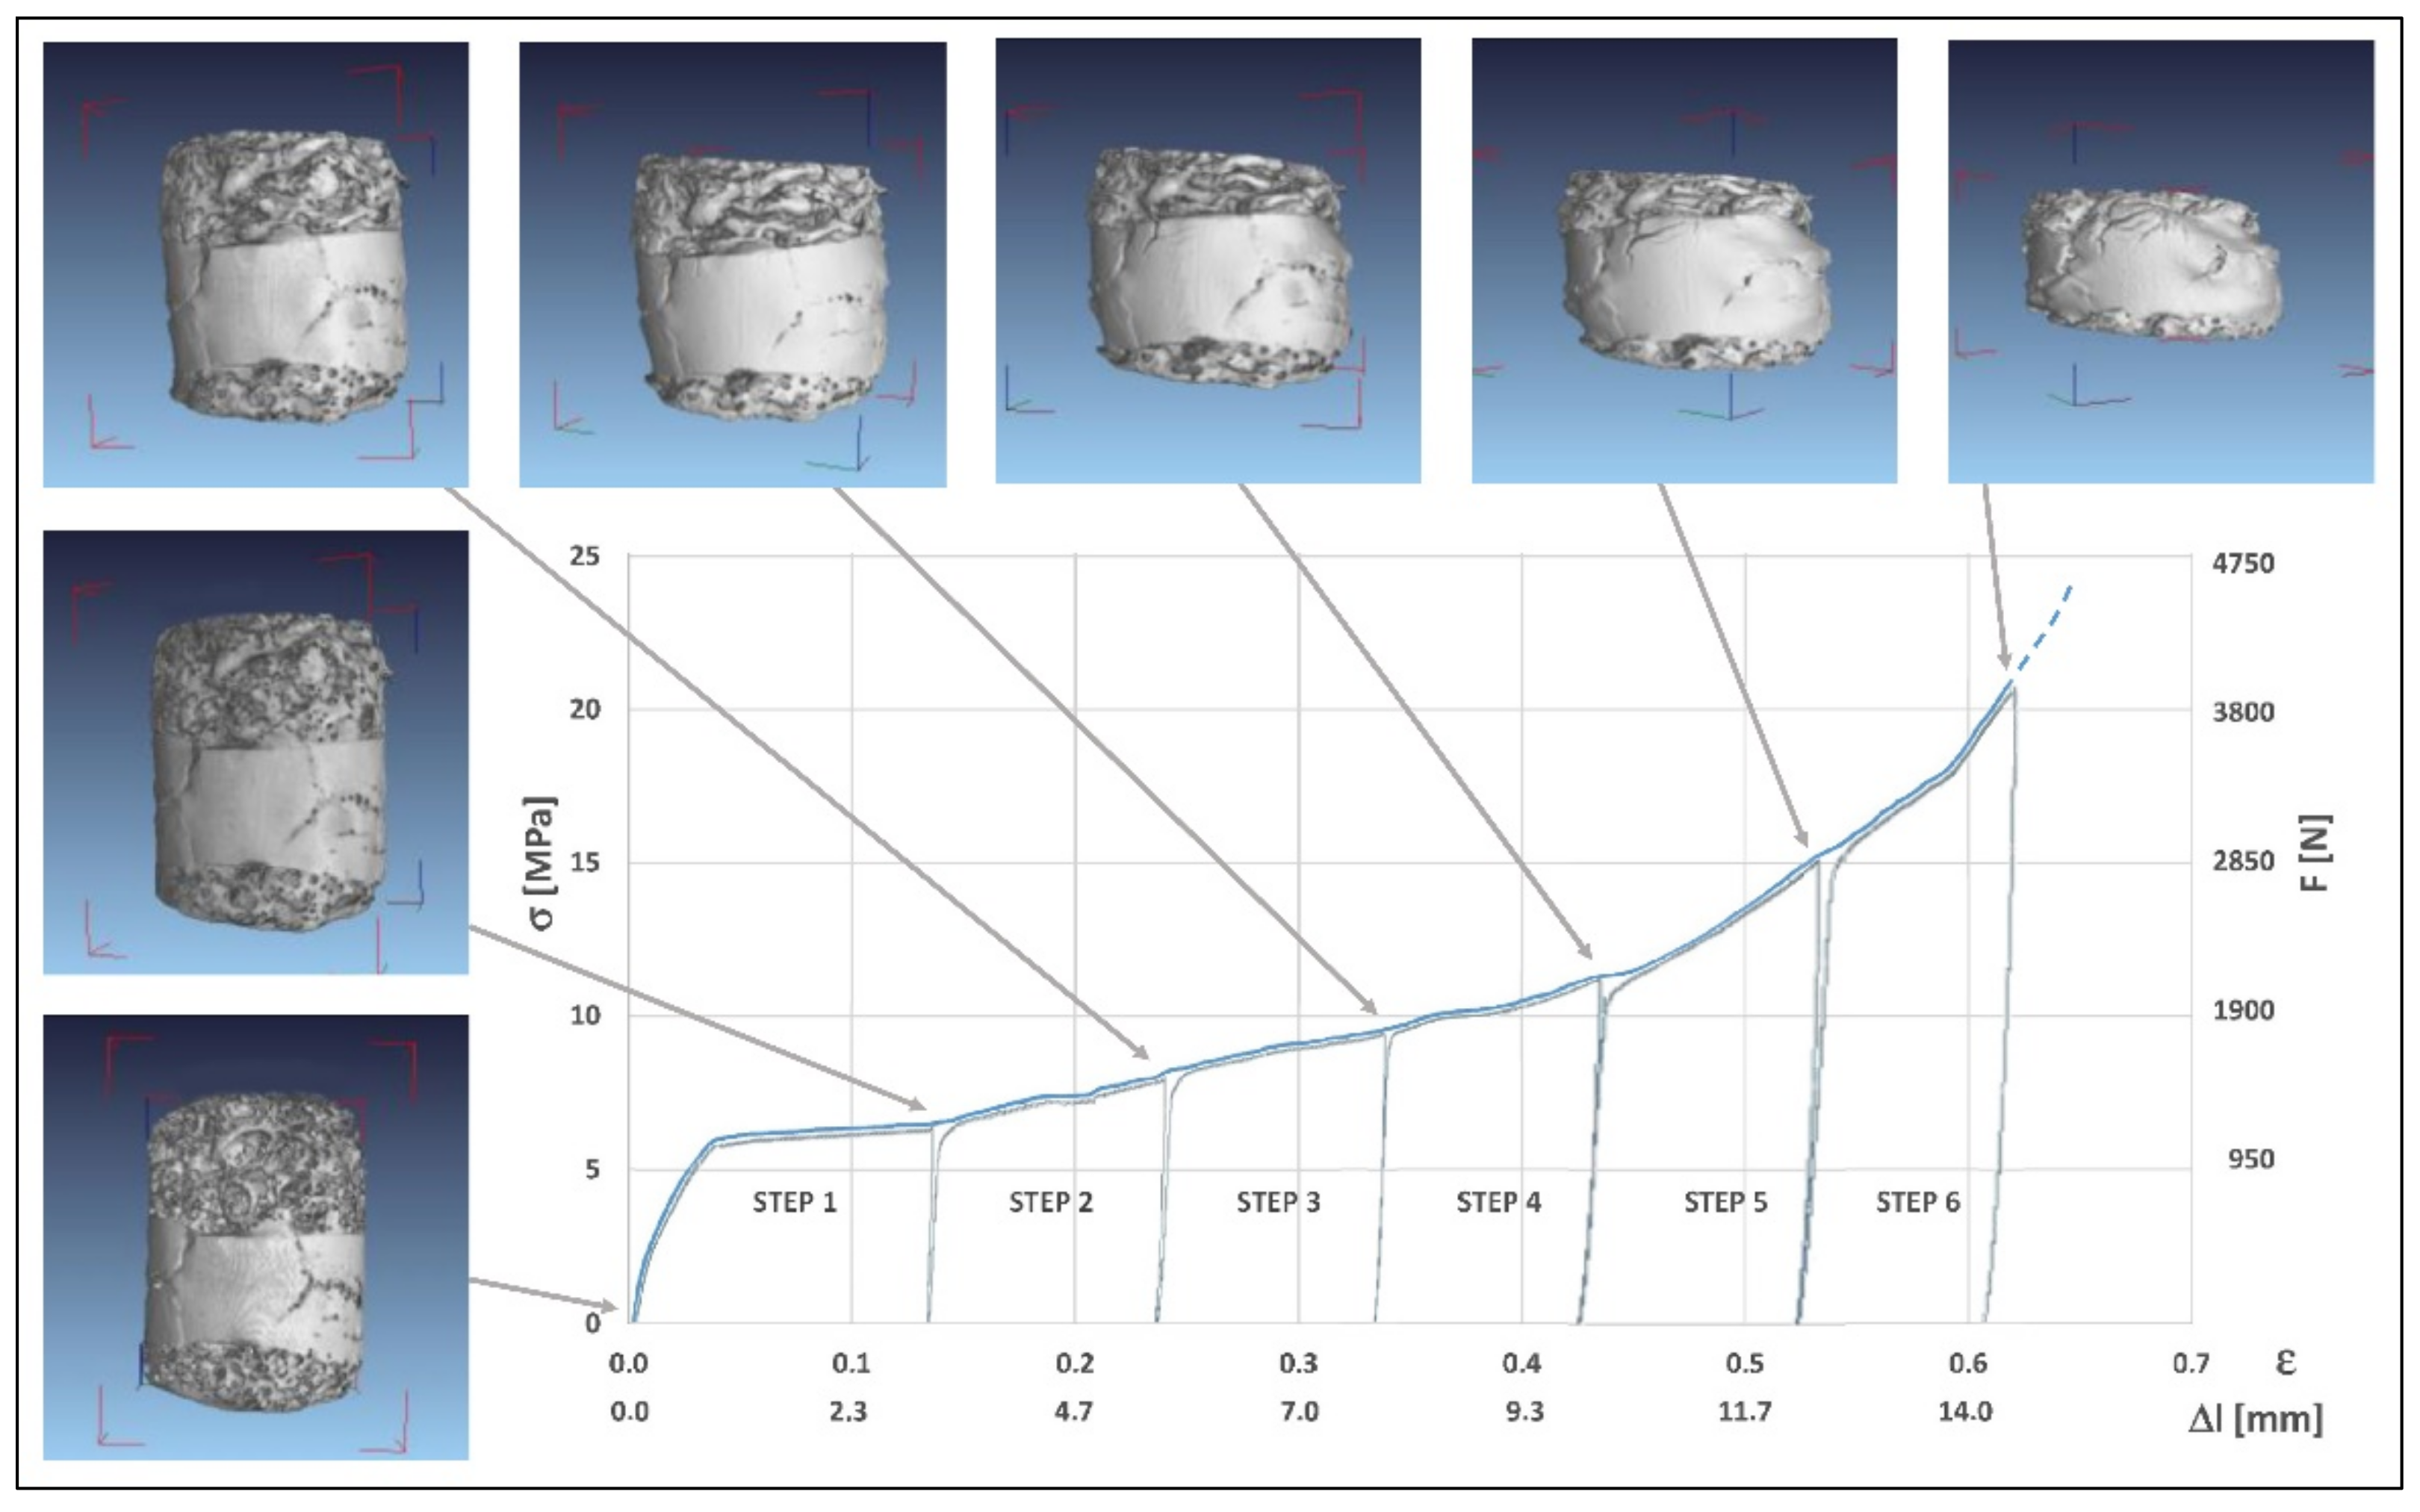
2.2. Compression Tests

The axial compression tests were performed by an MTS Insight 50 electromechanical testing machine (MTS Systems Corporation, Eden Prairie, MN, USA), under control of deformation, starting from Step 0 state. A crosshead constant speed of 2 mm/min with a data acquisition frequency of 5 Hz was utilized.
For the 0.4% TiH2 foam the compression test was performed at increasing steps of deformation, in order to detect the evolution of the morphological characteristics during deformation. For each step, the specimen was loaded, unloaded, and observed by X-ray computed tomography (CT) to analyze the morphology of the cellular structure corresponding to the compression state at the end of the step.
The deformation reached at each step was calculated with respect to the height of the specimen in the initial condition (Step 0), and the loading curves of the steps were assembled in sequence in order to obtain the continuous stress–strain curve that represents the overall compression behavior.
Continuous compression tests were performed for 0.1% and 0.2% TiH2 foams.

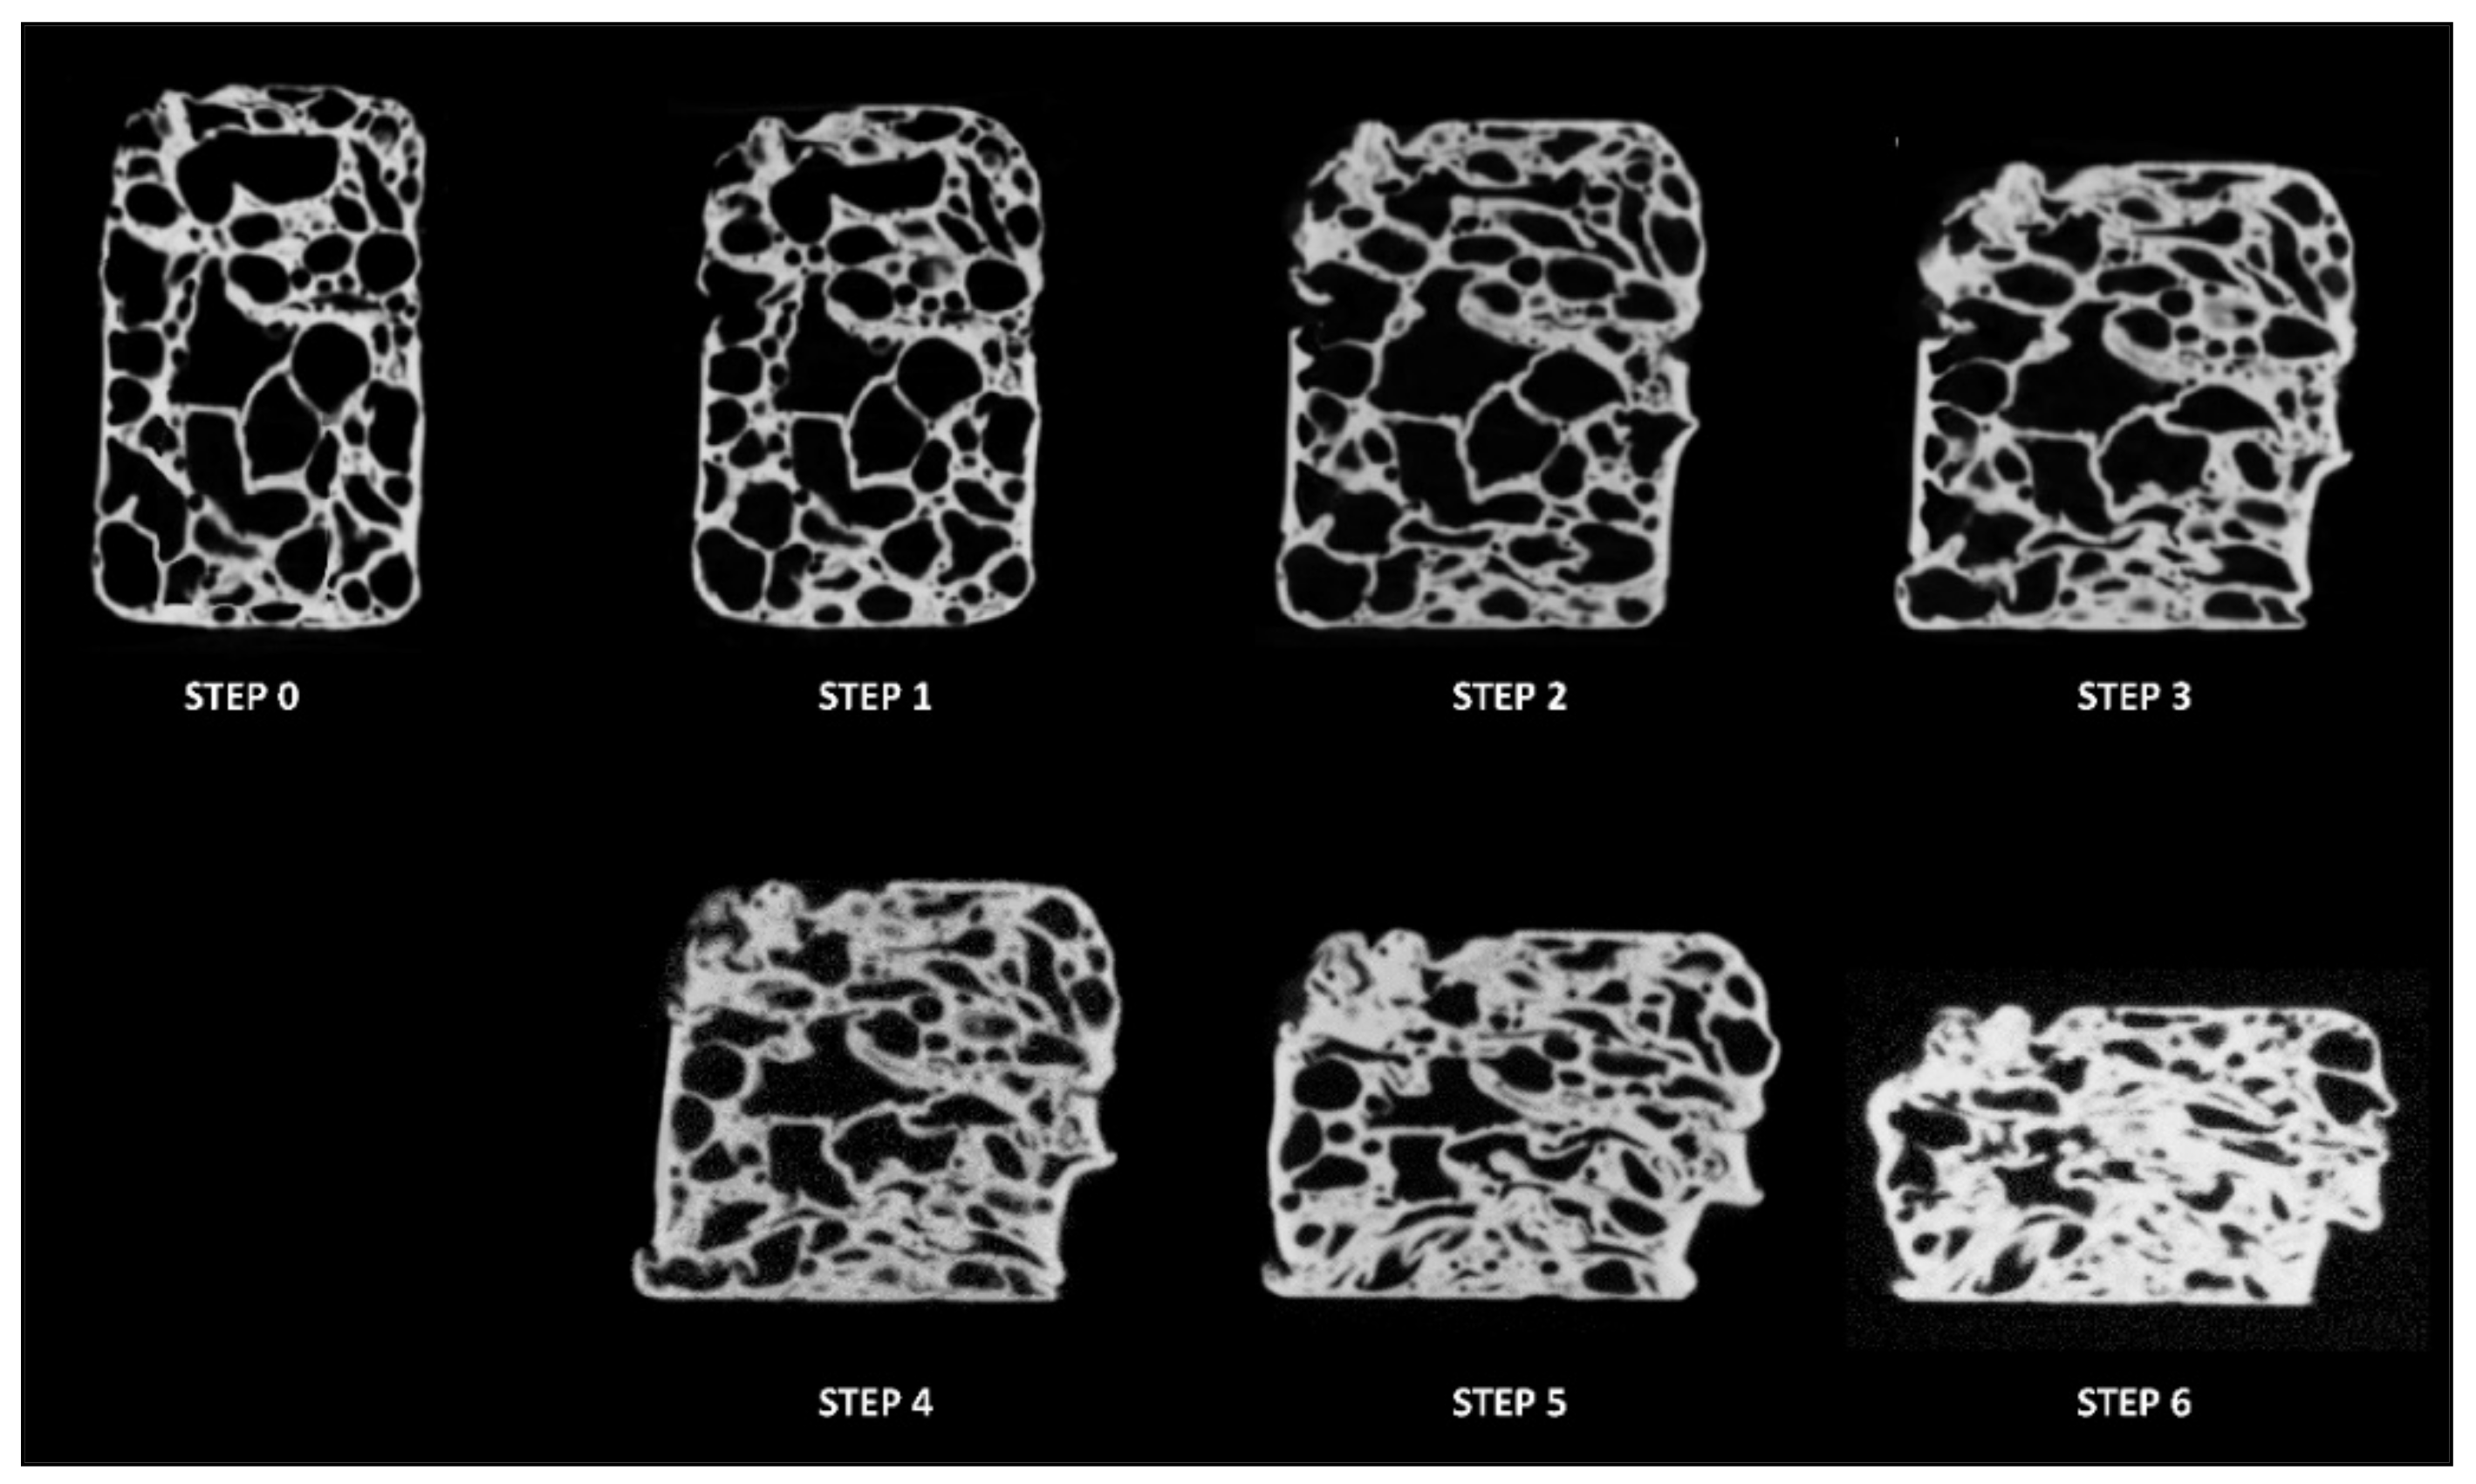
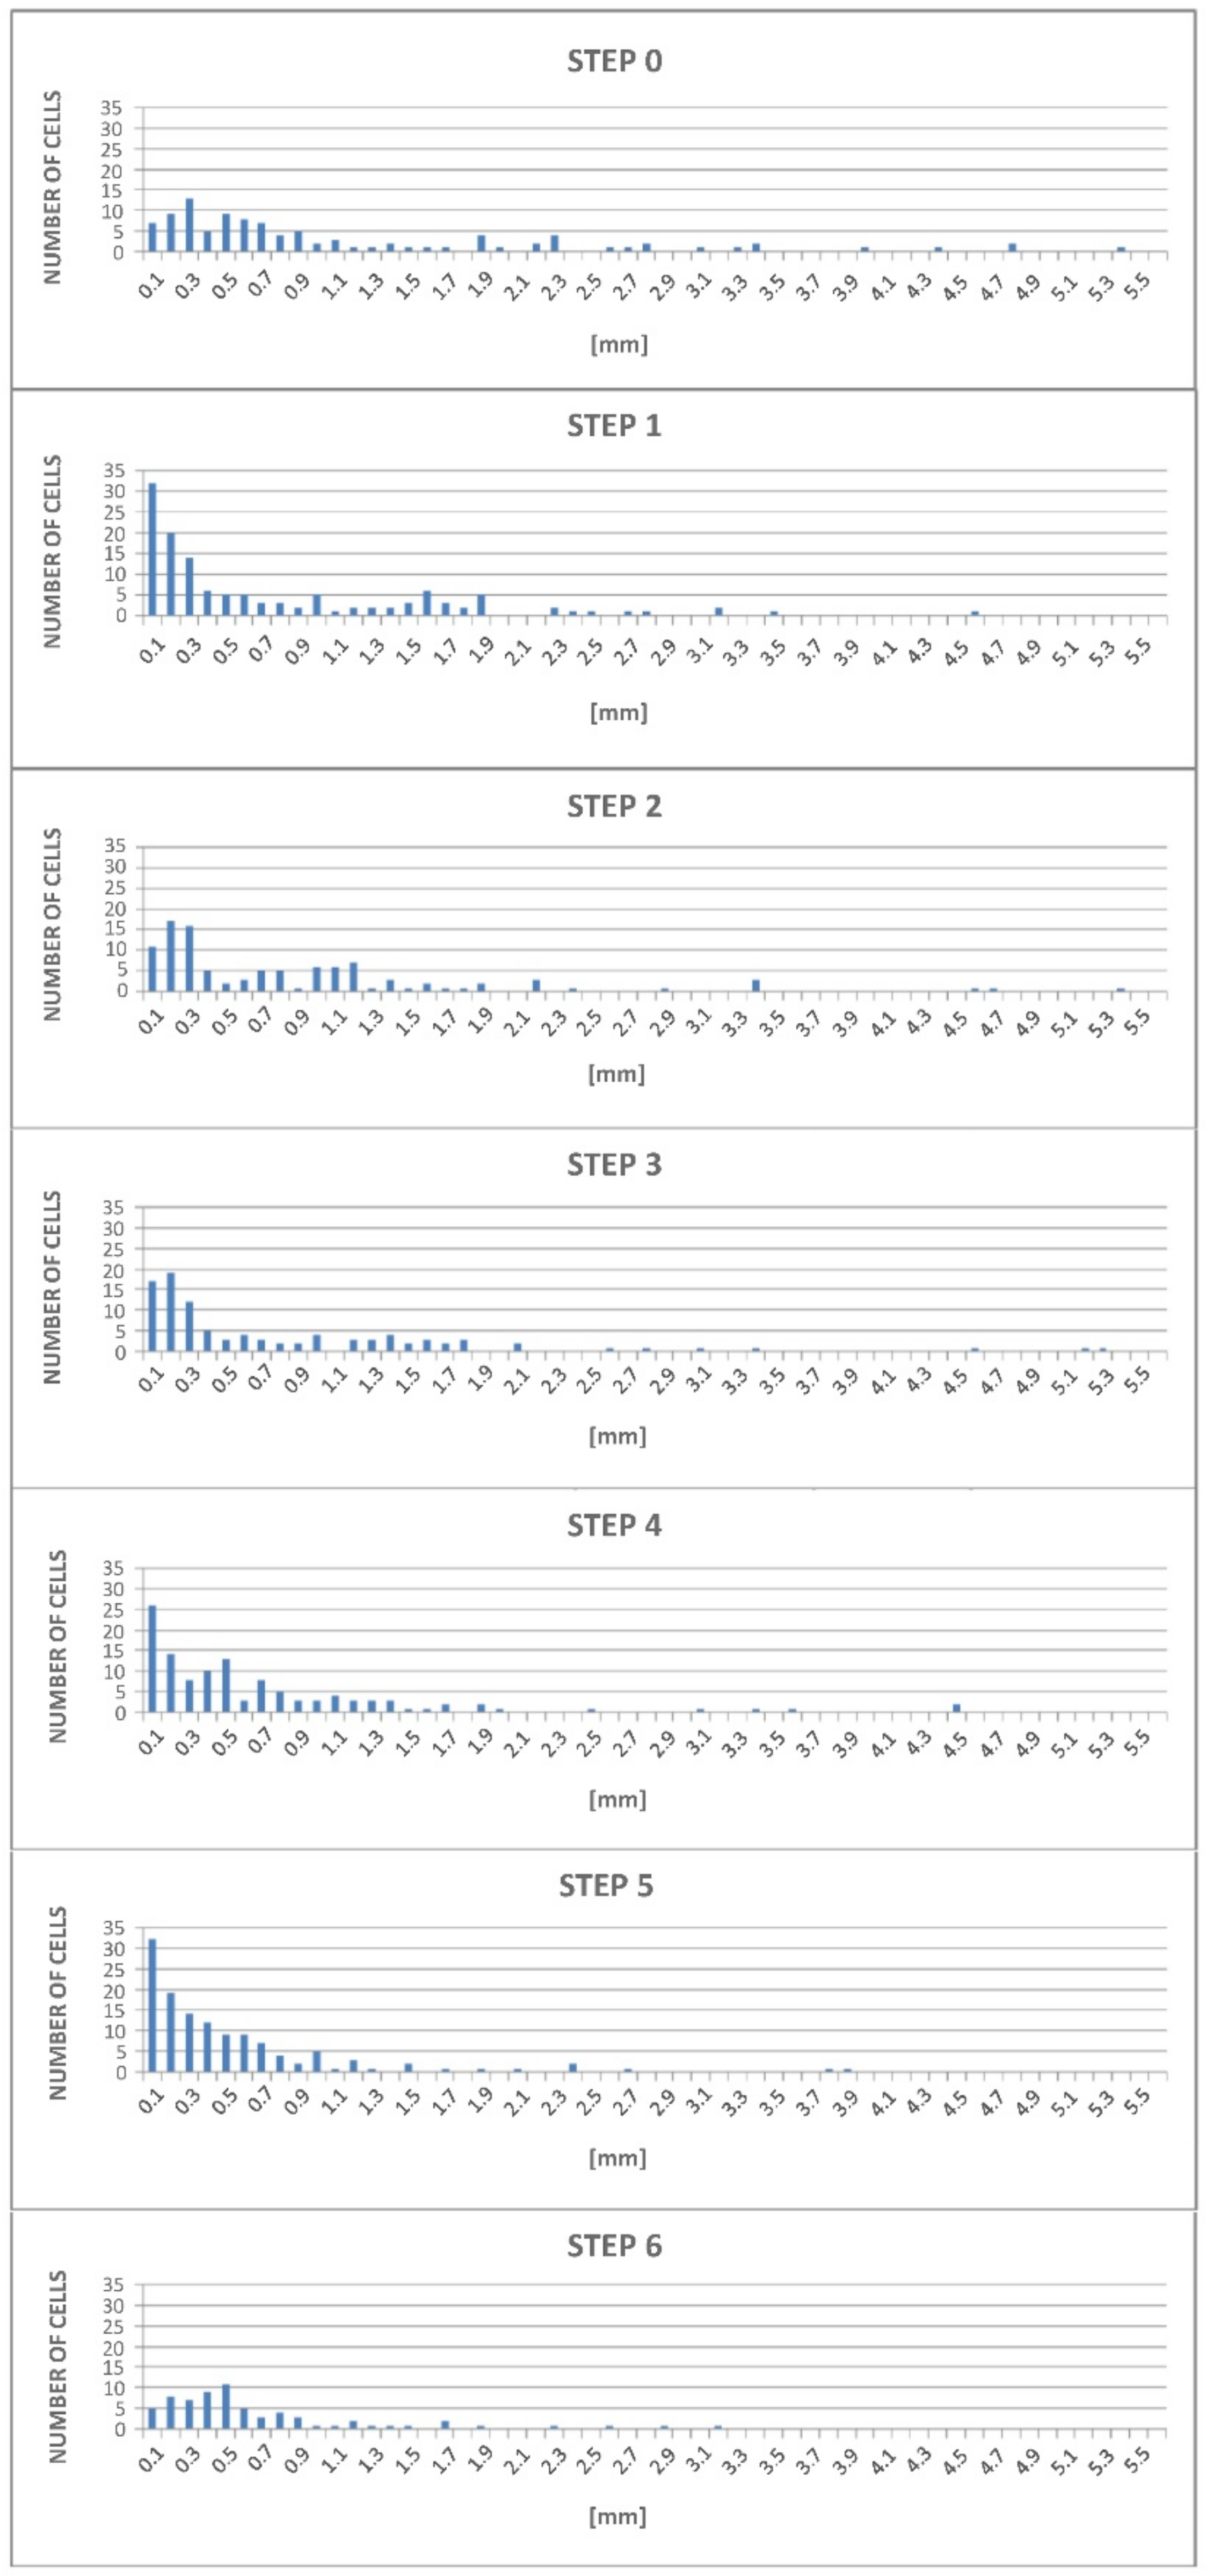
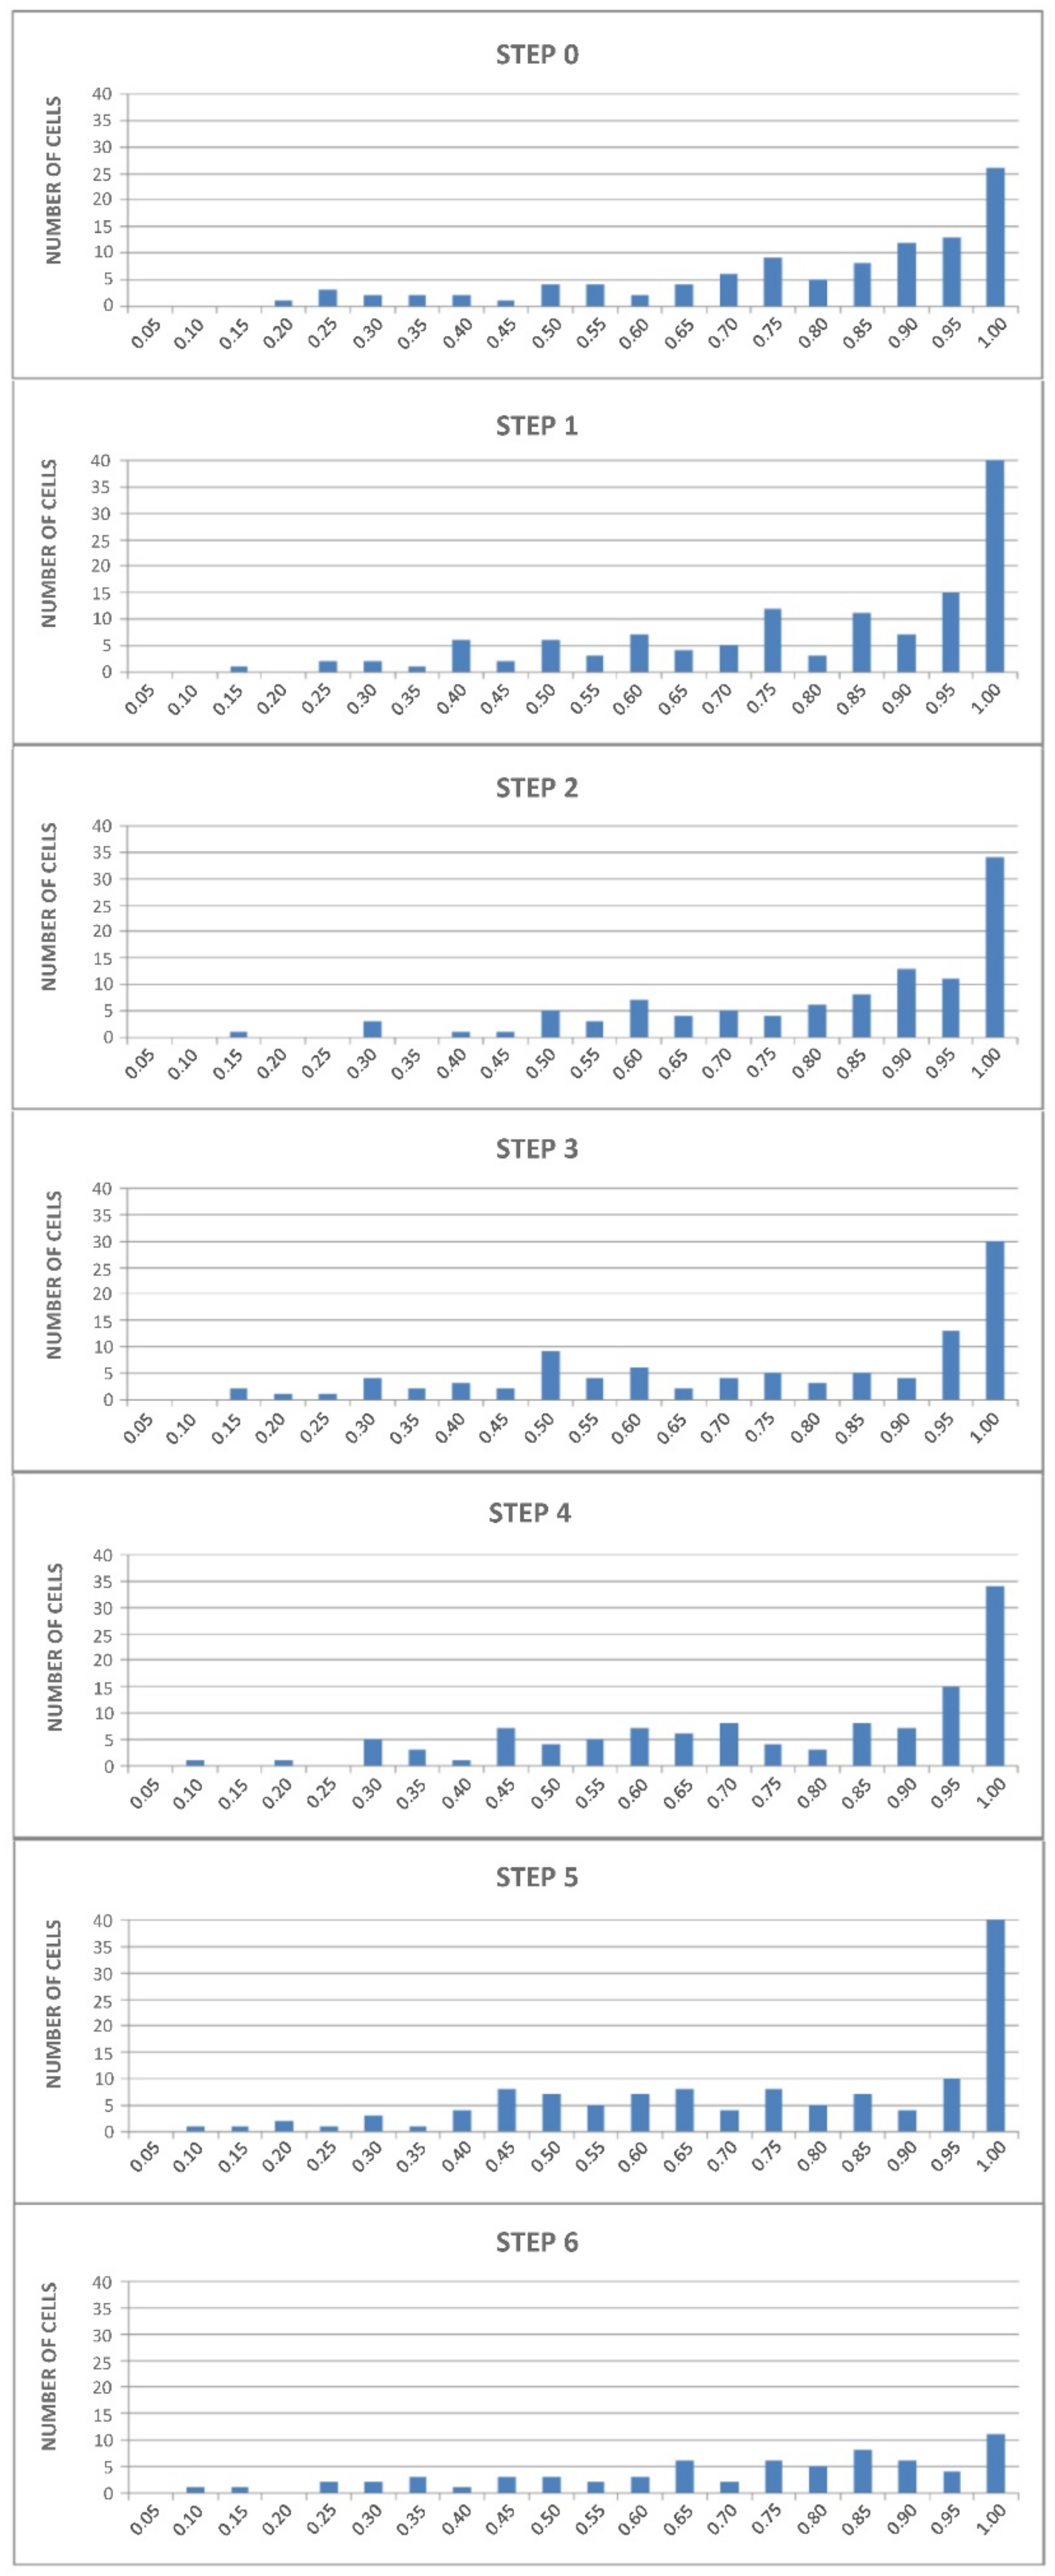
2.3. Tomographic Observations and Morphology Analysis

The starting cells morphology was observed by means of variable focus computed tomography (CT) for all the specimens, while the evolution during compression was investigated for the 0.4% TiH2 specimen only. It allows for building a virtual model of the specimen at the starting state (Step 0) and at each compression step with a high density of points (some millions), giving information on the internal volume that otherwise would be not accessible [44]. The specimen to be inspected is put in rotation within the radiation cone produced by an X-ray source. The distribution of the radiation intensity that crosses the specimen is measured by a flat panel detector and digitally acquired.
For the tomographic observations, a YXLON device-model Y-CT Vario (YXLON International GmbH, Hamburg, Germany) was used, working at an acceleration voltage adjustable up to a maximum of 225 kV, in the range microfocus-macrofocus by changing the spot size from 250 to 800 μm, in order to give priority to the spatial resolution (from 30 µm to 200 μm), or to the penetration capacity in materials with high absorption coefficient (up to 10 mm in the case of ferrous alloys), or to an object under examination with great size (up to diameter of 180 mm and height of 250 mm). In our specific case, the observations on the Al foam specimen were carried out at an acceleration voltage of 150 kV, with a spot size equal to 250 μm. The detector system was a flat panel with a resolution of 1920 × 1536 pixel.
The specimen was rotated at increments of 0.5°/s, until a full rotation of 360° was achieved, while it was scanned by a conical X-ray beam. The data set returned by the flat panel was processed through the VGStudio Max 2.0 (Volume Graphics GmbH, Heidelberg, Germany) software, in order to obtain a complete 3D reconstruction of the specimen.
Finally, 2D images of the specimen axial sections were considered for our work. Figure 2 shows representative cross and longitudinal sections, and CT rendering, for reference specimen (0.4% TiH2 foam) at Step 0 state: it can be observed non-homogeneous cells that are far from circular.
The 2D images of the longitudinal sections, taken at the various steps of deformation considered, were pre-processed to enhance the contours of the walls and porosity. Subsequently, a quantitative analysis of the areas A and perimeters P of the cells in section were performed by means of ImageJ 1.53c software (Wayne Rasband, National Institute of Health, Bethesda, MD, USA).
From these geometric parameters of the cells, it is possible to characterize the morphology of the cellular structure, expressed through the distribution of the values of the equivalent diameters deq and circularities C of the cells through the section. These parameters are expressed by:
d eq = 4 A / π
C = 4 π A / P 2
The morphological analysis of the 0.4% TiH2 foam was performed for the same section at the end of each compression step, to assess the evolution of morphological properties during the overall compression.

3. Theoretical Modeling

3.1. Morphology–Behavior Correlation Model Setting

To formulate a prediction of the compression behavior of the cellular structure based on the morphological characteristics, it is necessary to define a model for the correlation between the morphological characteristics (i.e., the distributions of the equivalent diameters and of the circularities of the cells), and the parameters that define the mechanical behavior in compression. As for cell foams, the latter are commonly identified in the following parameters of the stress–strain compression curve: elastic modulus, plastic plateau stress, and densification strain.
In Figure 3, the typical compressive stress–strain curve for foams is reported, with reference to elastic-plastic behavior such as that of metal foams [15]. Three different regimes can be identified:
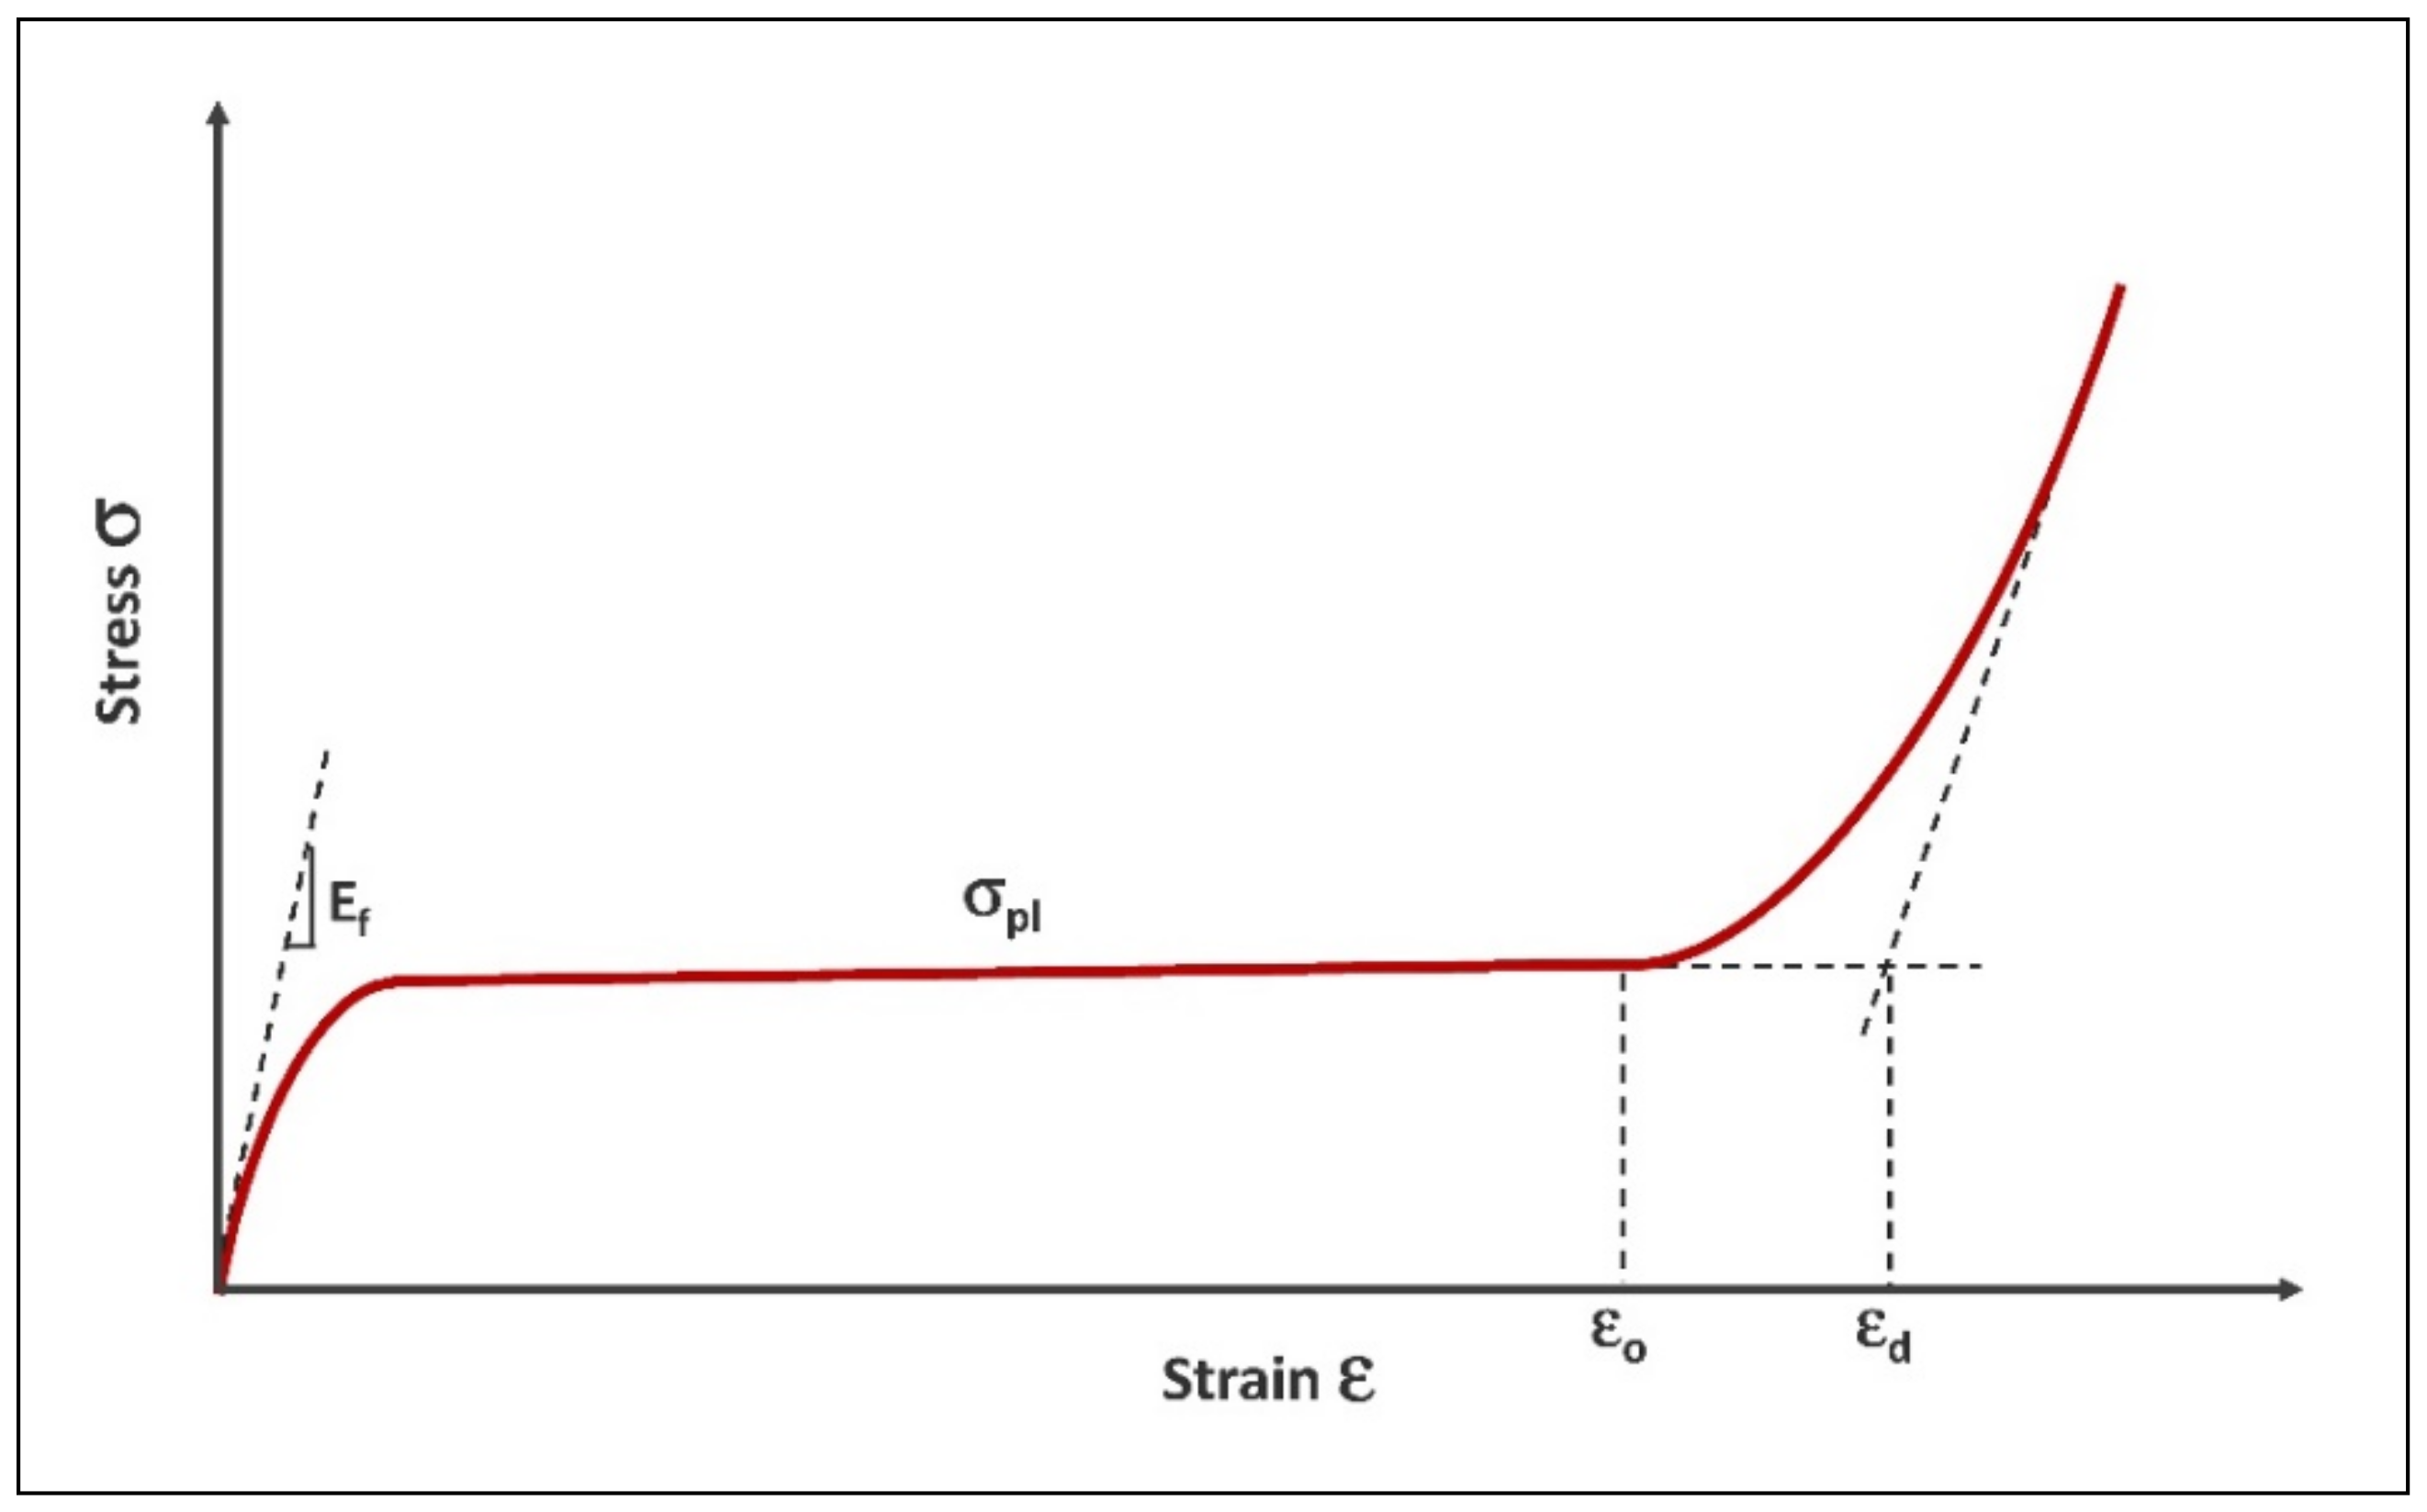
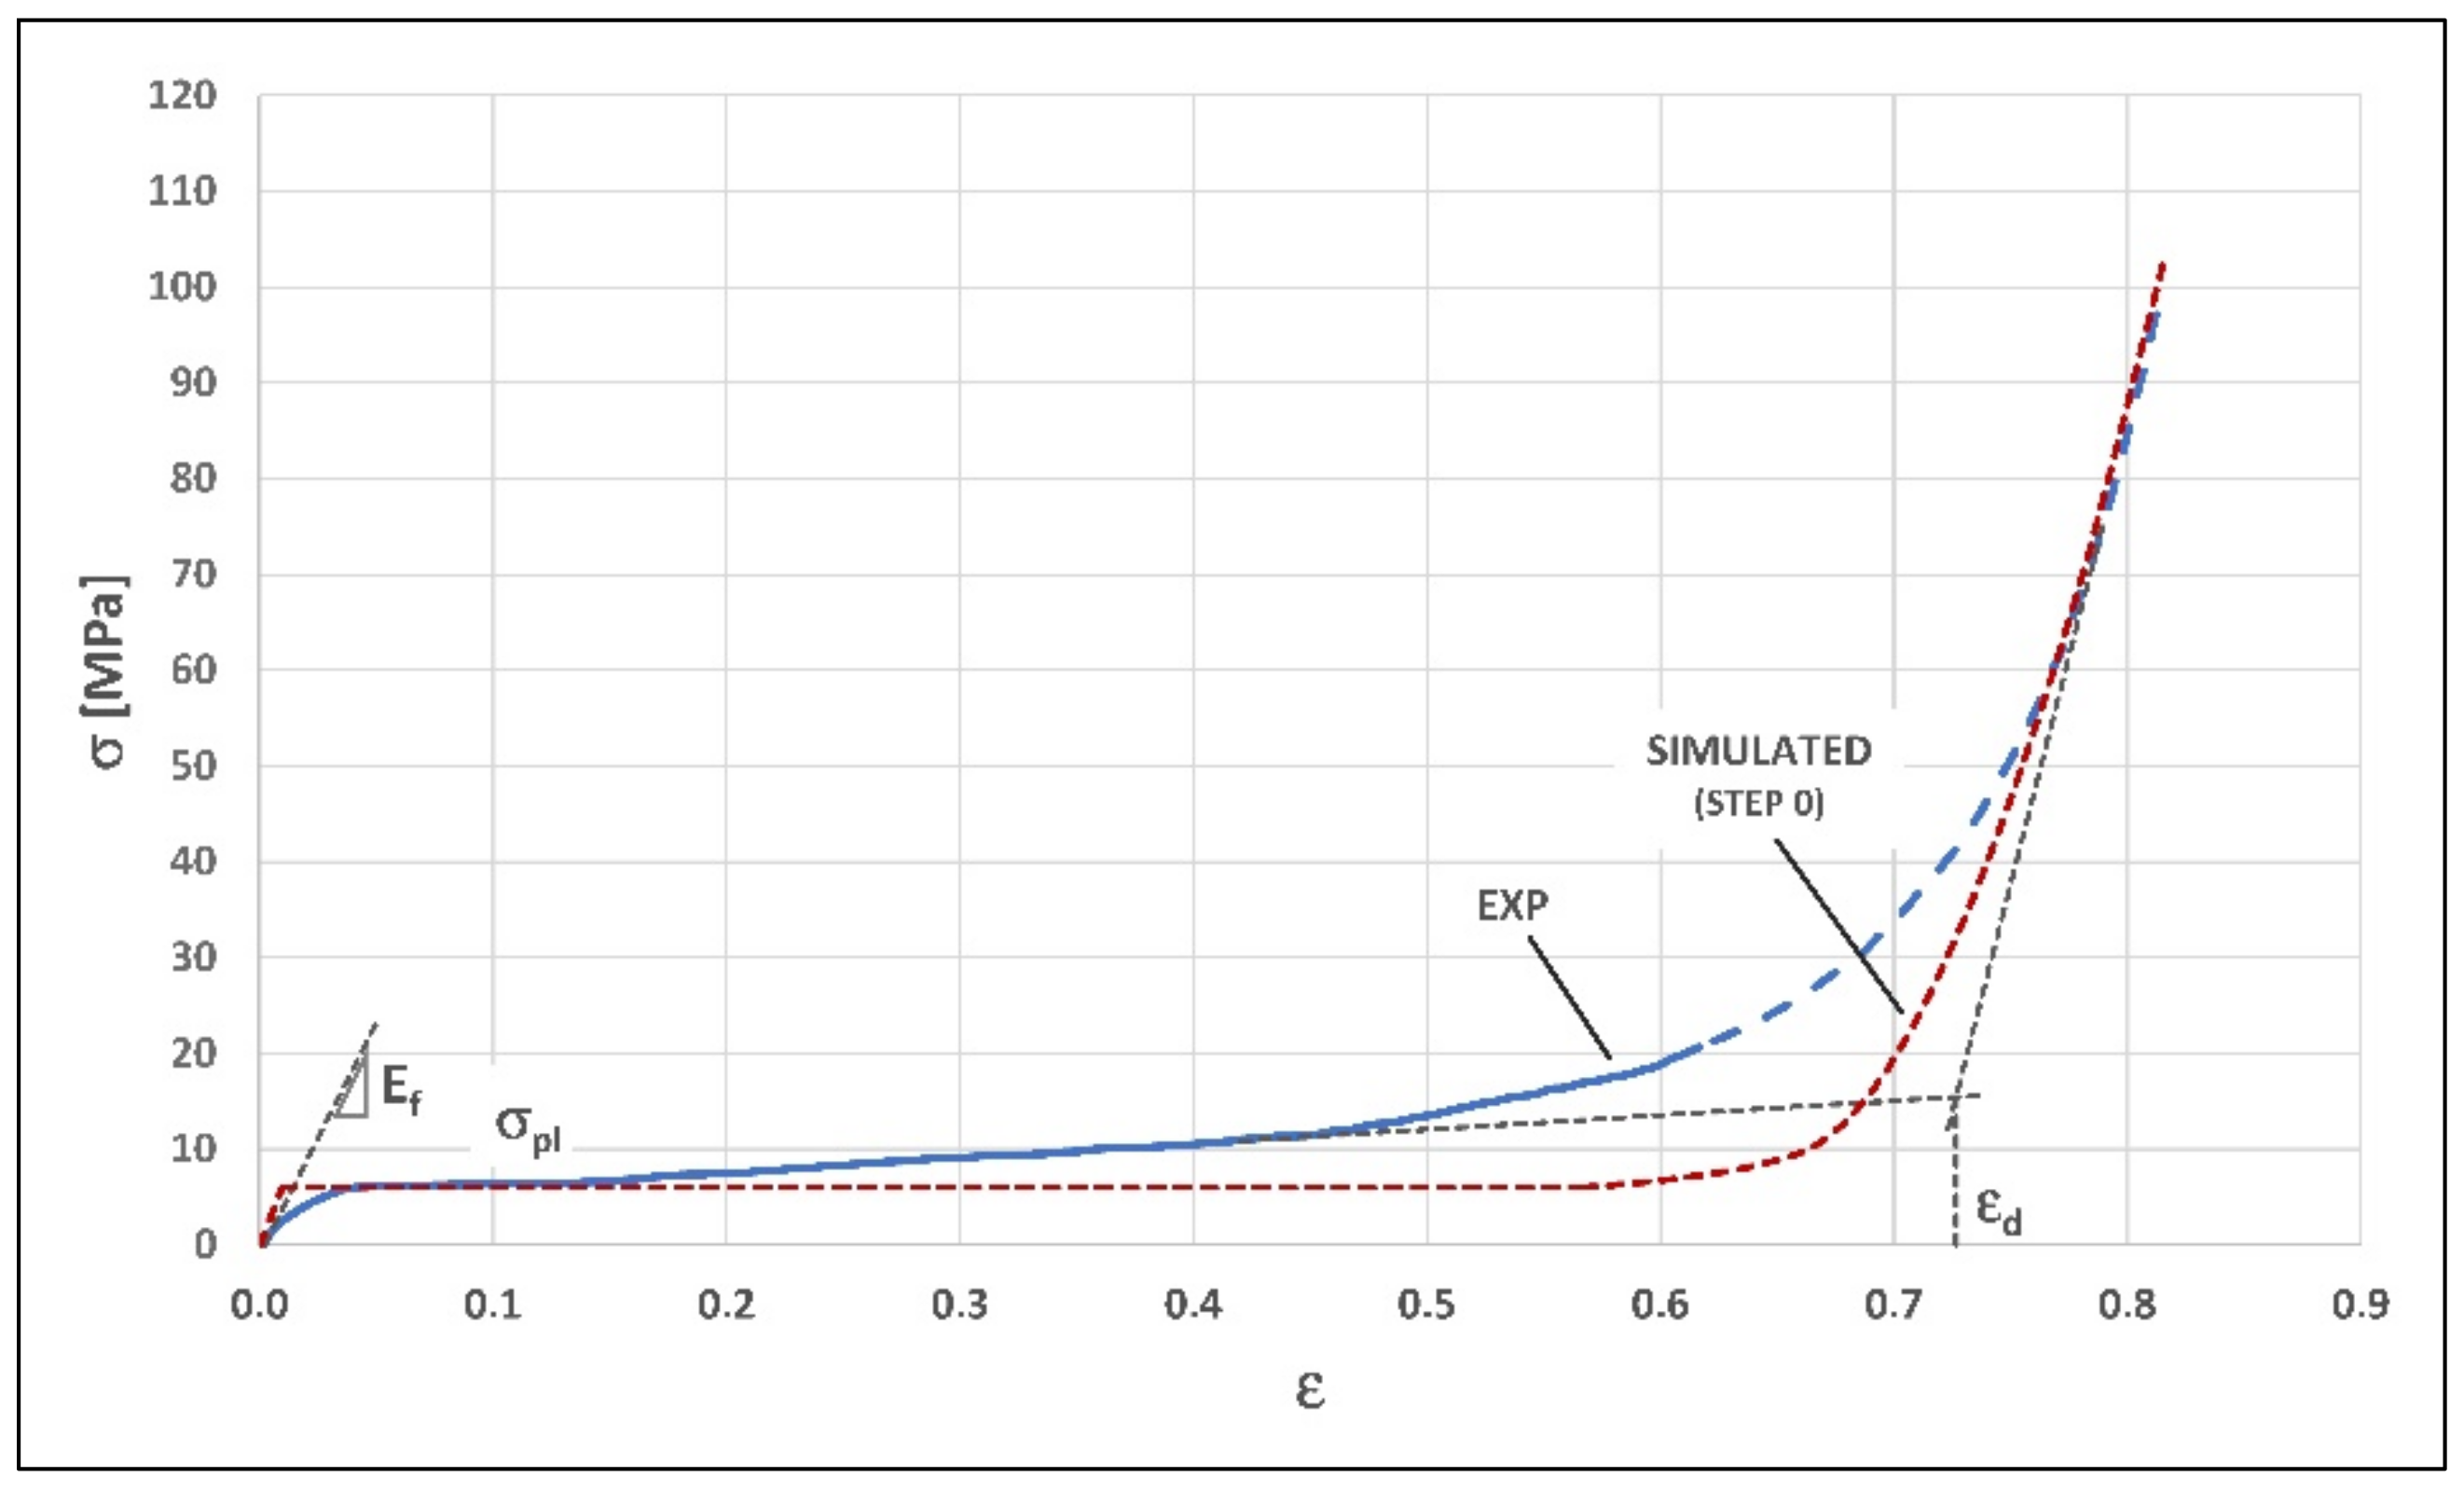
  • Linear elastic regime at low stresses, for which the value of Young’s modulus Ef can be defined as the initial slope of the curve.
  • Plastic collapse regime, associated with a long plateau at a stabilization stress value σpl, that is due to the combination between different collapse mechanisms at the cell walls (elastic buckling, plastic hinging, brittle crushing), depending on the nature of the material.
  • Densification regime, with an interruption of the plateau region due to structure crushing and compacting, and rapid rise in stress with further strain; this region is usually characterized by a deformation parameter (densification strain εd).
The same curve can be assumed as a reference for both open and closed-cell foams, although the latter show more complex behavior particularly in the plateau regime, where the σpl stress is less stable, and tends to rise with increasing strain. With regard to the densification parameter εd, its identification for metal foams is conditioned by the ductile elasto-plastic behavior during the walls’ collapse, because of which some amounts of pores may still exist in crushed structure [45], so a full densification strain is difficult to be defined. For a univocal identification it can be assumed as densification strain εd the intersection of the two tangents to the stress–strain curve for the plastic collapse regime and the densification regime [6]. Finally, although in actual closed-cell structures behavior there is no clear-cut transition between the regime of cell walls plastic deformation and the regime of structure compacting and densification, a further parameter can be introduced, that is the strain corresponding to the densification onset εo, starting from which it is possible to consider the development of the post-plateau compression behavior [15].
Among the models that have been developed to describe the mechanical behavior of cellular structures, the constitutive models are not suitable for correlating the morphological properties of the cellular structure and its mechanical behavior, since they represent the cellular structures as solid materials [14]. The representative models previously introduced in Section 1, instead, are based on abstractions of the cellular structure that simplify and order the geometric characteristics and are the most suitable to correlate the morphological properties and the mechanical behavior. They allow to estimate the relative density ρfs (being ρf the foam density, and ρs the density of the solid metal of which the foam is made) as a function of significant geometric properties that characterize the cellular structure of the foam. Subsequently, the parameters of the stress–strain curve can be calculated as a function of the relative density ρfs.

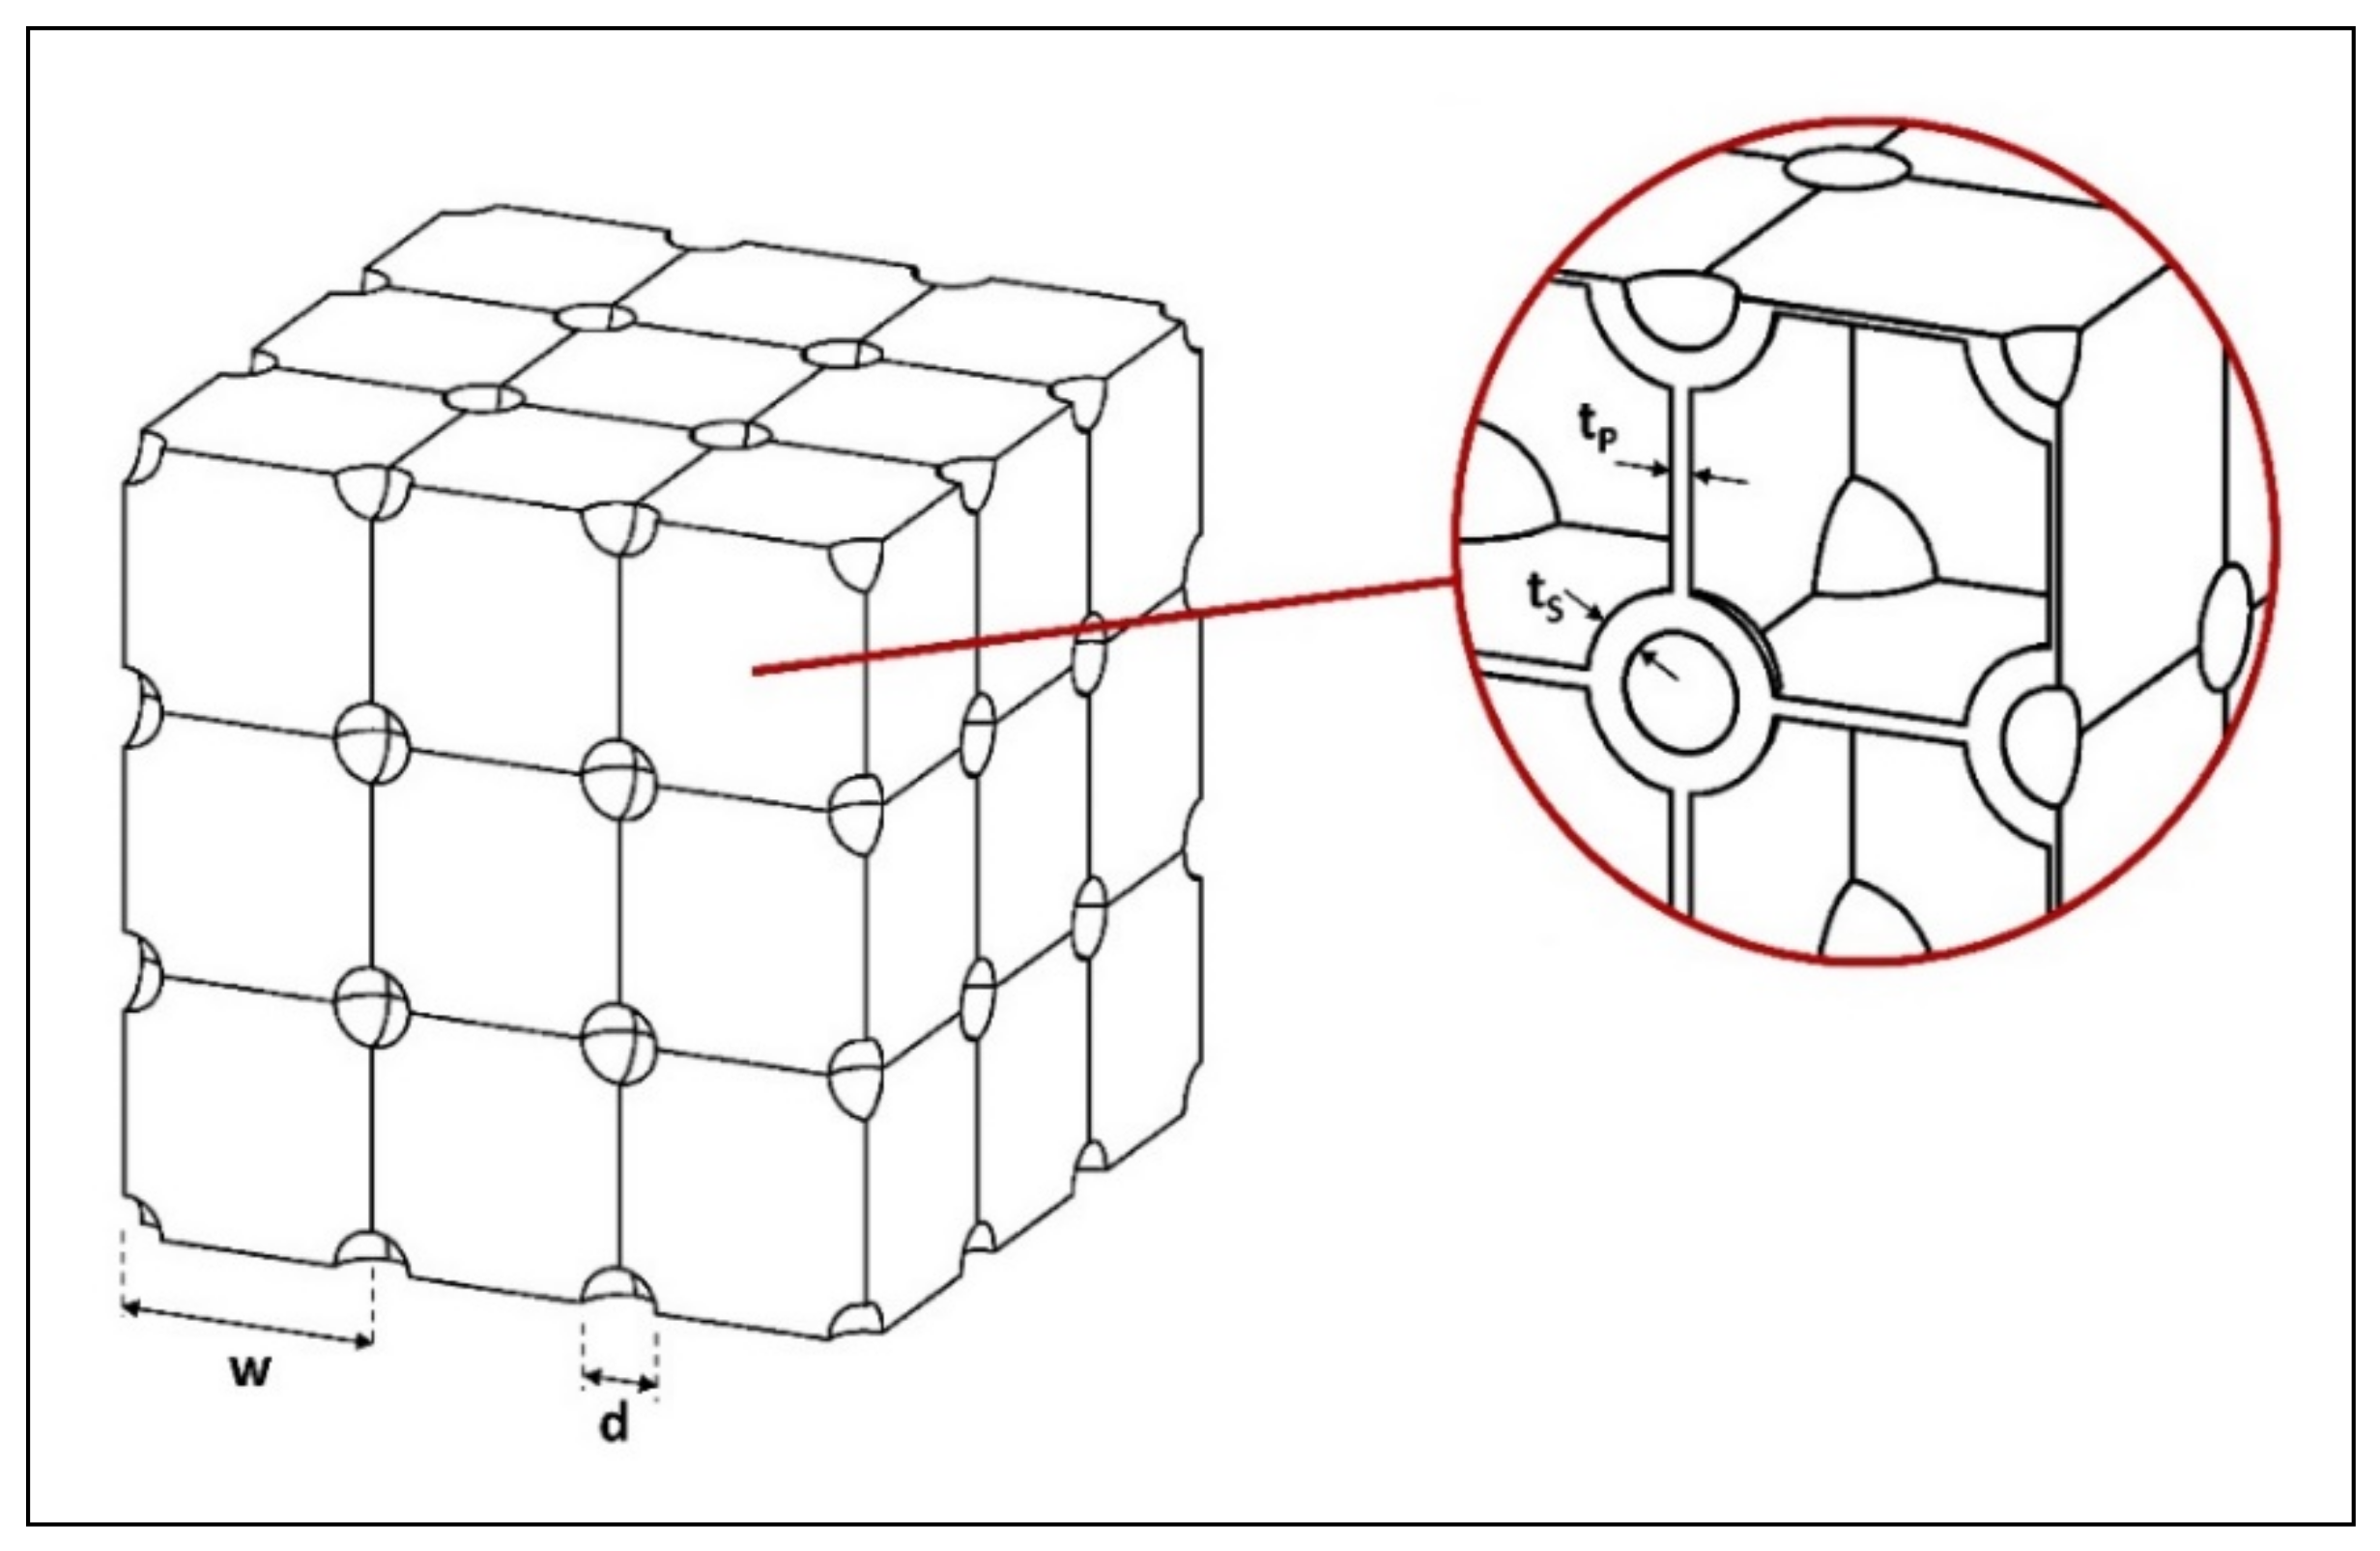
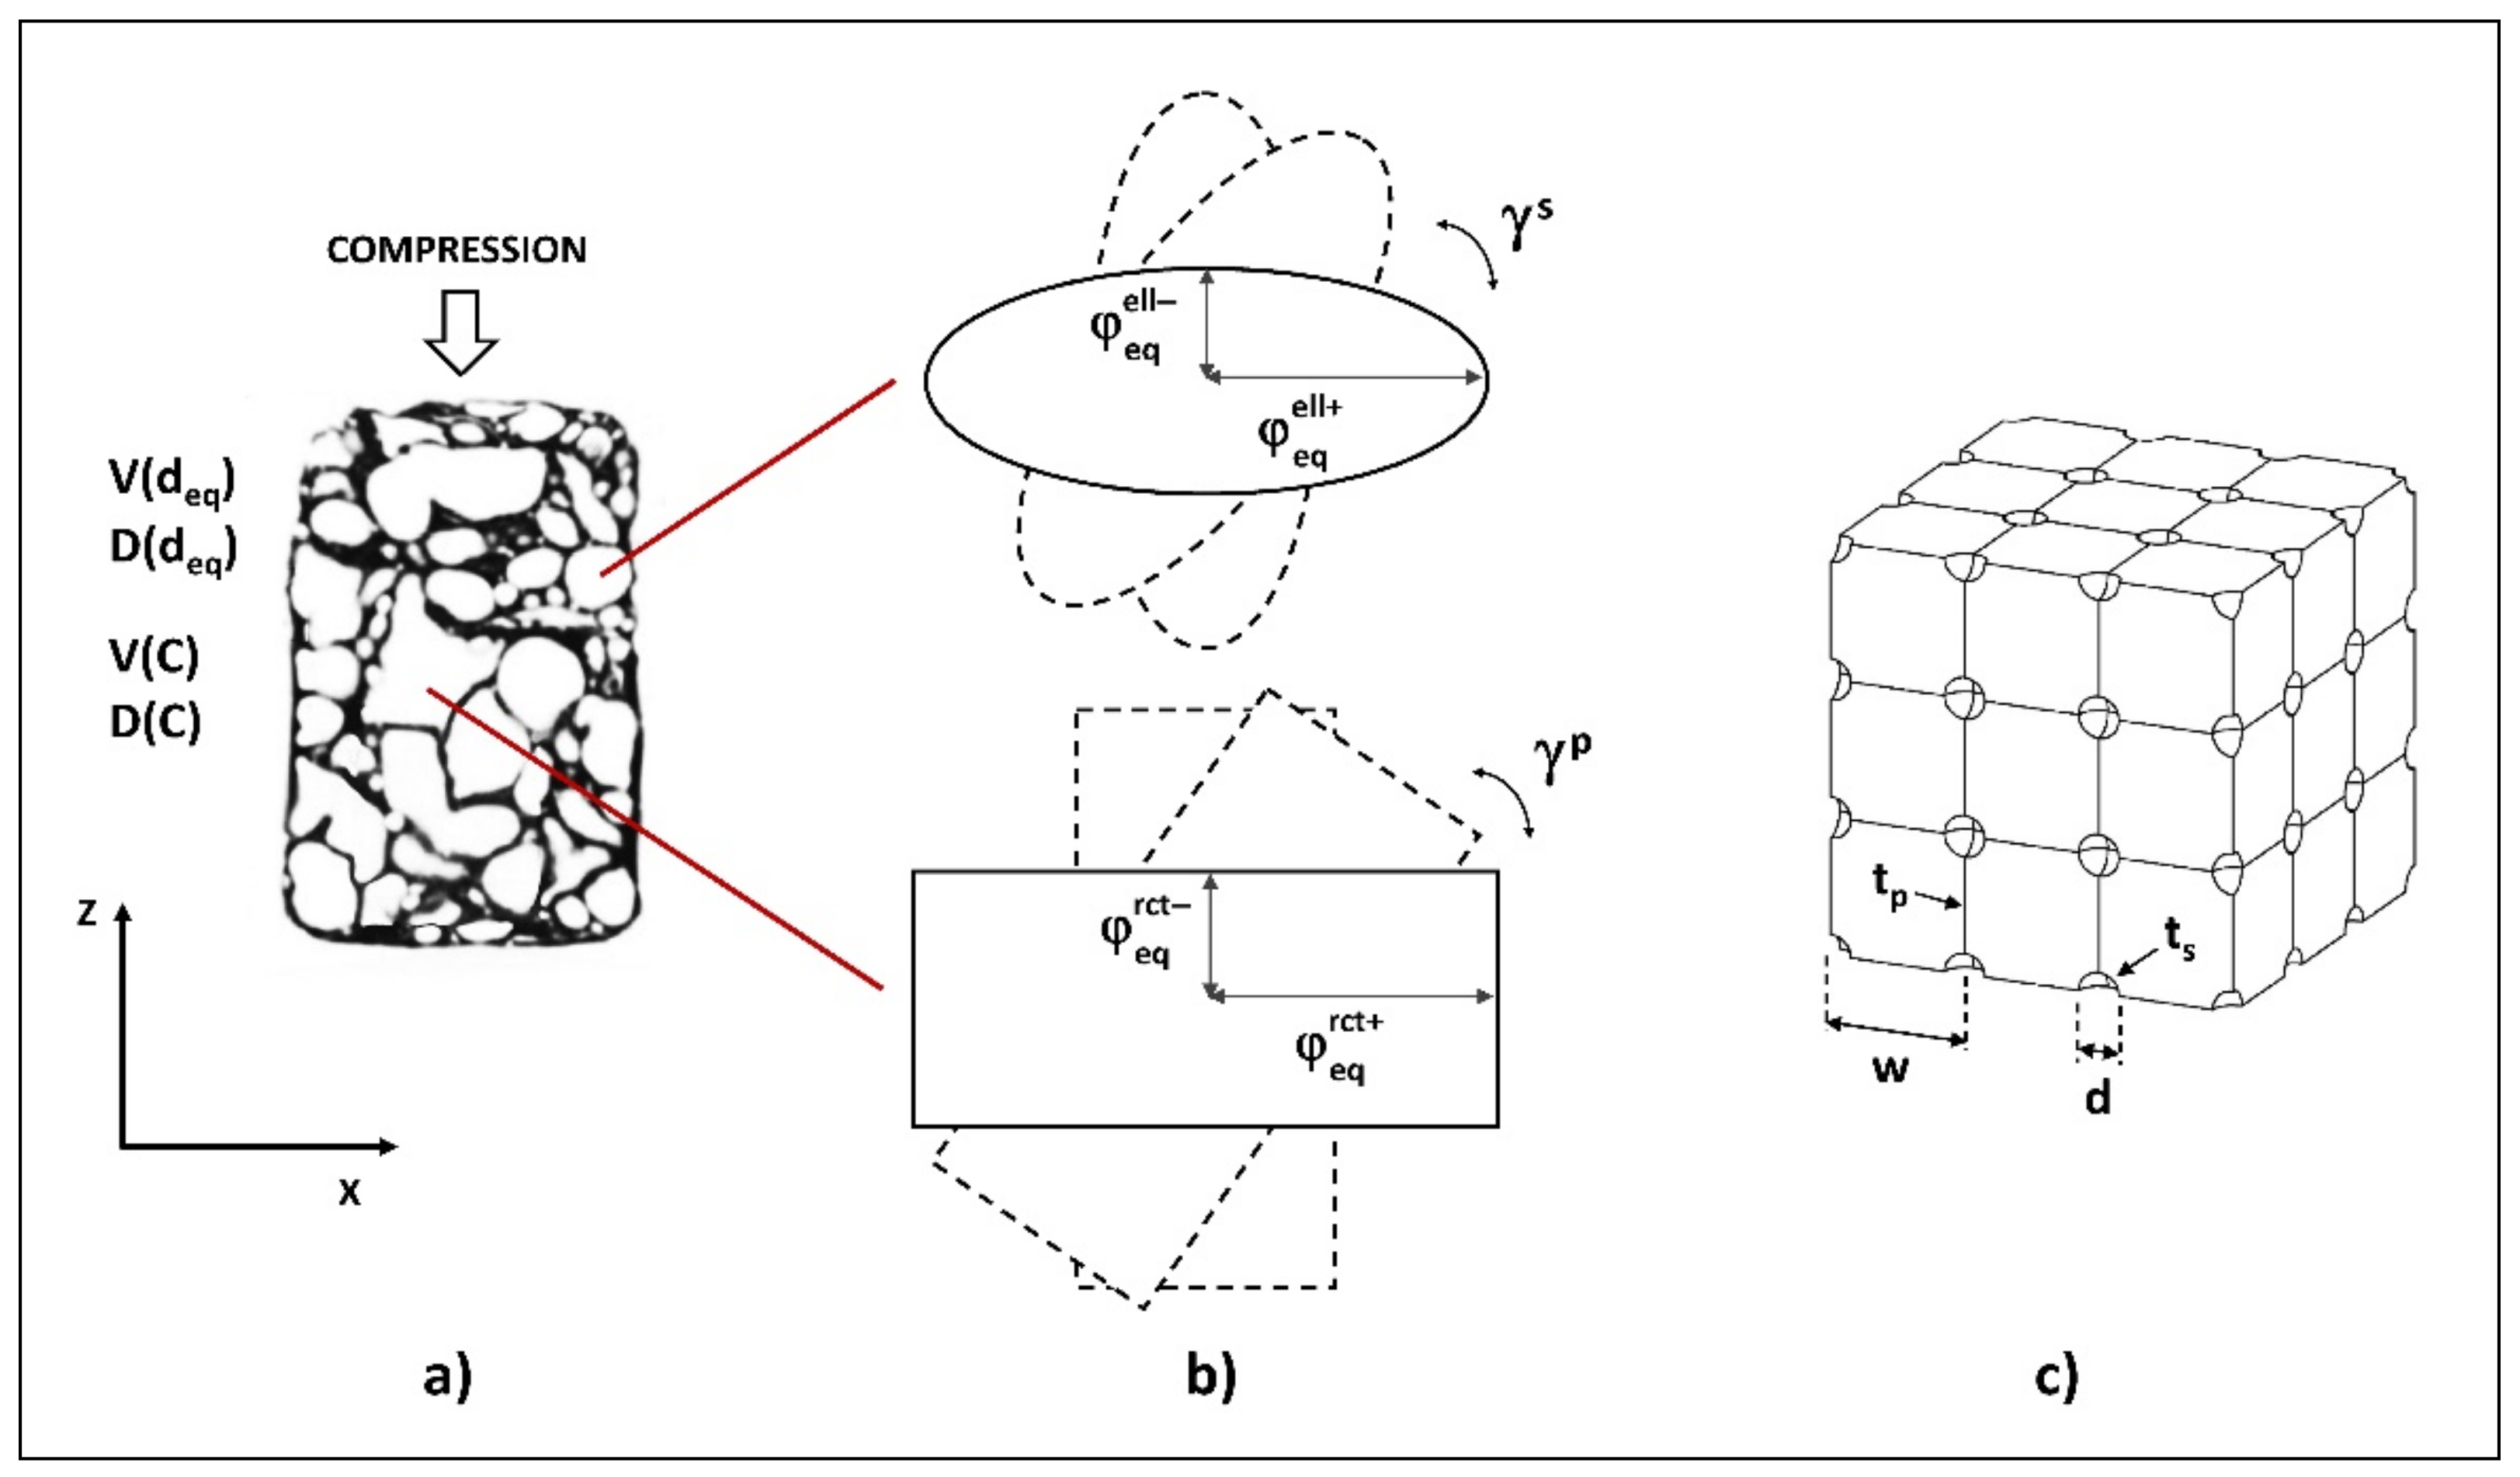
3.2. Cellular Structure Modeling

As highlighted in the introduction (Section 1), the representative models for closed-cell foams vary significantly according to the geometry of the polyhedra used. The skeleton cubic cell model [15] is particularly known because it allowed to define a set of equations frequently used for the estimation of the main compression behavior parameters (elastic modulus Ef, plastic plateau stress σpl, densification strain εd) as functions of the relative density ρfs. This geometric schematization of the cellular structure is not very representative of the real structure of some types of foams, such as the one in question. The truncated cube model [16], which is obtained by assembling symmetric cubic cells truncated at the vertices, so to build a packed structure of small and large cells, allows for defining analytical formulation to calculate the crushing strength, from which it is possible to derive the plateau stress σpl as a function of the plastic flow stress σo.
To obtaining a more realistic geometric representation, the cruciform-hemisphere model [17] improves the truncated cube model by replacing the pyramidal sections at the vertex of the truncated cubes with hemispherical sections.
Starting from the latter model, Hasan’s weaker-cruciform-stronger-hemisphere model [19] proposes a further improvement in the accuracy of the geometric representation of the closed-cell structure. This improvement is based on the observation of the material distribution in the cellular structures, which tends to accumulate near the junctions of cells, so that the junction regions of larger cells (where the smaller cells are located) are more massive than the larger cell walls. As a consequence, the walls of the smaller cells tend to be thicker than those of the larger cells. Introducing the thickness differentiation between the hemispherical (smaller) and cruciform (larger) sections in the cruciform-hemisphere model, the model in Figure 4 can be obtained, and assumed as reference model for the closed-cell Al alloy foam in the present study.
As is evident from the representation in the figure, this type of model is based on some simplifying assumptions:
  • The cells can be divided into two size classes (large and small cells).
  • The smaller cells have high circularity and are characterized by spheroidal shapes; the larger cells tend to lose circularity and are characterized by prismatic shape.
  • The wall thicknesses of the smaller cells are greater than the larger ones.
Introducing this model, the relative density ρfs can be calculated as a function of the diameter d and the wall thickness ts of the hemispherical section of the smaller spheroidal cells, and the width w and the wall thickness tp of the cruciform section of the larger prismatic cells [19]:
ρ f ρ s = 3   1 π 4 d w 2   t p w + π 6   6   d w 2 + 12   d w   t s w + 8   t s w 2   t s w
Ordered and uniform models such as that in Figure 4, commonly used in numerical simulation by finite elements, assume that the real cellular structure, typically not homogeneous at the local level, can be represented by a global virtual model consisting of cells ordered in space, having homogeneous geometric properties. Under this assumption, the geometric parameters w, d, ts, tp in Equation (3) become global parameters, which must be derived from the distributions of the local morphological parameters deq and C, expressed for each cell by the Equations (1) and (2), respectively.
The translation of the local morphological parameters into global parameters of the virtual reference model is obtained through the following three-stages procedure.

3.2.1. Stage 1

It is assumed that the results of the morphological analysis on a section of the cellular structure (e.g., section XZ in Figure 5a) are the distributions of the equivalent diameter deq and the circularity C throughout the cells in section. The distribution of deq can be expressed by the vector V(deq) of the ranges of the deq values defined for the frequency analysis, sorted by increasing values, and the vector of frequency distribution D(deq) per range of values:
V   d eq = d eq   1 d eq   2 d eq   i d eq   n D   d eq = N deq   1 N deq   2 N deq   i N deq   n
where deq i is at the same time the maximum value that limit the i-th range, and the minimum value that limit the subsequent (i + 1)-th range, Ndeq i is the number of cells with deq within the i-th range, and n is the number of ranges identified for the frequency analysis.
If dtseq is the threshold value to differentiate the values of deq to be attributed to the smaller spheroidal cells and the larger prismatic cells in the model of Figure 4, the following average values of deq can be attributed to the two classes of cells:
d eq s = i = 1 m d eq   i   N deq   i i = 1 m N deq   i           d eq p = i = m + 1 n d eq   i   N deq   i i = m + 1 n N deq   i
where dseq is the average value of deq for the spheroidal cells, dpeq is the average value of deq for the prismatic cells, and m is the number of ranges sorted by increasing values up to the range that includes the threshold value dtseq; the latter must be understood as a partition coefficient between the two size classes of cells and can be identified by prefixing the ratio dpeq/dseq on the basis of experimental observation.
The second result of the morphological analysis, that is the distribution of circularity C throughout the cells in section, can be processed analogously. As in Equations (4) and (5), it can be expressed by the vector V(C) of the maximum values that limit each range of C values defined for the frequency analysis, sorted by increasing values, and the vector of frequency distribution D(C) per range of values:
V   C = C 1 C 2 C i C n D   C = N C   1 N C   2 N C   i N C   n
By setting the threshold value Cts as partition coefficient of C values between the prismatic and the spheroidal cells, it is possible to obtain the average values of the circularity for the spheroidal cells (Cs) and the prismatic cells (Cp) by means of expressions similar to (5):
C p = i = 1 m C i   N C   i i = 1 m N C   i           C s = i = m + 1 n C i   N C   i i = m + 1 n N C   i
In this case the threshold value for the partition between the two size classes of cells can be fixed as Cts = 0.785, that is the maximum value of circularity for prismatic cells (when the section is square). Therefore, the circularities Ci will be assigned to prismatic or spheroidal cells, depending on whether Ci < Cts or Ci > Cts respectively. As a consequence, in Equation (7), the expressions for Cp and Cs are inverted, if compared to the expressions of dpeq and dseq in Equation (5); m remains the number of ranges sorted by increasing values up to the range that includes the threshold value.

3.2.2. Stage 2

The couples of average values (dpeq,Cp) and (dseq,Cs), for the prismatic and spheroidal cells respectively, obtained by the distributions of the local morphological parameters of the real cellular structure, are used to define the geometric parameters of an intermediate virtual model, where the sections of large and small cells are not yet circular and square such as in the final reference model of Figure 4, but instead they are elliptical and rectangular respectively (Figure 5b). By means of this intermediate model it is possible to partly take into account the asymmetry of the cells, and their orientation with respect to the z axis of the analyzed section, that is parallel to the direction of compression.
For this purpose, in a similar way to how the equivalent diameter of the section of a cell is defined as a function of its area according to Equation (1), the equivalent semi-axes φrcteq and φelleq are defined for cells with rectangular section and elliptical section respectively:
φ eq rct = A / 4   k rct           φ eq ell = A / π   k ell
where krtc and kell are the ratios between the two semi-axes of the rectangular and elliptical section respectively.
Combining Equation (8) with Equation (1) it is possible to express φrcteq and φelleq as functions of the equivalent diameter deq.
φ eq rct = π / 16   k rct d eq           φ eq ell = 1 / 4   k ell d eq
Introducing in Equation (2) the ratios between the two semi-axes of the rectangular and elliptical section krtc and kell, the corresponding expressions of circularity C can be obtained:
C = π   k rct / k rct + 1 2           C = 2   k ell / k ell 2 + 1
For each of the Equation (10) it is possible to obtain a pair of solutions:
k rct = 2 C + π ± π π 4 C 2 C           k ell = 1 ± π 1 C 2 C
Imposing C = Cp in the first Equation (11), and C = Cs in the second one, being Cp and Cs calculated by Equation (7), the two pairs of solutions (krct+, krct−) and (kell+, kell−) can be obtained. They express krct and kell respectively, according to whether they represent the ratio between the major and minor semi-axes, or vice versa.
Substituting in Equation (9) the values obtained by Equation (11) for (krct+, krct−) and (kell+, kell−), and the values of dpeq and dseq calculated by the analysis of the distributions with the Equation (5), it is possible to obtain the corresponding values of major and minor equivalent semi-axes (φrct+eq, φrct−eq) and (φell+eq, φell−eq) for both rectangular section cells and elliptical section cells (Figure 5b).

3.2.3. Stage 3

The intermediate virtual model with rectangular section large cells and elliptical section small cells characterized by equivalent semi-axes (φrct+eq, φrct−eq) and (φell+eq, φell−eq) can be now translated in the reference model (Figure 5c), where square section cells and circular section cells are characterized by the global parameters width w and diameter d calculate as:
w = 2   γ p   φ eq rct
d = 2   γ s   φ eq ell
being φrct*eq and φell*eq the average values of (φrct+eq, φrct−eq) and (φell+eq, φell−eq), respectively.
Coefficients γp and γs can assume values in the ranges [φrct−eqrct*eq, φrct+eqrct*eq] and [φell−eqell*eq, φell+eqell*eq]. By this way, as the coefficients γp and γs vary, it is as if the inclination of the rectangular and elliptical section cells varies, placing itself between the orthogonal and parallel positions with respect to the z axis of the section, that is the loading direction (Figure 5b). As a consequence, the global parameters w and d expressed by Equations (12) and (13), are calculated as the projection of the whole axes of the cell section, on the x direction orthogonal to the loading direction.
Finally, assuming that lx is the width of the section of the cellular structure in the x direction, the average values of the thickness of prismatic and spherical cells tp and ts can be estimated:
t p = l x n x w n x + 1
t s = λ   t p
where nx = int(lx/w) is the number of prismatic cells constituting the virtual structure in the x direction, and λ = ts/tp is the ration between the thickness of spherical and prismatic cells (λ >1 according to the premises on the reference model).
Once the coefficients γp, γs, λ have been fixed by fitting on experimental data (as will be shown in detail below), it is possible to define all the global parameters of the reference model w, d, tp, ts, and to calculate the value of the relative density ρfs by means of the Equation (3).

3.3. Simulation of Compression Behavior

By using representative models, the parameters of the stress–strain curve (Figure 3) can be correlated to the relative density of the foam ρfs and calculated, and so the compression behavior can be simulated. The scaling relations by Ashby et al. [9], derived for Al alloy closed-cell foam by previous generalized formulation based on the skeleton cubic cell model [15], can be used to calculate the Young’s modulus Ef, plateau stress σpl, and densification strain εd:
E f = c 1   0 . 5   ρ f ρ s 2 + 0 . 3   ρ f ρ s   E s
σ pl = c 2   0 . 5   ρ f ρ s 3 / 2 + 0 . 3   ρ f ρ s   σ c
ε d = c 3   1 1 . 4   ρ f ρ s + 0 . 4   ρ f ρ s 3  
where c1, c2, and c3 are coefficients to be fitted experimentally (0.1≤ c1 ≤1.0, 0.1≤ c2 ≤1.0, 0.9≤ c3 ≤1.0), Es and σc are the Young modulus and the compressive strength of the solid metal of which the foam is made.
For Al foams characterized by low density (ρfs <0.2) the expressions of Ef and σpl proposed by Simone and Gibson and based on a tetrakaidecahedral cell model [46,47] could be preferred:
E f = 0 . 32   ρ f ρ s 2 + 0 . 32   ρ f ρ s   E s
σ pl = 0 . 33   ρ f ρ s 2 + 0 . 44   ρ f ρ s   σ c
Focusing on the type of geometrical model used, the formulation for σpl by Santosa and Weirzbicki [16] based on the truncated cube model, and expressed as a function of the plastic flow stress σo, results to be more reliable, because of the similarity between this model and the cruciform-hemisphere type model by Hasan [19] assumed here as a reference model:
σ pl = 0 . 63   ρ f ρ s 3 / 2 + 0 . 07   ρ f ρ s + 0 . 8   ρ f ρ s 2   σ y σ u 1 + ν 1 / 2
where the term inside the second square bracket is the plastic flow stress σo, expressed as a function of the yield strength σy, the ultimate strength σu, and the strain hardening exponent ν of the cell wall material.
Finally, the densification onset strain εo can be estimated considering that the stress–strain curve does not start to rise until the foam is compacted to a relative density of about 0.5 [15]:
ε o = 1 1 0 . 5   ρ f ρ s
Starting from ε = εo it is possible to simulate the post-plateau compression curve by means of the following equation [15]:
σ ε = 1 ξ ε d ε d ε ψ
where ξ and ψ are coefficients to be fitted on experimental curves.
For all formulations, increasing ρfs increases the elastic modulus Ef and the plateau stress σpl, and reduces both the strain parameters of densification εd and εo.
In this regard, it should be pointed out that the equations for calculating the relative density ρfs as a function of the geometric properties of the representative models, such as Equation (3), assume that the density of the walls is equal to that of the solid material. A reduction in its compactness, for example, caused by microporosity, would entail a reduction in the relative density of the cellular structure, with the direct consequences on the values of the compression parameters highlighted above (in this case, the decrease in Ef and σpl, and the increase in εd and εo). To extend the use of Equation (3) by taking this aspect into account, it is possible to introduce experimentally-defined coefficients for the thicknesses tp and ts, which express the reduction of density in the cell walls.

3.4. Fitting of the Correlation Model

To use the proposed morphology–behavior correlation model, the following coefficients must be defined by experimental fitting:
  • γp and γs in Equations (12) and (13) (coefficients simulating the inclination of elliptical and rectangular sections of cells in the intermediate virtual model of cellular structure).
  • λ in Equation (15) (ratio between the thickness of spherical and prismatic cells).
  • c1, c2, c3 in Equations (16)–(18) (coefficients of stress–strain curve parameters).
  • ξ and ψ in Equation (23) (coefficients of post-plateau compression curve).
To set these coefficients, the theoretical values of compression behavior parameters Ef, σpl, εd, calculated by applying the model on morphological properties and using the equations reported in the previous Section 3.3, must be fitted on the corresponding values identified on the experimental compression curves.

4. Application and Discussion of Results

4.1. Compression Test and Morphology Analysis

Starting from the 0.4% TiH2 specimen in the initial conditions (Step 0), deformation steps were performed at 10% increasing steps of deformation, from Step 1 to Step 6. The geometric data characterizing the steps are reported in Table 1. Figure 6 summarizes the main results of the whole deformation process, including the loading-unloading curves (expressed in N) corresponding to the six steps, and reporting the final states of compression corresponding to each step, reconstructed by CT to perform the morphological analysis of the cellular structure.
The sequence of the loading curves resulting from each compression step were assembled obtaining the continuous stress–strain curve (expressed in MPa in the same Figure 6). The overall deformation ε reached at the end of each step was calculated as the ratio between the shortening ∆l (mm) and the initial height of the specimen at Step 0. A final step of ultimate compression up to an advanced collapse condition was performed to plot the trend of the curve after densification onset. In this case the morphological analysis corresponding to the final state loses significance due to the high degree of collapse of the cellular structure.
As in the schematic curve of Figure 3, the experimental compression curve in Figure 6 is characterized by an initial region of elastic behavior followed by a substantially stable plateau along which most of the plastic deformation is concentrated. This plateau extends up to an overall deformation of 40% (about the end of Step 4), beyond which the load begins to grow quickly together with the collapse of the cells in the whole sample.
The morphological analysis of the cellular structure was performed on the two longitudinal sections, arranged orthogonally with respect to each other and containing the rotation z axis of the specimen, that is the loading axis, reported in Figure 2.
A preliminary qualitative observation of these sections (corresponding to Step 0 state) allows to verify the morphological preconditions that support the choice of the reference model in Figure 4 for the geometry of the cellular structure:
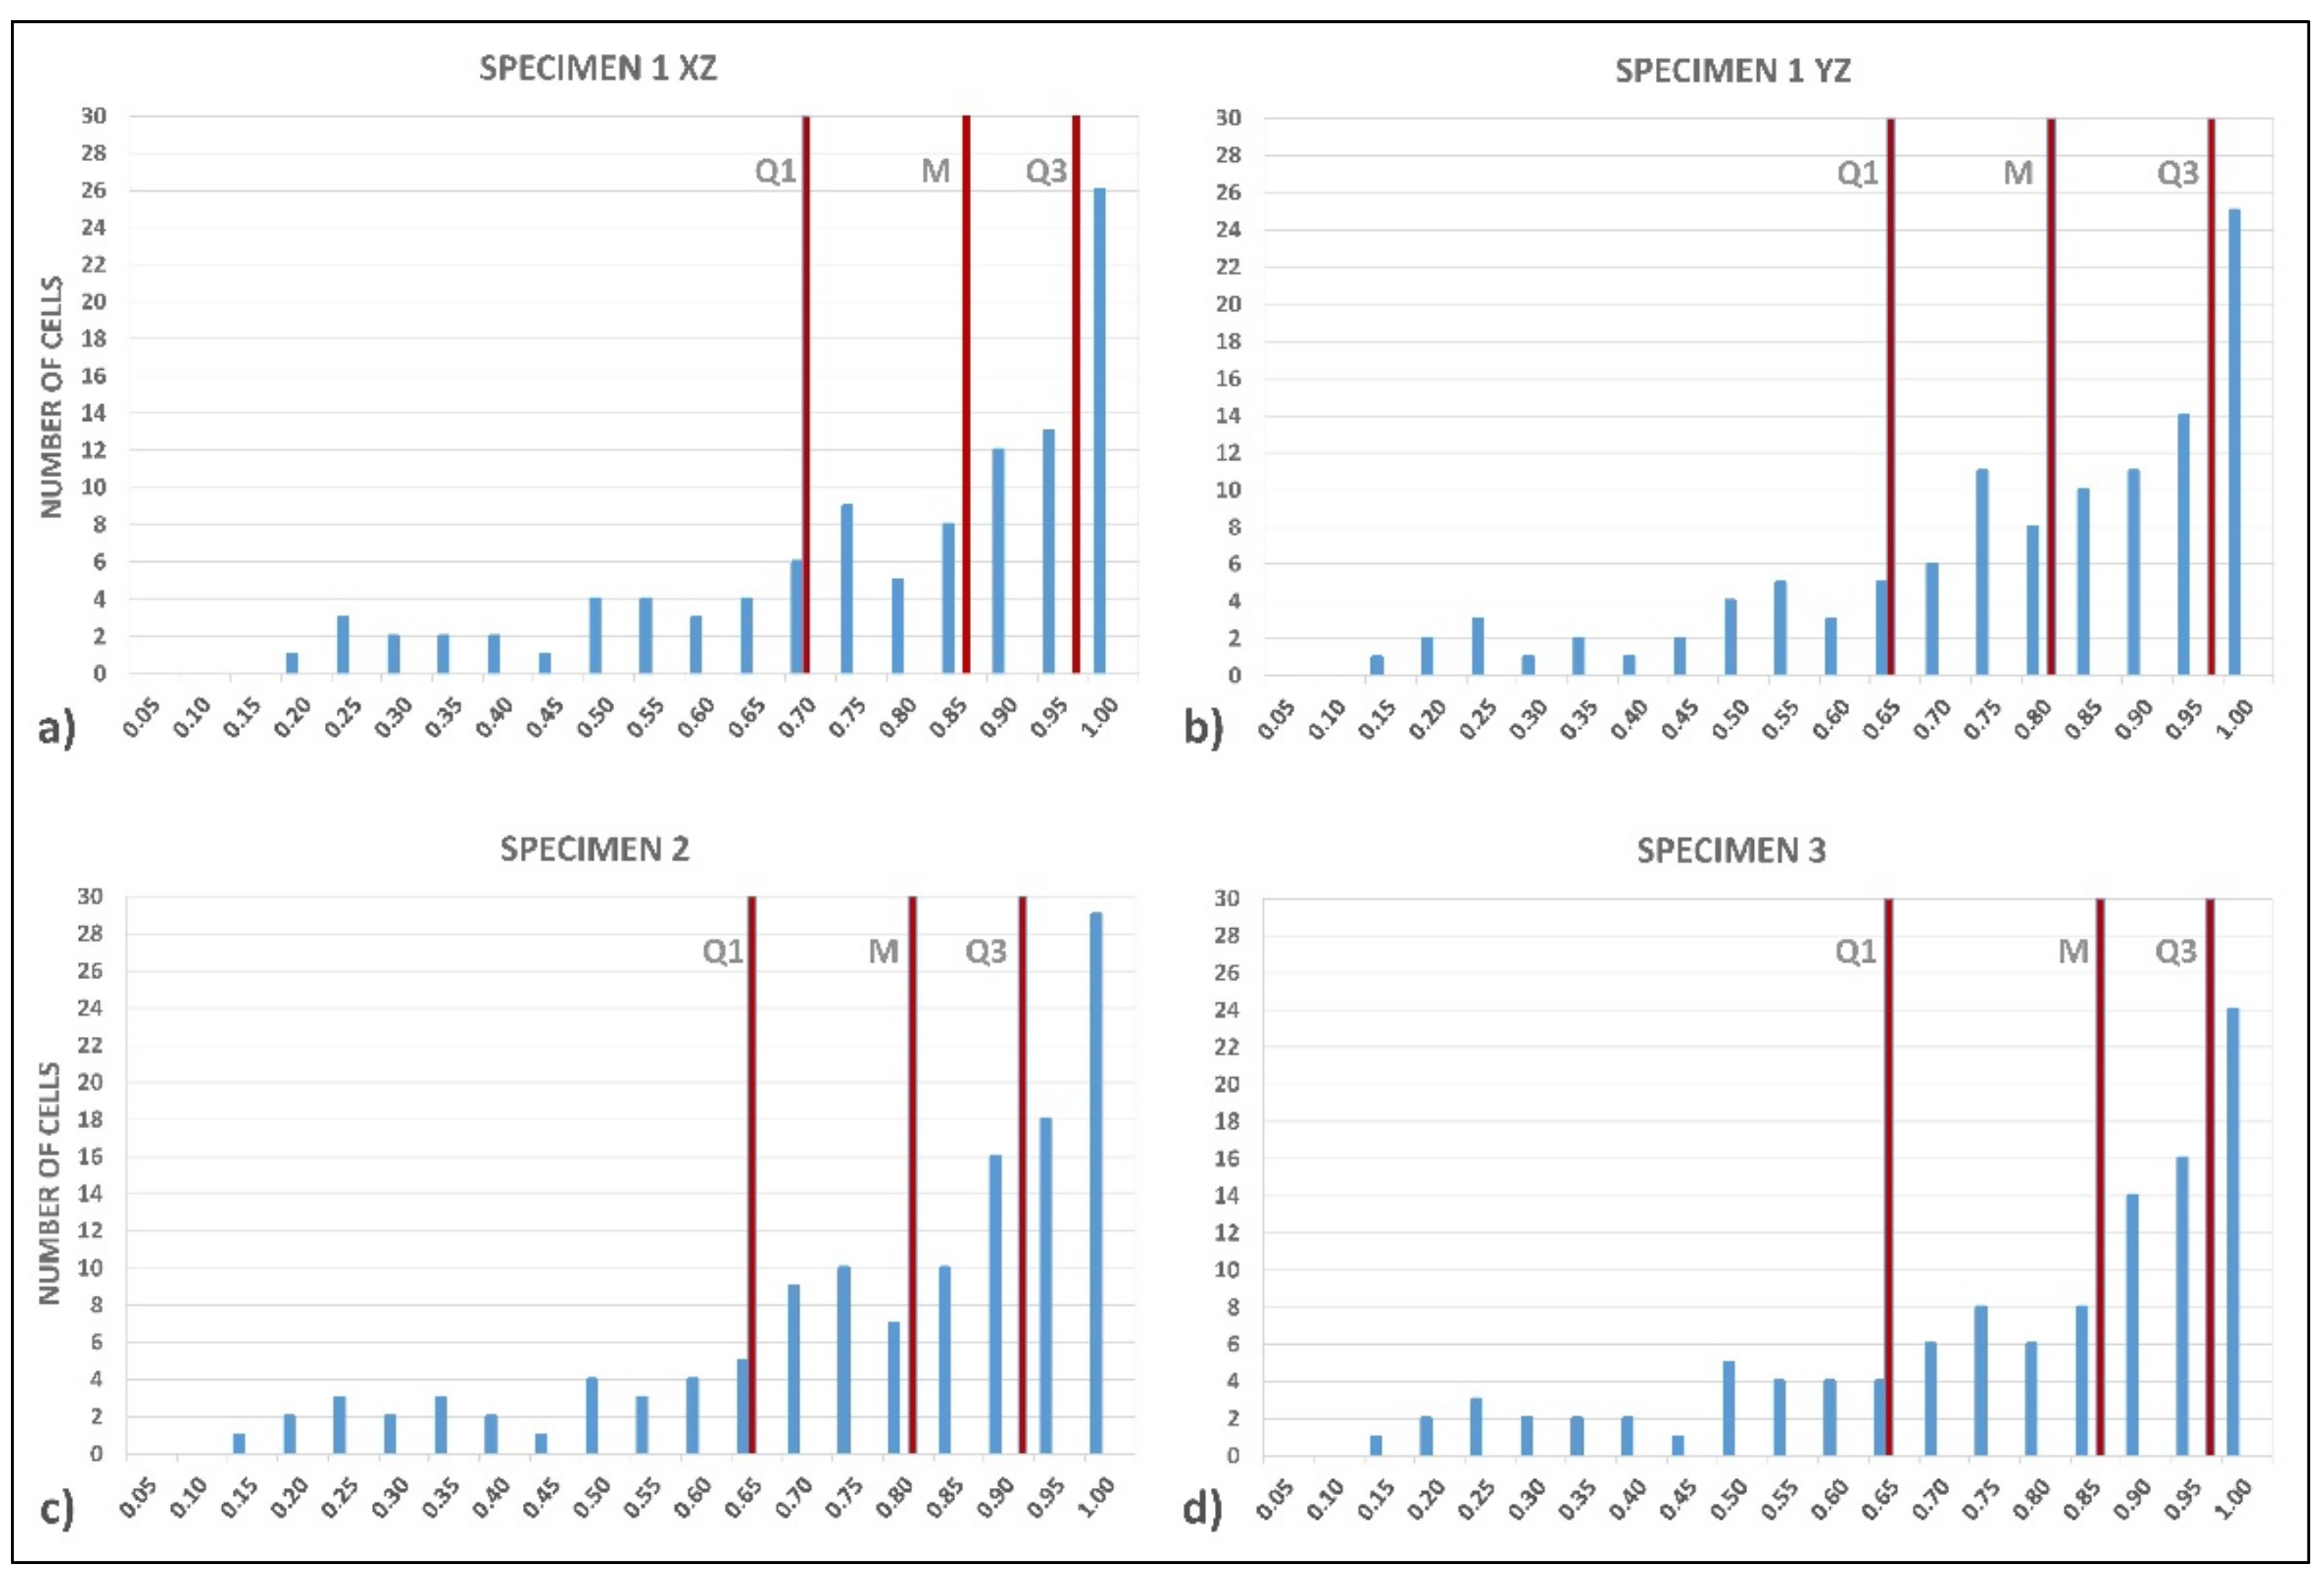
  • The sections present cells diversified according to different size classes, which can be reduced to small and large cells.
  • The former have greater circularity and tend to spheroidal shape, whereas the latter lose circularity, and tend to a prismatic shape.
  • The wall thicknesses of the smaller cells are generally greater than the larger ones.
The images of these sections were recorded and analyzed not only at Step 0 state, but also at the end state of each compression step, to measure the area A and perimeter P of each cell, and the distributions of the equivalent diameter deq, and circularity C through the section by means of Equations (1) and (2). This allows to analyze the evolution of morphological properties during overall deformation process.
Taking into consideration here the case of the XZ section (being the modality of analysis for the YZ section strictly similar), its evolution through the end states of the compression steps is shown by the CT images in Figure 7. At the beginning, deformation occurs in the weakest zones (Step 1), where some cells assume oblong shapes. Subsequently compression led to the progressive collapse of larger cells (Steps 4 and 5), giving rise to the specimen densification.
The morphological characteristics of the cellular structure are well described by the evolution of equivalent diameter deq and circularity C distributions during the subsequent compression steps (Figure 8 and Figure 9, where the values on the horizontal axes represent the upper limit of the ranges for frequency distribution).
As the compression advances, in general the cell size is reduced; at each deformation step it can be observed that a certain number of large cells disappear. In particular, the number of cells with the smallest equivalent diameter deq increases from Step 0 to Step 1, decreases from Step 1 to Step 2 and increases again from Step 3 to Step 5. Before the final Step 6, the distribution is grouped around low values of deq.
The circularity C shows a trend in agreement to that of the equivalent diameter deq: the number of cells with C≈1 increases from step 0 to step 1 and remains at a high value during the following steps, allowing to deduce that as densification advances the cells tend to become small, assuming an almost spherical shape. However, at the last observed step the number of spherical cells is shown to not be very high.

4.2. Correlation Model Fitting and Mechanical Behavior Simulation

Starting from the morphological characteristics expressed by the evolution of equivalent diameter deq and circularity C distributions collected in Figure 8 and Figure 9, for each compression step, it is possible to apply the morphology-compression behavior correlation model proposed in Section 3.
The distributions of deq and C can be expressed by the vectors V(deq) and D(deq) in Equations (4), and vectors V(C) and D(C) in Equation (6), respectively.
The partition of deq i values between the two size classes of cells has been performed by prefixing the ratio dpeq/dseq on the basis of image analysis of the CT sections and using Equation (5) to calculate the values of dpeq and dseq corresponding to the partition that respect the prefixed ratio.
The values of Cs and Cp were calculated by Equation (7), by fixing the threshold value Cts = 0.785, as suggested in Section 3.1.
The pairs of average values (dpeq,Cp) and (dseq,Cs) calculated as above for the prismatic and spheroidal cells respectively, were used in Equations (9) and (11), to obtain the values of major and minor equivalent semi-axes (φrct+eq, φrct−eq) and (φell+eq, φell−eq) for both rectangular section cells and elliptical section cells of the intermediate virtual model (Figure 5b), and the corresponding average values φrct*eq and φell*eq.
Finally, the global parameters w and d for the reference model (Figure 4 and Figure 5c) were calculated by Equations (12) and (13), as functions of coefficients γp and γs, and the average values of the thickness of prismatic and spheroidal cells tp and ts were calculated by Equations (14) and (15), as functions of their ratio λ = ts/tp. The coefficients γp, γs, λ need to be fitted on experimental data.
Defining the global parameters of the reference model w, d, tp, ts, it is possible:
  • to calculate the value of the relative density ρf/ρs by means of the Equation (3).
  • to simulate the compression stress–strain curve by calculating the parameters Ef, σpl, εo, εd using the most suitable equations that correlate them to relative density, among those collected in the Section 3.3.
Here, the general scaling relations in Equations (16) and (18) were used to calculate Ef and εd respectively. The alternative Equation (19) for Ef was discarded as it was shown to be unsuitable in the present case, being the experimental value of the relative density ρfs >0.2 for the 0.4% TiH2 foam (ρfs = 0.220 at Step 0 state). Equation (21) was used to calculate σpl, being the most appropriate for cruciform-hemisphere type model such as the one adopted as reference. The use of Equation (17) was avoided because it has been found that it overestimates the value of σpl precisely in the case of Al foams obtained by compacted powder method and TiH2 as foaming agent [48]. Finally, Equation (22) was used to calculate εo, and Equation (23) to simulate of the post-plateau compression curve.
Overall, the coefficients γp and γs in Equations (12) and (13), λ in Equation (15), c1 and c3 in Equations (16) and (18), ξ and ψ in Equation (23), which complete the morphology–behavior correlation model, must be defined by experimental fitting. For this purpose, the theoretical values of compression behavior parameters Ef, σpl, εd were calculated varying the coefficients γp, γs, λ, c1, c3, and are compared to the corresponding values identified on experimental compression curve in Figure 6, following the indication of Figure 3. In particular, the value of stress at the beginning of the plateau was assumed for σpl. The fitted values of the coefficients are those who minimize the sum of squared distances between the theoretical and experimental values of compression behavior parameters.
The value of relative density ρfs corresponding to the fitted parameters was assumed as relative density of the cellular structure.
Finally, the values of post-plateau compression parameters ξ and ψ in Equation (23) were defined by imposing σ = σpl at ε = εo and fitting the slope of the final part of the theoretical densification curve on the experimental one.
In Table 2 and Table 3, the values of the fitted coefficients, global parameters of the cellular structure, relative density calculate by Equation (3), and parameters of simulated stress–strain curve are reported for all compression steps performed on 0.4% TiH2 specimen. As a first validation of the model, the theoretical value of the relative density ρfs calculated in correspondence with the morphology of Step 0 (0.217) is well fitted with the experimental value equal to 0.220.
In Figure 10, the compression curve simulated by the theoretical values of the parameters for the morphology at Step 0 (reported in the first row of Table 3) was superimposed on the experimental curve. Two main observations can be made.
The apparent discrepancy of the Young’s modulus obtained through the theoretical model, in comparison to the value estimated by assessing the initial slope of the experimental curve, is due to a known uncertainty in the estimate of the modulus Ef. In fact, although the initial loading condition in compression test could appear to be linear elastic, in reality the corresponding stretch of the curve has a non-straight trend, as some cells yield at very low loads. Therefore, at the beginning of the real stress–strain curve, at the local level, there is a tendency towards a greater slope than the apparent global one [9]. As a consequence, the value of Ef calculated as the slope of the experimental curve is underestimated compared to the true modulus. Anyhow, very large differences between the analytical predictions and the experimental values, particularly for Young’s modulus, are usually found, and they are due to the frequent presence of defects in the real foam structure (uneven cell wall curvature, missing cell walls, inhomogeneous density distribution) which are not included in the theoretical models [18].
The second observation concerns the plateau regime, and in particular what was already highlighted when the typical compressive stress–strain curve for closed-cell foams was introduced (Figure 3, Section 3.1): the complex behavior in the plastic collapse regime is characterized by unstable σpl stress, which tends to rise with increasing strain (as confirmed by the experimental curve). This tendency makes it necessary to fit the correlation model between morphology and mechanical behavior according to several compression steps, as the morphological analysis limited to just one compression state, such as the initial state at Step 0, only would allow to define a strictly constant value plateau, resulting in an overall simulation far from the real behavior, as shown in Figure 10.
Figure 11 shows the stress–strain curves simulated by the theoretical values of the parameters obtained applying the correlation model to the morphologies at the end state of each compression step (Table 3 on the right). In this case it can be observed that:
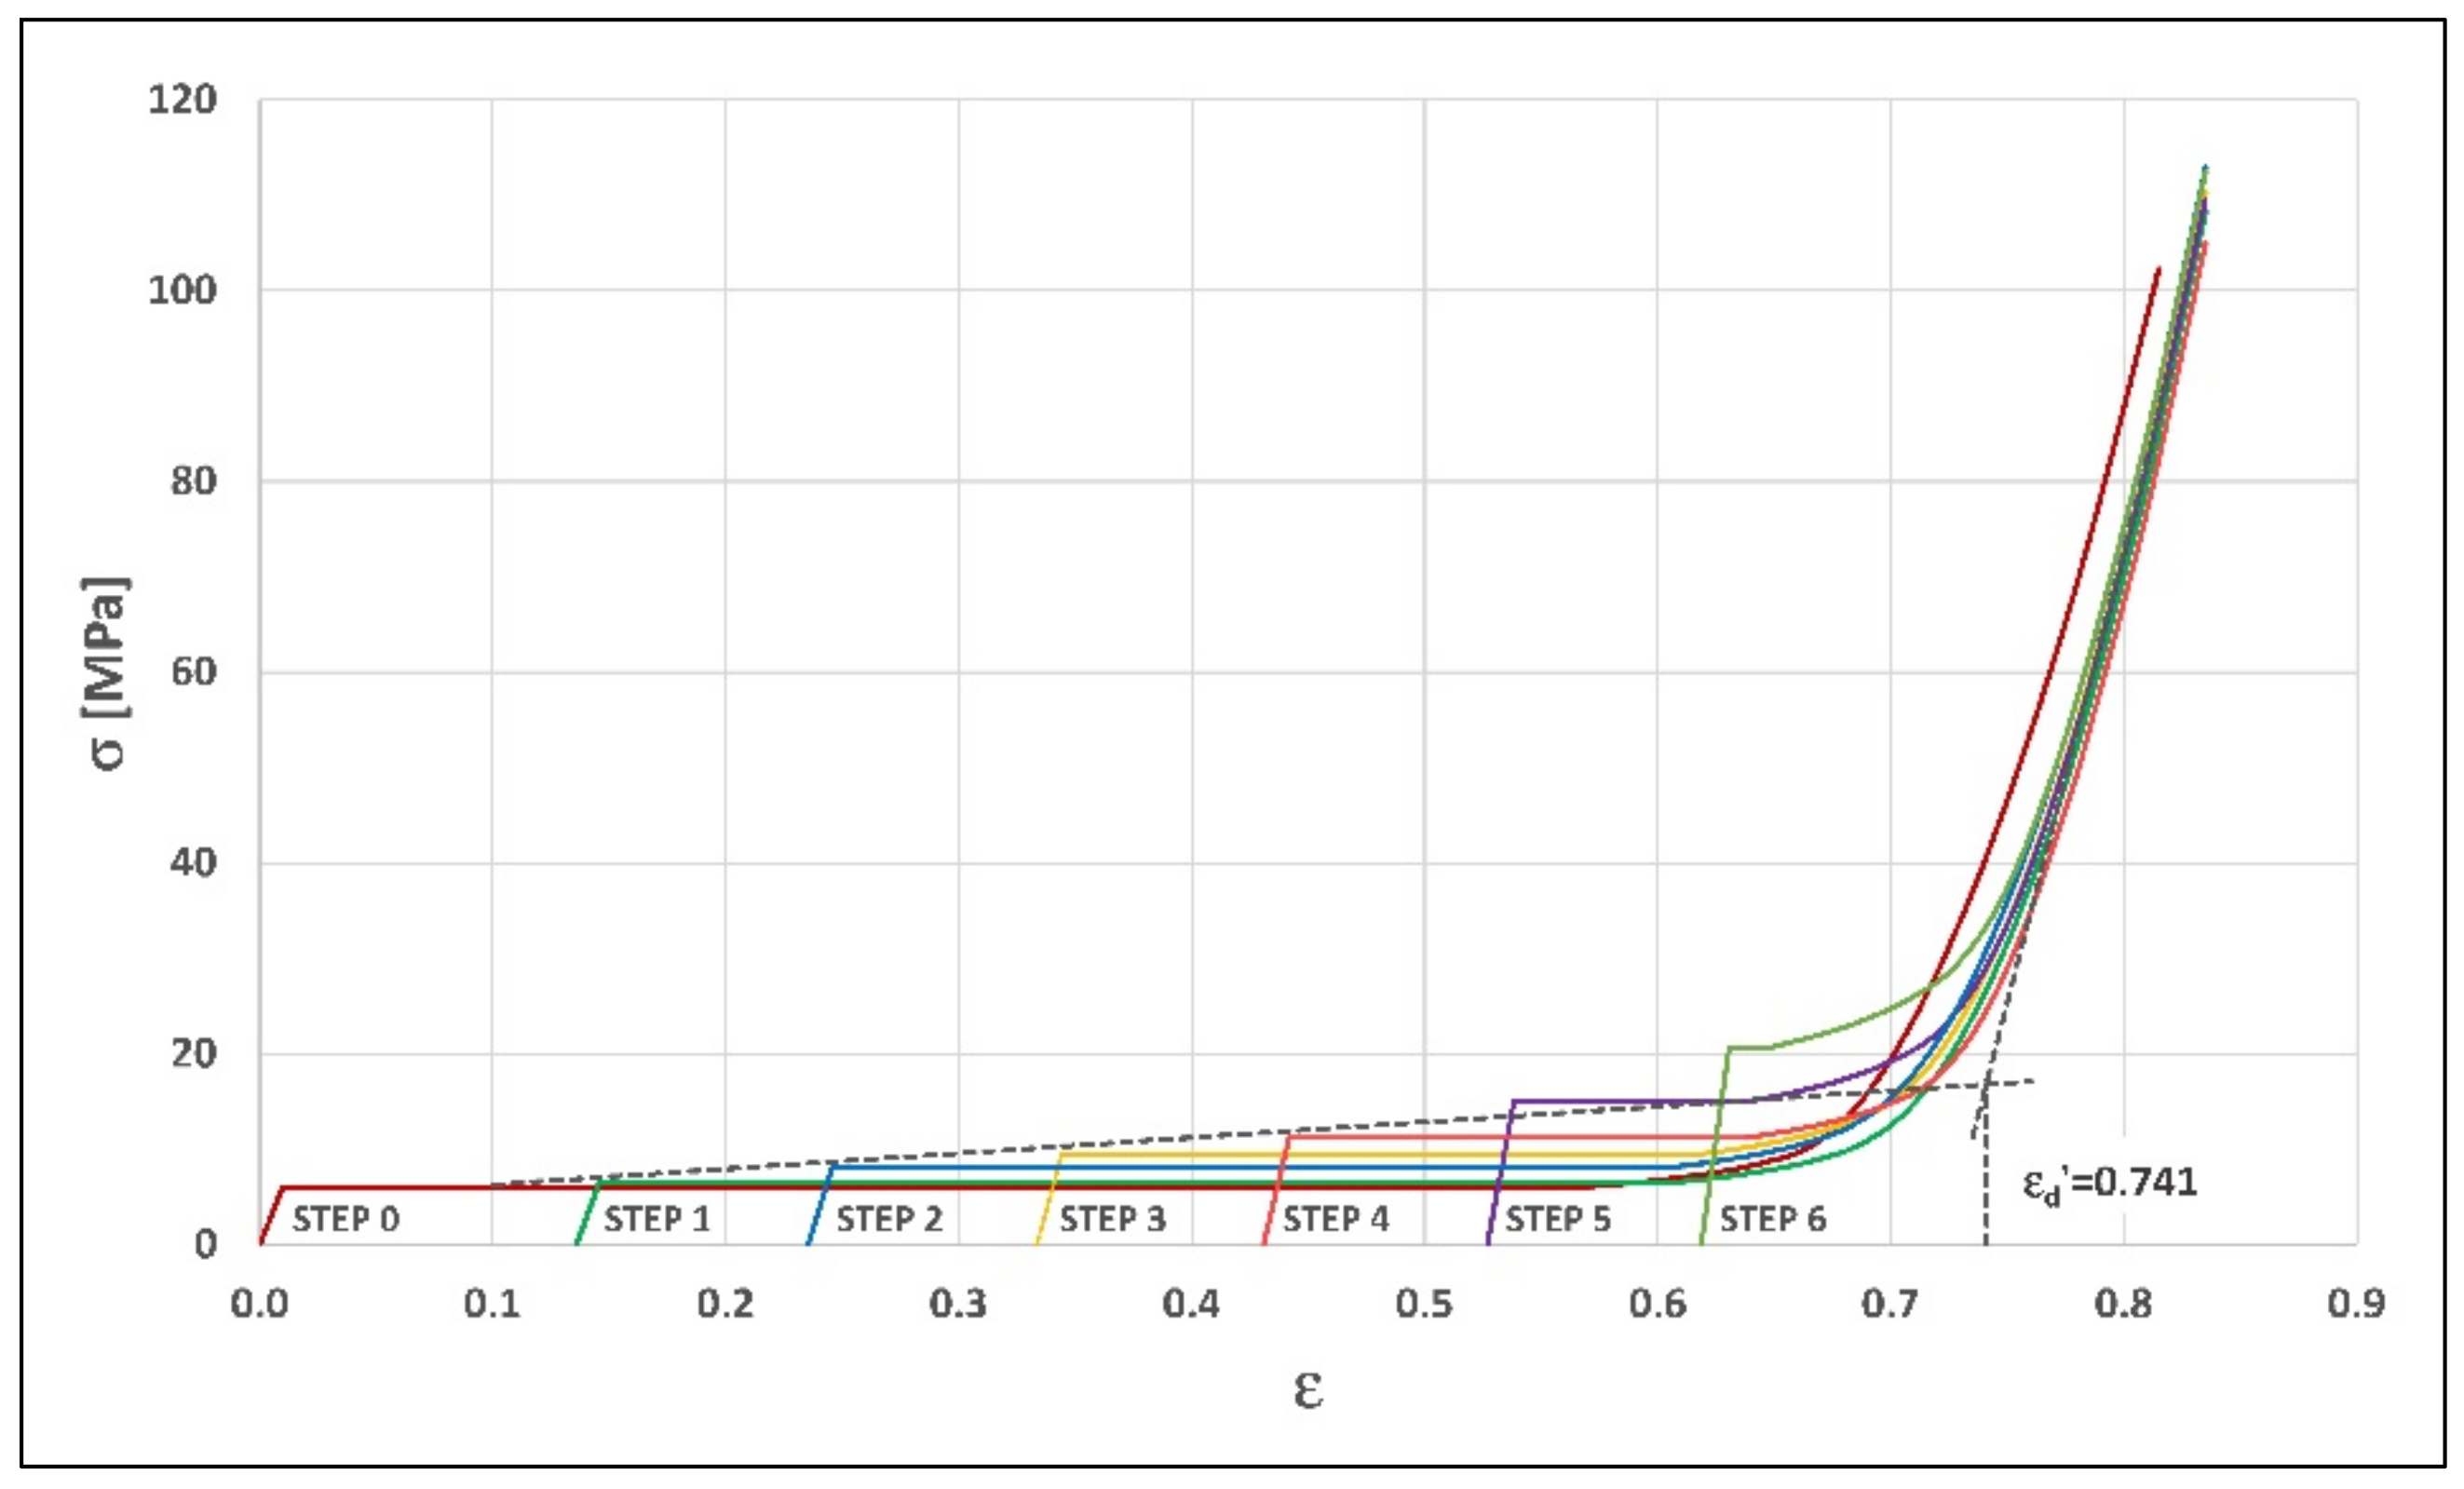
  • By enveloping these curves, it is possible to define the rise trend of the plateau stress.
  • The sections of the curves in densification regime tend to converge.
It is therefore possible to trace the tangents to the plastic collapse plateau and the convergence curve to densification, identifying a densification strain value of simulation convergence εd’.
Finally, the univocal theoretical stress–strain curve can be simulated by these construction criteria:
  • The elastic regime at low stresses is assumed to be represented by the linear regime simulated for Step 0 morphology.
  • The plastic collapse regime is obtained by enveloping the start points of the plateau of the simulated curves in Figure 11.
  • The start point of the plateau for Step 6 simulated curve is assumed as the end point of plastic collapse regime and start point of post-plateau densification regime, so that the corresponding strain is assumed as densification onset strain εo’ of the enveloped stress–strain curve.
  • The densification regime is obtained by iteration of densification curve calculation, starting from ε = εo’ and imposing εd = εd’ in Equation (23).
As a result, the simulated curve in Figure 12 is obtained. If compared to the experimental one, a good level of approximation is found, quantified by the congruence between the theoretical and experimental values of the densification strain (0.715 and 0.727, respectively), and by a deviation in stress values of the densification curve within 10%, due to a strain shift within 0.02.

4.3. Robustness of the Correlation Model

The results presented above refer to the morphological analysis of the section XZ of the 0.4% TiH2 specimen, according to the scheme in Figure 2. The calculation of the relative densities for each compression step, on the basis of the corresponding morphological parameters, was applied also to section YZ in the same figure, obtaining negligible deviations, and simulation curves consequently similar to those shown before.
To highlight the effect of morphological variations within the same specimen on the simulation of the compression curve, in the following Figure 13 and Figure 14 the distributions of the morphological properties Deq (Figure 13a,b) and C (Figure 14a,b) are compared for both sections XZ and YZ of the reference specimen (Specimen 1) at the initial condition (Step 0). The comparison is based on the analysis of the main statistical parameters that characterize the distribution of frequencies (i.e., the number of cells per interval of morphology property): the first quartile (Q1), second quartile or median (M), and third quartile (Q3). Since the three quartiles are percentiles of 25%, they divide the set of intervals of each distribution of Deq and C into four subsets of equal extension, i.e., equal incidence on the overall distribution. It can, therefore, be observed that, despite the differences in the distributions of frequencies and in the overall number of cells, the values of the statistical parameters remain substantially stable, both for Deq and C, and thus the distributions are affine, and so are the morphological characteristics of the two sections.
This affinity is reflected in the simulation of the compressive behavior, as confirmed by the corresponding effect on the values of the relative density and the compression curve parameters, calculated for both the XZ and YZ sections at the Step 0 state, using the same procedure described in Section 4.2. As highlighted by the data reported in Table 4, the most significant deviations, detectable for σpl and εo, are limited and negligible in the simulation of the compression curve.
An aspect related to the previous one deals with the reproducibility of results for specimens with the same properties, i.e., made using the same foaming method, with the same composition of the powders, and under the same process conditions. In this regard, the effects of morphological variations on the simulation of the compression curve were analyzed. In Figure 13a,c,d and Figure 14a,c,d the distributions of the morphological properties Deq and C, respectively, corresponding to the XZ section of the reference specimen (Specimen 1) are compared with those characterizing randomly chosen longitudinal sections of other two specimens (Specimen 2 and 3). As regards the distribution of Deq, it is possible to note a close affinity between Specimens 1 and 2 (Figure 13a,c); in Specimen 3 a distribution of Deq with a tendency towards larger cells emerges (in Figure 13d the third quartile Q3 is shifted on the right). The distributions of C are substantially homogeneous among the three specimens; in this case the most marked affinity is that between Specimens 2 and 3 (Figure 14c,d), while the distribution of Specimen 1 shows a tendency towards higher C values (in Figure 14a all the three quartiles are compacted on the right).
Also in this case the similarity between the distributions of the morphological properties is reflected in the simulation of the compressive behavior, as confirmed by the limited variances in the values of the relative density and the compressive parameters calculated for the three specimens and reported in Table 5. This result is in agreement with previous studies on the reproducibility of compressive properties of closed-cell aluminum foam, which is considered stable for values of the ratio between the height of the specimen and the mean size of the cells above 6 [10] (in the cases examined here, this ratio calculated using the third quartile of the Deq distribution instead of the mean value, to take into account the presence of greater size cells, assumes values in the range 10.1 ÷ 14.6).
These results highlight a limited effect of the differences in the morphological properties of the longitudinal sections in the same specimen, and between different specimens made under the same process conditions, on the estimate of the relative density, and therefore on the theoretical curve of compression behavior. This can be traced back to two aspects:
  • The morphological properties of closed-cell structures of metal foams that affect the mechanical behavior are similar between longitudinal sections, while they change significantly with respect to cross sections [38].
  • The process of translating the local morphological parameters of the real sections into geometric parameters of the virtual model of the cellular structure, described in detail in Section 3, attenuates the effects of the local morphological characteristics.
As a result, the proposed model for the correlation between morphology and compression behavior turns out to be robust with respect to the choice of the section for the morphological analysis, and to the variability of morphological properties between different specimens obtained by the same process conditions. The first finding solves the problem of which section to choose, among the countless longitudinal sections that rotate around the loading axis of the same specimen, for the two-dimensional morphological analysis on which the correlation model introduced in Section 3 is based. The second one guarantees the reproducibility of the results as the specimen varies.

4.4. Predictive Use of the Fitted Model

The correlation model, once fitted on all compression steps for the specimen with specific properties (0.4% TiH2, 2.8% SiC), can be used to predict the behavior of similar cell structures. As reported in Section 2.1, other two types of closed-cell Al foam cylindrical specimens were made and tested, varying the TiH2 forming agent content in powder composition: 0.1 and 0.2 weight % (with SiC content fixed at 2.8 weight % as for previous specimens). Using only the morphological analysis corresponding to the Step 0 state as input, modeling and predictive simulation of the compression behavior of the two similar foams were performed.
Using the fitting parameters γp, γs, λ, obtained previously for 0.4% TiH2 foam at Step 0 (Table 2, row 1), the relative density ρfs was calculated from the morphological analysis of Step 0 state for both 0.1% and 0.2% TiH2 foams, obtaining the values 0.294 and 0.251 respectively. These theoretical values are congruent to the corresponding experimental values equal to 0.310 and 0.240.
The following procedure was then performed for predictive simulation of the compression behavior of the two similar foams:
  • The predictive values of the relative densities ρfs for the subsequent compression steps were calculated by applying the strain-dependent law determined in the previous case by interpolation (Table 3, column 3), modulated with respect to the value of the relative density at Step 0 of the similar foams.
  • The parameters for the stress–strain curves at each compression step were calculated using the aforementioned Equations (16), (18), (21)–(23), with the predictive values of relative density ρfs, and the fitted values in Table 2 for c1, c3, ξ, ψ.
Finally, the same construction procedure by envelope used in the case of 0.4% TiH2 foam and described in the Section 3.2 was applied, to obtain the simulated compression curves for 0.1% and 0.2% TiH2 foams, shown respectively in Figure 15 and Figure 16 in comparison with the corresponding curves obtained experimentally, in analogy with Figure 12.
As a general observation, it is possible to note that in the first case an approximate predictive simulation regarding the elastic and plastic collapse phases, and a rather accurate prediction in the densification regime, are obtained. In the second case, instead, the accuracy of the predictive simulation is higher and more homogeneous.
This result is particularly significant if it is considered that the powder composition to produce the metal foams and the morphological characteristics can be correlated [33]. The predictive potential of the morphology–behavior correlation model proposed here thus becomes an integrative tool of these previous studies, allowing to formulate good approximation predictions on the whole compression behavior of the foams as the powder’s composition changes, or vice versa allowing us to proactively identify the precursor composition suitable to obtain a specific mechanical behavior.

4.5. Effectiveness of the Model, Limitations, and Field of Application

A quantitative analysis of the key parameters of the compression curves shown in the Figure 12, Figure 15 and Figure 16, and the comparison between their simulated and experimental values, allow to provide a more precise evaluation of the accuracy of the simulations and highlight the improving effect obtained by extending the morphological analysis and the fitting of the model on the compression steps detected during collapse evolution.
For these purposes, the mean plateau stress σpl and the densification strain εd were taken into consideration, among the main parameters of the compressive curves. The modulus of elasticity Ef has not been considered for the reasons already highlighted in Section 4.2, which exclude the possibility of a theoretical evaluation of Young’s modulus comparable to the experimental one. The densification onset εo, on the other hand, was excluded due to the difficulty of defining univocal values in the experimental curves.
With these premises, Table 6 shows the theoretical values (i.e., the values corresponding to the curves simulated using the proposed model) and experimental values of mean plateau stress σpl and the densification strain εd, for the three foams examined, as the TiH2 forming agent content in powder composition varies. The percentage errors in the theoretical values with respect to the corresponding experimental values are included in brackets. In all cases, the theoretical values of the compression parameters are reported with respect to two conditions:
  • Considering only the starting morphological properties, corresponding to Step 0 pre-compression state (Step 0 curve such as in Figure 10 for 0.4% TiH2 foam).
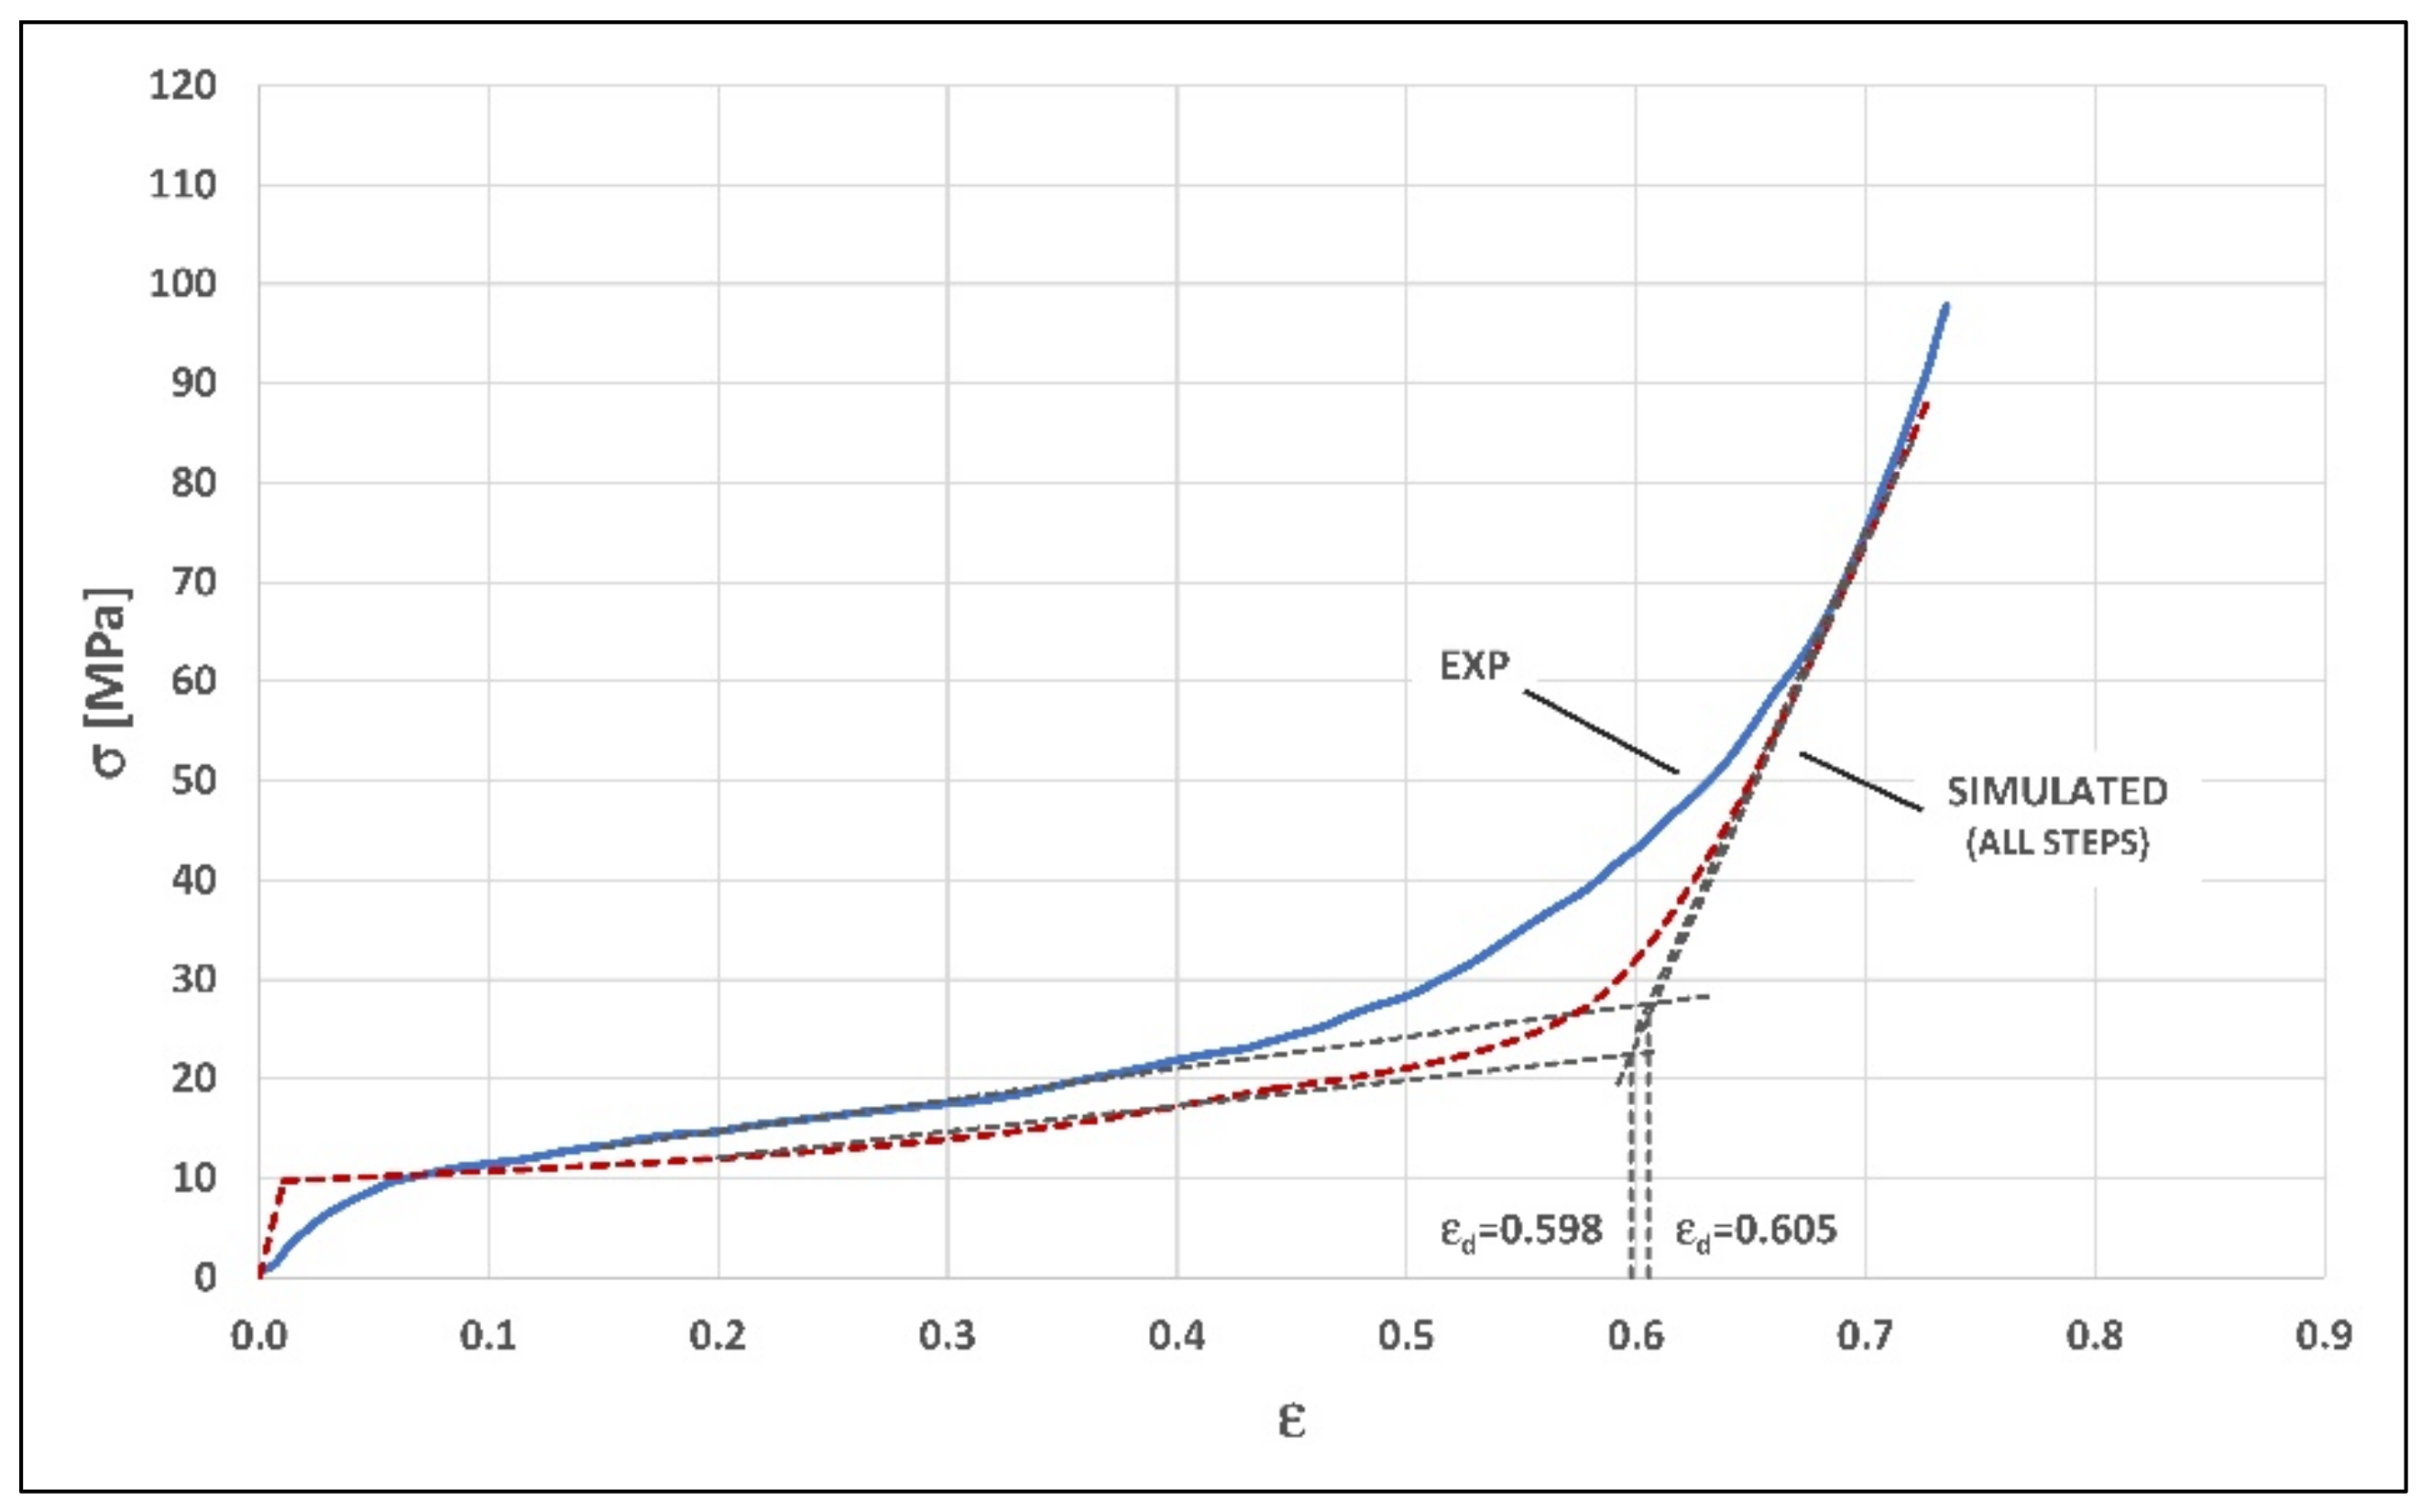
  • Constructing the final compression curves according to the procedure defined in Section 4.2, that allowed to obtain the theoretical curves in Figure 12, Figure 15 and Figure 16 (all steps curves, obtained taking into account the evolution of the compression process up to collapse in fitting the model).
The main conclusion to highlight by observing the results reported in the table can be summarized as follow:
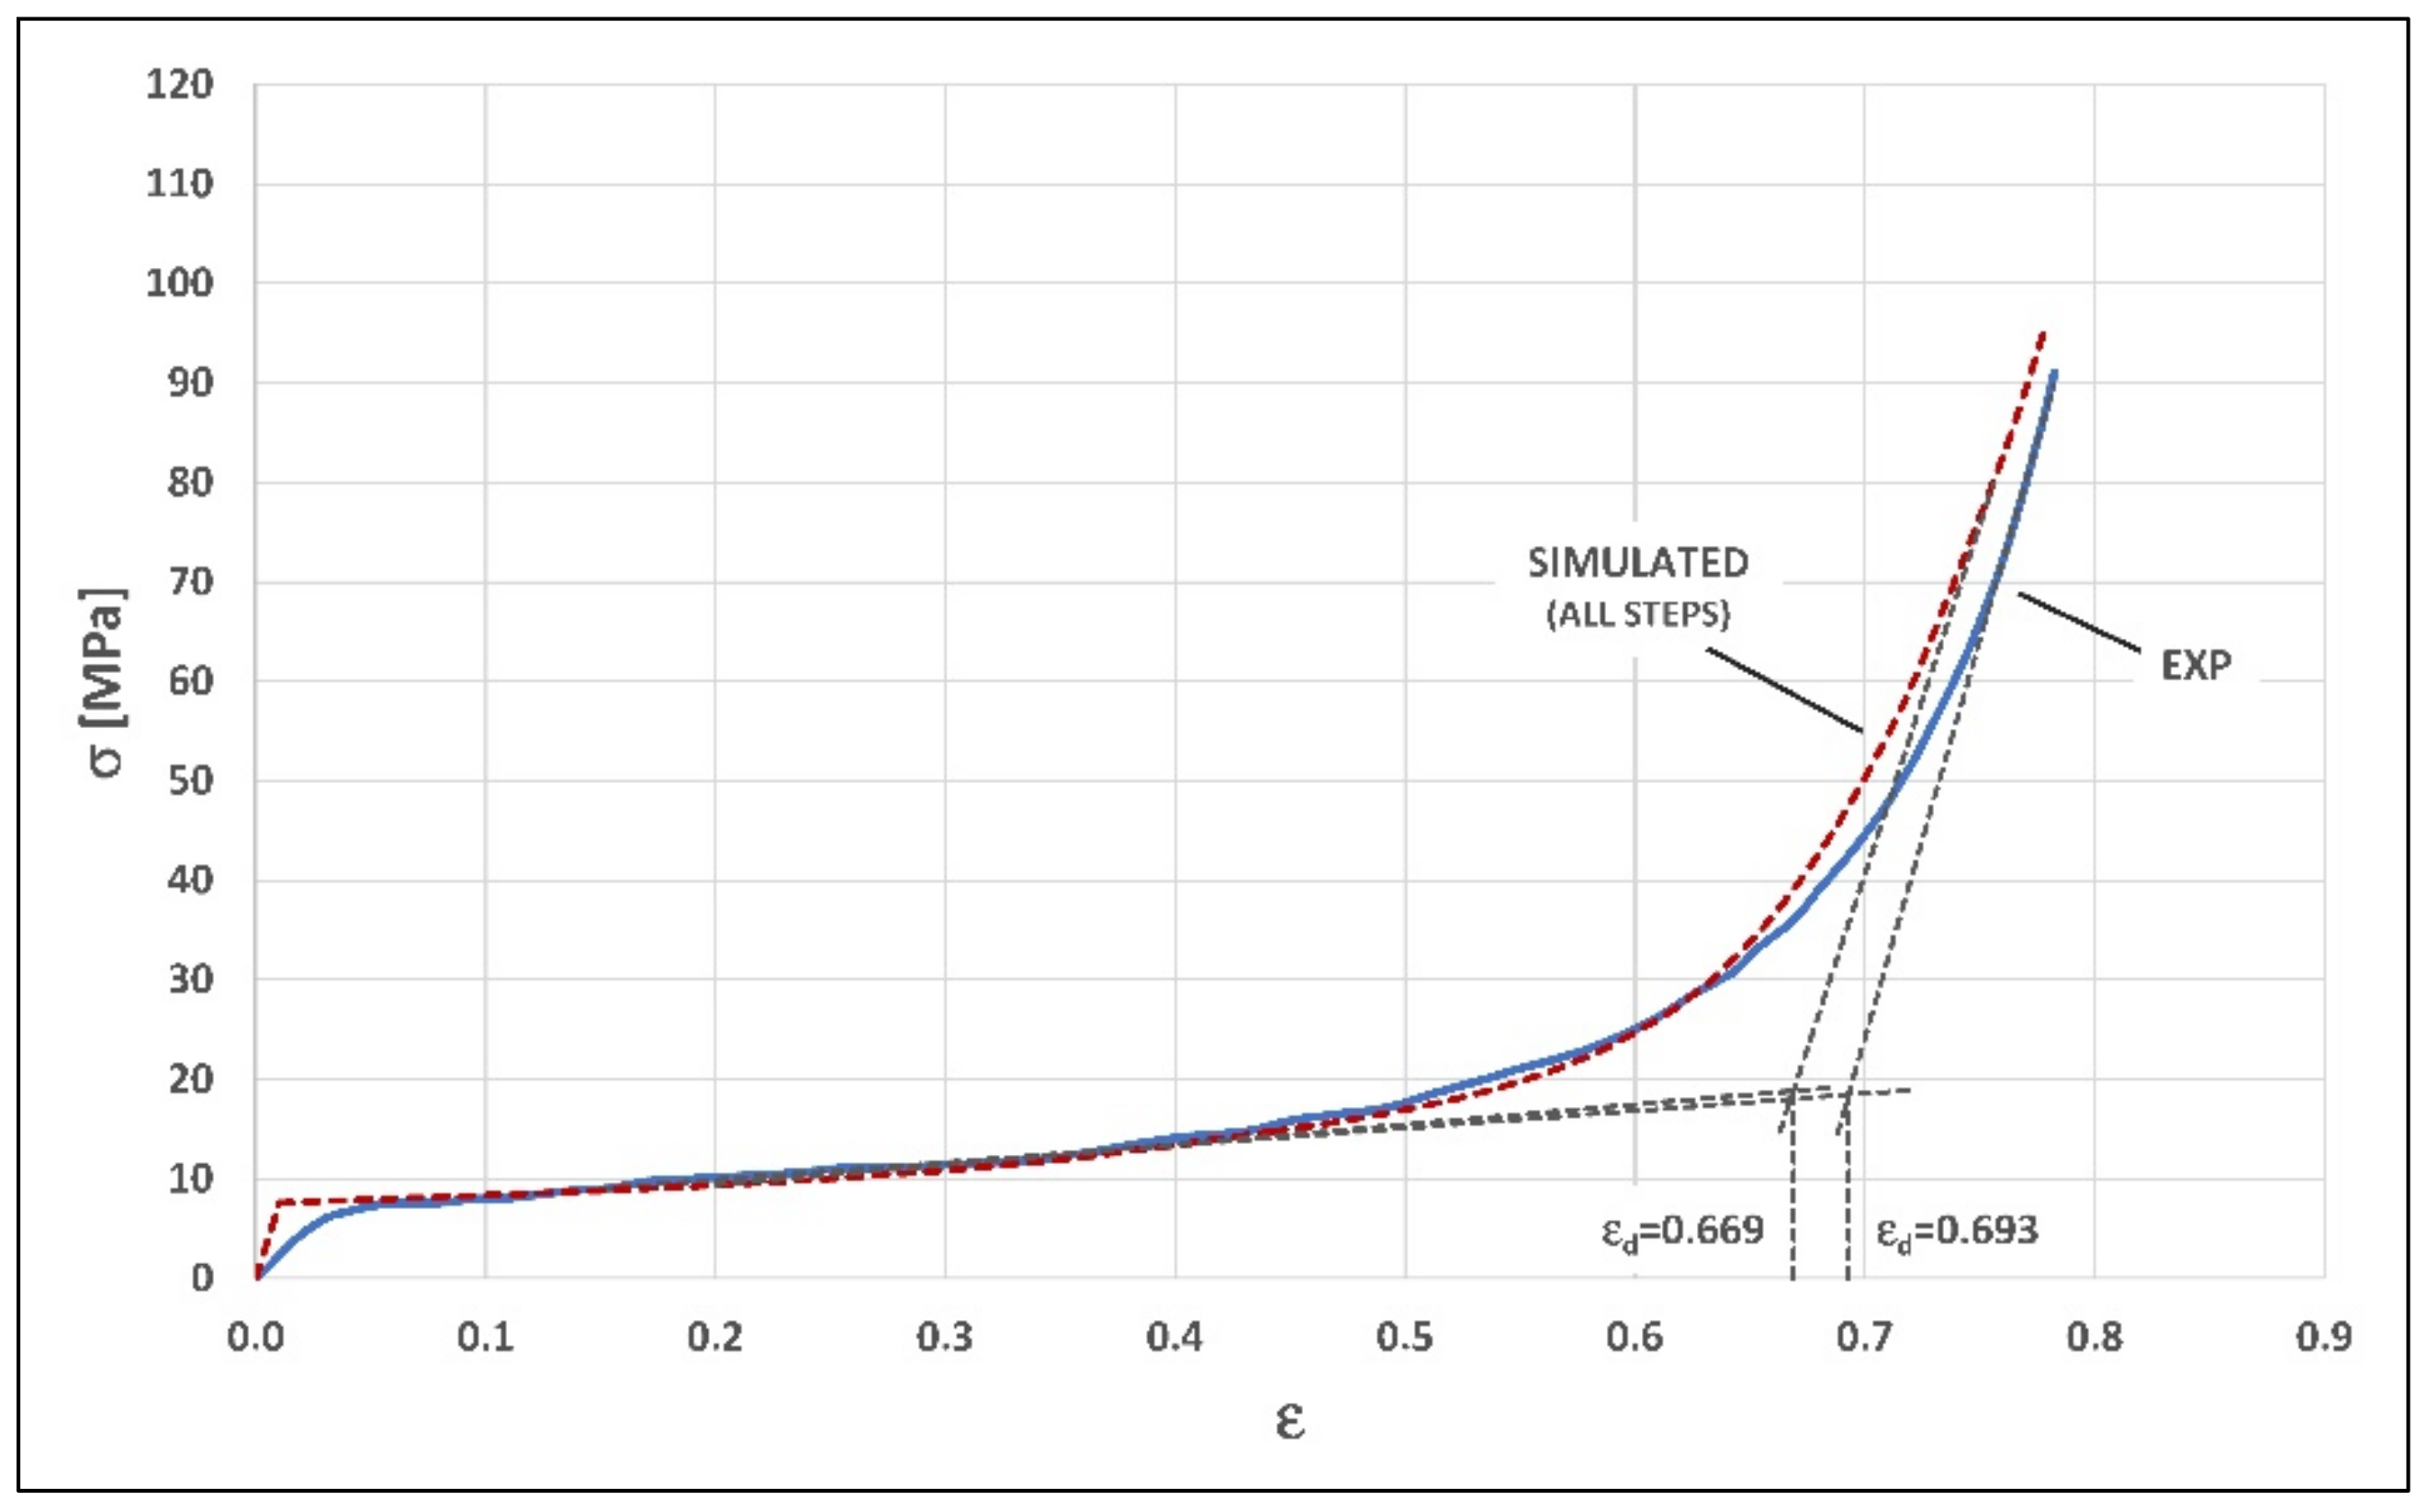
  • As expected, the most accurate theoretical curve (whose compression parameters have the lowest error values compared to the experimental ones) is the all steps curve corresponding to the 4% TiH2 foam (Figure 12), which was entirely fitted on the corresponding experimental curve.
  • The two predicted theoretical curves (all steps curves for 1% and 2% TiH2 foams, in Figure 15 and Figure 16 respectively) show a good accuracy in the estimation of the stress plateau σpl, and a high precision regarding the simulation of the densification stage (the errors for εd are very limited).
  • In all cases, the improvement in accuracy due to fit the correlation model between morphology and mechanical behavior according to several compression steps (obtaining the all steps curves), compared to the results obtained by a morphological analysis limited to just one compression state, such as the initial pre-compression one (obtaining Step 0 curves), is clearly represented by the marked reductions in the corresponding errors with respect to the experimental curves (confirming what was anticipated in Section 4.2 regarding the construction of the compression curves).
The same data in Table 6, with particular regard to those obtained for the all steps curves can be used to evaluate the accuracy of the proposed model in comparison with other models for simulating the compression behavior of closed-cell Al foams, which are present in the literature. With this purpose, the comparison was set up according to the following premises:
  • No analytical model in the literature was taken into consideration, due to the limited accuracy in the estimation of the compression parameters [18]; for this reason, the comparison was made with some of the numerical models presented in the introduction (Section 1), and chosen so to diversify the comparison and cover the main modeling types.
  • Also in this case the compression parameters taken into consideration were the mean plateau stress σpl and the densification strain εd; while for the former it was always possible to extract the data from the literature, regarding the latter it must be pointed out that some models fail to provide a sufficiently clear reconstruction of the densification curve, so the corresponding densification strain cannot be defined (therefore in this cases it is missing in the comparison table).
  • Only the percentage errors between the simulated and experimental values were used as significant indicators for the comparison, because they allow to quantify the accuracy of the models in the simulation of mechanical behavior, regardless of the properties of the cellular structure analyzed; furthermore, since it is clearly evident that the accuracy of the models varies with the relative density of the foam, it was considered appropriate to report this data as well.
With these premises, the results obtained by the proposed analytical model (PAM), reported in previous Table 6 for all steps curves, were compared to the results obtained by the following numerical models from the literature:
  • As representative models based on simple cell shapes, those investigated by Konstantinidis et al. [20] (NM1), and the multicell model proposed by Kadkhodapour and Raeisi [21] (NM2).
  • As representative models based on polyhedra, the cruciform-hemisphere model proposed by Meguid et al. [17] (NM3), and the Hasan’s weaker-cruciform-stronger-hemisphere model [19] (NM4); the latter was also assumed as reference model to set the preliminary ordered structure of the foam in the present study.
  • As an example of advanced tessellation-based numerical modeling, the irregular Voronoi model implemented by Vengatachalam et al. [30] (NM5).
Table 7 collects the values of the percentage errors of the simulations with respect to the experimental data. For some models, the data are diversified by the relative density of the cellular structure and/or by the type of cell shape.
As a first consideration, it can be observed that the densification parameter εd is hardly identified. This is due to a general inaccuracy in the simulation of the densification regime, even in the case of the most sophisticated numerical model (NM5), whose estimated error is indicative. On the contrary, the proposed model PAM allows an accurate simulation of the entire densification curve.
The accuracy of PAM in estimating the mean plateau stress σpl, excluding the foam used to fit the model and considering only the two predictive simulations (0.1% and 0.2% TiH2), stands at low error levels, as compared to the NM1 model (excluding the case of elliptical cells), and to the uniform density NM3 model, and is similar to the NM5 model. Anyway, it should be noted that the proposed model, while losing precision in the mean value of the plateau stress (if compared to numerical models such as NM2, NM3 with randomized density, and NM4 at 0.200 relative density), simulates in detail the entire plastic plateau, and describes with significant precision the whole compression up to densification (as can be deduced from the qualitative observation of Figure 15 and Figure 16), distinguishing itself from all the numerical models compared.
This result seems to contrast with the simplifying nature of the analytical modeling proposed, in comparison with the higher level of detail obtainable by numerical FE simulation, whose results generally present a great improvement if compared to the analytical predictions [19,21]. As a matter of fact, one of the limitations of the morphology–mechanical behavior correlation model is to gather and represent only some morphological trends of the structure, related to the size and shape differences between the cells, to the thickness differences between the cell walls, to the orientation of the cells with respect to the loading direction. The discussed results, which show a high level of effectiveness in the predictive simulation of the whole stress–strain curve, demonstrate that the proposed analytical model compensates for the approximations and the loss of detail by mean of the accurate fitting on the compression steps analyzed during the evolution of the structure collapse.
Another characteristic of the model, which can represent a limitation of its application, is the anisotropy, due to the fact that it is developed with respect to the load direction. Examining whether a cellular structure is geometrically anisotropic is a critical issue [49]. In this respect, it is known that the effects of the structural anisotropy can be considered by performing compressive tests under different loading directions [50]. This peculiarity of the proposed model does not really differ from the behavior of the type of cellular structures examined here, which are obtained by a highly directional foaming process [51]. Anyway, here the anisotropy of the model is functional to more accurately investigate the compressive behavior along the specimen axis, without taking into account the properties along the radial directions.
Finally, as last remarks on the applicative potentialities, it should be pointed out that the proposed model allows to simulate highly inhomogeneous cells, as shown by the investigation carried out on specimens produced by means of the compacted powder method. Since the model parameters are calculated by fitting on the experimental compressive curve, nothing suggests that the model cannot also be successfully used in the case of more ordered and morphologically homogeneous structures; on the contrary, these structures would involve a minor loss of detail in the geometric modeling.
Among the homogeneous cellular structures, the use of the proposed model in the case of syntactic foams should be excluded, since the simulation of the mechanical behavior of the microspheres that characterize their structure requires specially developed mechanical models [52].

5. Conclusions

The comparison between the experimental stress–strain curve and the one simulated by the theoretical values of the morphological parameters at the initial state of compression highlights the need to fit the correlation model between morphology and mechanical behavior according to several compression steps. In fact, the morphological analysis limited to just one compression state, would only allow for defining a strictly constant value of the plateau stress, resulting in an overall simulation far from the real behavior, characterized by a plateau stress not well stable, and tending to rise with increasing strain.
Therefore, for one of the produced foams (0.4% TiH2, 2.8% SiC), the analysis of the evolution of the cells’ morphology during deformation up to the final densification was carried out at different levels of compression by X-ray CT observations. The correlation model was fitted with regard to the morphology of each compression step, and the simulated stress–strain curve was obtained by enveloping the curves obtained for each step. When compared to the experimental one, a good level of approximation of the whole curve was found, with a realistic description of the behavior up to the final densification. In particular, a full congruence between the theoretical and experimental values of the densification strain, with a limited deviation in stress values of the densification curve, was achieved.
The capability of the model (fitted on the morphological evolution during compression for 0.4% TiH2 foam) to predict the mechanical behavior of other similar foams, by means of the unique morphological analysis of the condition prior to compression, was validated. The comparison between simulated and corresponding experimental stress–strain curves for 0.1% and 0.2% TiH2 foams, revealed in both cases rather accurate prediction of the whole compression curve, particularly in the densification regime.
Taking into account that previous studies demonstrated how the initial composition of the powder and the morphological characteristics can be correlated, the predictive potential of the morphology–behavior correlation model, proposed here, opens new perspectives on the design of cellular structures with the preliminarily simulated compressive behavior.

Author Contributions

Conceptualization, F.G.; methodology, F.G.; validation, G.C., F.G., A.S. and M.E.T.; formal analysis, F.G.; investigation, G.C., F.G., A.S. and M.E.T.; resources, G.C. and M.E.T.; data curation, G.C., A.S. and M.E.T.; writing—original draft preparation, F.G. and A.S.; writing—review and editing, G.C., F.G., A.S. and M.E.T.; visualization, F.G. and A.S. All authors have read and agreed to the published version of the manuscript.

Funding

This research received no external funding.

Institutional Review Board Statement

Not applicable.

Informed Consent Statement

Not applicable.

Data Availability Statement

The data presented in this study are available on request from the corresponding author.

Conflicts of Interest

The authors declare no conflict of interest.

References

  1. Banhart, J. Manufacture, characterisation and application of cellular metals and metal foams. Prog. Mater. Sci. 2001, 46, 559–632. [Google Scholar] [CrossRef]
  2. Nazir, A.; Abate, K.M.; Kumar, A.; Jeng, J.-Y. A state-of-the-art review on types, design, optimization, and additive manufacturing of cellular structures. Int. J. Adv. Manuf. Tech. 2019, 104, 3489–3510. [Google Scholar] [CrossRef]
  3. Andrews, E.; Sanders, W.; Gibson, L.J. Compressive and tensile behaviour of aluminum foams. Mat. Sci. Eng. A 1999, 270, 113–124. [Google Scholar] [CrossRef]
  4. McCullough, K.Y.G.; Fleck, N.A.; Ashby, M.F. Uniaxial stress-strain behavior of aluminium alloy foams. Acta Mater. 1999, 47, 2323–2330. [Google Scholar] [CrossRef]
  5. Papadopoulus, D.P.; Konstantinidis, I.C.; Papanastasious, N.; Skolianos, S.; Tsipas, D.N. Mechanical properties of Al metal foams. Mater. Lett. 2004, 58, 2574–2578. [Google Scholar] [CrossRef]
  6. Paul, A.; Ramamurty, U. Strain rate sensitivity of a closed-cell aluminum foam. Mat. Sci. Eng. A 2000, 281, 1–7. [Google Scholar] [CrossRef]
  7. Shen, J.; Lu, G.; Ruan, D. Compressive behaviour of closed-cell aluminium foams at high strain rates. Compos. Part B Eng. 2010, 41, 678–685. [Google Scholar] [CrossRef]
  8. Arshad, A.B.; Nazir, A.; Jeng, J.-Y. The effect of fillets and crossbars on mechanical properties of lattice structures fabricated using additive manufacturing. Int. J. Adv. Manuf. Tech. 2020, 111, 931–943. [Google Scholar] [CrossRef]
  9. Ashby, M.F.; Evans, A.; Fleck, N.A.; Gibson, L.J.; Hutchinson, J.W.; Wadley, H.N.J. Metal Foams: A Design Guide; Butterworth-Heinemann: Oxford, UK, 2010. [Google Scholar]
  10. Yu, H.; Guo, Z.; Li, B.; Yao, G.; Luo, H.; Liu, Y. Research into the effect of cell diameter of aluminium foam on its compressive and energy absorption properties. Mat. Sci. Eng. A 2007, 454-455, 542–546. [Google Scholar] [CrossRef]
  11. Campana, F.; Pillone, D. Effect of wall microstructure and morphometric parameters on the crush behaviour of Al alloy foams. Mat. Sci. Eng. A 2008, 479, 58–64. [Google Scholar] [CrossRef]
  12. Mu, Y.; Yao, G.; Liang, L.; Luo, H.; Zu, G. Deformation mechanims of closed-cell aluminum foam in compression. Scripta Mater. 2010, 63, 629–632. [Google Scholar] [CrossRef]
  13. Song, H.W.; He, Q.J.; Xie, J.J.; Tobota, A. Fracture mechanisms and size effects of brittle metallic foams: In situ compression test inside SEM. Compos. Sci. Technol. 2008, 68, 2441–2450. [Google Scholar] [CrossRef] [Green Version]
  14. Hanssen, A.G.; Hopperstad, O.S.; Langseth, M.; Ilstad, H. Validation of constitutive models applicable to aluminium foams. Int. J. Mech. Sci. 2002, 44, 359–406. [Google Scholar] [CrossRef]
  15. Gibson, L.J.; Ashby, M.F. Cellular Solids: Structure and Properties, 2nd ed.; Cambridge University Press: Cambridge, UK, 1999. [Google Scholar]
  16. Santosa, S.; Wierzbicki, T. On the modeling of crush behavior of a closed-cell aluminum foam structure. J. Mech. Phys. Solids 1998, 46, 645–669. [Google Scholar] [CrossRef]
  17. Meguid, S.A.; Cheon, S.S.; El-Abbasi, N. FE modelling of deformation localization in metallic foams. Finite Elem. Anal. Des. 2002, 38, 631–643. [Google Scholar] [CrossRef]
  18. Olurin, O.B.; Fleck, N.A.; Ashby, M.F. Deformation and fracture of aluminium foams. Mat. Sci. Eng. A 2000, 291, 136–146. [Google Scholar] [CrossRef] [Green Version]
  19. Hasan, M.A. An improvement model for FE modeling and simulation of closed cell Al-alloy foams. Adv. Mater. Sci. Eng. 2010, 567390. [Google Scholar]
  20. Konstantinidis, I.C.; Papadopoulus, D.P.; Lefakis, H.; Tsipas, D.N. Model for determining mechanical properties of aluminum closed-cell foams. Theor. Appl. Fract. Mech. 2005, 43, 157–167. [Google Scholar] [CrossRef]
  21. Kadkhodapour, J.; Raeisi, S. Micro–macro investigation of deformation and failure in closed-cell aluminum foams. Comp. Mater. Sci. 2014, 83, 137–148. [Google Scholar] [CrossRef]
  22. Kulcsár, K.; Kónya, J. Evaluation of closed and open-cell structural lattices with Finite Element Analysis. Acta Mater. Trans. 2020, 3, 26–32. [Google Scholar] [CrossRef]
  23. Sun, Y.; Zhang, X.; Shao, Z.; Li, Q.M. Image-based correlation between the meso-scale structure and deformation of closed-cell foam. Mat. Sci. Eng. A 2017, 688, 27–39. [Google Scholar] [CrossRef] [Green Version]
  24. Liu, C.; Zhang, Y.X.; Yang, C. Numerical modelling of mechanical behaviour of aluminium foam using a representative volume element method. Int. J. Mech. Sci. 2016, 118, 155–165. [Google Scholar] [CrossRef]
  25. Ghazi, A.; Tiago, C.; Sonon, B.; Berke, P.; Massart, T.J. Efficient computational modelling of closed cell metallic foams using a morphologically controlled shell geometry. Int. J. Mech. Sci. 2020, 168, 105298. [Google Scholar] [CrossRef] [Green Version]
  26. Redenbach, C.; Shklyar, I.; Andrä, H. Laguerre tessellations for elastic stiffness simulations of closed foams with strongly varying cell sizes. Int. J. Eng. Sci. 2012, 50, 70–78. [Google Scholar] [CrossRef]
  27. Li, L.; Xue, P.; Chen, Y.; Butt, H.S.U. Insight into cell size effects on quasi-static and dynamic compressive properties of 3D foams. Mat. Sci. Eng. A 2015, 636, 60–69. [Google Scholar] [CrossRef]
  28. Shi, X.; Liu, S.; Nie, H.; Lu, G.; Li, Y. Study of cell irregularity effects on the compression of closed-cell foams. Int. J. Mech. Sci. 2018, 135, 215–225. [Google Scholar] [CrossRef]
  29. Su, B.-Y.; Huang, C.-M.; Sheng, H.; Jang, W.-Y. The effect of cell-size dispersity on the mechanical properties of closed-cell aluminum foam. Mater. Charact. 2018, 135, 203–212. [Google Scholar] [CrossRef]
  30. Vengatachalam, B.; Poh, L.H.; Liu, Z.S.; Qin, Q.H.; Swaddiwudhiponga, S. Three dimensional modelling of closed-cell aluminium foams with predictive macroscopic behaviour. Mech. Mater. 2019, 136, 103067. [Google Scholar] [CrossRef]
  31. Novak, N.; Vesenjak, M.; Duarte, I.; Tanaka, S.; Hokamoto, K.; Krstulovic-Opara, L.; Guo, B.; Chen, P. Compressive behaviour of closed-cell aluminium foam at different strain rates. Materials 2019, 12, 4108. [Google Scholar] [CrossRef] [Green Version]
  32. Sharma, V.; Zivic, F.; Grujovic, N.; Babcsan, N.; Babcsan, J. Numerical modeling and experimental behavior of closed-cell aluminum foam fabricated by the gas blowing method under compressive loading. Materials 2019, 12, 1582. [Google Scholar] [CrossRef] [Green Version]
  33. Costanza, G.; Gusmano, G.; Montanati, R.; Tata, M.E.; Ucciardello, N. Effect of powder mix composition on Al foam morphology. Proc. Inst. Mech. Eng. Part L J. Mater. 2008, 222, 131–140. [Google Scholar] [CrossRef]
  34. Ou, X.; Zhang, X.; Lowe, T.; Blanc, R.; Norouzi Rad, M.; Wang, Y.; Batail, N.; Pham, C.; Shokri, N.; Garforth, A.A.; et al. X-ray micro computed tomography characterization of cellular SiC foams for their applications in chemical engineering. Mater. Charact. 2017, 123, 20–28. [Google Scholar] [CrossRef]
  35. Wang, N.; Maire, E.; Chenga, Y.; Amani, Y.; Li, Y.; Adrien, J.; Chen, X. Comparison of aluminium foams prepared by different methods using X-ray tomography. Mater. Charact. 2018, 138, 296–307. [Google Scholar] [CrossRef]
  36. Garcia-Moreno, F.; Mukherjee, M.; Jiménez, C.; Rack, A.; Banhart, J. Metal foaming investigated by X-ray radioscopy. Metals 2012, 2, 10–21. [Google Scholar] [CrossRef] [Green Version]
  37. Maire, E.; Elmoutaouakkil, A.; Fazekas, A.; Salvo, L. In situ X-ray tomography measurements of deformation in cellular solids. MRS Bull. 2003, 28, 284–289. [Google Scholar] [CrossRef]
  38. Benouali, A.H.; Froyen, L.; Dillard, T.; Forest, S.; N’Guyen, F. Investigation on the influence of cell shape anisotropy on the mechanical performance of closed cell aluminium foams using micro-computed tomography. J. Mater. Sci. 2005, 40, 5801–5811. [Google Scholar] [CrossRef]
  39. Ulbin, M.; Vesenjak, M.; Borovinšek, M.; Duarte, I.; Higa, Y.; Shimojima, K.; Ren, Z. Detailed analysis of closed-cell aluminum alloy foam internal structure changes during compressive deformation. Adv. Eng. Mater. 2018, 20, 1800164. [Google Scholar] [CrossRef]
  40. Costanza, G.; Mantineo, F.; Missori, S.; Sili, A.; Tata, M.E. Characterization of the compressive behaviour of an Al foam by X-ray computerized tomography. In Light Metals 2012; Suarez, C., Ed.; John Wiley & Sons: New York, NY, USA, 2012; pp. 533–536. [Google Scholar]
  41. Costanza, G.; Mantineo, F.; Sili, A.; Tata, M.E. Characterization of Cu tube filled with Al alloy foam by means of X-ray computer tomography. In TMS 2014 Annual Meeting Supplemental Proceedings; John Wiley & Sons: Hoboken, NJ, USA, 2014; pp. 613–619. [Google Scholar]
  42. Costanza, G.; Sili, A.; Tata, M.E. Mechanical characterization of AISI 316 tubes filled with Al alloy foams. Metall. Ital. 2015, 3, 9–14. [Google Scholar]
  43. Park, C.; Nutt, S.R. Effect of process parameters on steel foam synthesis. Mat. Sci. Eng. A 2001, 297, 62–68. [Google Scholar] [CrossRef]
  44. Bonaccorsi, L.; Garescì, F.; Giacobbe, F.; Freni, F.; Mantineo, F.; Montanini, R.; Sili, A. Applications in metallurgy of X-ray computed tomography with variable focal spot-size and infrared thermography. Metall. Ital. 2013, 7/8, 33–40. [Google Scholar]
  45. Chan, K.C.; Xie, L.S. Dependency of densification properties on cell topology of metal foams. Scripta Mater. 2003, 48, 1147–1152. [Google Scholar] [CrossRef]
  46. Simone, A.E.; Gibson, L.J. Effects of solid distribution on the stiffness and strength of metallic foams. Acta Mater. 1998, 46, 2139–2150. [Google Scholar] [CrossRef]
  47. Simone, A.E.; Gibson, L.J. Aluminium foam produced by liquid-state processed. Acta Mater. 1998, 46, 3109–3123. [Google Scholar] [CrossRef]
  48. Byakova, A.; Gnyloskurenko, S.; Nakamura, T. The role of foaming agent and processing route in the mechanical performance of fabricated aluminum foams. Metals 2012, 2, 95–112. [Google Scholar] [CrossRef] [Green Version]
  49. Jang, W.-Y.; Hsieh, W.-Y.; Miao, C.-C.; Yen, Y.-C. Microstructure and mechanical properties of ALPORAS closed-cell aluminium foam. Mater. Charact. 2015, 107, 228–238. [Google Scholar] [CrossRef]
  50. Khezrzadeh, O.; Mirzaee, O.; Emadoddin, E.; Linul, E. Anisotropic compressive behavior of metallic foams under extreme temperature conditions. Materials 2020, 13, 2329. [Google Scholar] [CrossRef] [PubMed]
  51. Banhart, J.; Baumeister, J. Deformation characteristics of metal foams. J. Mater. Sci. 1998, 33, 1431–1440. [Google Scholar] [CrossRef]
  52. Wu, G.H.; Dou, Z.Y.; Sun, D.L.; Jiang, L.T.; Ding, B.S.; He, B.F. Compression behaviors of cenosphere–pure aluminum syntactic foams. Scripta Mater. 2007, 56, 221–224. [Google Scholar] [CrossRef]
Figure 1. Flow chart of compacted powder method.
Metals 11 01370 g001
Figure 2. CT images (rendering, XY cross sections, XZ and YZ longitudinal sections) of the reference specimen (0.4% TiH2 foam) used for model fitting, at Step 0 state.
Metals 11 01370 g002
Figure 3. Schematic compression stress–strain curve for metal foams.
Metals 11 01370 g003
Figure 4. Assumed reference model for closed-cell structure (adapted from ref. [19]).
Metals 11 01370 g004
Figure 5. Cellular structure and parameters transformation: (a) Real section with local morphological parameters; (b) Intermediate model; (c) Reference model with global parameters.
Metals 11 01370 g005
Figure 6. Results of compression test (0.4% TiH2 foam): sequence of loading curves, final state for each step of compression (CT rendering), overall stress–strain curve.
Metals 11 01370 g006
Figure 7. Processed CT images of section XZ recorded at the end of the compression steps (0.4% TiH2 foam).
Metals 11 01370 g007
Figure 8. Distributions of the equivalent diameter deq at the end of each compression step (0.4% TiH2 foam, XZ section).
Metals 11 01370 g008
Figure 9. Distributions of the circularity C at the end of each compression step (0.4% TiH2 foam, XZ section).
Metals 11 01370 g009
Figure 10. Comparison between experimental curve and simulated curve (correlation model fitted only on Step 0 morphology, 0.4% TiH2 foam).
Metals 11 01370 g010
Figure 11. Simulated curves (correlation model fitted on each compression step morphology, 0.4% TiH2 foam).
Metals 11 01370 g011
Figure 12. Comparison between experimental curve and simulated curve (envelop of results from all compression steps morphology, 0.4% TiH2 foam).
Metals 11 01370 g012
Figure 13. Analysis and comparison of the distributions of the equivalent diameter Deq: (a,b) Longitudinal sections XZ and YZ of reference Specimen 1, as defined in Figure 2; (c,d) Longitudinal sections (randomly chosen) of Specimens 2 and 3.
Metals 11 01370 g013
Figure 14. Analysis and comparison of the distributions of the circularity C: (a,b) Longitudinal sections XZ and YZ of reference Specimen 1, as defined in Figure 2; (c,d) Longitudinal sections (randomly chosen) of Specimens 2 and 3.
Metals 11 01370 g014
Figure 15. Comparison between experimental curve and predictive simulated curve (0.1% TiH2 foam).
Metals 11 01370 g015
Figure 16. Comparison between experimental curve and predictive simulated curve (0.2% TiH2 foam).
Metals 11 01370 g016
Table 1. Specimen geometric data at compression states (0.4% TiH2 foam).
StepsDeformation (%)Initial Height (mm)Final Height (mm)Initial Diam (mm)Final Diam (mm)
Starting Condition (Step 0)--23.33-15.35
Compression (Step 1)13.623.3320.1615.3515.55
Compression (Step 2)23.520.1617.8415.5515.58
Compression (Step 3)33.317.8415.5515.5816.19
Compression (Step 4)43.115.5513.2816.1916.39
Compression (Step 5)52.713.2811.0416.3917.14
Compression (Step 6)61.911.048.9017.1418.11
Table 2. Correlation model: Fitted coefficients and global parameters of cellular structure (0.4% TiH2 foam).
StepsFitted Coefficient of Correlation ModelGlobal Parameters of Structure
γpγsλc1c3ξψw [μm]d [μm]tp [μm]ts [μm]
Step 00.871.042.870.100.961.940.40120616568195
Step 11.021.123.270.100,982.110.44146519582266
Step 21.521.163.860.101.002.130.431828190106409
Step 31.571.124.230.100.972.040.401897173113478
Step 41.421.084.710.100.961.990.37153914891426
Step 51.441.145.340.101.001.900.35107511563337
Step 61.491.205.460.100.971.810.32121012378424
Table 3. Correlation model: Relative density and parameters of simulated compression curve (0.4% TiH2 foam).
StepsRelative DensityParameters of Simulated Curve
ερfs (Equation (3))ρfs (Interpolation)Ef [GPa]σpl [MPa]εdεo
Step 00.0000.2170.886ε3 − 0.161ε2 + 0.156ε + 0.215
(R2 = 0.997)
0.626.010.7010.567
Step 10.1360.2280.666.500.7290.606
Step 20.2350.2600.788.020.7280.603
Step 30.3330.287 0.899.440.7380.617
Step 40.4310.318 1.0211.180.7540.638
Step 50.5270.381 1.3115.020.7580.640
Step 60.6190.461 1.7120.650.7690.648
Table 4. Relative density and parameters of simulated compression curve: comparison between longitudinal sections XZ and YZ of reference Specimen 1, as defined in Figure 2.
SectionsRelative DensityParameters of Simulated Curve
ρfsEf [GPa]σpl [MPa]εdεo
Specimen 1 XZ0.2170.626.010.7010.567
Specimen 1 YZ0.2130.615.840.7060.574
Table 5. Relative density and parameters of simulated compression curve: comparison between longitudinal sections of Specimen 1 (XZ), Specimen 2, and Specimen 3.
SectionsRelative DensityParameters of Simulated Curve
ρfs Ef [GPa]σpl [MPa]εdεo
Specimen 10.2170.626.010.7010.567
Specimen 20.2240.656.330.6910.552
Specimen 30.2120.605.800.7070.576
Mean Value0.2180.626.050.7000.565
Standard Dev0.0060.030.270.0080.012
Table 6. Theoretical and experimental parameters of compression curves.
FoamType of Dataσpl [MPa]εd
4% TiH2Experimental8.500.727
Step 0 Curve6.00 (29.4%)0.701 (3.6%)
All Steps Curve8.20 (3.5%)0.715 (1.6%)
1% TiH2Experimental15.800.605
Step 0 Curve9.70 (38.6%)0.581 (3.9%)
All Steps Curve13.27 (16.0%)0.598 (1.1%)
2% TiH2Experimental11.200.693
Step 0 Curve7.58 (32.3%)0.655 (5.5%)
All Steps Curve9.97 (11.0%)0.669 (3.5%)
Table 7. Comparison of accuracy in compressive parameters simulation: proposed analytical model vs. numerical models from the literature.
ModelSpecificationsρfsσpl (%)εd (%)Ref.
PAM4% TiH20.2173.51.6
1% TiH20.29416.01.1
2% TiH20.25111.03.5
NM1Circular 10.60027.2[20]
Elliptic0.6004.3
Rectangular0.57035.8
Square0.61068.5
NM2Multicell 20.0833.45.9–7.3[21]
0.1097.44.0–4.5
NM3Uniform Density 30.10050.0[17]
Randomized Density 40.081-0.1436.5
NM4WCSH Model 50.12032.0[19]
0.15016.0
0.2006.0
NM5Voronoi Model0.11712.03.5[30]
0.17211.012.0
1 Cell shapes. 2 Model with cells of different shapes (spheric, elliptic, cubic). 3 Multilayer model with uniform density. 4 Multilayer model with densities randomly distributed. 5 Weaker-cruciform-stronger-hemisphere model.
Publisher’s Note: MDPI stays neutral with regard to jurisdictional claims in published maps and institutional affiliations.

