2. Materials and Methods
When conducting natural experiments, cylindrical parts with a diameter of
d = 32 mm and a height of
b = 20 mm, made of steel of 45, 60 and U8 grades, were used. The composition of the original material was determined using the optical emission spectrometer “ARL 3460” (Erich Wiesmüller, Korneuburg, Austria). The detection limit by the control elements in steel was no more than 0.01%. The relative mean square deviation of the random component of the error, when measuring the mass fractions of control elements in steel (with
n = 10), was no more than 2.5%. The experimental results are presented in
Table 1,
Table 2 and
Table 3.
To integrate the processes of mechanical and surface thermal treatment, the thread-cutting lathe of the “UT16PM” (Ulyanovsk Machine-Building Plant, Ulyanovsk, Russia) model was modernized. This modernization consisted of equipping the machine-tool system with a supplementary concentrated power source. A remote hardening scheme, implementing high-energy heating with high-frequency currents (HEHHFC), was used as a concentrated power source. A thyristor-type generator “SVCH-10” (UralInduktor, Miass, Russia) with a current operating frequency of ω = 400 × 103 Hz was used as a power source.
During surface quenching, a serpentine inductor (NSTU, Novosibirsk, Russia), equipped with ferrite of the N87 grade with a magnetic permeability of
μi = 2200, was used (
Figure 1). The heating was carried out according to the deep-laid scheme by the continuous-sequential technique. In this case, the thickness of the strengthened layer did not exceed the depth of penetration of the current into the hot metal equal to 0.6…0.8 mm. The processing modes were as follows: specific power of the source—
qs = (1.5–4.0) × 10
8 W/m
2; the travel rate of the part under the inductor was
Vw = (0.05–0.1) m/s. The width of the active inductor wire was
Rs = 1.2 mm. The processing was carried out with a clearance of
δ = 0.1–0.2 mm. Intensive water (shower) cooling of the surface was used.
The structure was studied using the optical microscope “Carl Zeiss Axio Observer Z1m” (ZEISS, Köln, Germany). To identify the microstructure of the samples, etching with a 5%-alcoholic solution of nitric acid and a saturated solution of picric acid in the ethyl alcohol, supplemented with surface-active substances, was carried out [
12]. The “Wolpert Group 402MVD” device (Yumpu, Diepoldsau, Switzerland) was used to assess the microhardness of the hardened surface layer of the part. The measurement accuracy corresponded to standards EN-ISO 6507, ASTM E384, E92 and JIS. The digital encoder resolution was 0.1 µm.
The behavior of the phase transformations, the resulting structure and the depth of quenching, including the grain size of austenite, depend on the integral temperature–time heating effect on the steel structure and are therefore determined by the shape of the thermal curve [
5,
7,
12]. Due to the difficulty of controlling the temperatures and heating rates to specify the hardening modes of using concentrated power sources, mathematical simulation of the processes occurring in the material surface layers during surface quenching has become widespread [
5,
12].
The average speed and the maximum heating temperature, as the main parameters for the surface quenching modes, are not accurate enough to characterize the temperature and time conditions of phase transformations during steel austenitization. In addition to these parameters, it is necessary to take into account the average cooling rate and the time of the material’s residence within the temperature range of phase transformations. Therefore, the processing modes should be specified in such a way as to provide the necessary thermal cycles with the specified parameters in the surface layers of the material. As shown in certain studies [
5,
12], it is not possible to establish an unambiguous relationship between the numerical values of these parameters with the processing modes and the quality characteristics of the hardened layer. However, it is obvious that the numerical values of the parameters of thermal cycles are determined by the amount of transmitted power and the nature of its distribution in the material.
In this regard, based on certain works [
5,
7,
12], we propose using the integral temperature–time characteristic
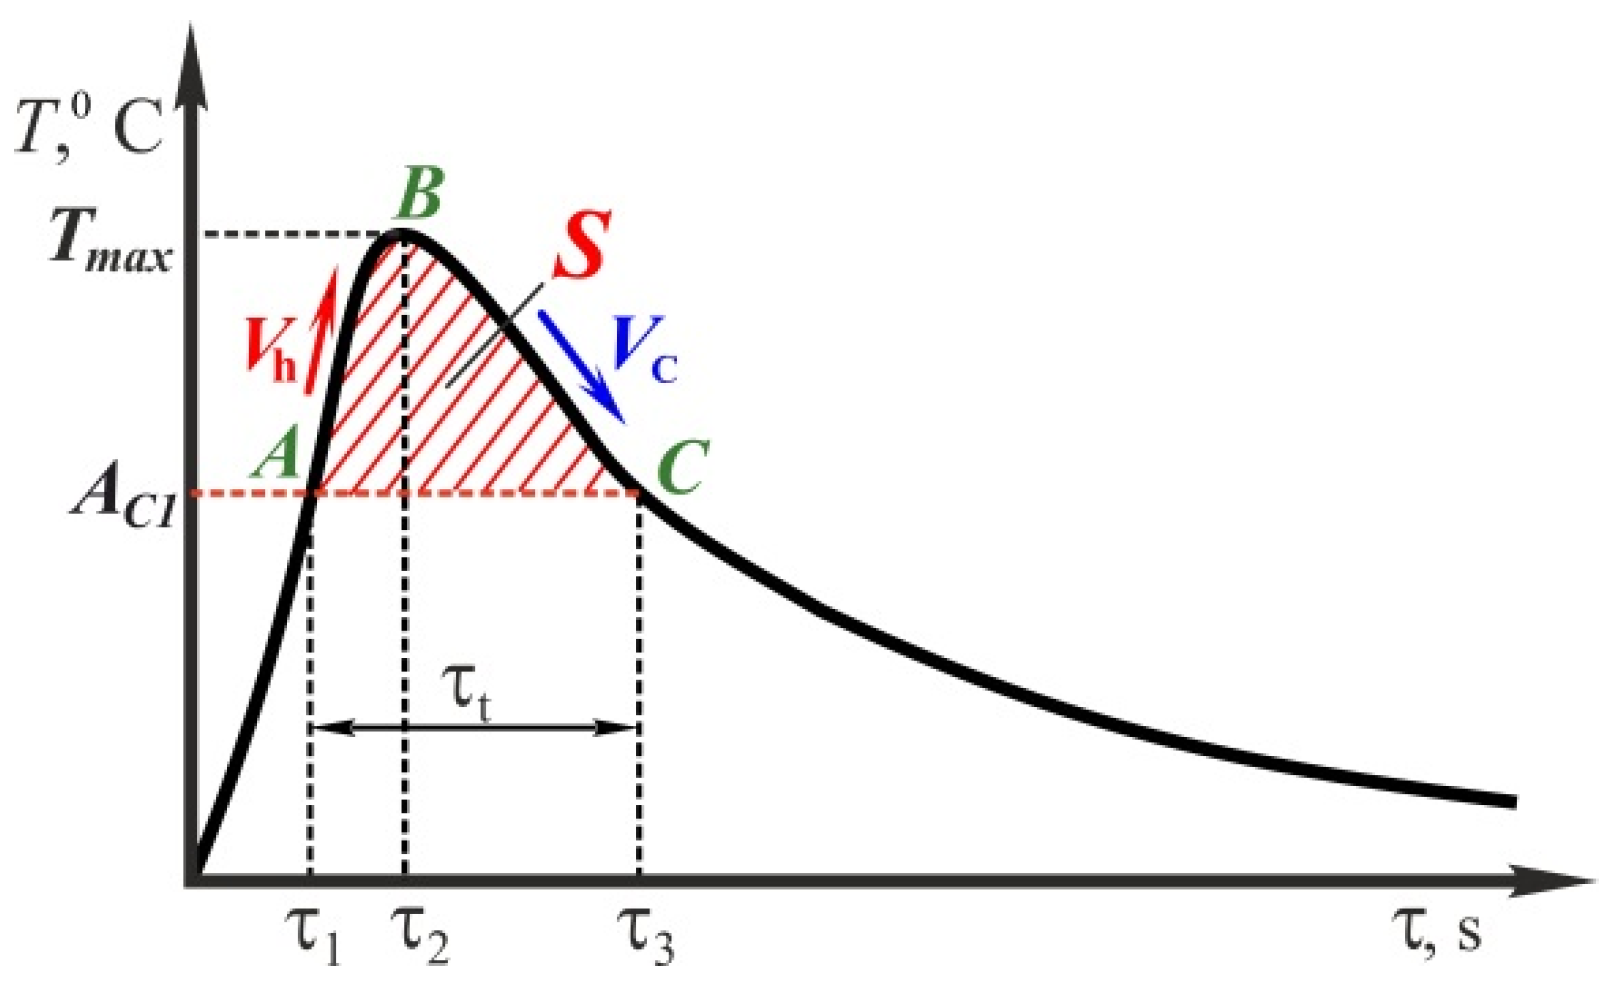
S, which combines all the listed parameters of thermal cycles, as the main parameter for specifying the surface quenching modes. The process of austenite formation takes place in the time period of
τt =
τ3 −
τ1 (
Figure 2) regardless of whether the thermal curve is ascending or descending in this time period. This means that the total time τ
B and the temperatures at which the austenitization process occurs can be characterized by the area (
SABC), bounded at the top by the heating curve and at the bottom by the straight line corresponding to the temperature
AC1:
The physical meaning of this characteristic becomes clear, proceeding from:
where
Q is the power, J;
RT is the thermal resistance of the material, °C·s/J.
The thermal resistance of a metal is the ability of a material to resist heat transfer. Let us consider a metal heated above the temperature
AC1. In this case, the numerical value of the metal’s thermal resistance depends not only on the thermal conductivity coefficient, but also on the structural phase transitions that mainly occur endothermally in this temperature range, accompanied by heat absorption. In other words, this characteristic indirectly determines the amount of power transmitted to the material and spent on structural phase transformations. It can be easily calculated based on the dependence (1) during simulation of the temperature fields in the material [
5,
7,
12].
Based on the above-mentioned, in order to develop a method for specifying surface quenching modes in hybrid processing conditions, it is necessary to establish the relationship between the numerical values of the integral temperature–time characteristic and the processing modes on the one hand, and the hardening depth on the other. This problem is solved by concurrent simulation of temperature fields and structural phase transformations in the material [
12].
By means of the finite-element simulation of temperature fields in the material, during high-energy heating with high-frequency currents, parameters of thermal cycles (heating rate, maximum heating temperature, cooling rate and the time of the material’s residence above the point AC1) were obtained in each surface layer under study depending on processing modes (rate and specific power). Then, the process of steel austenization was simulated. Based on these data, the decay of the resulted austenite was analyzed at the cooling stage. It is sufficient to use thermal-kinetic austenite decay curves for the appropriate steel grade in the material layers where complete austenite homogenization takes place. In this case, having values of cooling rates in the temperature range of the least stability of austenite and in the temperature range of martensite formation, i.e., having a cooling curve, it is possible to forecast the percentage of the composition of structures formed during austenite decay, and the microhardness level typical of this composition of structures. At the same time, it is necessary to note that the highly dispersed structure of martensite is to be obtained in cases when austenite homogenization finishes at the same moment the material leaves the phase transition temperature band.
The finite element model was constructed using the software packages ANSYS and SYSWELD, using numerical methods for solving differential equations of transient heat conduction (Fourier equation), carbon diffusion (Fick’s 2nd law) and elastoplastic behavior of the material.
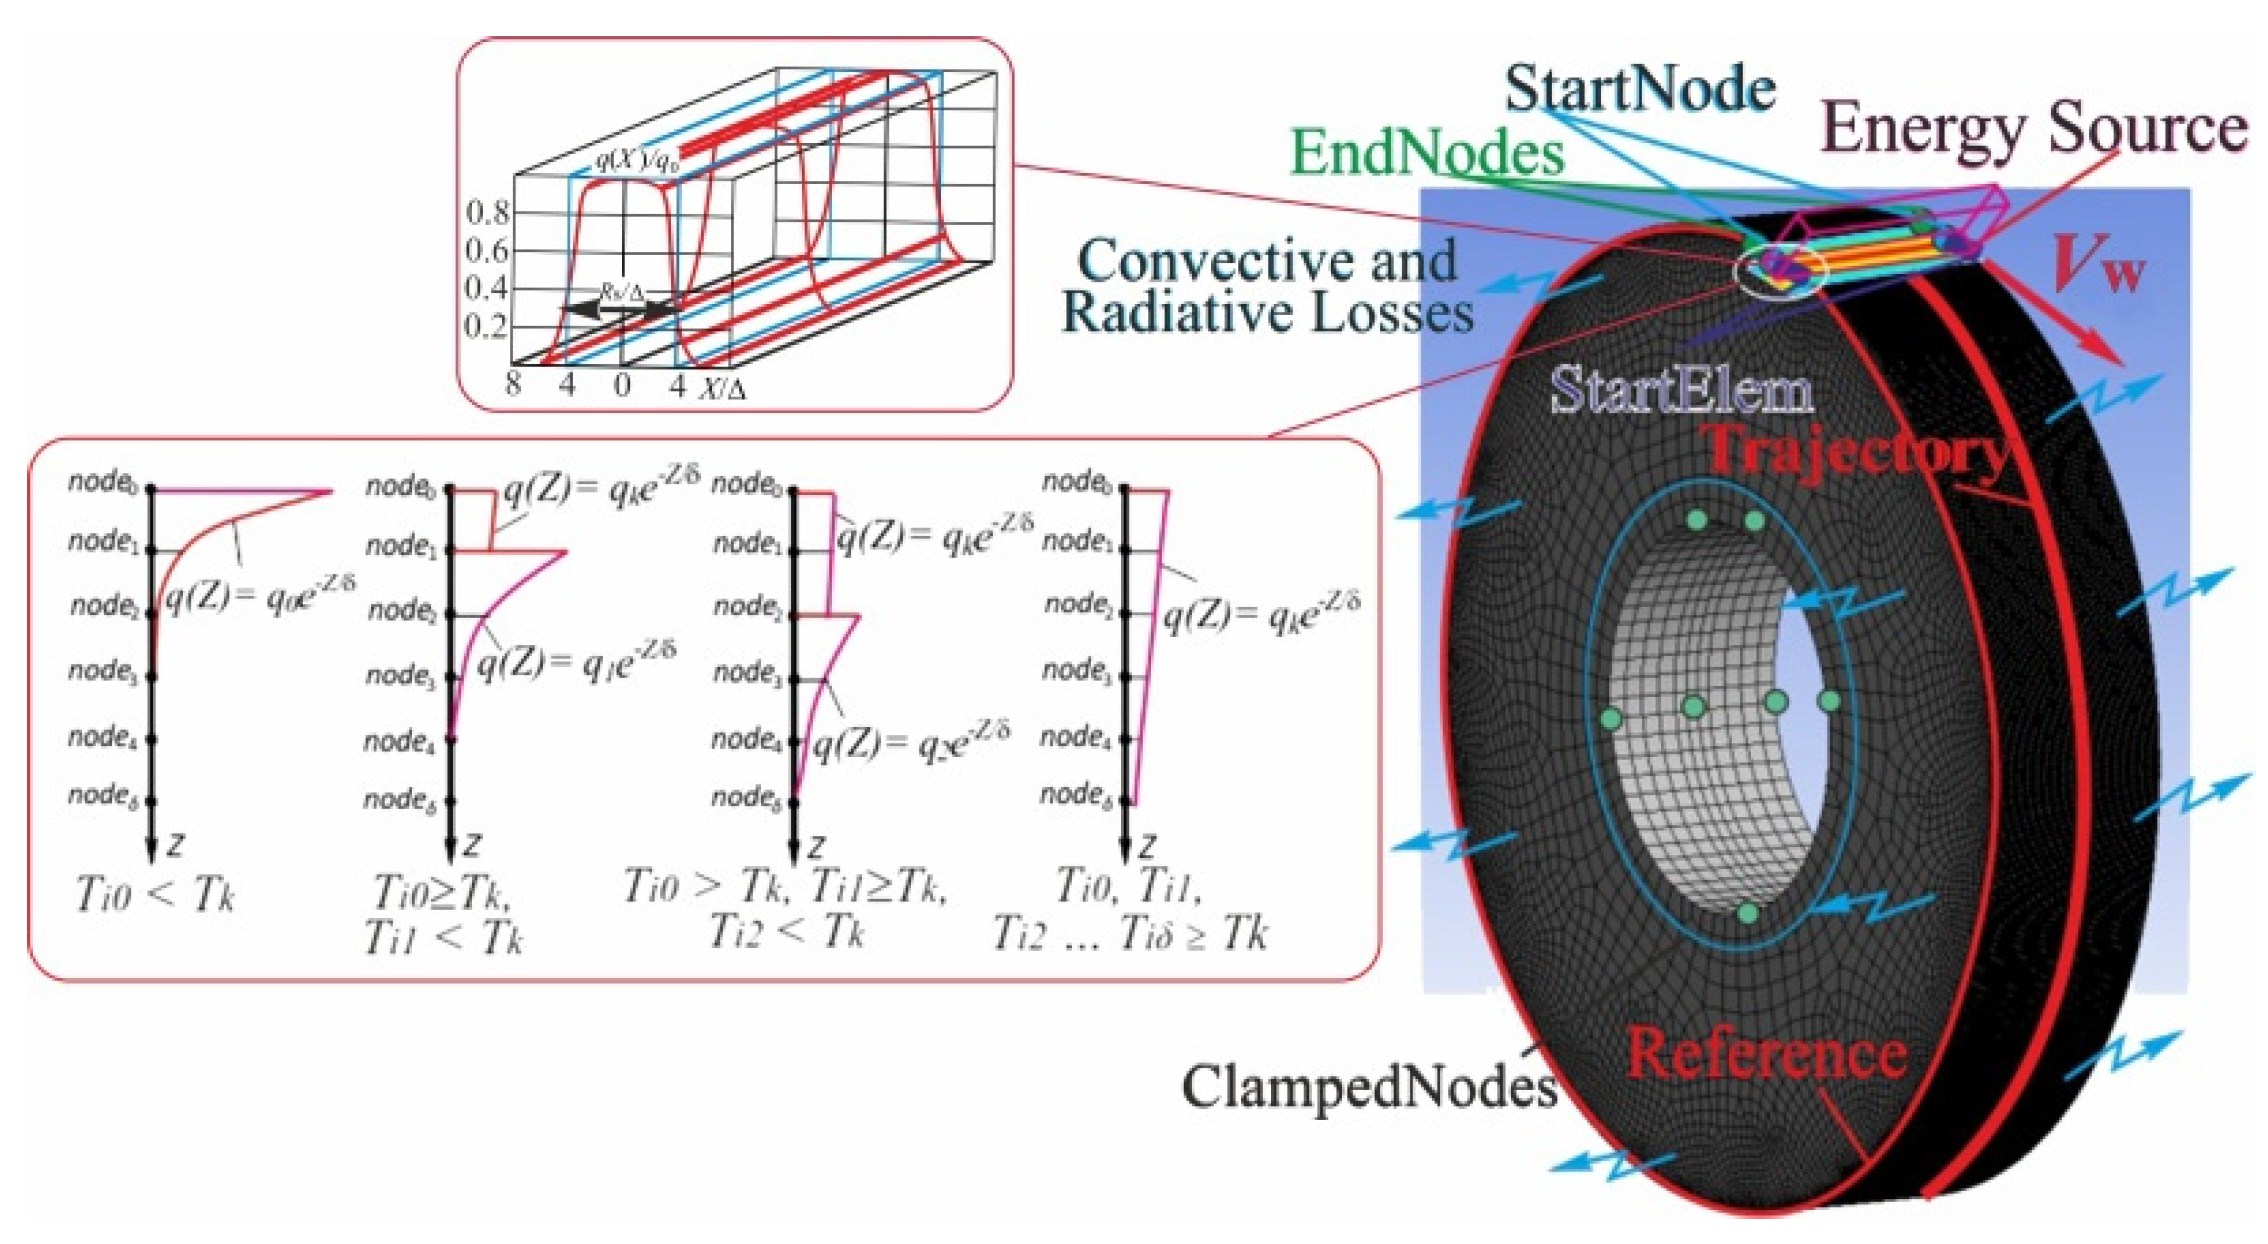
The finite element model was prepared in the ANSYS software (version 19.1, Canonsburg, PA, USA) package. The ANSYS Meshing generator formed a hexahedral mesh using the following types of finite elements: solid bodies were simulated with 8-node SOLID 45 tetrahedra; surface bodies were modeled with 4-node 4-angle shell-type elements–SHELL 63; line bodies were simulated with 2-node linear elements LINK 8. The size of the finite elements was 0.01…1 mm. When creating a finite element model, the following components are created. The first component is “Volume”, a group of three-dimensional elements denoting the processed object. The second component is “Trajectory”, a group of one-dimensional elements that determines the motion pattern of a high-concentration energy source. The third is “Reference”—a reference equidistant—a group of one-dimensional elements that contributes to the orientation of the local coordinate system of the energy source. The fourth component is “StartElem”, starting elements of the beginning of the source operation. The fifth is “StartNodes” and “EndNodes”—starting and end nodes on the motion pattern. The sixth component is “Skin”, a group of two-dimensional elements denoting the surfaces along which convective and radiative heat losses occur. The last one is “ClampedNodes”, a group of nodes along which the disk is fixed (
Figure 3).
The process of high-energy heating by high-frequency currents was simulated in the SYSWELD software (version 2010, Rungis, France) package, which allows for the use of a model of the elastic-viscoplastic behavior of the material and the modern mathematical apparatus, the calculation of temperature fields, and the distribution of structural components, internal stresses and deformations. During the preparation of the finite element model, the specific character of the distribution of the specific power of the HFC heating source directly under the inductor and throughout the depth of the material was taken into account [
7,
12].
3. Results and Discussion
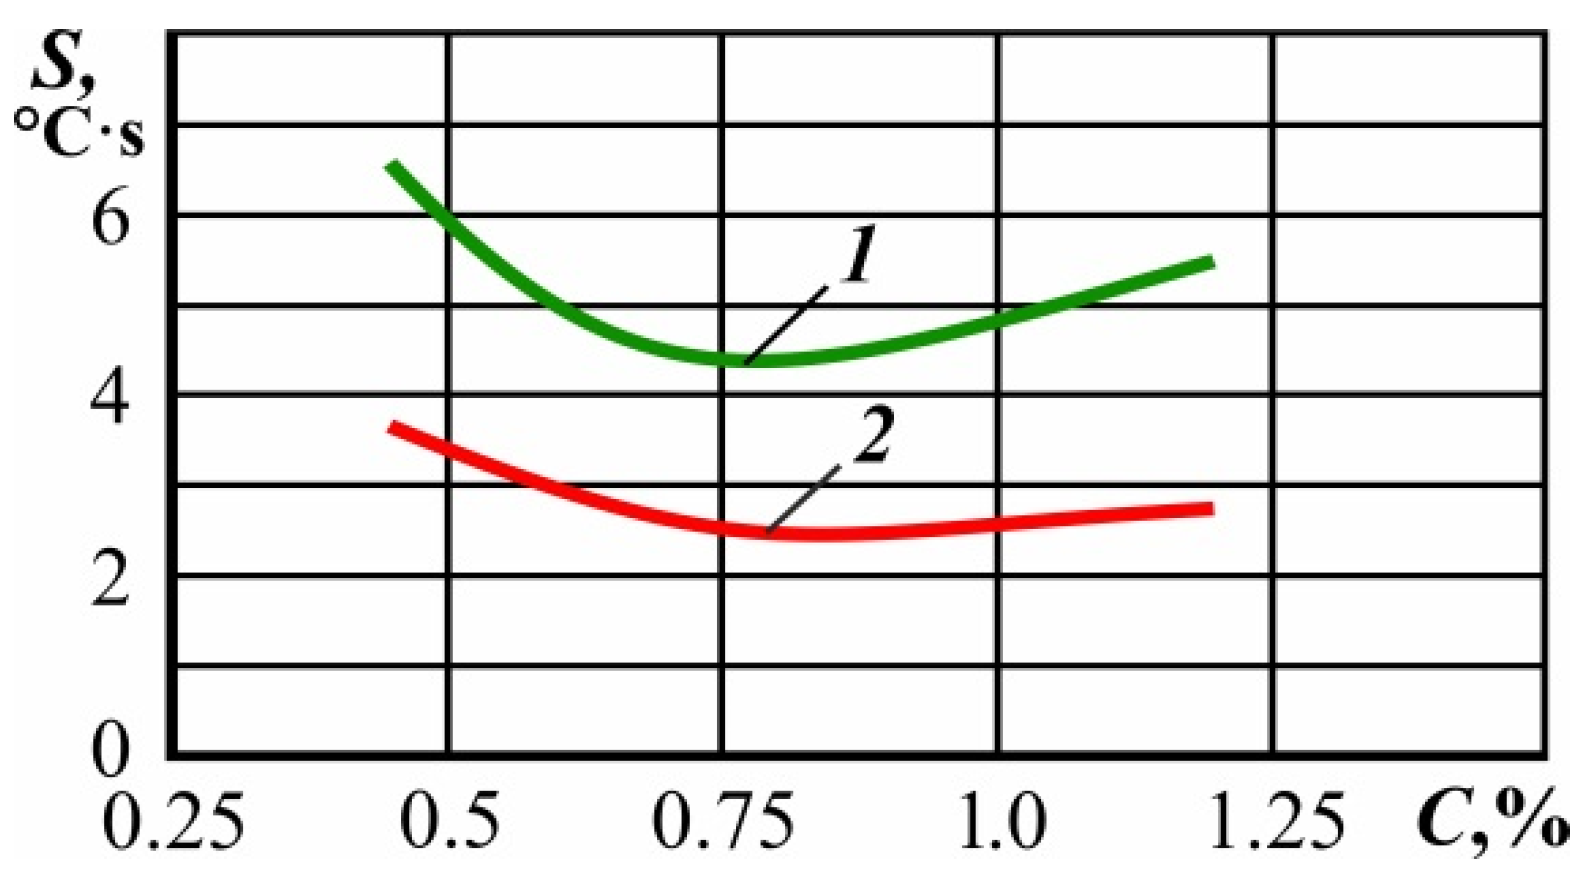
Based on the results presented in
Figure 4, the required minimum values of the characteristic
S, appropriate for the production of a hardened layer, vary within (4.3 >
S > 2.5) °C·s. The dependence data (
Figure 4) were obtained as a result of the concurrent simulation of temperature fields and structural phase changes in the material. Further, line 2 represents a minimal value of the characteristic S for obtaining 50% of martensite after cooling. However, as the numerical and field experiments show, in most cases, the maximum values of the characteristic exceed the above-mentioned values.
This happens because the distribution of the characteristic S values throughout the depth of the material is primarily not uniform. The lower the depth of the hardened layer, the closer the S characteristic values are to the recommended values, which additionally confirms the greater efficiency of the deep heating scheme in relation to the surface one.
The maximum values of the characteristic S when realizing the deep heating scheme are at 6.2 °C⋅s, and those of the surface heating scheme are at 500 °C⋅s. Therefore, in the surface heating scheme, the surface layers of the material are subject to an excess amount of power in relation to the value required for the austenite homogenization. This eventually leads to the growth of the austenitic grain, and hence to the formation of a larger martensite structure during cooling.
The regularity of the changes to the value of the characteristic S corresponds to the nature of the changes to the values of the maximum temperatures at the depth of the material. The maximum values of this characteristic for these power sources are reached at a depth of about 0.2 mm. Based on this, it is possible to establish the dependence of the characteristic S value at the depth of 0.2 mm on the value of the resulting hardened layer.
The surface quenching of steels 45, 60 and U8 by HEH HFC is presented by the following dependence:
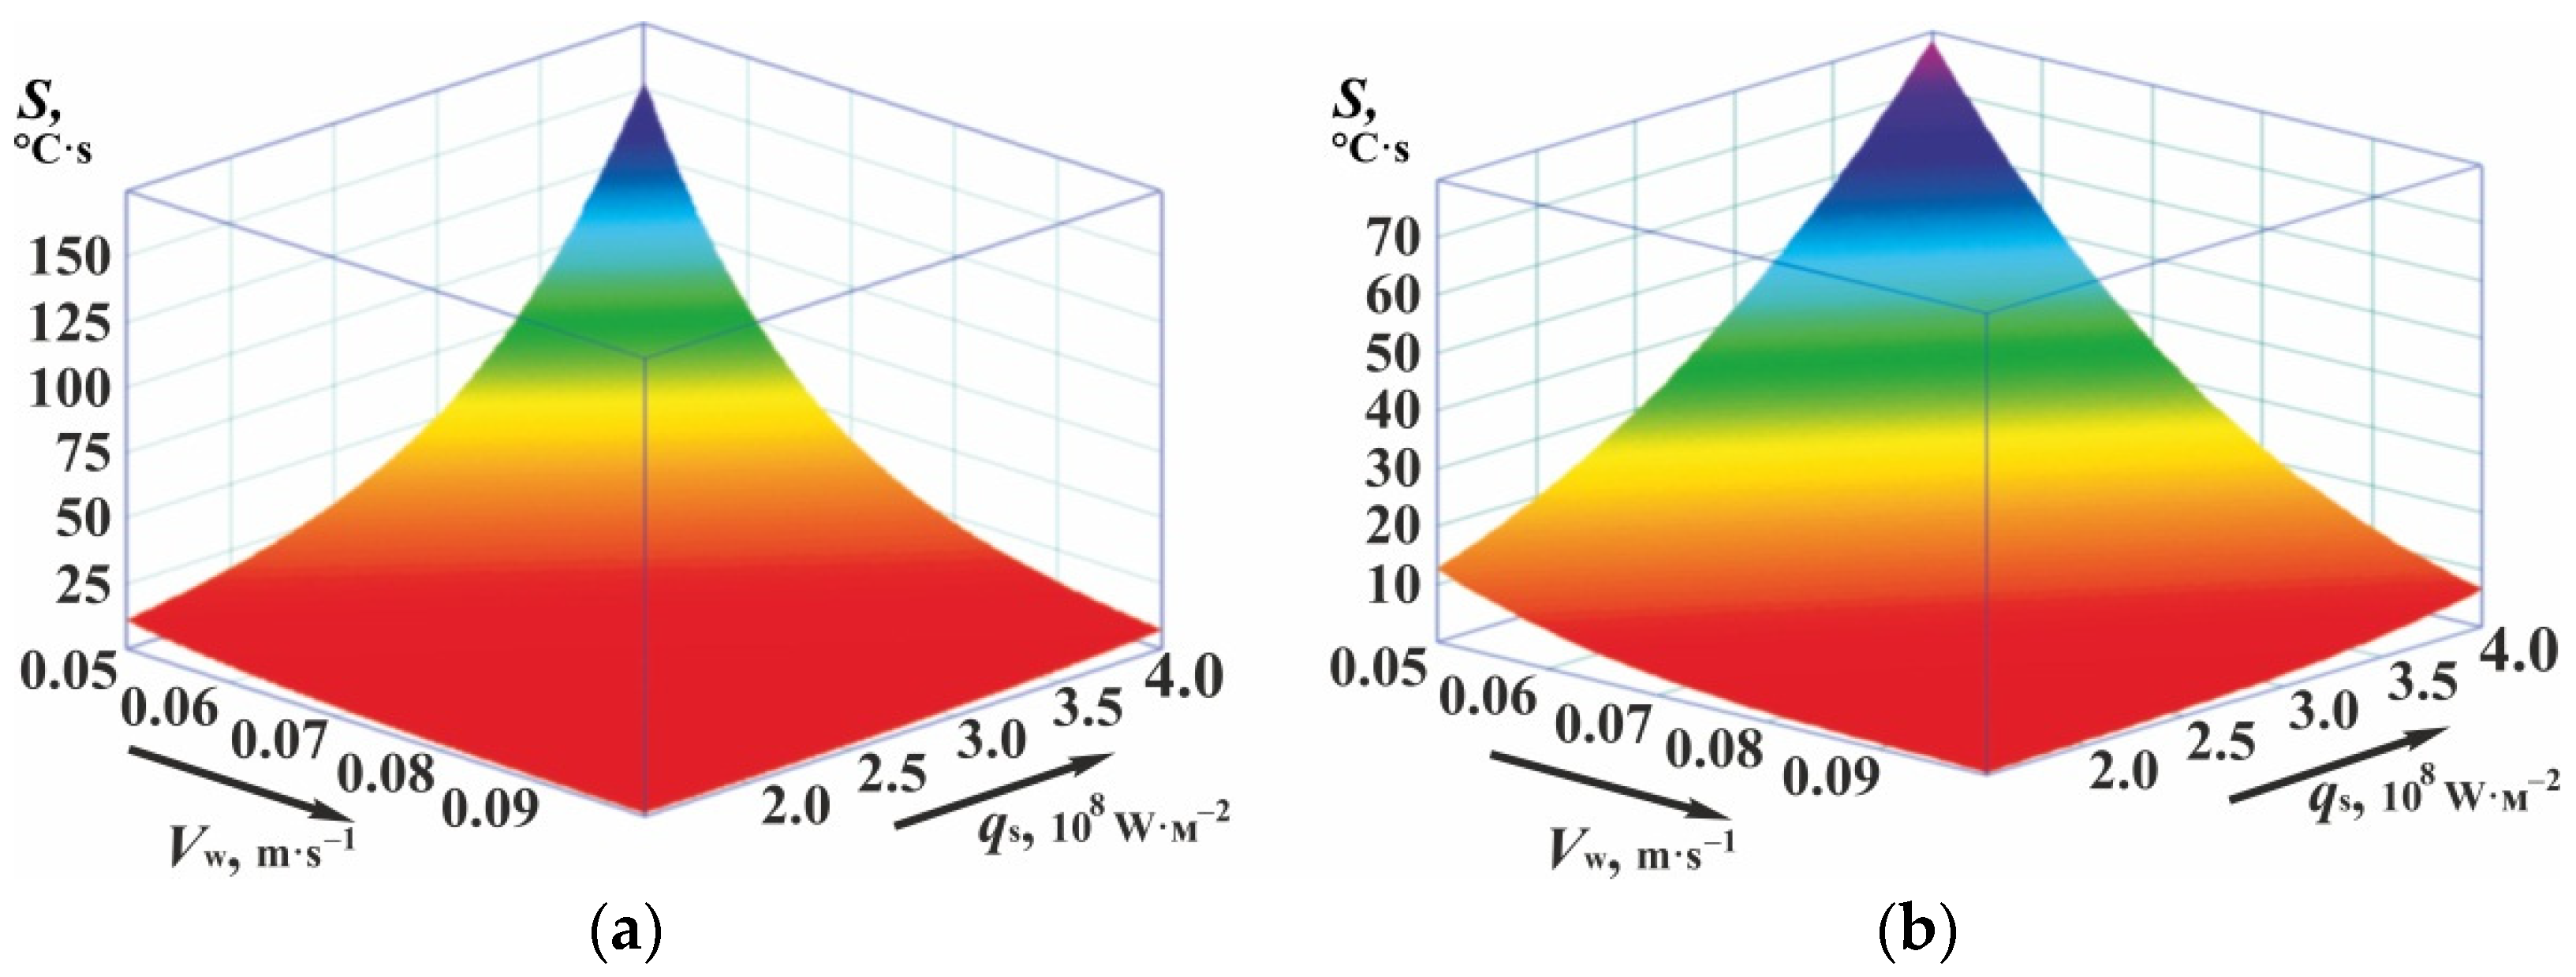
To establish the functional dependence of the integral temperature–time characteristic S on the technological processing modes, the experimental data were processed using the software products STATISTICA 6.0 (StatSoft, Tulsa, OK, USA) and Table Curve 3D v 4.0 (Merck, Darmstadt, Germany). The maximum error did not exceed 5%. In this case, the specific power and the travel rate of the heating source are taken as variable values. This depends primarily on the fact that the changes to the size of the HEH HFC source are associated with the time-consuming manufacture of a new inductor. Therefore, in case of induction heating, it is customary to initially set the size of the source, and then to select two other technological parameters.
Figure 5 shows the results of these studies through the examples of the surface quenching of steels U8 and 45 using HEH HFC.
In this way, there is the established dependence of the characteristic
S on the depth of hardening on the one hand, and on the processing modes on the other. This allows for the specification of rational modes of the surface hardening of steel parts, for example, operating purely in conditions of wear. For these types of parts, the hardness and depth of the hardened layer are the main technological parameters. The desired hardness of the hardened layer is obtained by selecting the appropriate grade of steel, while the required depth of hardening is provided using appropriate technological modes [
5,
7,
12].
Let us consider the proposed method for specifying surface quenching modes providing only the depth of the quenched layer in the following example.
It is required to harden a cylindrical disc-type part (
Figure 1) made of the 45-grade steel and the U8 steel by applying HEH HFC. Its height is
b = 20 mm, diameter (
d) = 32 mm (respectively, its circumference is
l ≈ 100 mm), with a width of the active inductor wire of
Rs = 2 mm to a depth of
h1 = 0.5 mm and
h2 = 0.7 mm.
According to the depth of the hardened layer (
h), specified in the drawing and based on the dependencies (2) and (4), we obtain the values of the integral temperature–time characteristic
S. This characteristic must be achieved at a depth of 0.2 mm, equal, respectively, for steel U8 with
h1—5.74 °C·s and
h2—13.46 °C·s; for steel 45 with
h1—7.485 °C·s and
h2—17.83 °C·s. Further, based on these values of the characteristic
S, according to the functional dependencies (
Figure 5a,b), we obtain the functional dependence of technological modes
Vw and
qs.
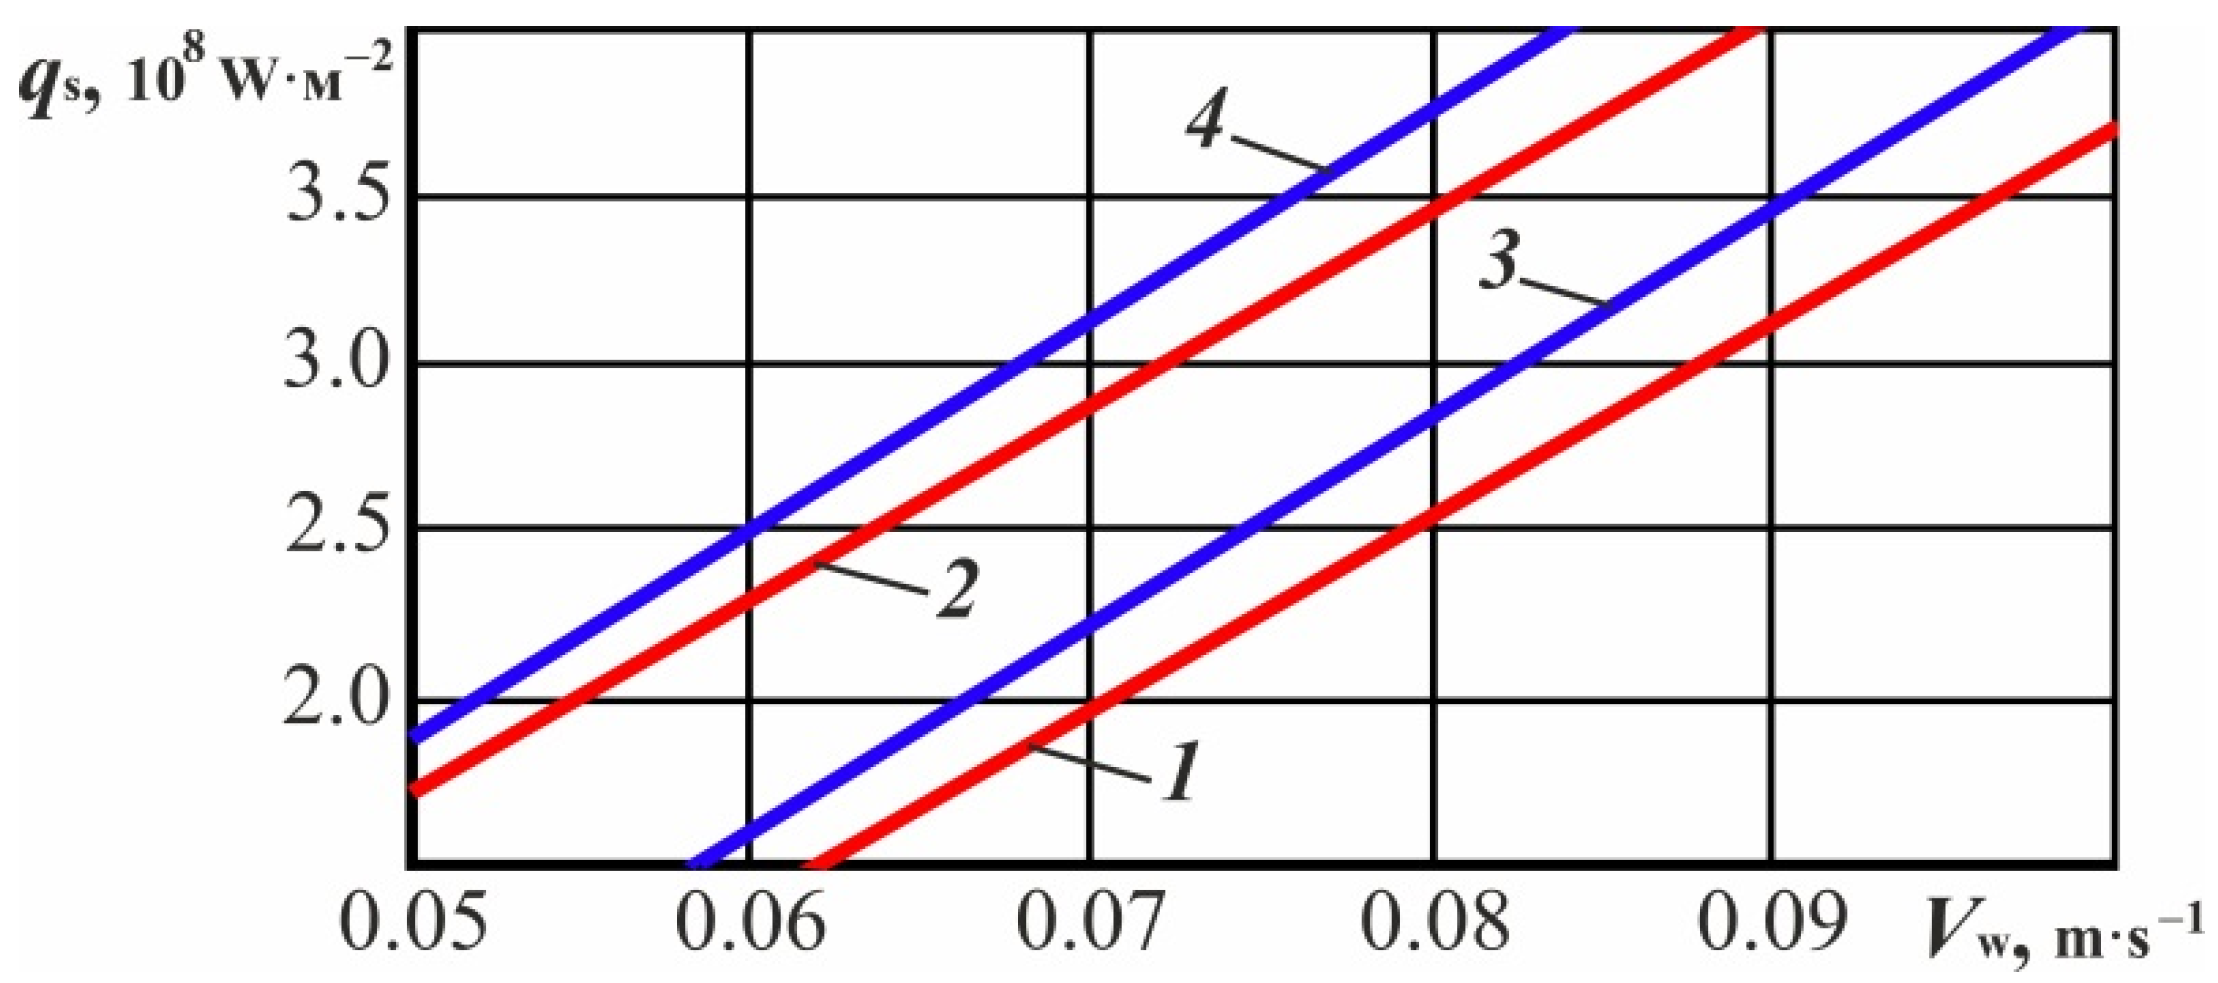
Figure 6 shows the surface sections for steel 45 (see
Figure 5b) and steel U8 (see
Figure 5a) with the appropriate values of the characteristic
S. Any combination of modes (
Vw and
qs) that corresponds to these dependencies allows for the achievement of the target value of the integral characteristic at the depth of 0.2 mm, and therefore provides the specified depth of hardening under appropriate cooling conditions.
The proposed method for specifying surface hardening modes in hybrid processing conditions was tested based on real samples.
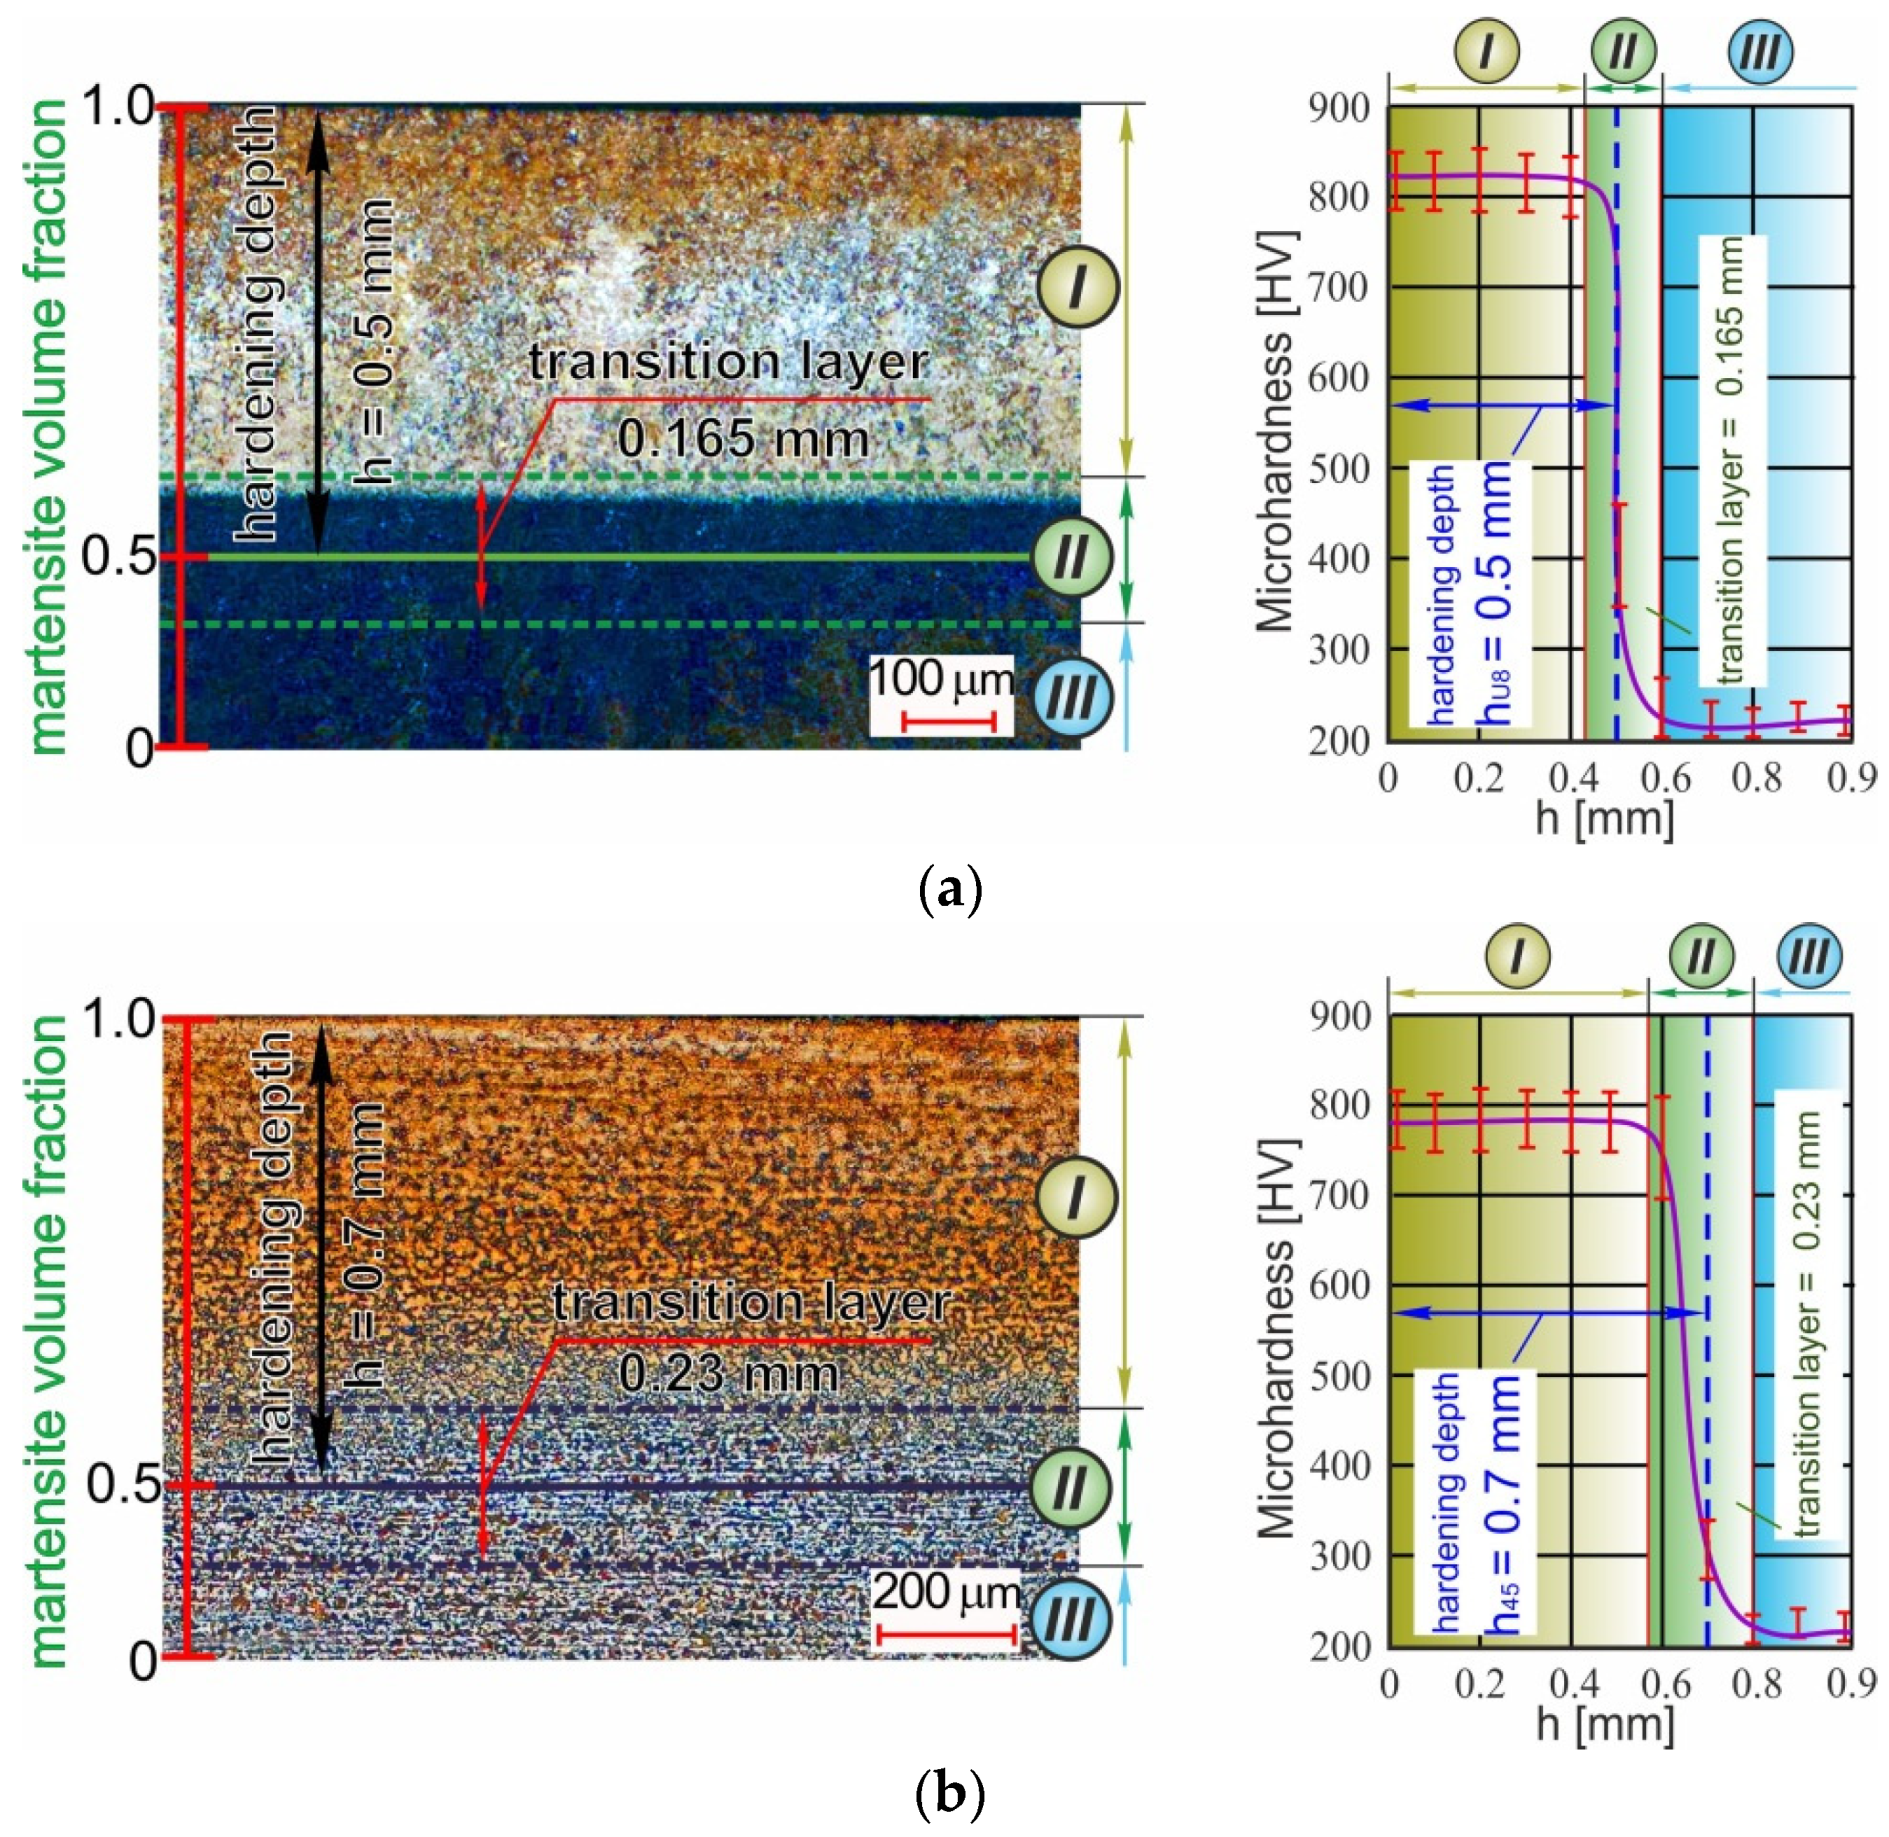
Figure 7 presents the results of the optical microscopy and microhardness measurement data. Analyzing the distribution graphs of the surface layer microhardness, one can specify three typical zones (
Figure 7a,b). Zone I is characterized by a stable average value of the microhardness level. Zone II is a transitional area. Zone III is an area that is not subject to structural and phase changes. Let the depth of the hardened layer be the distance from the surface to the zone with a structure containing 50% of martensite. In its turn, the transition layer is a zone between the surface layer of the hardened steel with a stable average level of microhardness and a zone of the material where no structural phase changes have occurred. It is theoretically proven and experimentally confirmed that the established relationship between the integral temperature–time characteristic and the depth of hardening on the one hand, and the processing modes on the other, provides the required depth and hardness of the hardened layer. In this case, it becomes possible to guarantee the required relative size of the transition layer, which creates conditions for a rational distribution of residual stresses over the depth of hardening.
Owing to the fact that the efficiency of any processing is evaluated according to the criteria of increasing the capacity and reducing power consumption, we compared these characteristics within the resulting range of modes. The processing capacity (technological performance—
TP) is calculated according to the actual (machining) time (
τm):
Therefore, it increases in direct proportion to the travel rate of the heating source.
The processing power consumption (
E) is evaluated according to the following dependence:
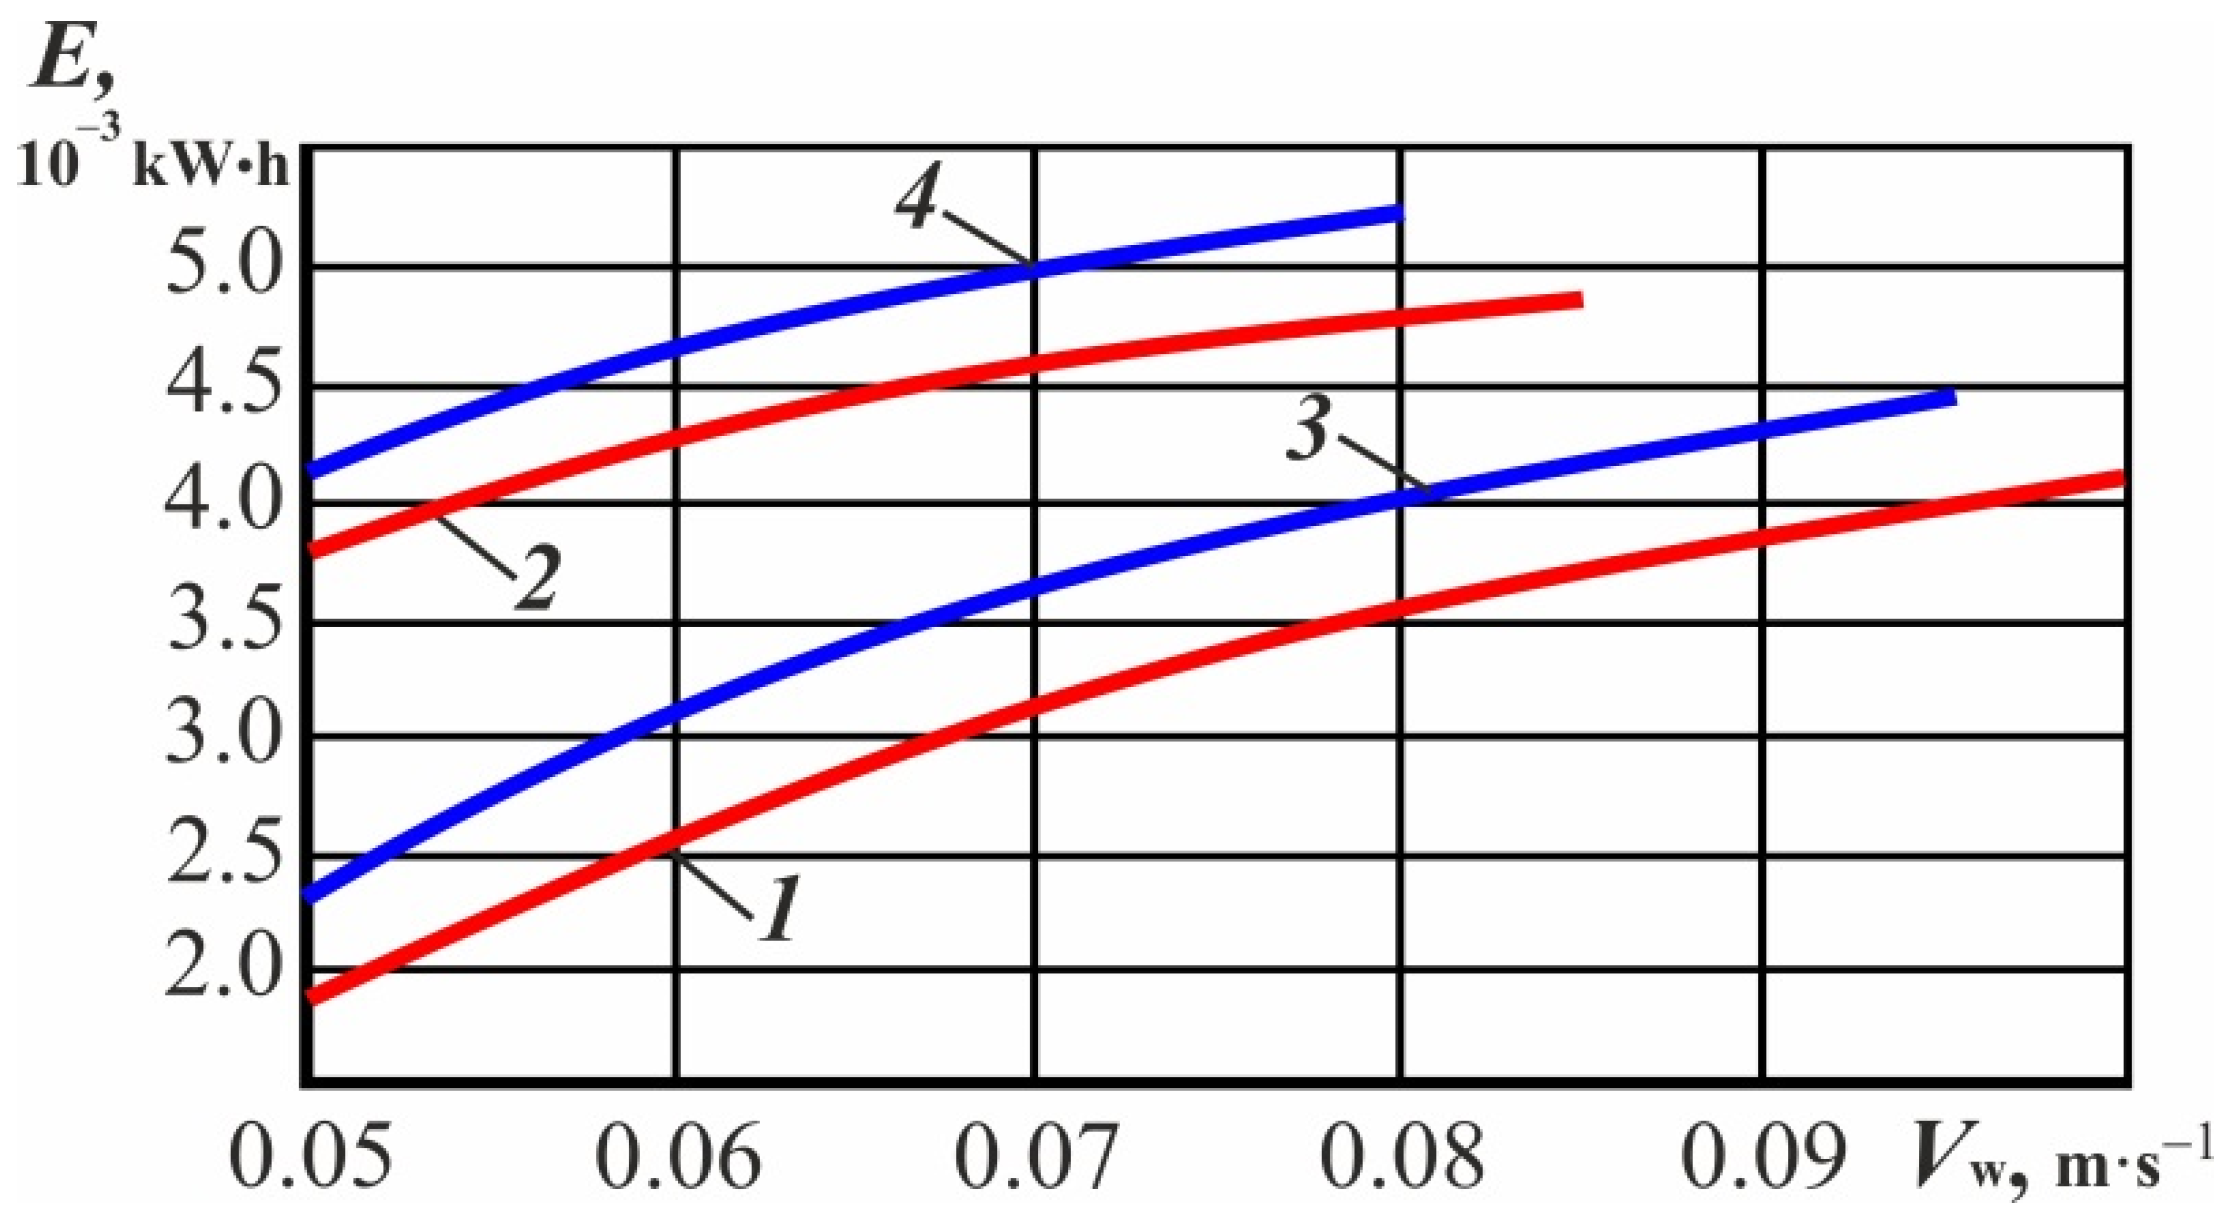
The results of power consumption calculations for the range of modes appropriate for curves 1–4 (
Figure 6) are shown in
Figure 8.
The results of the numerical simulation showed (
Figure 8) that the increase in the capacity was accompanied by a corresponding increase in processing power consumption. Let us compare the minimum and maximum combinations of modes of the obtained range:
(1) when quenching the U8 steel to a depth of 0.5 mm: , , , , and the capacity was doubled, while the power consumption increased 2.15 times. Consequently, the increase in power consumption was 1.075 times higher than that in the capacity;
(2) when quenching the 45-grade steel to a depth of 0.5 mm: , , , , the capacity increased 1.9 times, and the power consumption increased 2.04 times. Consequently, the increase in power consumption was 1.074 times higher than that in the capacity;
(3) when quenching the U8 steel to a depth of 0.7 mm: , , , , the capacity increased 1.7 times, and the power consumption increased 1.29 times. Consequently, the increase in power consumption was 1.32 times higher than that in the capacity;
(4) when quenching the 45-grade steel to a depth of 0.7 mm: , , , , the capacity increased 1.6 times, and the power consumption increased 1.25 times. Consequently, the increase in the capacity was 1.28 times higher than that in power consumption.


