Article

Two-Stage Model for Fatigue Life Assessment of High Frequency Mechanical Impact (HFMI) Treated Welded Steel Details

1
Institut IGH d.d., Janka Rakuše 1, 10000 Zagreb, Croatia
2
Faculty of Civil Engineering, University of Zagreb, Kačićeva 26, 10000 Zagreb, Croatia
3
Centre Technique Industriel de la Construction Métallique (CTICM), Espace Technologique, Route de l’Orme des Merisiers, 91193 Saint-Aubin, France
*
Author to whom correspondence should be addressed.
Metals 2021, 11(8), 1318; https://doi.org/10.3390/met11081318
Submission received: 16 July 2021 / Revised: 9 August 2021 / Accepted: 17 August 2021 / Published: 20 August 2021
(This article belongs to the Special Issue Fatigue Failure Assessment of Metallic Materials)

Abstract

:
Welded steel details are critical components from the aspect of fatigue. Additional fatigue resistance can be achieved by the High-Frequency Mechanical Impact (HFMI) treatment. This treatment increases the crack initiation period by improving the weld geometry, introducing compressive residual stresses, and increasing the weld toe’s hardness. The study presented in this paper is based on the development and calibration of an Initiation–Propagation-based Two-Stage Model (TSM), which is, by the combination of different methods, suitable to separately consider crack initiation and crack propagation. It is shown that a TSM is able to predict the fatigue life of as-welded and HFMI-treated welded steel details, which is proven by comparing the calculated results with the results of tests on similar details given in the literature. A parametric study of the TSM is conducted for different steel grades in order to investigate the influence of steel strength and HFMI parameters on fatigue lives of a welded steel detail with longitudinal attachment.

1. Introduction

Fatigue in welded steel structures such as bridge structures, crane runway beams, offshore structures, wind energy supporting structures, etc. is a progressive and localised process of damage accumulation in a material due to cyclic stresses. The magnitude of cyclic stresses is often below the material yield strength. The fatigue life of steel structures consists of a crack initiation and crack propagation period. While unwelded details show more extended periods of crack initiation, in the welded details, the period of crack propagation has a dominant influence. More information on the fatigue phenomenon can be found in [1]. In welded structures, fatigue damage usually occurs in weld toes [2]. Welding affects the material properties, which can cause inhomogeneity within the welds, such as notches, pores, voids, etc. Weld represents a sudden change in the geometry of detail that causes high stress concentrations. Welding is performed by melting the base and additional material using concentrated heat, which causes residual stresses after cooling in the heat-affected zone.
One of the essential differences between welded and non-welded details is the influence of material strength on fatigue life. The fatigue life of unwelded details usually increases with the tensile strength of the material. However, this is not the case with welded joints in which the crack propagation rate from the initial notch does not depend on the steel quality of the base material [2]. The above-mentioned aspect significantly limits the application of high-strength steel.
There are several methods to increase the fatigue life of welded steel details. Fatigue damage can be avoided by applying details with lower-stress concentration factors or positioning welds in lower-stress areas of the structure. High-quality welds without voids and imperfections and full penetration welds can also increase fatigue life. Additionally, the solution to achieve additional fatigue resistance of welded steel details can be found in post-weld treatment (PWT) methods [3,4]. This study is related to the High-Frequency Mechanical Impact (HFMI) treatment. This treatment increases the fatigue life of welded details by improving the weld geometry, introducing favourable compressive residual stresses, and increasing the weld toe’s hardness [5]. HFMI treatment extends the crack initiation period of welded steel details [6]. This treatment will be also introduced in the new generation of European standards [7,8].
In practice, failures resulting from fatigue are avoided by ensuring that all welded joints within a structure to experience fatigue loading in service have adequate fatigue strengths. There are many methods in the literature for fatigue life assessment of welded steel structures [9,10]. The most common fatigue life assessment methods are S-N-based methods [10,11,12], which can be based on the Nominal stress approach, Hot Spot stress approach, or Effective Notch stress approach. Within these methods, classification of the welded details into specific detail categories is a prerequisite. Fatigue resistance of a welded detail is represented by the corresponding S-N curve obtained by laboratory cyclic fatigue tests. Fatigue strength is determined by a number of stress changes of certain stress amplitudes until detail failure. This simple method is suitable for engineering practices [11]. In the case of HFMI-improved welded steel details, the International Institute of Welding (IIW) also suggests S-N methods with corresponding S-N curves [4]. In S-N methods, surface conditions such as residual stresses and local hardness as the impacts of post-weld treatments on the fatigue life are usually not explicitly considered. S-N methods consider total fatigue life and cannot distinguish between the fatigue initiation and fatigue propagation periods. HFMI treatment extends the fatigue initiation period of a welded steel detail, so it would be appropriate to consider these two periods separately.
This study is based on the development and calibration of an Initiation-Propagation-based Two-Stage Model (TSM), which is, by the combination of different methods, suitable to consider both crack initiation and propagation separately [10,12,13,14,15]. It is investigated whether the developed Two-Stage Model (TSM) can appropriately predict the total fatigue life of as-welded (AW) and HFMI-treated welded steel details with longitudinal attachment under constant amplitude uniaxial nominal stresses. The TSM is applied and validated for fatigue life assessment of welded steel detail according to existing test data from the literature. Considering the influence of HFMI parameters, a parametric study was performed, and certain conclusions drawn.

2. Materials and Methods

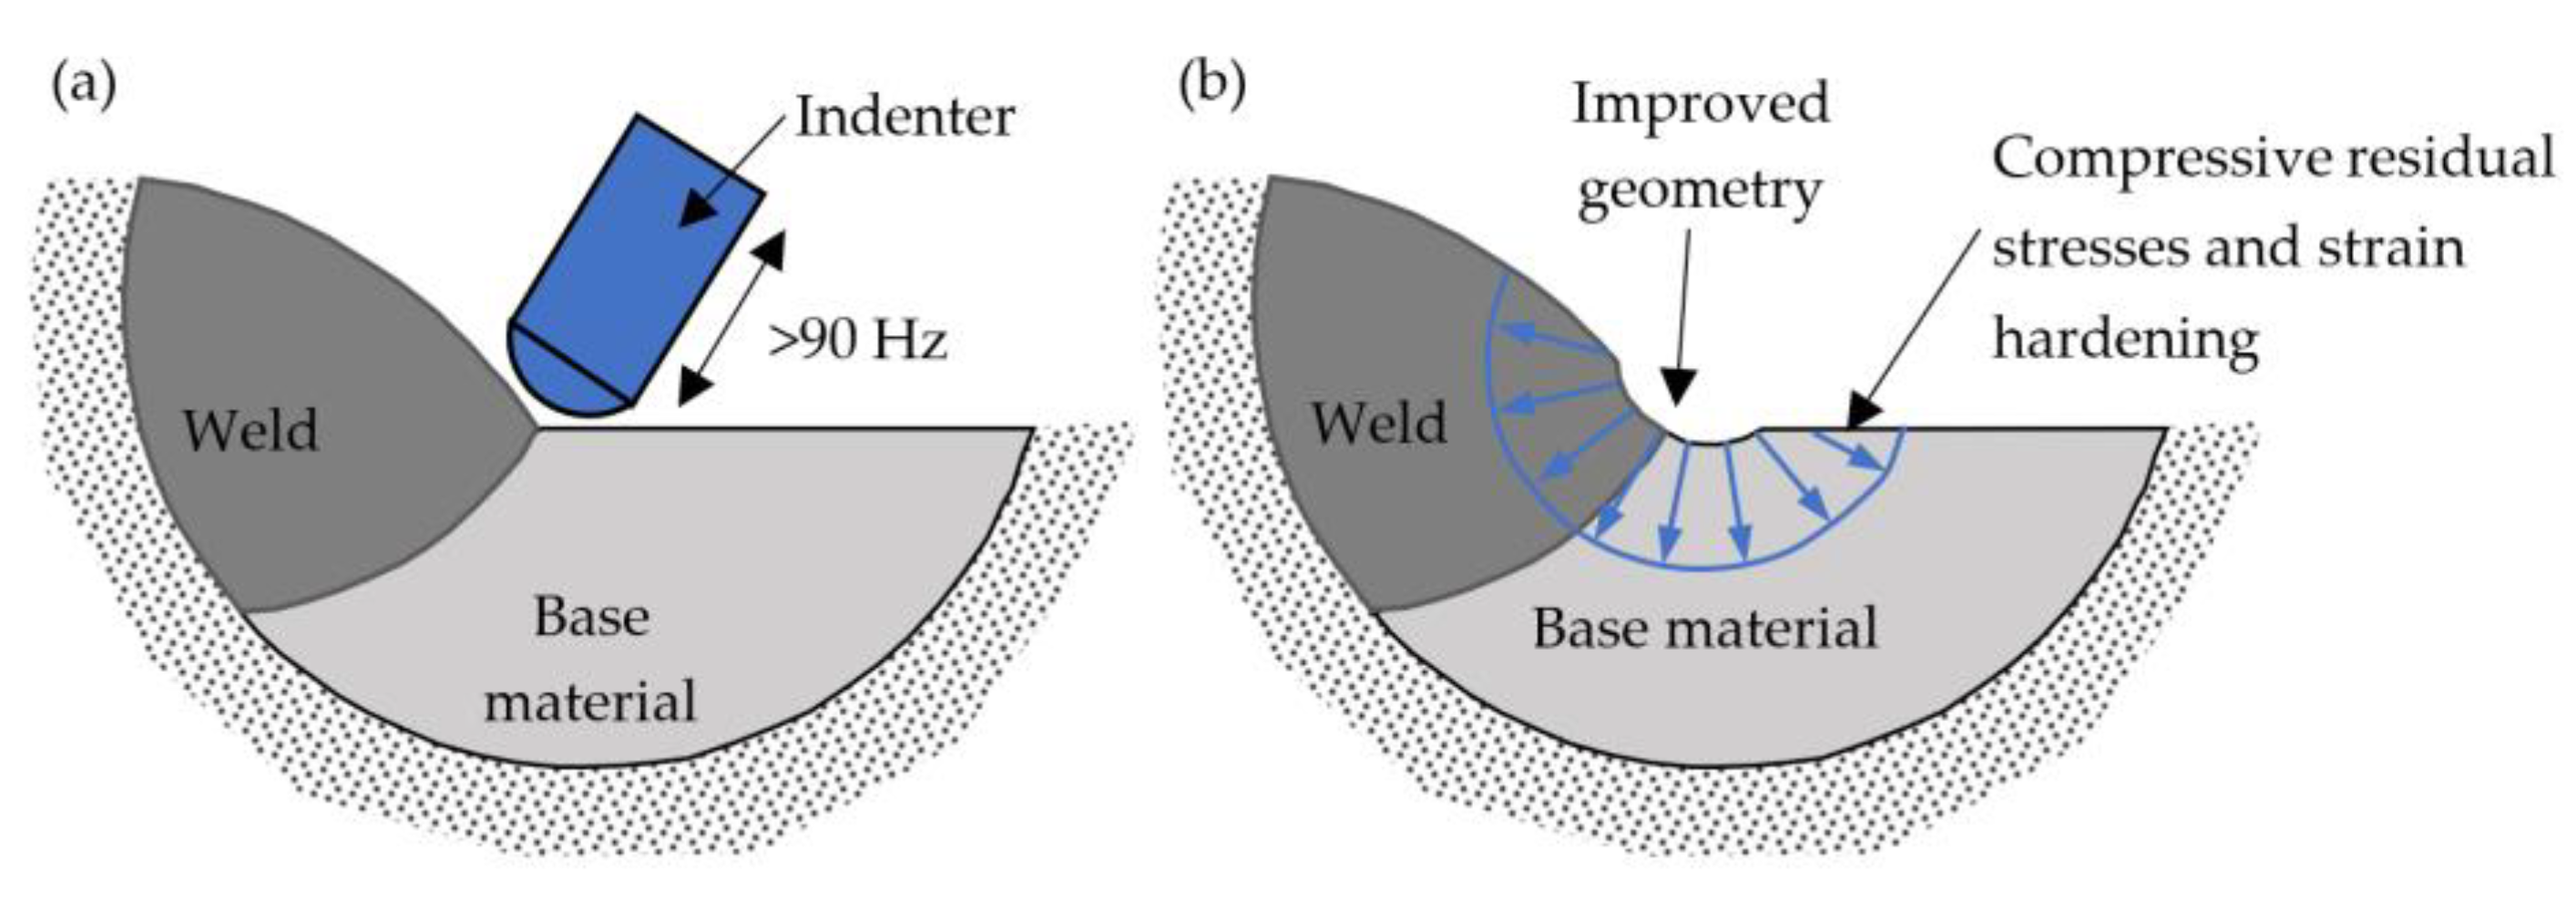
2.1. High-Frequency Mechanical Impact (HFMI) Treatment

The High-Frequency Mechanical Impact treatment is a simple and effective group of post-weld treatment technologies increasingly used in civil engineering [16]. In some cases, it can be the only remaining solution when a sufficient fatigue resistance cannot be achieved with conventional design rules. In the HFMI treatment, the energy source under high frequency (>90 Hz) drives cylindrical indenters that oscillate and impact the weld toe. Such a process causes local plastic deformation of the material, and the positive effect is achieved due to the impact energy at every single impact. A detailed review of the HFMI treatment can be found in [6]. An example of untreated (AW) and treated (HFMI) welded steel detail can be seen in Figure 1.
The HFMI treatment provides a smoother transition between the weld face and the plate, and thus reduces the stress concentration. The HFMI treatment also introduces residual compressive stresses that reduce the unfavourable tensile residual stresses at the weld toe. Due to plastic deformations, hardening of the material locally increasing the material yield strength occurs as well. These three HFMI improvement parameters increase the fatigue life of the welded steel details [5,16,17,18]. Figure 2 represents the positive effect of HFMI treatment on the weld toe.
The main benefit of the HFMI treatment is the extension of the fatigue crack initiation period, as it removes imperfections within which the fatigue crack initiates. Unlike AW details, fatigue strength in HFMI-treated details depends on material strength, which significantly benefits high-strength steel applications. It must be highlighted that the HFMI treatment is only applicable if a fatigue crack occurs at the weld toe. Additionally, after the crack grows outside the zone of HFMI influence, the remaining fatigue life is like that of AW details.

2.2. Two-Stage Model (TSM)
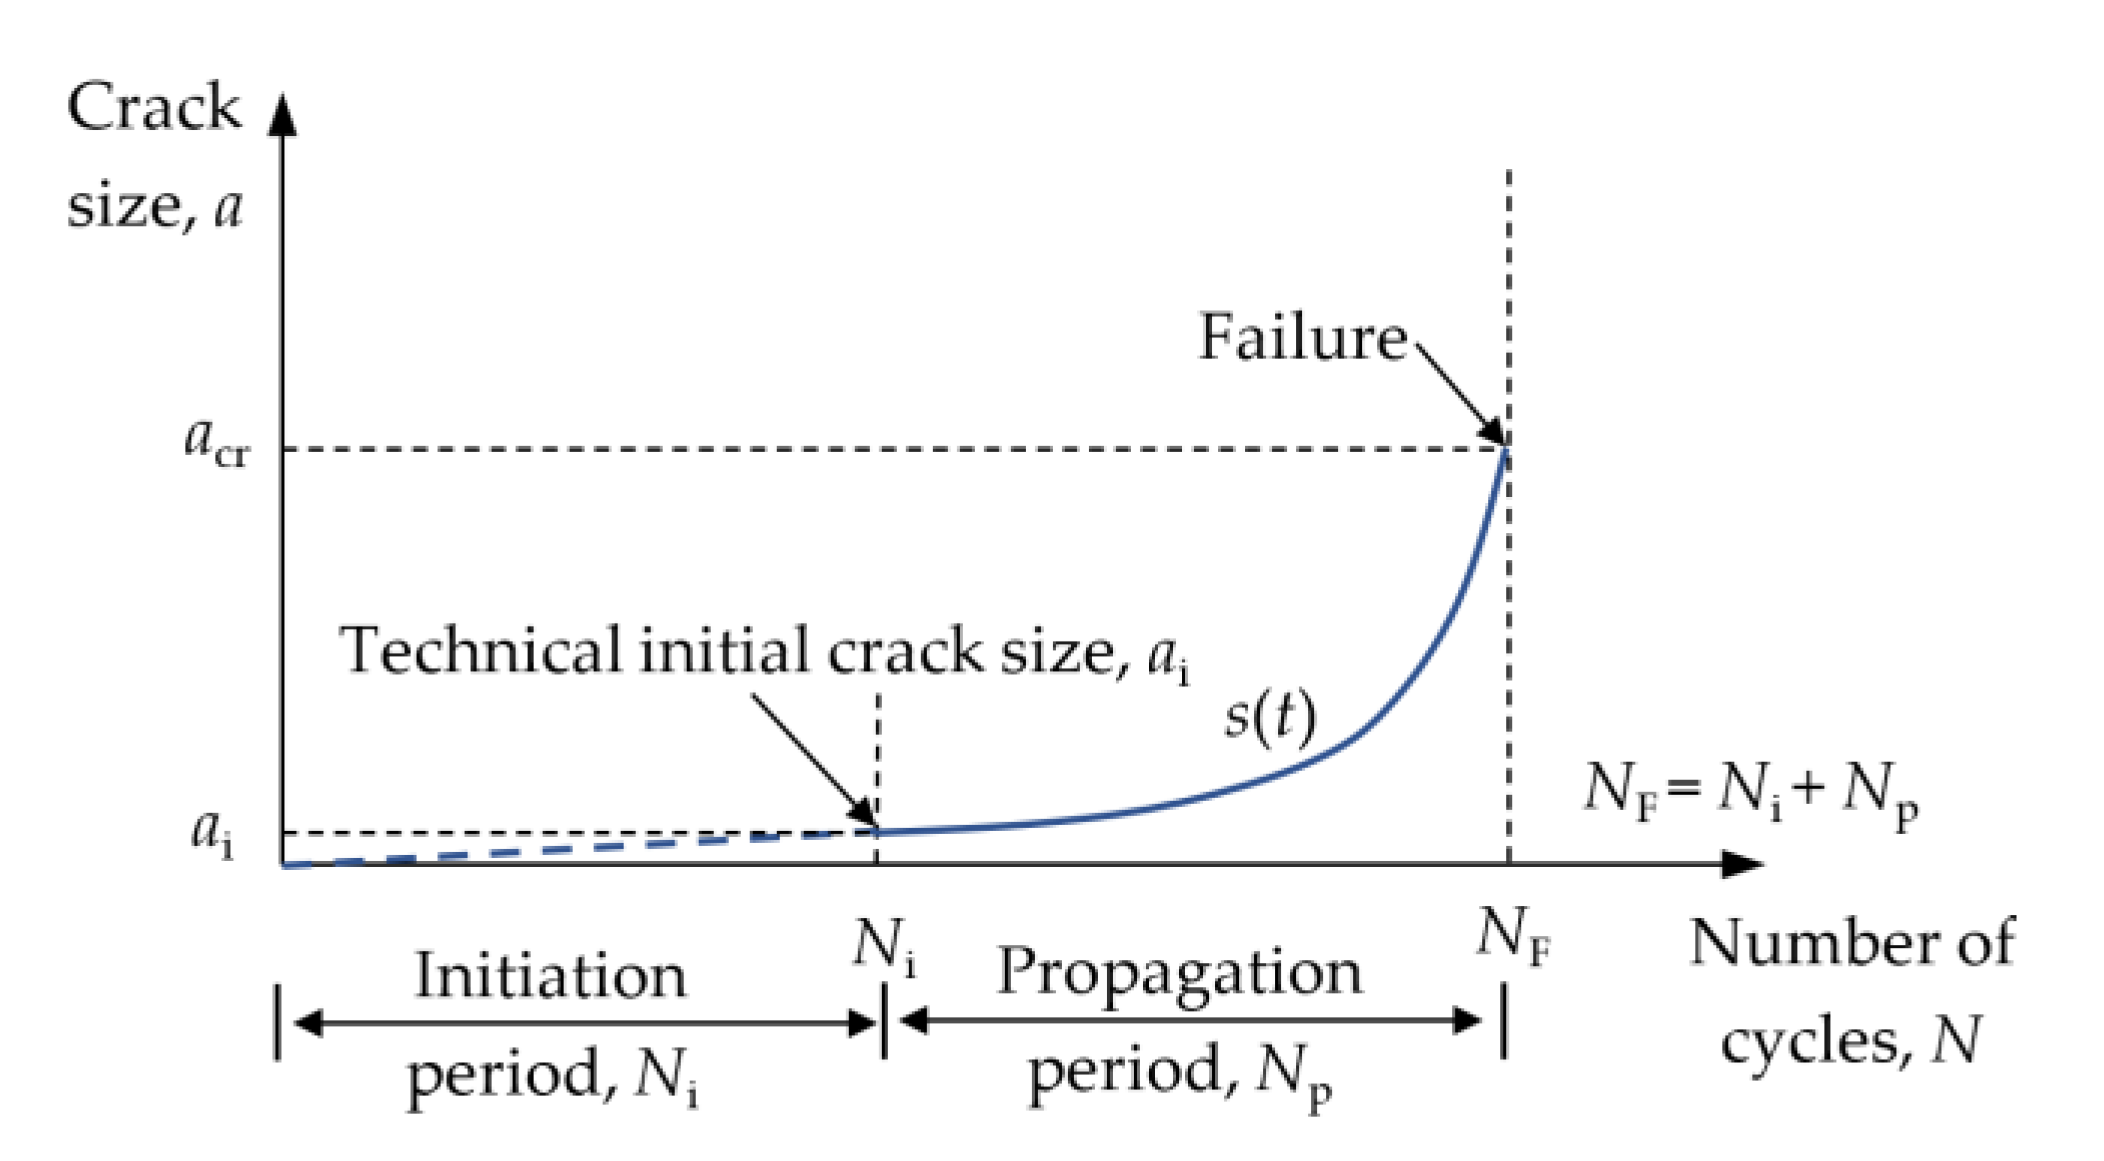
2.2.1. General

The fatigue life of a structural detail consists of crack initiation and a crack propagation period. Use of the fatigue resistance curves does not distinguish between these two phases but observes the total fatigue life. The HFMI treatment extends the fatigue initiation period, so an accurate fatigue life assessment model should explicitly consider these stages. Two-Stage Initiation–Propagation Models (TSMs) are introduced to analyse initiation and propagation separately [10,12,13,14,15]. The transition between crack initiation and propagation is referred to as technical crack initiation at a certain crack depth (Figure 3) [10,12]. Considering HFMI improvement parameters (Figure 2), it is possible to estimate the fatigue life of AW and HFMI-treated steel details.
There are many methods for crack initiation period assessment, such as the fatigue notch factor [19,20,21], notch strain approaches [10,22,23], or the notch stress intensity factor [24,25]. The crack propagation period is generally modelled using Linear Elastic Fracture Mechanics (LEFM) [10,11,26], which provides the required number of stress cycles of a certain amplitude for a crack to propagate to a critical value when a failure occurs (Figure 3). In this research, for the crack initiation modelling, the notch strain (NS) approach is used. The NS approach is commonly applied in mechanical engineering, where many guidelines exist, but its application in structural engineering is still rare [14]. On the other hand, LEFM is usually applied in the assessment of existing structures, so its full potential for fatigue assessment of new welded joints has not yet been exploited [26].

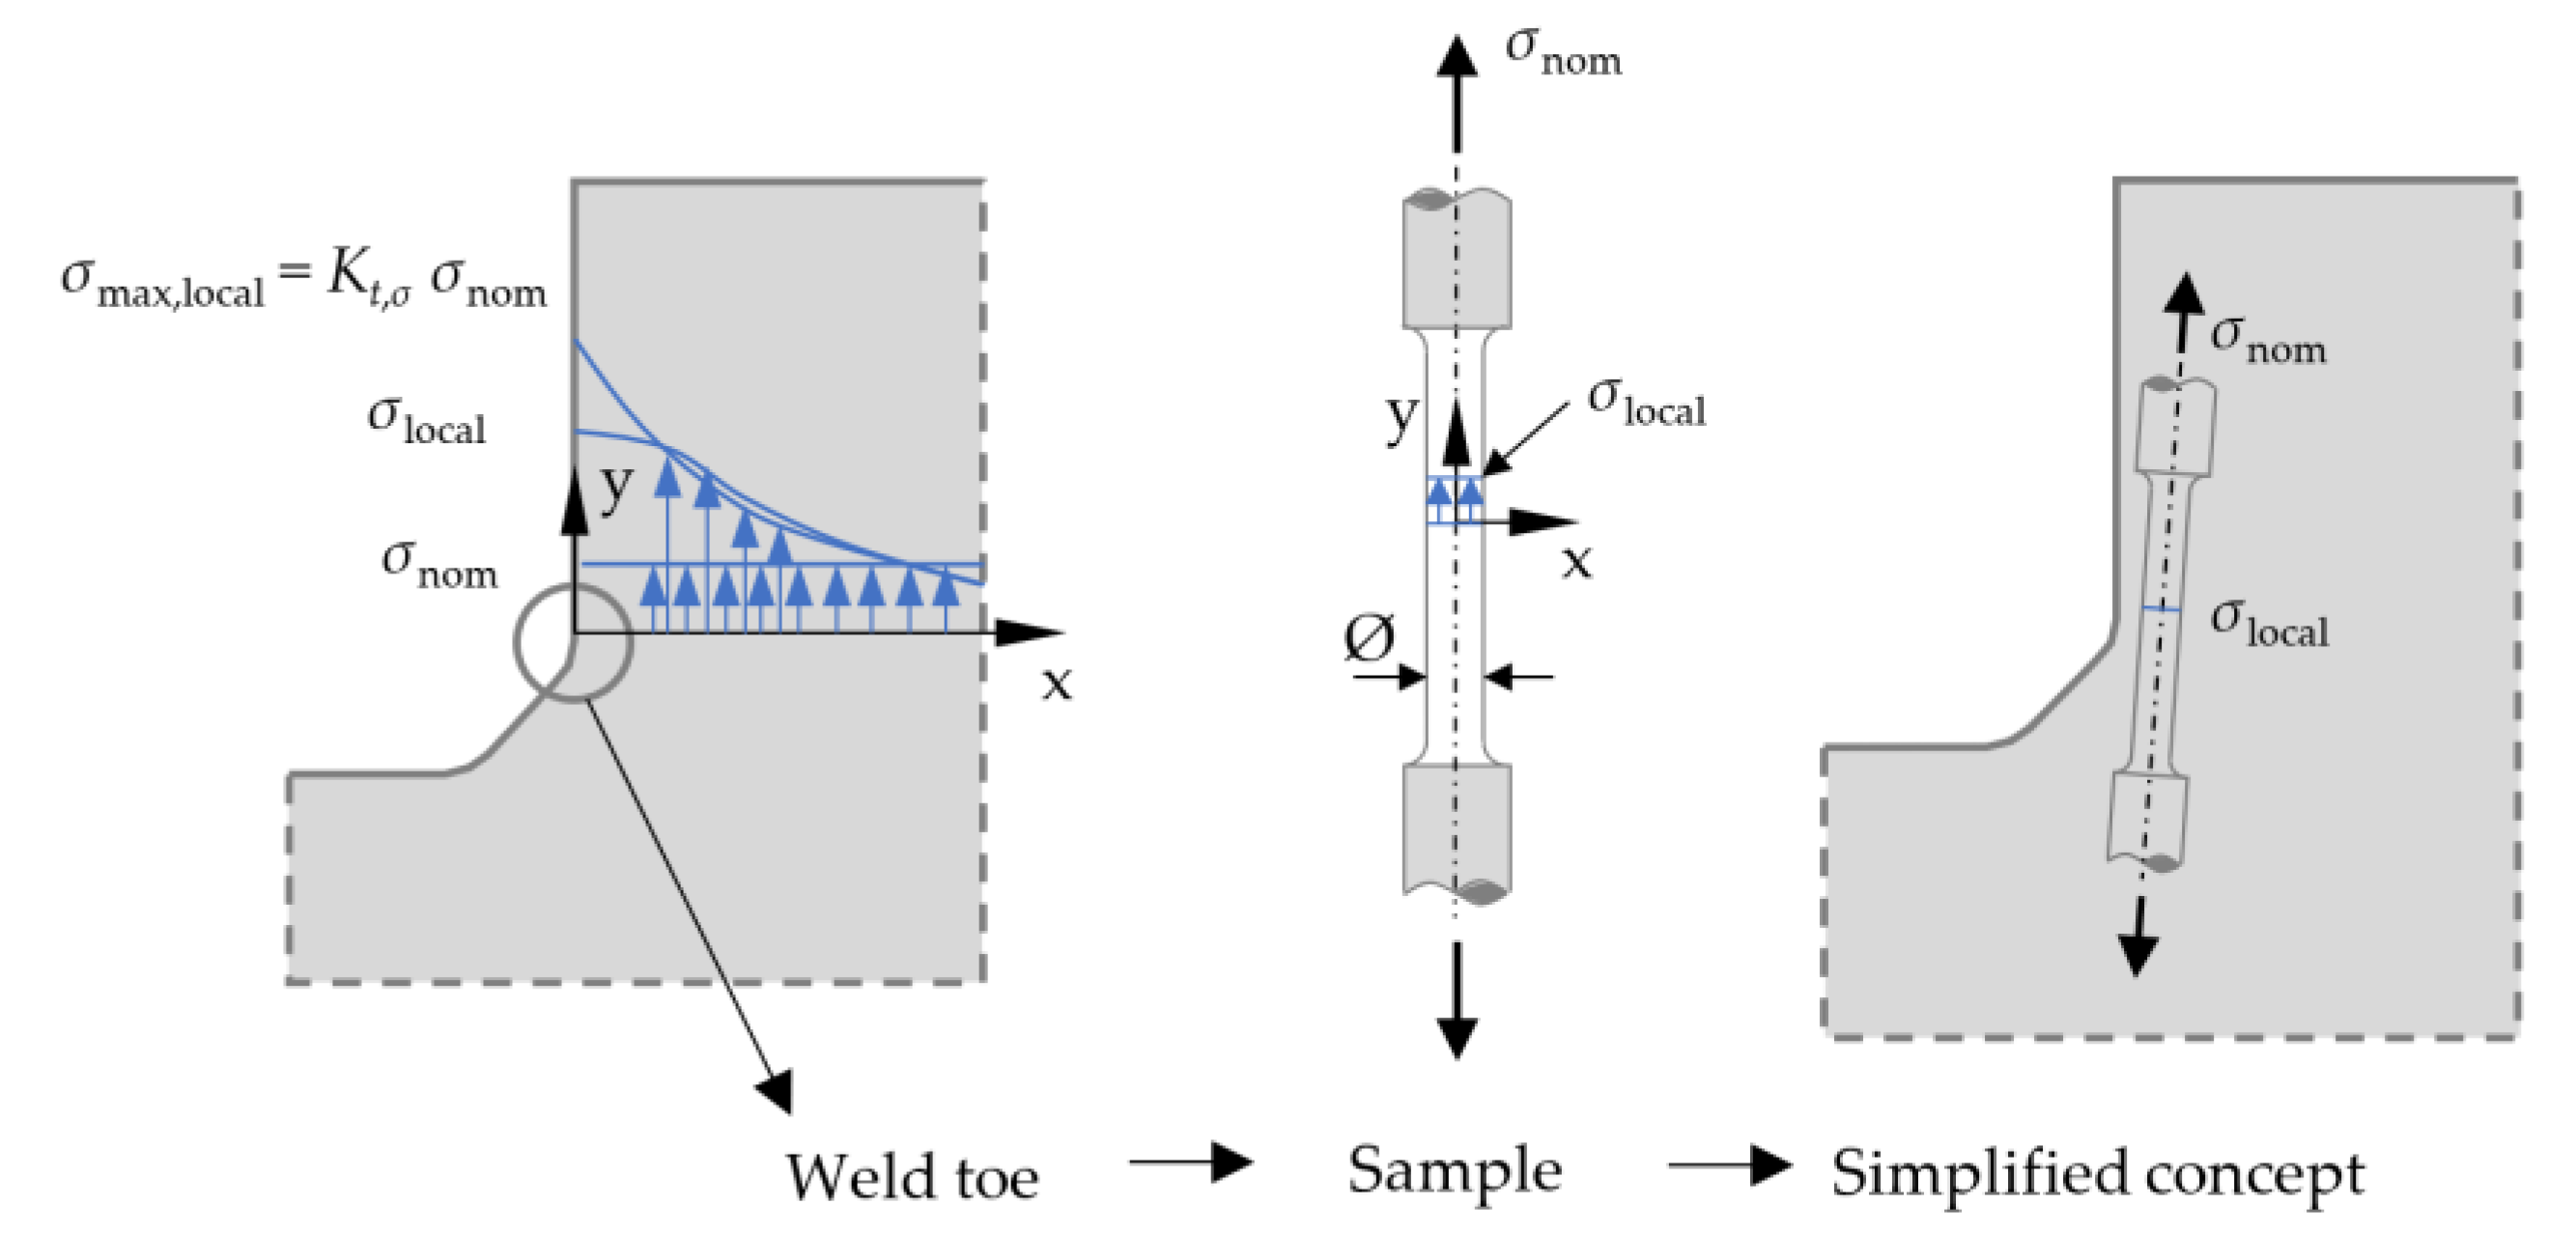
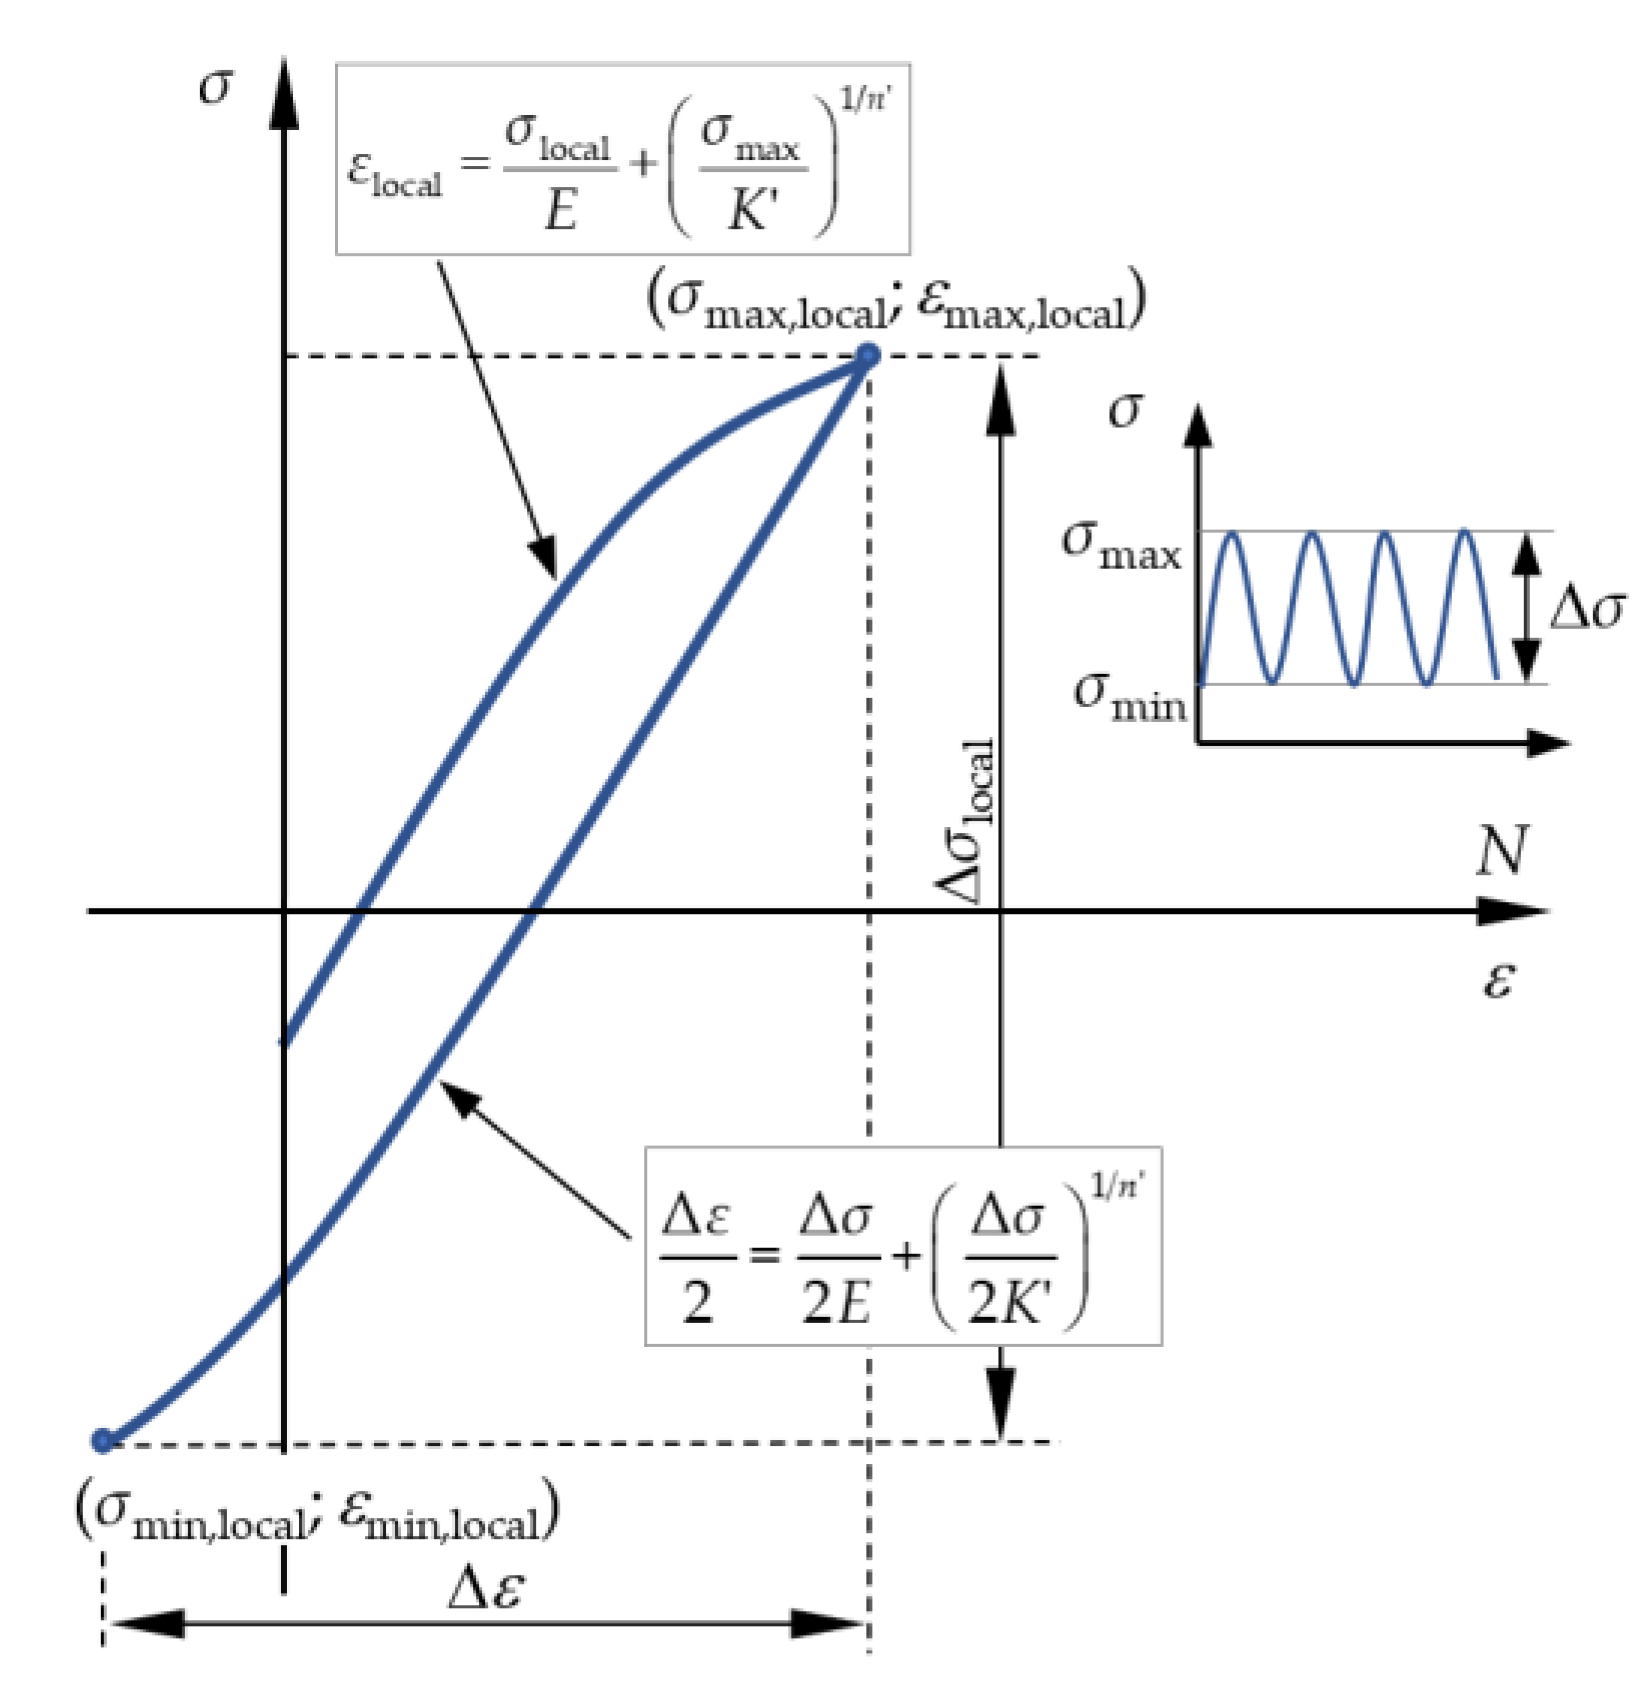
2.2.2. Crack Initiation Period—Notch Strain Approach (NS)

The NS approach was proposed by Seeger et al. [22]. The fatigue life assessment consists of determining the stresses and strains at the weld toe in elastic–plastic conditions and using the analogy of the strain–life curve of the sample material (Φ = 6–8 mm) to determine the number of stress cycles to failure (Figure 4). An introduction to the notch strain approach can be found in [10].
If the welded detail is cyclically loaded, the stress-strain ratios in the σ-ε diagram start from the stress-strain curve due to static load to the stabilised state, which is usually established after 5–10% of the total fatigue life [14]. The stabilised ratio of cyclic stresses and strains in the elastic-plastic state is usually approximated by the Ramberg-Osgood expression [27]. In the elastic-plastic state, the total deformation consists of an elastic and a plastic component:
ε a = ε a , el + ε a , pl = σ local E + ( σ local K ) 1 / n ,
where εa is the total strain amplitude, εa,el is the elastic strain amplitude, εa,pl is the plastic strain amplitude, σlocal is the stress at weld toe, E is the modulus of elasticity, K′ is the cyclic strain hardening coefficient, n′ is the cyclic strain hardening exponent. K′ and n′ are values that can be obtained from the literature or experimental tests. The cyclic load forms the hysteresis loop, shown in Figure 5.
The maximum local stress and strain in the weld toe can be conservatively calculated using the notch stress and strain concentration factors. Stress and strain concentration factors in the elastic and elastic-plastic state are presented in Figure 6.
As the nominal stress increases, the stress concentration factor remains constant until the yield strength (fy). After yielding, the stress concentration factor decreases (K), and the strain concentration factor (K) increases. This means that the stress is lower than the elastic stress, and the deformation is higher than the elastic deformation. To describe the nonlinear analysis by a linear model, Neuber’s expression is used [28]. For each elastic deformation in the σ-ε diagram of the material, Neuber’s expression that gives the energy balance in σ-ε diagram between the elastic stress and strain and the corresponding elastic–plastic stress and strain, as follows:
( K σ K ε ) elastic = ( K σ K ε ) plastic .
If K t 2 = K σ K ε , and
K σ = σ max σ n ,
K ε = ε max ε n = ε max ( σ n / E ) ,
then it follows that:
K t 2 = ε max ε n σ max σ n = ε max σ n / E σ max σ n .
Finally, the following Equation (6) can be written as:
( K t σ max , nominal + σ residual ) 2 E = ( σ ε ) max , local .
where σmax,local and εmax,local are maximal local stresses and strains in the weld toe. Kt is the elastic stress concentration factor. Thus, for given nominal stress and the stress concentration factor Kt, it is possible to calculate the stress and strain in the elastoplastic state. Equation (6) includes residual stress (σresidual) as the HFMI improvement parameter of fatigue life. The geometry change by HFMI treatment is taken into account by stress concentration factor Kt. To calculate the crack initiation period, it is necessary to calculate stresses and strains in the hysteresis loop (Figure 5). The Ramberg–Osgood Equations (1) and (6) give two equations with two unknowns, from which the maximum local stress in the weld notch σmax,local is calculated. This procedure provides the maximum stress at the weld toe in the elastic–plastic state:
( K t σ max , nominal + σ residual ) 2 E = σ max , local ( σ max , local E + ( σ max , local K ) 1 / n ) .
The same procedure is applied for the calculation of the local stress amplitude Δσlocal:
( K t Δ σ nominal ) 2 E = ( Δ σ Δ ε ) local .
After the load direction change, the branch of the hysteresis loop includes the Bauschinger effect and is followed by the σ-ε ratio, which is twice the values of deformation and stress concerning the initial σ-ε curve in the first load direction [29]. This is because when inversion of the load occurs, the element must deform twice as much as in the first direction of the load. This can be described by the expression:
Δ ε 2 = Δ σ 2 E + ( Δ σ 2 K ) 1 / n .
Equations (8) and (9) are new systems of two equations with two unknowns. By including Equation (9) into (8), a new Equation (10) is obtained as follows:
( K t Δ σ nominal ) 2 E = Δ σ local ( Δ σ local E + 2 ( Δ σ local 2 K ) 1 / n ) .
By solving the system of equations, the local stress amplitude Δσlocal showed in Figure 5 can be obtained. Then, the local mean stress is:
σ mean , local = σ max , local Δ σ local 2 .
Crack initiation is described by the strain-life curve, which includes elastic and plastic parts. The curve equation, according to Manson and Coffin, with the correction of the mean stress according to Morrow [15], is:
ε a = ε a , el + ε a , pl = σ f σ m E ( 2 N i ) b + ε f ( 2 N i ) c ,
where σf′ is the fatigue strength coefficient, εf′ is the fatigue ductility coefficient, b is the fatigue strength exponent, c is the fatigue ductility exponent, σm is the mean stress, 2Ni is the number of cycles to crack initiation. The crack initiation period ends when the technical crack is initiated. There are many suggestions in the literature for technical crack size, such as ai = 0.5–0.8 mm [30] and ai = 0.25 mm, according to Lawrence et al. [10]. Hou et al. [31] recommend a crack of 0.25 mm.

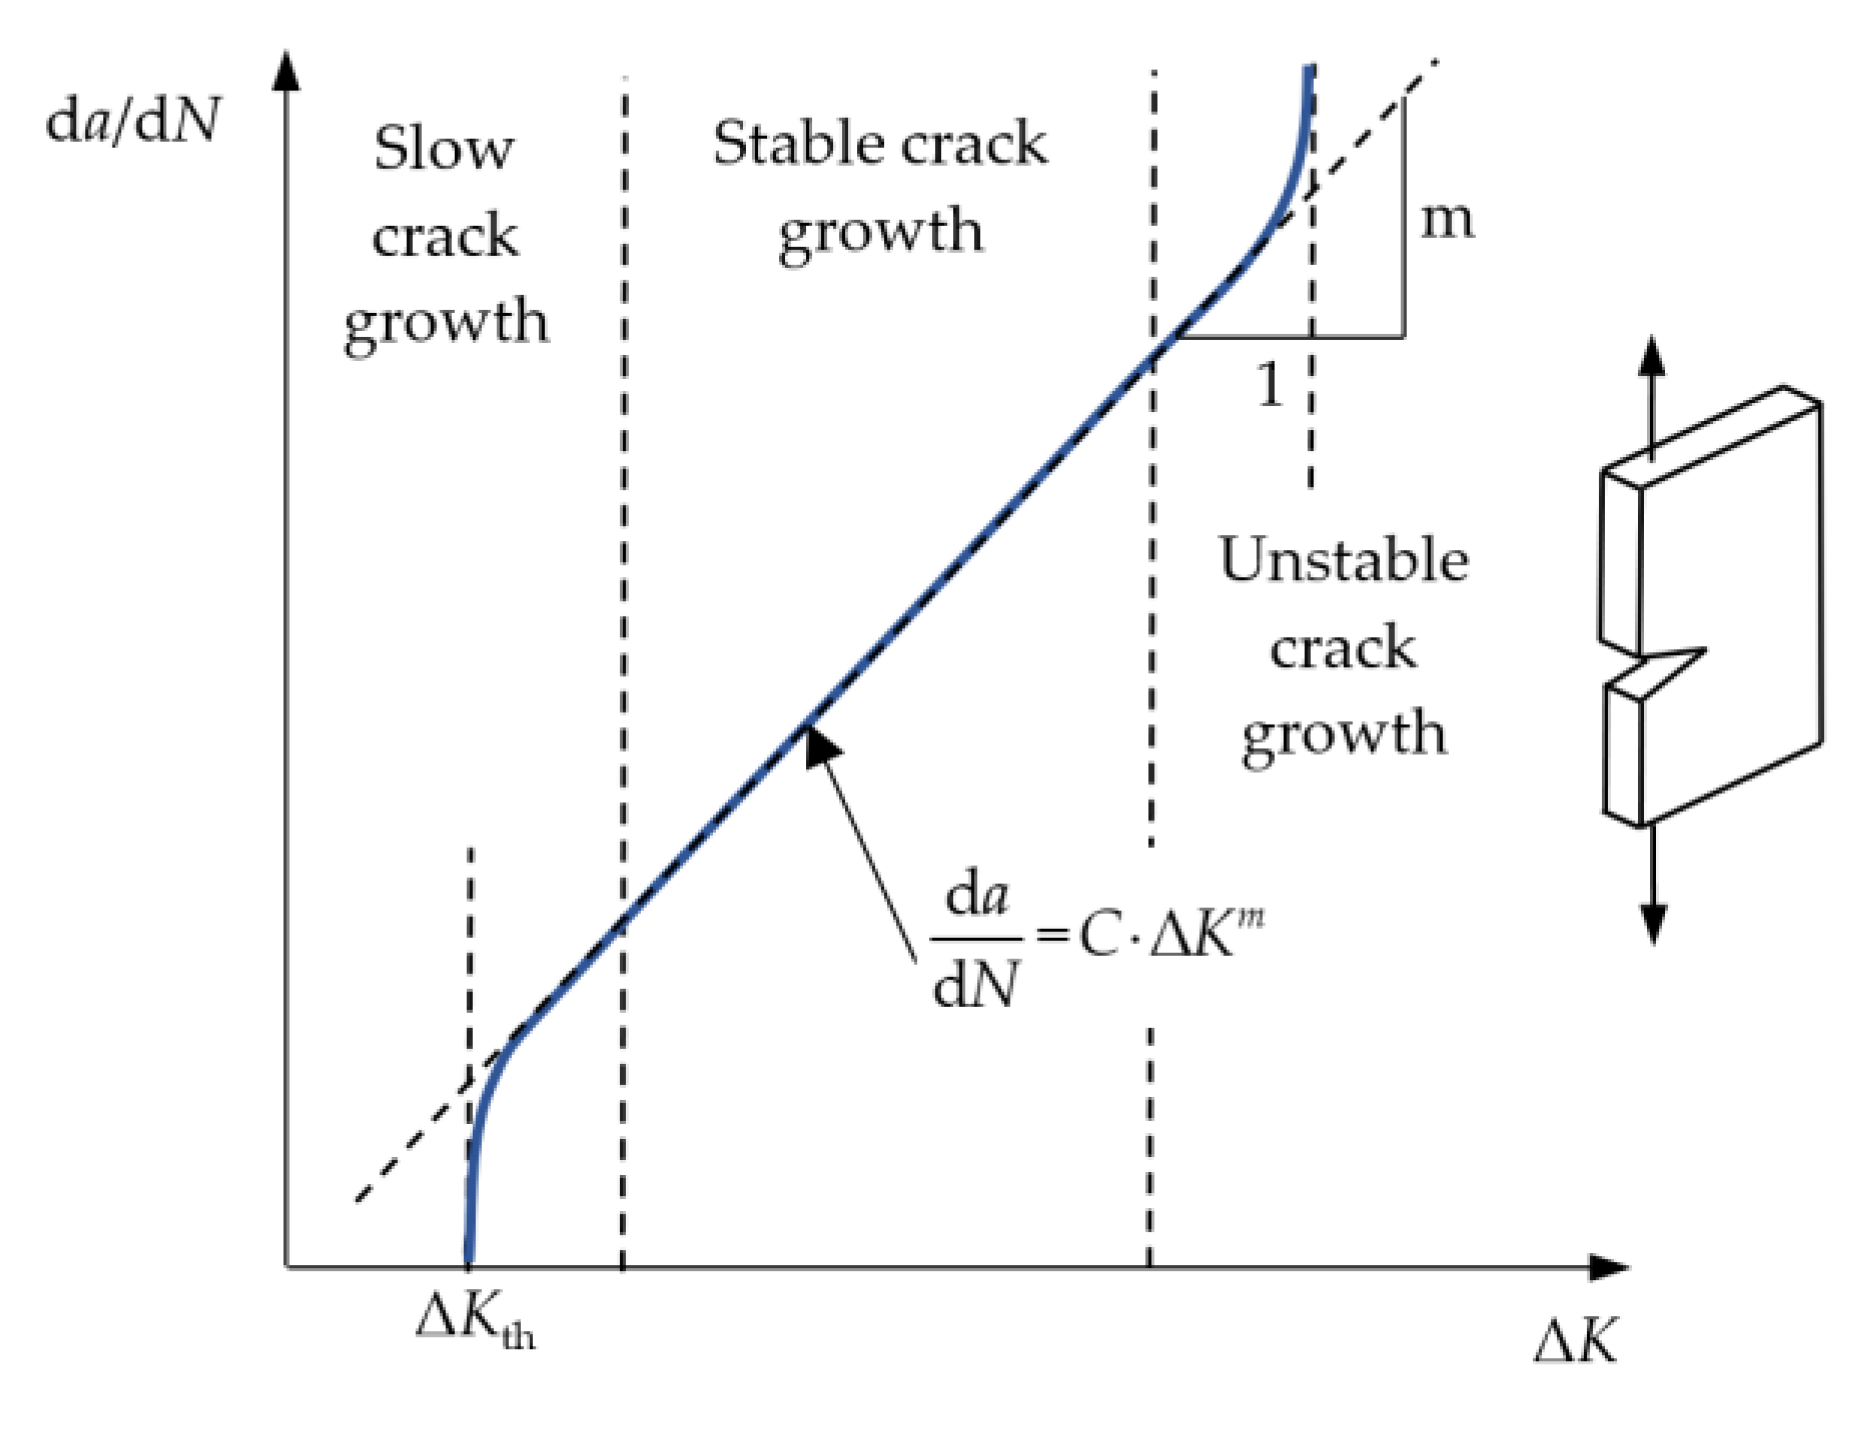
2.2.3. Crack Propagation Period–Linear Elastic Fracture Mechanics (LEFM)

The crack propagation period Np is determined using Linear Elastic Fracture Mechanics [10]. The stress intensity factor describes the stress state near the crack tip caused by an external load:
Δ K = Δ σ Y M k π a ,
where Δσ is the stress range, Y is the correction factor depending on the crack geometry and Mk is the stress magnification factor due to the stress concentration at the crack tip. A crack starts to propagate if the stress intensity factor range ∆K exceeds the threshold stress intensity factor range ∆Kth. The Paris–Erdogan equation [32], which approximates the rate of crack growth under cyclic planar deformation conditions at the crack tip, is used to estimate the crack propagation period for fatigue loaded welded joints. The crack propagation perpendicular to the load direction is assumed. The Paris–Erdogan equation is:
d a d N = C Δ K m ,
where a is the crack size, N is the number of stress cycles, C and m are experimentally determined material constants, and ΔK is the stress intensity factor range. The material constants m and C depend on the material’s microstructure, mean stress, environmental conditions, temperature, degree of corrosion, etc. The values of these constants and a list of literature where they can be found were collected in [10]. Figure 7 shows a typical crack propagation curve according to the Paris–Erdogan equation.
The crack growth process consists of slow propagation, stable and unstable crack propagation followed by failure. The Paris–Erdogan equation refers to the linear stable crack propagation. The crack propagation period is calculated by integrating the Paris–Erdogan equation:
N p = a i a c d N = a i a c 1 C Δ K m d a ,
where N is the number of stress cycles from ai to ac. When the crack size reaches the critical value of acr, failure is assumed. The initial crack size is equal to the technical crack size ai at the end of the crack initiation period. By integrating the Paris–Erdogan equation over the crack size, the service life of the welded detail at fatigue can be calculated [10] as follows:
N p = a i a c d a C Δ K m = a i a c d a C ( Δ σ Y M k π a ) m = 2 ( m 2 ) C Δ σ m π m / 2 [ 1 a i ( m 2 ) / 2 1 a c ( m 2 ) / 2 ]

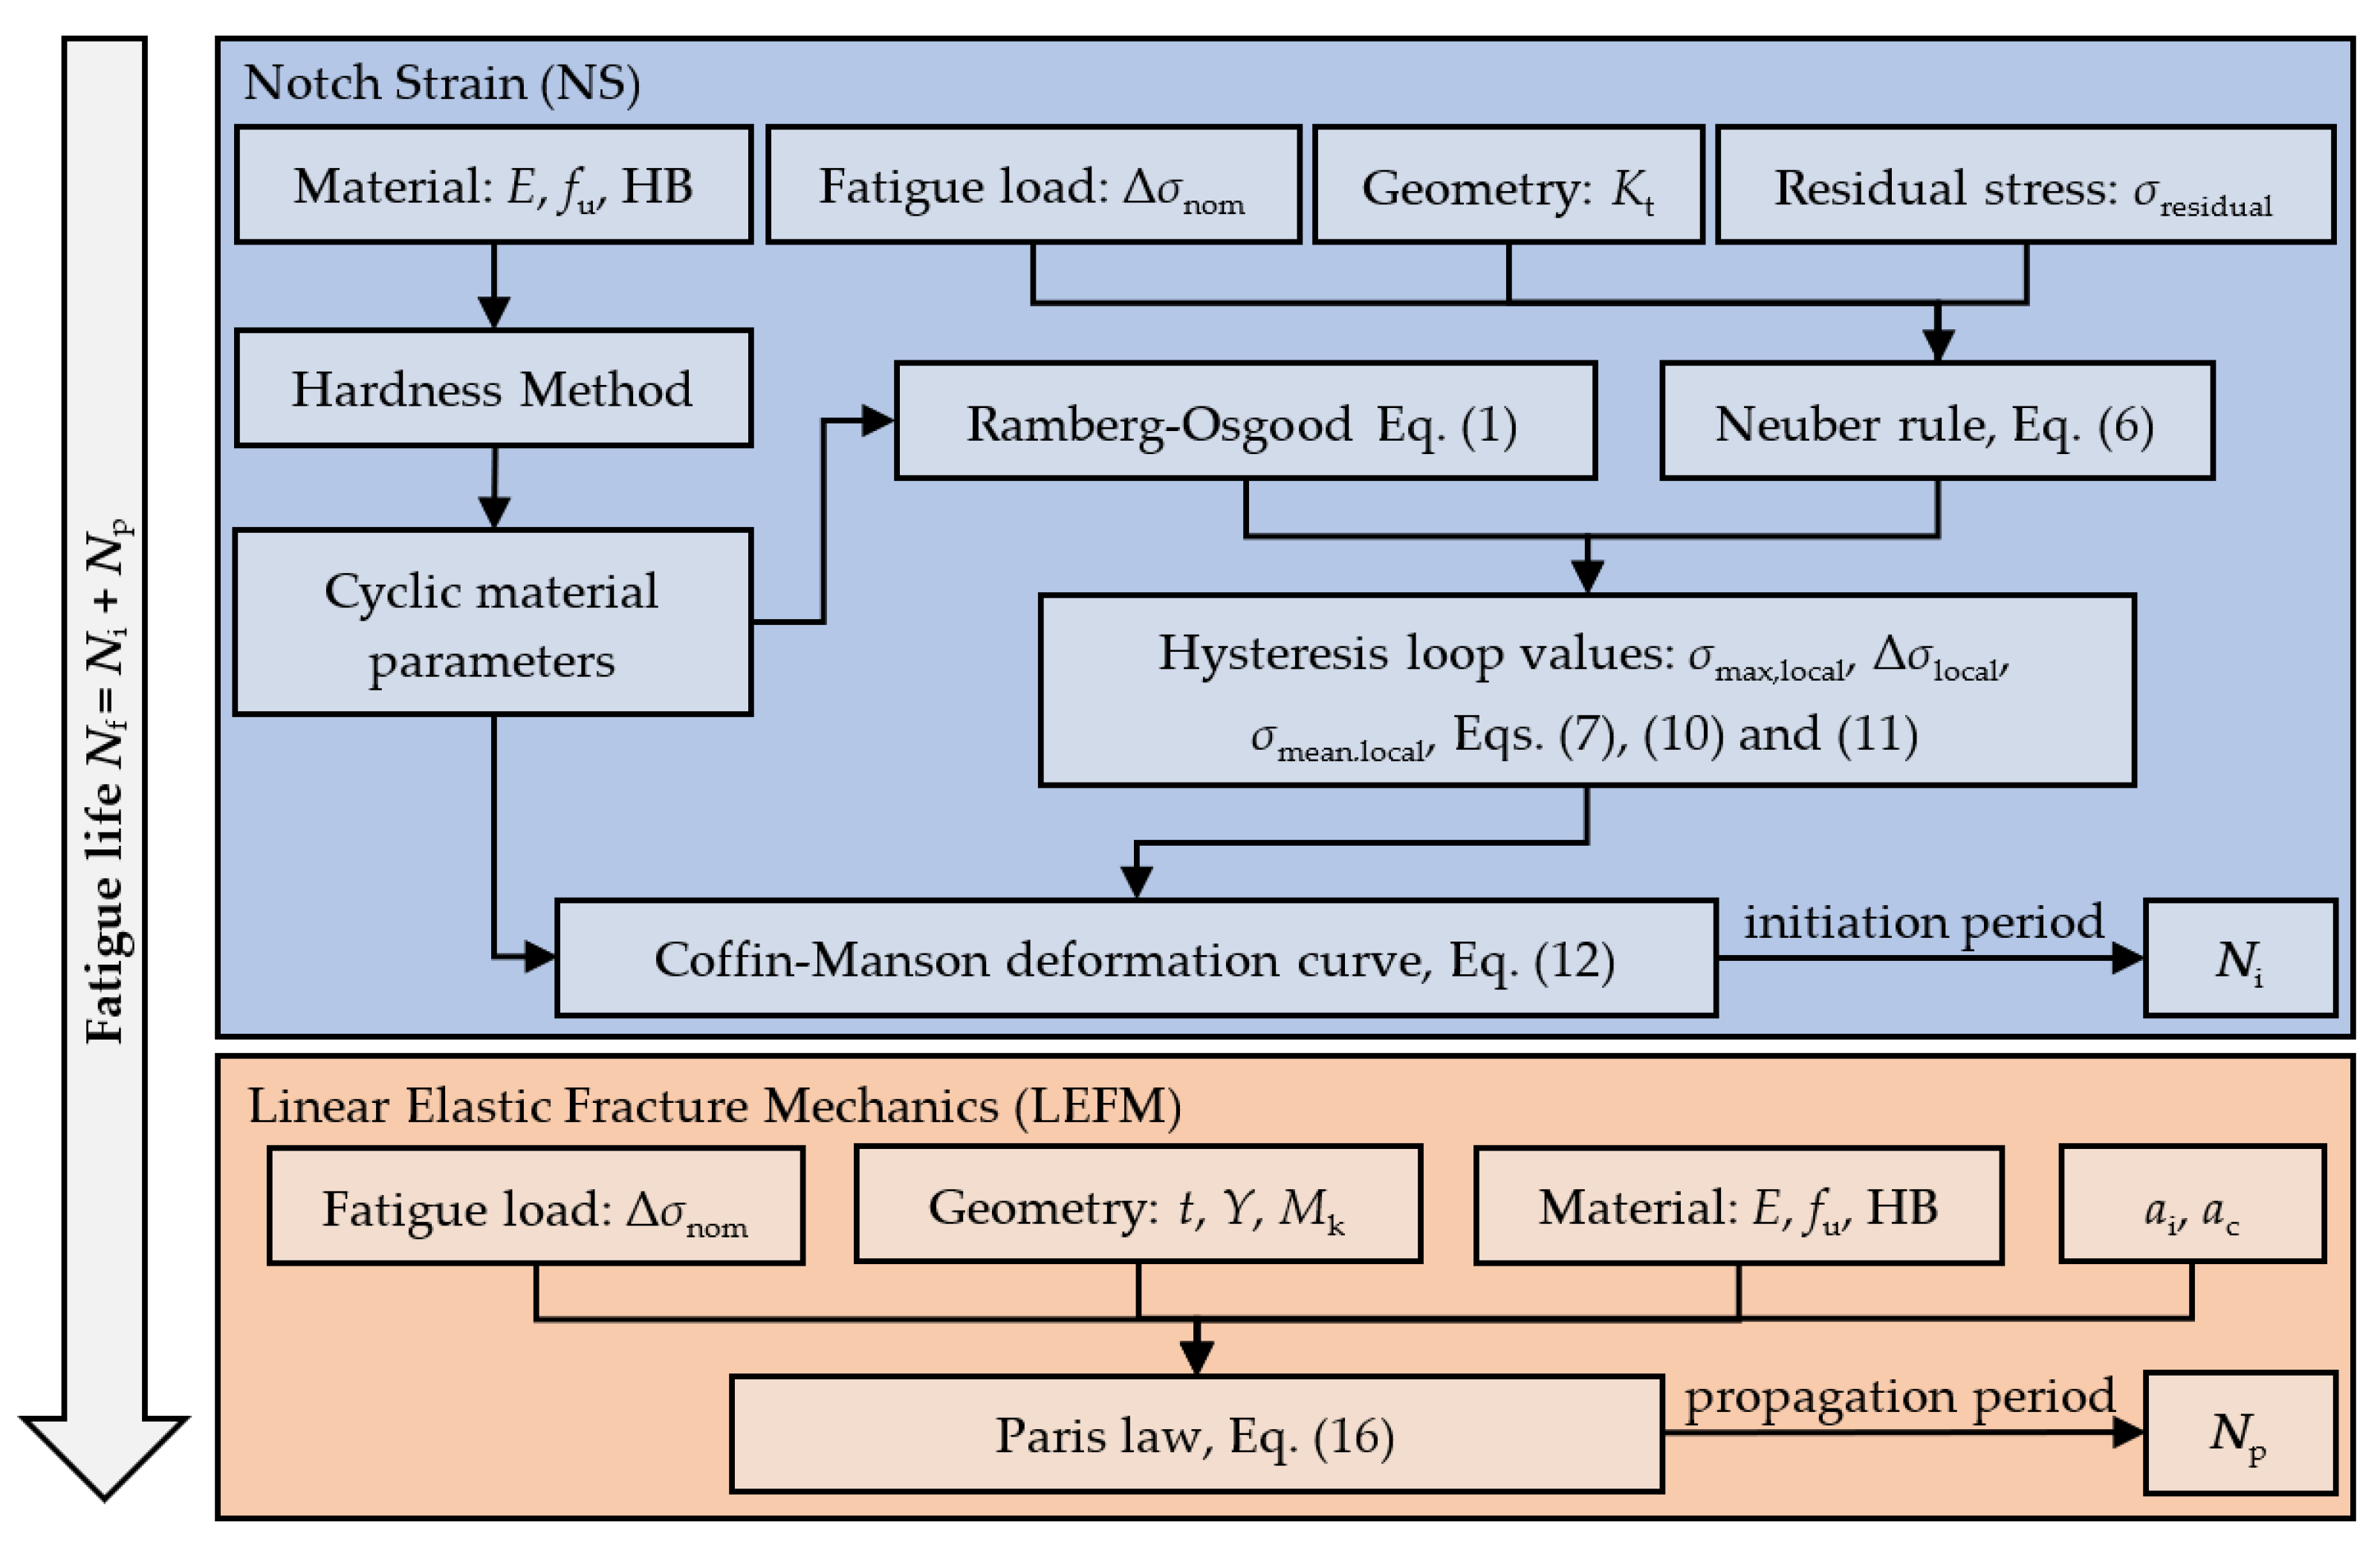
2.2.4. Flowchart of the Two-Stage Model (TSM)

Figure 8 shows a flowchart of the TSM based on the procedures presented in previous sections for crack initiation period—the notch strain approach (NS) and crack propagation period—Linear Elastic Fracture Mechanics (LEFM).

3. Results and Discussion

3.1. Calibration of the TSM

3.1.1. General

This section investigates whether the Two-Stage Model (TSM) can appropriately predict the total fatigue life of AW and HFMI-treated welded steel details. Considering the influence of HFMI parameters, the TSM is applied and calibrated for fatigue life assessment of welded steel details according to data from available test results from the literature. The study is focused on welded detail with longitudinal attachment (Figure 1) under constant amplitude uniaxial nominal stresses.
For calibration purposes, a steel plate S690 with a thickness of 8 mm was assumed. HFMI parameters were taken from the literature, and the calculated fatigue life was validated by the fatigue test results given in the literature [33,34,35,36]. The TSM was calibrated for the AW and HFMI-treated conditions. After the TSM model calibration, a parametric analysis was performed. As mentioned before, the transition between fatigue crack initiation and propagation periods is defined by technical crack initiation. The findings in the literature [37,38] show that the technical crack starts to initiate at about 10% of the total fatigue life of the considered specimen for the AW condition. In the case of HFMI-treated details with high-strength steel S690, the crack initiation period can shift up to even 90% of a specimen’s total fatigue life [37]. For calibration purposes, the initial crack size was assumed to be 0.5 mm.

3.1.2. Material Parameters for NS Approach

The notch strain approach requires the definition of cyclic material parameters, which are determined from tests. Many researchers have developed correlations between fatigue properties of materials and monotonic tensile data [39]. The review of these correlations can be found in paper [39], where three methods are selected for estimating uniaxial fatigue properties for assessment of HFMI-treated details—Uniform Material Law (UML), Extended UML and the hardness method (HM). These correlations are useful considering the amount of time and effort required to obtain the cyclic material parameters. In the lack of expensive cyclic tests, these methods can be used to estimate variables for the notch strain approach.
Uniform material law (UML) is one of the most popular methods for the assessment of cyclic material parameters [10,15]. This method was proposed by Bäumel and Seeger [40]. This is a simple method, since material parameters can be estimated based on Young’s modulus and ultimate tensile strength [39]. Korkmaz [41] proposed Extended UML for higher-strength steels. The hardness method (HM) is a simple method for the estimation of strain–life curve parameters and only requires the Brinell hardness of the material and Young’s modulus. Both parameters are available or easily measurable by non-destructive tests. This method was proposed by Rossle and Fatemi [42] and provides good approximations of the strain–life curve. Selected methods for determining material parameters for a strain–life curve can include hardness as the HFMI improvement parameter either through local hardness change (HB) or indirectly through a local change of tensile strength (UML and Extended UML). Cyclic material parameters according to the described methods are shown in Table 1.
Calculations in this research show that UML, Extended UML and HM are in good agreement with test results from the literature for the AW condition [39]. As shown later, with the appropriate calibration of the fatigue strength exponent, b, and fatigue ductility exponent, c, HM is suitable both for AW and HFMI-treated conditions.

3.1.3. Material and Geometry Parameters for the LEFM Approach

The material parameters for the Paris–Erdogan equation are derived from crack propagation tests. For calibration within this research, the crack propagation approach material parameters are adopted as m = 3 and C = 3.5 × 10⁻¹². The local stress magnification factor Mk(a) is calculated according to [26]. The parameter Y(a) is a function of crack size, but the average value of a parameter can be considered a constant if Y does not vary strongly [10,26]. For this calculation, it is assumed that Y = 1.12 [43]. The integration was performed by the stepwise integration of crack and cycle increments and by the parallel computing of Mk(a). The step increment was Δa = 0.01 mm. The calculations were performed with the initial crack that equals technical crack size ai = 0.50 mm, implemented at the maximum principal stress location. Various methods can determine the final crack size, but very often it is not necessary. The biggest portion of the fatigue propagation period is related to small cracks. For a steel plate thickness of 8 mm, it is insignificant whether a final crack size is chosen as 5 mm, 6 mm or 7 mm since there is only a negligible difference in the number of cycles. Accordingly, in this research, 5 mm is assumed as a final crack size.

3.1.4. HFMI Parameters for TSM

In this section, HFMI parameters are adopted from the literature. For longitudinal stiffener with 8 mm thickness in the AW condition, stress concentration factor is about Kt = 2.69–3.85 [44]. For the corresponding HFMI-treated detail, the stress concentration factor is about Kt = 1.92–2.17 [44].
In [45], the measured residual stress in AW condition for steel grade S355 is around 25 MPa, and for steel grades S690 and S960, it is around 200 MPa. In the same reference, for steel grade S700, the average value of residual stresses is around 470 MPa in the AW condition, and −200 (compression) for the HFMI-treated condition, with a scatter of ±150 MPa. Residual stresses for the AW condition in the longitudinal attachment for steel grade S700 [44] is around 340 MPa (tension), and for the HFMI-treated weld toe, it is around −180 MPa (compression). In [46], the compressive residual stress for steel grade S690 ranges from −540 and −654 MPa. For the HFMI-treated specimens of steel grade S960, residual stress values were between −600 MPa and −800 MPa. In [47], residual stresses at the surface range for steel grades S355 and S690 with values of −230 MPa to −270 and of −500 MPa to −610 MPa, respectively. It can be seen that there are big differences in data since some information such as welding procedure and other manufacturing conditions cannot be explicitly confirmed.
To quantify strain hardening (change in hardness) after HFMI treatment, microhardness measurements of the locations around the plastically deformed zone were performed. In [46], it is observed that a hardness increase occurs from 180 HV0.05 to 300 HV0.05 for fillet welds in the case of specimens from steel grade S355. In [47], a hardness increase up to 340 HV0.05 in a depth of around 1 mm was observed for steel grade S355J2 + N compared to a base material hardness of 209 HV0.05. In [46], for steel grade S690QL, the hardness in the AW condition is 250 HV0.05, and an increase from 300 HV0.05 to HV350 was observed. The mean value of measured hardness for S700 in the AW condition in a weld toe area is measured as HB = 230, and for the HFMI-treated condition, HB = 240 [44]. According to [48], the base material hardness for steel grade S690 is from HB228 to HB278. According to [49], the hardness increase is the greatest for low-strength material states with a hardness of around 200 HV0.05. For high-strength steels, the increase in hardness is not so significant. As presented in [47], there is only a slight hardness increase from 415 HV0.05 to 435 HV0.05 in the AW condition.

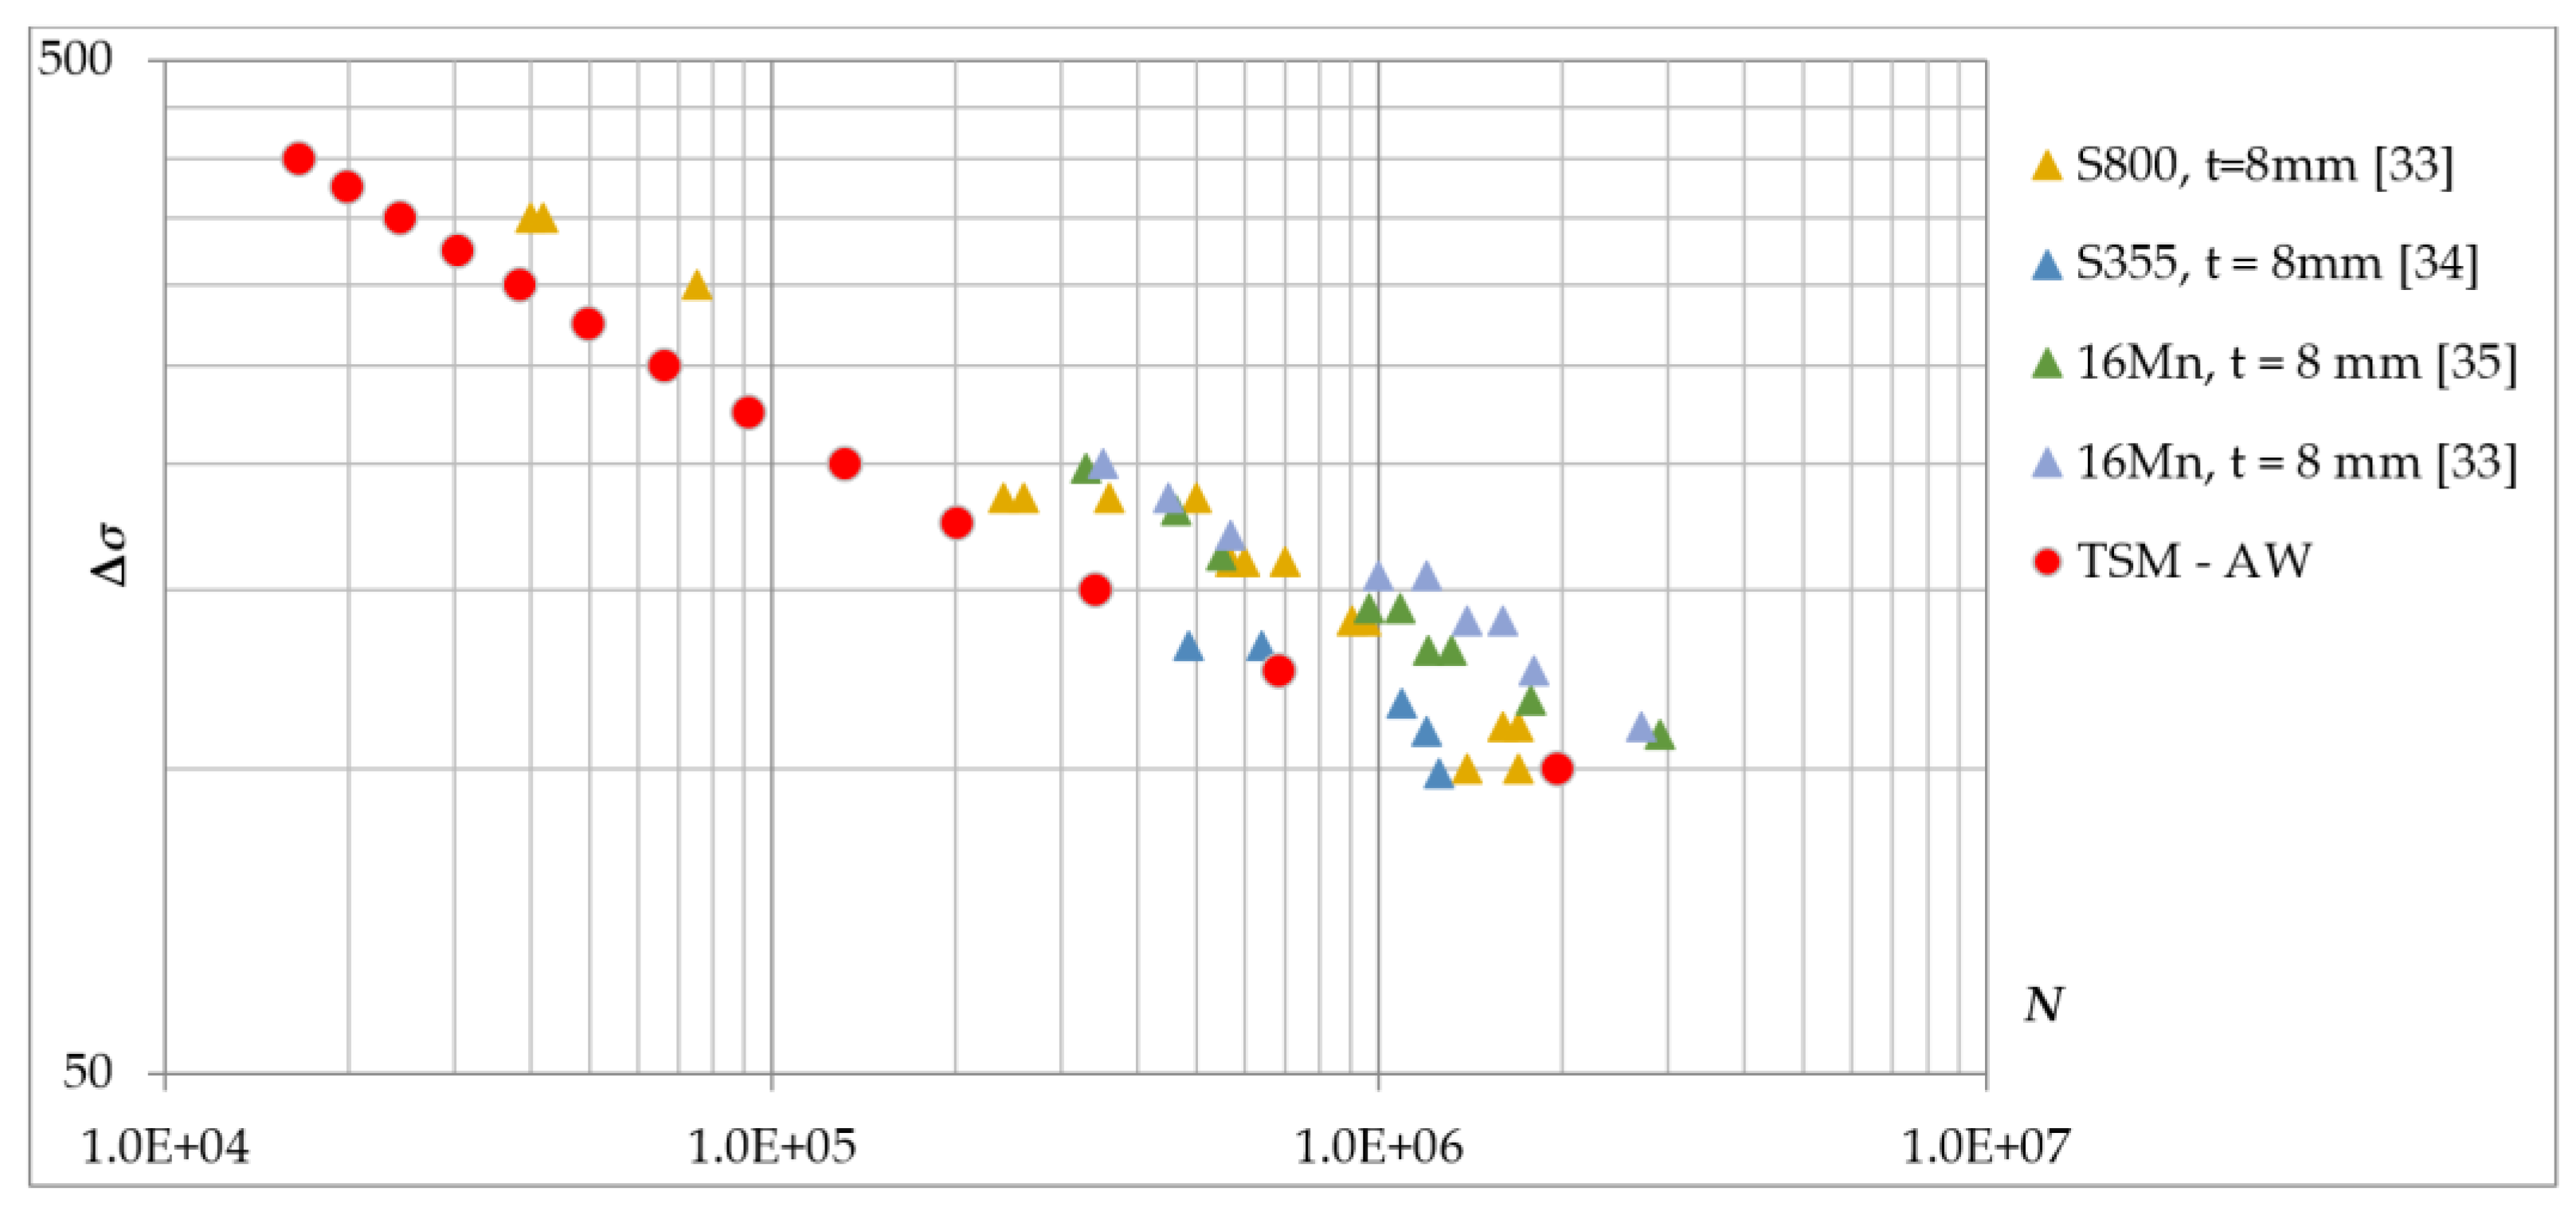
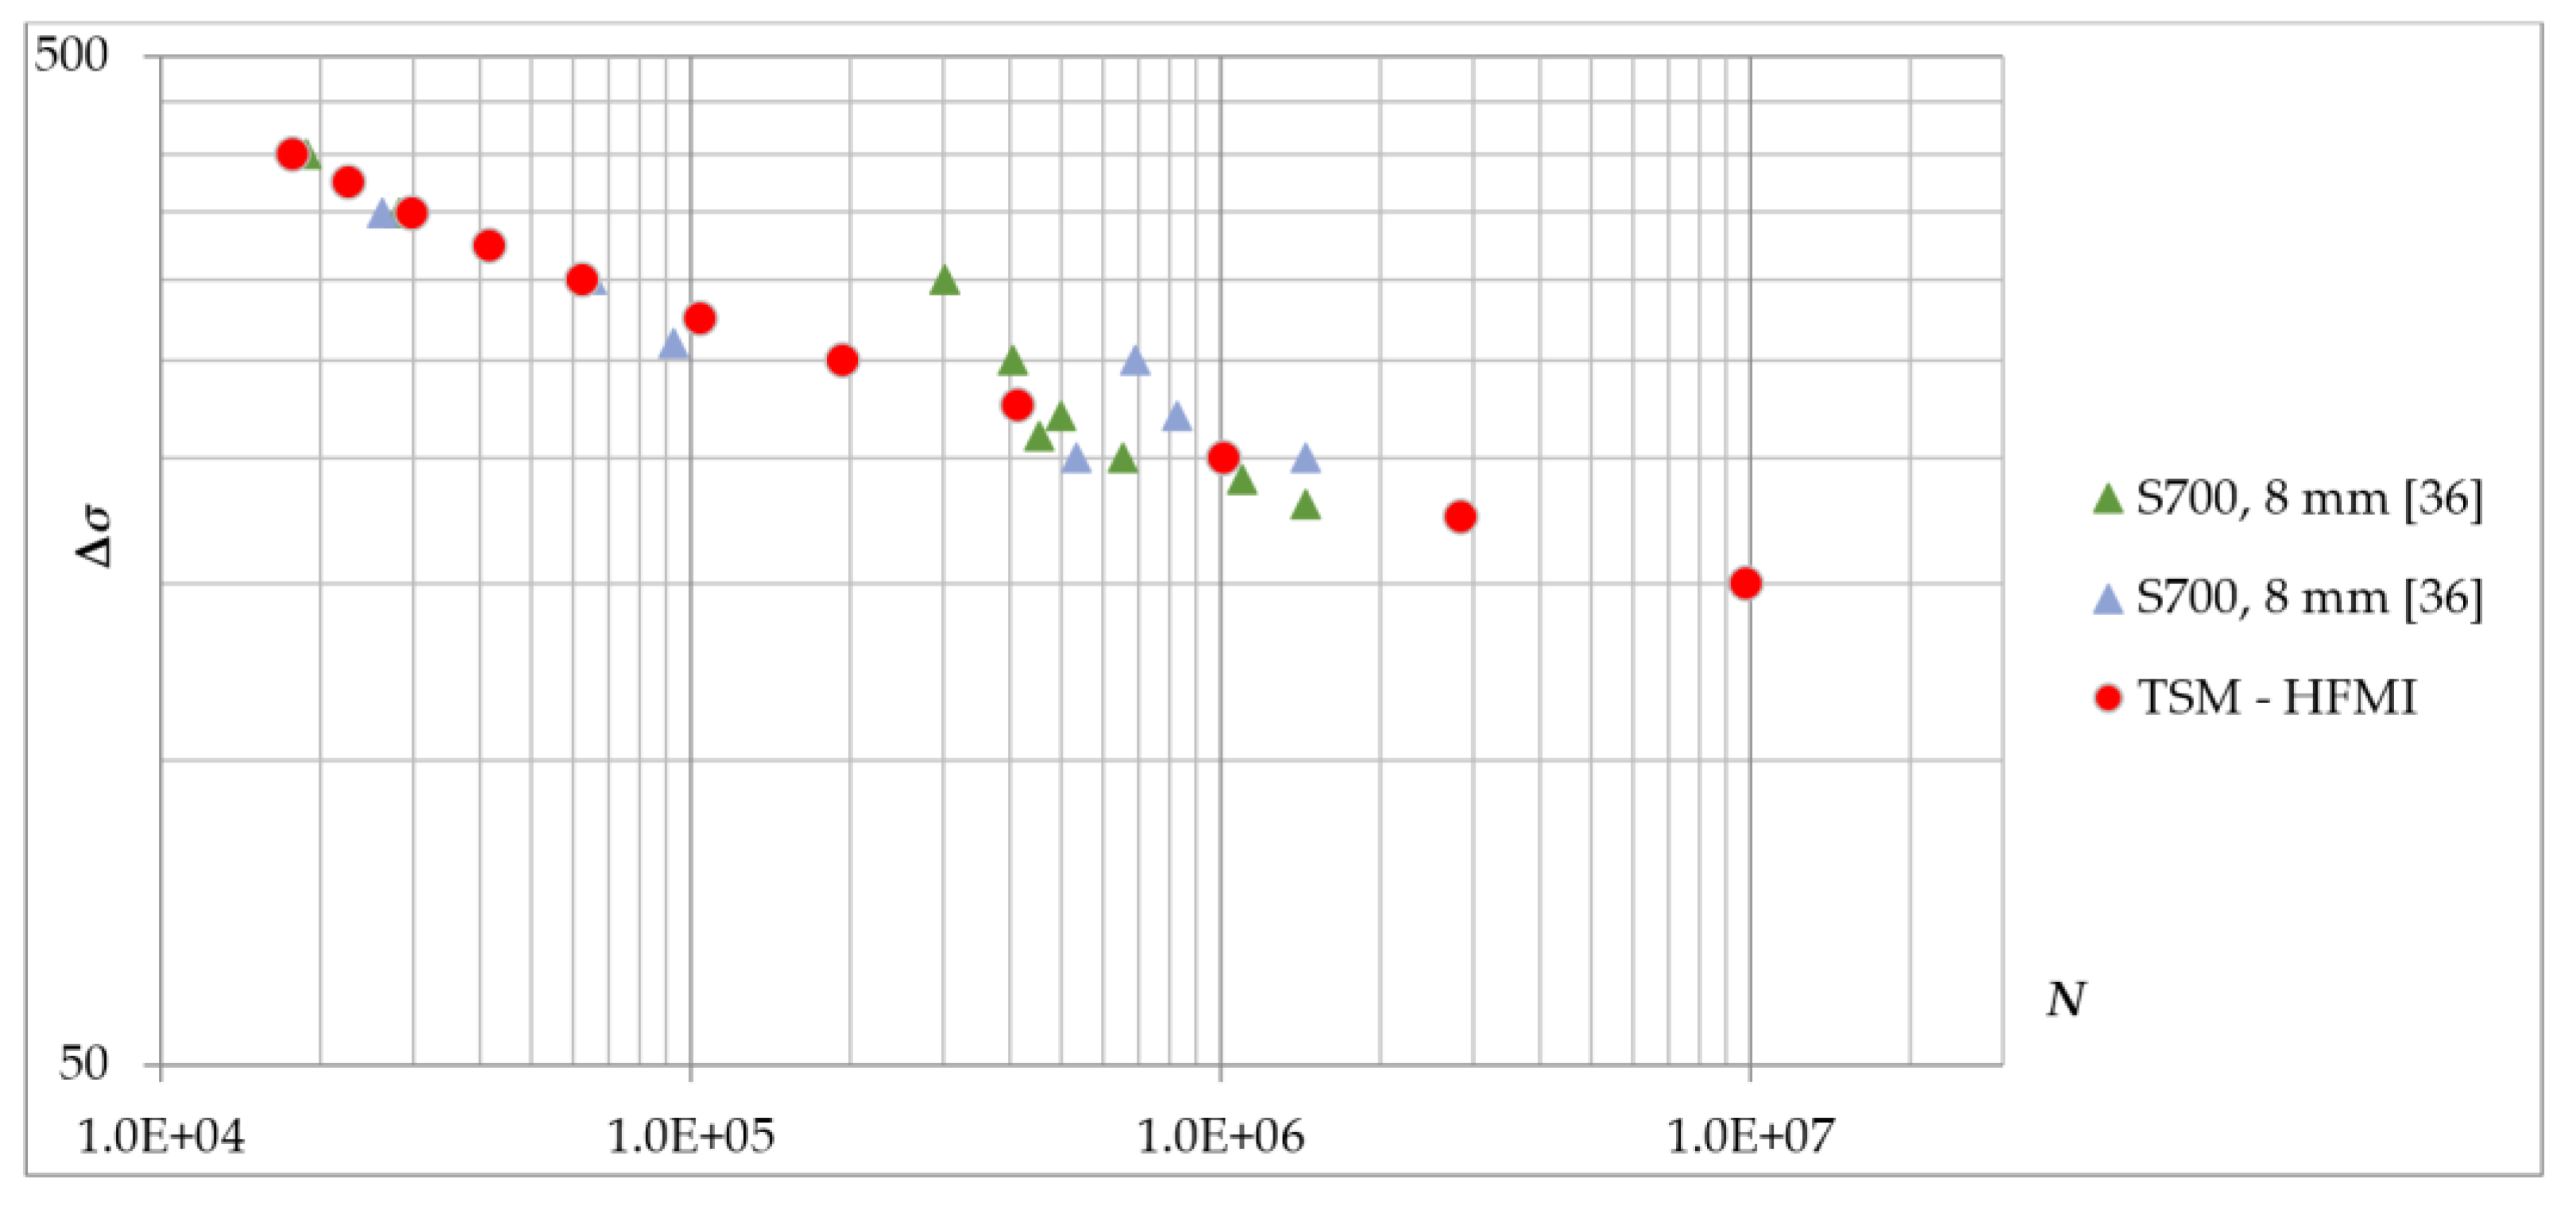
3.1.5. Results of the TSM

This section presents the calculated fatigue lives of longitudinal attachment with the TSM. Based on the literature survey in the previous section, for calibration purposes, the stress concentration factor value of Kt = 3.27 was adopted for the AW condition and Kt = 2.05 for the HFMI-treated condition. Residual stresses are assumed to be 340 MPa for the AW condition and −400 MPa for the HFMI-treated condition. The hardness value in the AW condition in a weld toe area is adopted as HB = 230, and for the HFMI-treated condition, it is HB = 240. The stress ratio is assumed to be R = 0.1. The general concept and ability of the TSM to calculate the fatigue life of longitudinal attachment welded steel detail in the AW condition and the HFMI-treated condition is validated in terms of a comparison of the model results, with test results provided in the literature. S800, S355 and 16Mn are different steel grades used in similar welded details, with plate thicknesses of t = 8 mm. The results are presented in Figure 9 and Figure 10.
In Figure 9 and Figure 10, the fatigue lives are given for different stress ranges. According to the TSM model for assumed parameters for AW and HFMI-treated conditions, the calculated fatigue lives for different stress ranges shows a good agreement with test results given in the literature.

3.2. Parametric Study

A parametric study of the Two-Stage Model (TSM) was performed for different steel grades in order to investigate the influence of steel strength and HFMI parameters on fatigue lives of a welded steel detail with longitudinal attachment. Within the parametric study, three steel grades, S355, S690 and S960, were chosen. As mentioned before, a wide range of different HFMI improvement parameters for every steel grade is provided in the literature. Consequently, for the purpose of parametric analysis, the most favourable and unfavourable improvement parameters combinations were adopted for corresponding steel grades (Table 2). For example, in the case of steel grade S355 and the AW condition, the most favourable combination will be the result of minimum values of stress concentration and residual stress and the maximum value of hardness. Analogously, the most unfavourable combination will be the result of maximum values of stress concentration and residual stress and the minimum value of hardness. Such combinations were adopted for both AW and HFMI conditions, resulting in the upper and lower bound of calculated fatigue lives.
The results of the parametric study are shown in Figure 11, Figure 12 and Figure 13, with the intervals of the fatigue lives according to the TSM between most favourable (Upper Bound—UB) and unfavourable (Lower Bound—LB) improvement parameters for the AW and HFMI-treated condition. The results are plotted for different steel grades in order to present the influence of steel strength on the fatigue lives of welded steel detail. AW and HFMI-treated conditions are plotted on the same diagram to show the increase in fatigue life for the HFMI-treated condition.
Results from Figure 10, Figure 11, Figure 12 and Figure 13 show a significant increase in calculated fatigue lives for HFMI-treated details in comparison to the AW condition. The HFMI method improves the geometry of the weld toe and thus reduces the stress concentration factor, which ensures longer fatigue life. As mentioned before, the HFMI method also modifies the residual stress state at the weld toe. It is able to introduce higher compressive residual stresses in high-strength steel, which has a significant influence on increasing the fatigue life. It is shown that HFMI-treated details for steel grade S960 (Figure 13) have much longer fatigue lives than the same detail made of steel grade S355 (Figure 10). To show the impact of steel quality more clearly, results for the HFMI-treated state (LB) are presented in Figure 14 for three steel grades. It can be seen that details with a steel grade of S690 have increased fatigue lives in relation to S355, but are considerably lower in relation to details made of steel S960.
Due to plastic deformation in the treatment zone, the HFMI treatment causes an increase in local hardness at the weld toe, leading to a local increase in tensile strength. It is shown in Table 2 that the HFMI treatment is significantly more effective in increasing the hardness in lower-strength steel grades. For steel S960, the increase in hardness is negligible. Besides that, Figure 12 shows that a HFMI-treated detail made of high-strength steel S960 has the longest fatigue life, proving that compressive residual stresses have the highest impact on the fatigue lives of HFMI-treated welded steel details.

4. Conclusions

This paper presents the development of a Two-Stage Model consisting of the strain–life approach and the crack propagation approach and its application for fatigue life assessment of AW and HFMI-treated welded steel details. The model is developed and calibrated for the longitudinal attachment detail for AW and HFMI-treated conditions. The results are validated with the test results given in the literature. It is shown that the Two-Stage Model is able to predict the fatigue life of welded steel details in AW and HFMI-treated conditions, which is proven by comparing the calculated results with the test results of similar details given in the literature. Parametric analysis of the Two-Stage Model shows that the HFMI-treated details made of high-strength steel grades have longer fatigue lives due to the introduction of larger compressive residual stresses for the same geometry. However, to develop a more reliable model, it is necessary to calibrate it with specific laboratory fatigue tests where HFMI improvement parameters will be measured on tested specimens.

Author Contributions

Conceptualization, B.F. and I.L.; methodology, B.F. and I.L.; validation, B.F., I.L. and D.S.; writing—original draft preparation, B.F. and I.L; writing—review and editing, all authors; visualization, B.F. and I.L.; supervision, I.L., D.S. and M.L.; funding acquisition, I.L. All authors have read and agreed to the published version of the manuscript.

Funding

This research received no external funding.

Institutional Review Board Statement

Not applicable.

Informed Consent Statement

Not applicable.

Data Availability Statement

The data presented in this study are available on request from the corresponding author.

Conflicts of Interest

The authors declare no conflict of interest.

References

  1. Schijve, J. Fatigue as a Phenomenon in the Material. In Fatigue of Structures and Materials; Kluwer Academic Publishers: Dordrecht, The Netherlands, 2004; pp. 7–44. [Google Scholar]
  2. Maddox, S.J. Fatigue Strength of Welded Structures, 2nd ed.; Abington Publishing: Cambridge, UK, 1991. [Google Scholar]
  3. Haagensen, P.J.; Maddox, S.J. IIW Recommendations on Methods for Improving the Fatigue Strength of Welded Joints: IIW-2142-110; Woodhead Publishing: Cambridge, UK, 2013; ISBN 978-1-78242-065-1. [Google Scholar]
  4. Marquis, G.B.; Barsoum, Z. IIW Recommendations for the HFMI Treatment for Improving the Fatigue Strength of Welded Joints; Springer Science & Business Media: Singapore, 2016; ISBN 978-981-10-2503-7. [Google Scholar]
  5. Mikkola, E. A study on effectiveness limitations of high-frequency mechanical impact. Doctoral Dissertation, Aalto University, Espoo, Finland, 2016. [Google Scholar]
  6. Fuštar, B.; Lukačević, I.; Dujmović, D. High-Frequency mechanical impact treatment of welded joints. Gradjevinar 2020, 72, 421–436. [Google Scholar] [CrossRef]
  7. European Committee for Standardization (CEN). Eurocode 3: Design of steel structures, Part 1–9: Fatigue (EN 1993-1-9:2005); CEN: Brussels, Belgium, 2005.
  8. European Committee for Standardization—Technical Committee 250 (CEN/TC 250). Eurocode 3: Design of Steel Structures (prEN 1993-1-9 Final Draft: 2020); CEN/TC 250: Brussels, Belgium, 2020.
  9. Fuštar, B.; Lukačević, I.; Dujmović, D. Review of fatigue assessment methods for welded steel structures Fatigue of welded joints. Adv. Civ. Eng. 2018, 2018, 3597356. [Google Scholar] [CrossRef] [Green Version]
  10. Radaj, D.; Sonsino, C.M.; Fricke, W. Fatigue Assessment of Welded Joints by Local Approaches, 2nd ed.; Woodhead Publishing and Maney Publishing: Cambridge, UK, 2006. [Google Scholar] [CrossRef]
  11. Hobbacher, A.F. Erratum to: Recommendations for Fatigue Design of Welded Joints and Components; Springer: Cham, Switzerland, 2019. [Google Scholar] [CrossRef] [Green Version]
  12. Ottersböck, M.J.; Leitner, M.; Stoschka, M.; Maurer, W. Crack Initiation and Propagation Fatigue Life of Ultra High-Strength Steel Butt Joints. Appl. Sci. 2019, 9, 4590. [Google Scholar] [CrossRef] [Green Version]
  13. Leitner, M.; Simunek, D.; Shah, S.F.; Stoschka, M. Numerical fatigue assessment of welded and HFMI-treated joints by notch stress/strain and fracture mechanical approaches. Adv. Eng. Softw. 2016, 120, 96–106. [Google Scholar] [CrossRef]
  14. Röscher, S.; Knobloch, M. Towards a prognosis of fatigue life using a Two-Stage-Model: Application to butt welds. Steel Constr. 2019, 12, 198–208. [Google Scholar] [CrossRef]
  15. Baptista, C.; Reis, A.; Nussbaumer, A. Probabilistic S-N curves for constant and variable amplitude. Int. J. Fatigue 2017, 101, 312–327. [Google Scholar] [CrossRef]
  16. Yıldırım, H.C. Recent results on fatigue strength improvement of high-strength steel welded joints. Int. J. Fatigue 2017, 101, 408–420. [Google Scholar] [CrossRef]
  17. Yıldırım, H.C.; Marquis, G.B. A round robin study of high-frequency mechanical impact (HFMI)-treated welded joints subjected to variable amplitude loading. Weld. World 2013, 57, 437–447. [Google Scholar] [CrossRef]
  18. Marquis, G.; Barsoum, Z. Fatigue strength improvement of steel structures by high-frequency mechanical impact: Proposed procedures and quality assurance guidelines. Weld. World 2014, 58, 19–28. [Google Scholar] [CrossRef]
  19. Peterson, R.E. Notch sensitivity. In Metal Fatigue; McGraw-Hill: New York, NY, USA, 1959; pp. 293–306. [Google Scholar]
  20. Neuber, H. Über die Berücksichtigung der Spannungskonzentration bei Festigkeitsberechnungen. Konstruktion 1968, 20, 245–251. [Google Scholar]
  21. Radaj, D. Design and Analysis of Fatigue Resistant Welded Structures; Woodhead Publishing: Cambridge, UK, 1990. [Google Scholar]
  22. Seeger, T. Grundlagen für Betriebsfestigkeitsnachweise (Stahlbau Handbuch); Stahlbau-Verlagsges: Köln, Germany, 1996. [Google Scholar]
  23. Lihavainen, V.M.; Marquis, G. Estimation of fatigue life improvement for ultrasonic impact treated welded joints. Steel Res. Int. 2006, 77, 896–900. [Google Scholar] [CrossRef]
  24. Atzori, B.; Lazzarin, P. Notch sensitivity and defect sensitivity under fatigue loading: Two sides of the same medal. Int. J. Fract. 2001, 107, 1–8. [Google Scholar] [CrossRef]
  25. Glinka, G. Energy density approach to calculation of inelastic strain-stress near notches and cracks. Eng. Fract. Mech. 1985, 22, 485–508. [Google Scholar] [CrossRef]
  26. Hobbacher, A. The use of fracture mechanics in the fatigue analysis of welded joints. In Fracture Fatigue Welded Joints Struct; Elsevier Ltd.: Amsterdam, The Netherlands, 2011; pp. 91–112. [Google Scholar] [CrossRef]
  27. Ramberg, W.; Osgood, W.R. Description of Stress–Strain Curves by Three Parameters; National Advisory Comittee for Aeronautics, Rep. 902; University of Washington Libraries: Washington, DC, USA, 1943. [Google Scholar]
  28. Neuber, H. Kerbspannungslehre: Grundlagen für Genaue Spannungsrechnung; Springer: Berlin/Heidelberg, Germany, 1937. [Google Scholar] [CrossRef]
  29. Masing, G. Eigenspannungen und Verfestigung beim Messing. In Proceedings of the 2nd International Congress for Applied Mechanics, Zurich, Switzerland, 12–17 September 1926; pp. 332–335. [Google Scholar]
  30. Chattopadhyay, A.; Glinka, G.; El-Zein, M.; Qian, J.; Formas, R. Stress analysis and fatigue of welded structures. Weld. World 2011, 55, 2–21. [Google Scholar] [CrossRef]
  31. Hou, C.Y.; Charng, J.J. Models for the Estimation of Weldemnt Fatigue Crack Initiation Life. Int. J. Fatigue 1997, 19, 537–541. [Google Scholar] [CrossRef]
  32. Paris, P.; Erdogan, F. A critical analysis of crack propagation laws. J. Fluids. Eng. Trans. Am. Soc. Mech. Eng. 1963, 85, 528–533. [Google Scholar] [CrossRef]
  33. Wang, T.; Wang, D.; Huo, L.; Zhang, Y. Discussion on fatigue design of welded joints enhanced by ultrasonic peening treatment (UPT). Int. J. Fatigue 2009, 31, 644–650. [Google Scholar] [CrossRef]
  34. Lihavainen, V.M.; Marquis, G.; Statnikov, E.S. Fatigue strength of a longitudinal attachment improved by ultrasonic impact treatment. Weld. World 2004, 48, 67–73. [Google Scholar] [CrossRef]
  35. Huo, L.; Wang, D.; Zhang, Y. Investigation of the fatigue behaviour of the welded joints treated by TIG dressing and ultrasonic peening under variable-amplitude load. Int. J. Fatigue 2005, 27, 95–101. [Google Scholar] [CrossRef]
  36. Haagensen, P.J.; Alnes, Ø. Progress Report on IIW WG2 Round Robin Fatigue Testing Program on 700 MPa and 350 MPa YS Steels. IIW Doc, XIII-2081-05; International Institute of Welding: Paris, France, 2005. [Google Scholar]
  37. Leitner, M.; Ottersböck, M.; Pußwald, S.; Remes, H. Fatigue strength of welded and high frequency mechanical impact (HFMI) post-treated steel joints under constant and variable amplitude loading. Eng Struct 2018, 163, 215–223. [Google Scholar] [CrossRef]
  38. Leitner, M.; Barsoum, Z.; Schäfers, F. Crack propagation analysis and rehabilitation by HFMI of pre-fatigued welded structures. Weld. World 2016, 60, 581–592. [Google Scholar] [CrossRef] [Green Version]
  39. Kim, K.S.; Chen, X.; Han, C.; Lee, H.W. Estimation methods for fatigue properties of steels under axial and torsional loading. Int. J. Fatigue 2002, 24, 783–793. [Google Scholar] [CrossRef]
  40. Bäumel, A.; Seeger, T.; Boller, C. Materials Data for Cyclic Loading. Supplement 1. Materials science monographs; Elsevier: Amsterdam, The Netherlands, 1990; Volume 3. [Google Scholar]
  41. Korkmaz, S. Extension of the Uniform Material Law for High Strength Steels. Master’s Thesis, Bauhaus University Graduate School of Structural Engineering, Weimar, Germany, 2008. [Google Scholar]
  42. Roessle, M.L.; Fatemi, A. Strain-controlled fatigue properties of steels and some simple approximations. Int. J. Fatigue 2000, 22, 495–511. [Google Scholar] [CrossRef]
  43. Dowling, N.E. Notched Member Fatigue Life Predictions Combining Crack Initiation and Propagation. Fatigue Fract. Eng. Mater. Struct. 1979, 2, 129–138. [Google Scholar] [CrossRef]
  44. Yıldırım, H.C.; Marquis, G.; Sonsino, C.M. Lightweight design with welded high-frequency mechanical impact (HFMI) treated high-strength steel joints from S700 under constant and variable amplitude loadings. Int. J. Fatigue 2016, 91, 466–474. [Google Scholar] [CrossRef]
  45. Suominen, L.; Khurshid, M.; Parantainen, J. Residual stresses in welded components following post-weld treatment methods. Procedia Eng. 2013, 66, 181–191. [Google Scholar] [CrossRef] [Green Version]
  46. Schubnell, J.; Eichheimer, C.; Ernould, C.; Maciolek, A.; Rebelo-Kornmeier, J.; Farajian, M. The influence of coverage for high frequency mechanical impact treatment of different steel grades. J. Mater. Process. Technol. 2020, 277, 116437. [Google Scholar] [CrossRef]
  47. Schubnell, J.; Pontner, P.; Wimpory, R.C.; Farajian, M.; Schulze, V. The influence of work hardening and residual stresses on the fatigue behavior of high frequency mechanical impact treated surface layers. Int. J. Fatigue 2020, 134, 105450. [Google Scholar] [CrossRef]
  48. METINVEST. Available online: https://metinvestholding.com/en/products/steel-grades/s690q (accessed on 12 May 2021).
  49. Wohlfahrt, H. Auswirkungen mechanischer Oberflächenbehandlungen auf das Dauerschwingverhalten unter Einschluss von Rissbildung und Rissausbreitung. In Mechanische Oberflächenbehandlungen; Wohlfahrt, H., Krull, P., Eds.; Wiley-VCH: Weinheim, Germany, 2000; pp. 56–85. [Google Scholar]
Figure 1. Untreated weld toe—AW (left) and treated weld toe—HFMI (right) on the specimen with longitudinal attachment.
Metals 11 01318 g001
Figure 2. HFMI treatment of weld toe: (a) HFMI treatment (b) fatigue improvement parameters.
Metals 11 01318 g002
Figure 3. Crack size in relation to a number of stress cycles.
Metals 11 01318 g003
Figure 4. The concept of similarity for the “notch strain” approach.
Metals 11 01318 g004
Figure 5. Hysteresis loop in the weld notch.
Metals 11 01318 g005
Figure 6. Stress and strain concentration factors in the elastic and plastic state.
Metals 11 01318 g006
Figure 7. Typical crack propagation curve.
Metals 11 01318 g007
Figure 8. Flowchart of the TSM.
Metals 11 01318 g008
Figure 9. Results of calculated fatigue life for AW condition.
Metals 11 01318 g009
Figure 10. Results of calculated fatigue life for HFMI-treated condition.
Metals 11 01318 g010
Figure 11. Results of calculated fatigue life for S355 (AW and HFMI condition).
Metals 11 01318 g011
Figure 12. Results of calculated fatigue life for S690 (AW and HFMI condition).
Metals 11 01318 g012
Figure 13. Results of calculated fatigue life for S960 (AW and HFMI condition).
Metals 11 01318 g013
Figure 14. Results of calculated fatigue life for S355, S690 and S960 (HFMI condition, LB).
Metals 11 01318 g014
Table 1. Cyclic material parameters for strain–life curve.
ParameterUML [10]Extended UML [41]HM [42]
K1.61 fuσf’/(εf’)n1.65 fu
n0.15b/c0.15
σf1.5 fufu (1 + ψ)4.25 HB + 225
εf0.59 ψ0.58 ψ + 0.011/E(0.32 (HB)2 − 487 (HB) + 191,000
b−0.087−log (σf’/σE)/6−0.057 to −0.14
σE *0.45 fufu(0.32 + ψ)/6-
c−0.58−0.58−0.39 to 1.04
ψ **1.0 for (fu/E) ≤ 3 × 10⁻³
1.375 − 125 (fu/E) for (fu/E) > 3 × 10⁻³
and ≥0
0.5(cos(π(fu − 400)/2200) + 1)-
* σE—technical endurance limit in terms of stress. ** ψ—dimensionless factor related to ultimate strength fu and elastic modulus E.
Table 2. Adopted parameters for parametric analysis of TSM model.
Steel GradeS355S690S960
ParameterConditionminmaxminmaxminmax
Stress concentrationAW2.64.02.64.02.64.0
HFMI1.82.21.82.21.82.2
Residual stress
(at surface) (MPa)
AW252502540025600
HFMI−350−200−650−400−800−600
Hardness
(at surface) (HB)
AW146187230240320320
HFMI240290240270320340
Publisher’s Note: MDPI stays neutral with regard to jurisdictional claims in published maps and institutional affiliations.

