Article

Hot Deformation Behavior and Dynamic Recrystallization of Ultra High Strength Steel

1
State Key Laboratory of Advanced Special Steel, Shanghai University, Shanghai 200072, China
2
Shanghai Key Laboratory of Advanced Ferrometallurgy, Shanghai University, Shanghai 200072, China
3
School of Materials Science and Engineering, Shanghai University, Shanghai 200072, China
*
Authors to whom correspondence should be addressed.
Metals 2021, 11(8), 1239; https://doi.org/10.3390/met11081239
Submission received: 6 July 2021 / Revised: 28 July 2021 / Accepted: 29 July 2021 / Published: 4 August 2021

Abstract

:
In this paper, in order to improve the microstructure uniformity of an ultra-high strength martensitic steel with a strength greater than 2500 Mpa developed by multi-directional forging in the laboratory, a single-pass hot compression experiment with the strain rate of 0.01 to 1 s−1 and a temperature of 800 to 1150 °C was conducted. Based on the experimental data, the material parameters were determined, the constitutive model considering the influence of work hardening, the recrystallization softening on the dislocation density, and the recrystallized grain size model were established. After introducing the model into the finite element software DEFORM-3D, the thermal compression experiment was simulated, and the results were consistent with the experimental results. The rule for obtaining forging stock with a uniform and refinement microstructure was acquired by comparing the simulation and the experimental results, which are helpful to formulate an appropriate forging process.

1. Introduction

Ultra-high strength steel [1] has been widely used in military projects and large-scale equipment manufacturing because of its excellent properties. As a typical representative of high-alloyed and ultra-high strength steel, martensitic steel has good comprehensive properties. It is difficult to continues the improvement of the strength and toughness by forming a large number of participates in the matrix. Therefore, it is critical to make the microstructure of martensitic steel smaller and more uniform by studying the effect of the hot deformation process on the microstructure.
Martensitic steels are a low stacking fault energy steel [2], and their dislocations are easy to move and entangle. Therefore, the dislocation density can rapidly rise to the critical value of recrystallization. Therefore, the grain size of the metal is mainly affected by dynamic recrystallization during hot deformation. It is of meaning to study the dynamic recrystallization of martensitic steels. With the development of computer technology and the improvement of numerical analysis methods, using finite element software to simulate forging forming process [3], analyze process parameters [4], evaluation microstructure evolution (particle size and direction distribution) [5], and consider potential defect prevention based on simulation results [6] can reduce the costs of energy and material consumption and production. The hot deformation constitutive model describes the dynamic response between different thermal parameters (deformation temperature, strain rate, and dependent variable), dislocation density, grain size, or other structural parameters with the flow stress. Constructing an accurate and reliable constitutive model is the basis of the numerical simulation of plastic deformation. Dembiczak et al. [7] establish the mathematical model of high carbon bainitic steel, which includes the influence of initial grain size and strain rate and temperature on grain size. Knapinski et al. [8] used a Gleeble-3800 thermal/mechanical simulator (Gleeble3800, Dynamic Systems Inc, Austin, TX, USA) to study the microstructure evolution of an X80–X100 steel plate during hot deformation. Wu et al. [9] implanted the model obtained from the experimental data into DEFORM-3D (DEFORM V10.2, Science Forming Technology Corporation, Clumbus, OH, USA) and obtained the distribution of the recrystallization grain size and the recrystallization volume through finite element simulation.
Venkata Ramana et al. [10] established a constitutive model of a new high-strength low-alloy (HSLA) steel through a revised Zerilli–Armstrong equation, and this phenomenological strain included an Arrhenius model. The correlation coefficient (R) and the average absolute relative error (AARE) were then matched to show the accuracy of the constitutive model. Suwaree et al. [11] studied the constitutive behavior of aluminum piston alloys of AA4032 through the established constitutive equation for which the work hardening mechanism was higher than the softening mechanism during hot deformation. Lei et al. [12] fitted the constitutive model by using the fifth-order polynomial equation, which could accurately predict the flow stress of 3Cr1Si1Ni steel. However, most of the Arrhenius models used in the studies of ultra-high-strength steel constitutive model did not consider the effect of strain on flow stress.
The ultra-high strength martensitic steel developed in the laboratory has some defects such as poor toughness and crazing. It can effectively improve the toughness of steel and can reduce crazing, obtaining uniform and fine austenite grains through hot deformation before martensitic transformation. Therefore, it is necessary to study the relationship between hot deformation behavior and grain size. In this paper, the flow stress curves of the material at 800–1150 °C and 0.01–1 s−1 strain rate were obtained by single pass hot compression experiment. A constitutive equation considering work hardening and dynamic recrystallization softening during deformation was established. The dynamic recrystallization grain size model based on the fully crystalized microstructure was established. The research results provide theoretical guidance for the controlling of the microstructure during the high temperature deformation of the martensitic steel.

2. Experimental Procedure

The experimental material was a new type of high strength martensitic steel developed in the laboratory. After smelting in a vacuum consumable furnace, it was cast into a Φ 390 mm × 980 mm ingot. The nominal composition (weight percent) of the material is Si-0.57, Mn-0.036, Cr-0.505, Mo-0.305, Ni-4.9, Nb-0.47, Al-0.585, Co-2.48, and Fe balanced. According to the requirements of the Gleeble-3800 thermal simulator, the samples were processed in a cylinder of Φ10 mm × 15 mm via wire cutting. The experimental data of the single pass hot compression experiments by the Gleeble-3800 were analyzed to obtain the true stress–strain curves under different deformation conditions. The original microstructure of the central section is shown in Figure 1. Furthermore, an average grain size of 134.5 μm was obtained based on the straight-line intercept method of GB/T 6394-2017.
Before using the Gleeble-3800 thermal/mechanical simulator, the thermocouple was welded to the sample after sandpaper grinding to track and record the experimental data in real-time. In order to reduce the effect of friction on the experimental results, the ends and sides of the sample were sanded with fine sandpaper, and 0.1 mm tantalum sheets were added to ensure that the ends were parallel to each other for subsequent thermocouple welding.
In a vacuum of 1.33 × 10⁻⁵ Mpa, as shown in the Figure 2, the specimens were heated to 1200 °C at a rate of 10 °C/s and were held at that temperature for 5 min. The temperature of the specimens was then reduced to the predetermined deformation temperature at a speed of 5 °C/s and was held for 3 min. Finally, the specimens were compressed until the engineering strain was 65% in the Figure 3. After the test, the specimens were immediately quenched with water.
Wire electrical discharge machining (EDM) was used to cut the compressed specimens. The sample was then put through sandpaper rough grinding to remove the line cutting influence area followed by fine grinding and grinding, and finally, the specimens were polished until the surface was mirrored. After polishing, a mixture ratio of HF (4%) + HNO3 (2%) + H2O (92%) was used to corrode the sample in a constant temperature water bath at 60 °C for 2 min. After that, it was quickly rinsed with water and cleaned with alcohol, then dried with a blower. The grain size of the middle of the sample was then observed and recorded.

3. Results and Discussions

3.1. Discussion on Hot Deformation Behavior

Significantly, the friction between the end of the specimen and the grip caused the tail of the true stress–strain curve to warp up in various deformation conditions. Additionally, the more strain there was, the more obvious the effect of friction was as well [13]. According to the idea of friction correction: the real stress can be recalculated by introducing a friction factor based on the deformation force. The calculation formula is as follows [14]:
σ = F π r 2 1 + m 3 3 × 2 r l  
where σ is true stress (N); F is the deformation force (N); r is the transient average radius of the sample during compression (mm); l is the instantaneous length of specimen (mm); m is friction coefficient that is calculated using the energy method proposed by Ebrahimi et al. [15], and its calculation formula is as follows:
m = R H b 4 3 2 b 3 3  
where R is the average radius after deformation (mm); H is the height of the deformed specimen (mm); and b is the obstruction coefficient that can be estimated by the following formula:
b = 4 Δ R R H Δ H  
R = R 0 H 0 H  
In Equation (3), ΔR is the difference between the end radius and the bulge radius of the specimen after deformation (mm); ΔH is the height reduction of the specimen (mm); H0 is the height of the original specimen (mm); and R0 is the height of the original specimen (mm). The true stress–strain curve can be revised by the above formula. The modified flow–stress curve is obtained in Figure 4.
When the deformation temperature is 800 °C, the stress increases rapidly with the strain, but the increasing rate decreases gradually. It is because the work hardening dominates in the early stage of deformation, and the dynamic softening effect increases with the strain. After the peak strain, the true stress–strain curves are in a downward trend, which shows that the softening effect of dynamic recrystallization is greater than work hardening, meaning that the flow stress cannot reach the steady state, even if the true strain is 1. On the contrary, when the deformation temperature is above 900 °C, the true stress–strain curves reach the equilibrium stage of work hardening and dynamic softening. The true stress–strain curves with different strain rates have a similar trend. In the first stage, work hardening plays a leading role. When the strain enhances, the stress increases rapidly, and the dislocation density rises continuously. New grains will nucleate when the deformation accumulation reaches the critical strain of dynamic recrystallization, after which the flow stress will reach peak stress rapidly. In the second stage, because dynamic recrystallization is dominant, the flow stress decreases slightly with the strain. In the third stage, work hardening due to the increase of dislocation density caused by the increase of strain is balanced with dynamic recrystallization.

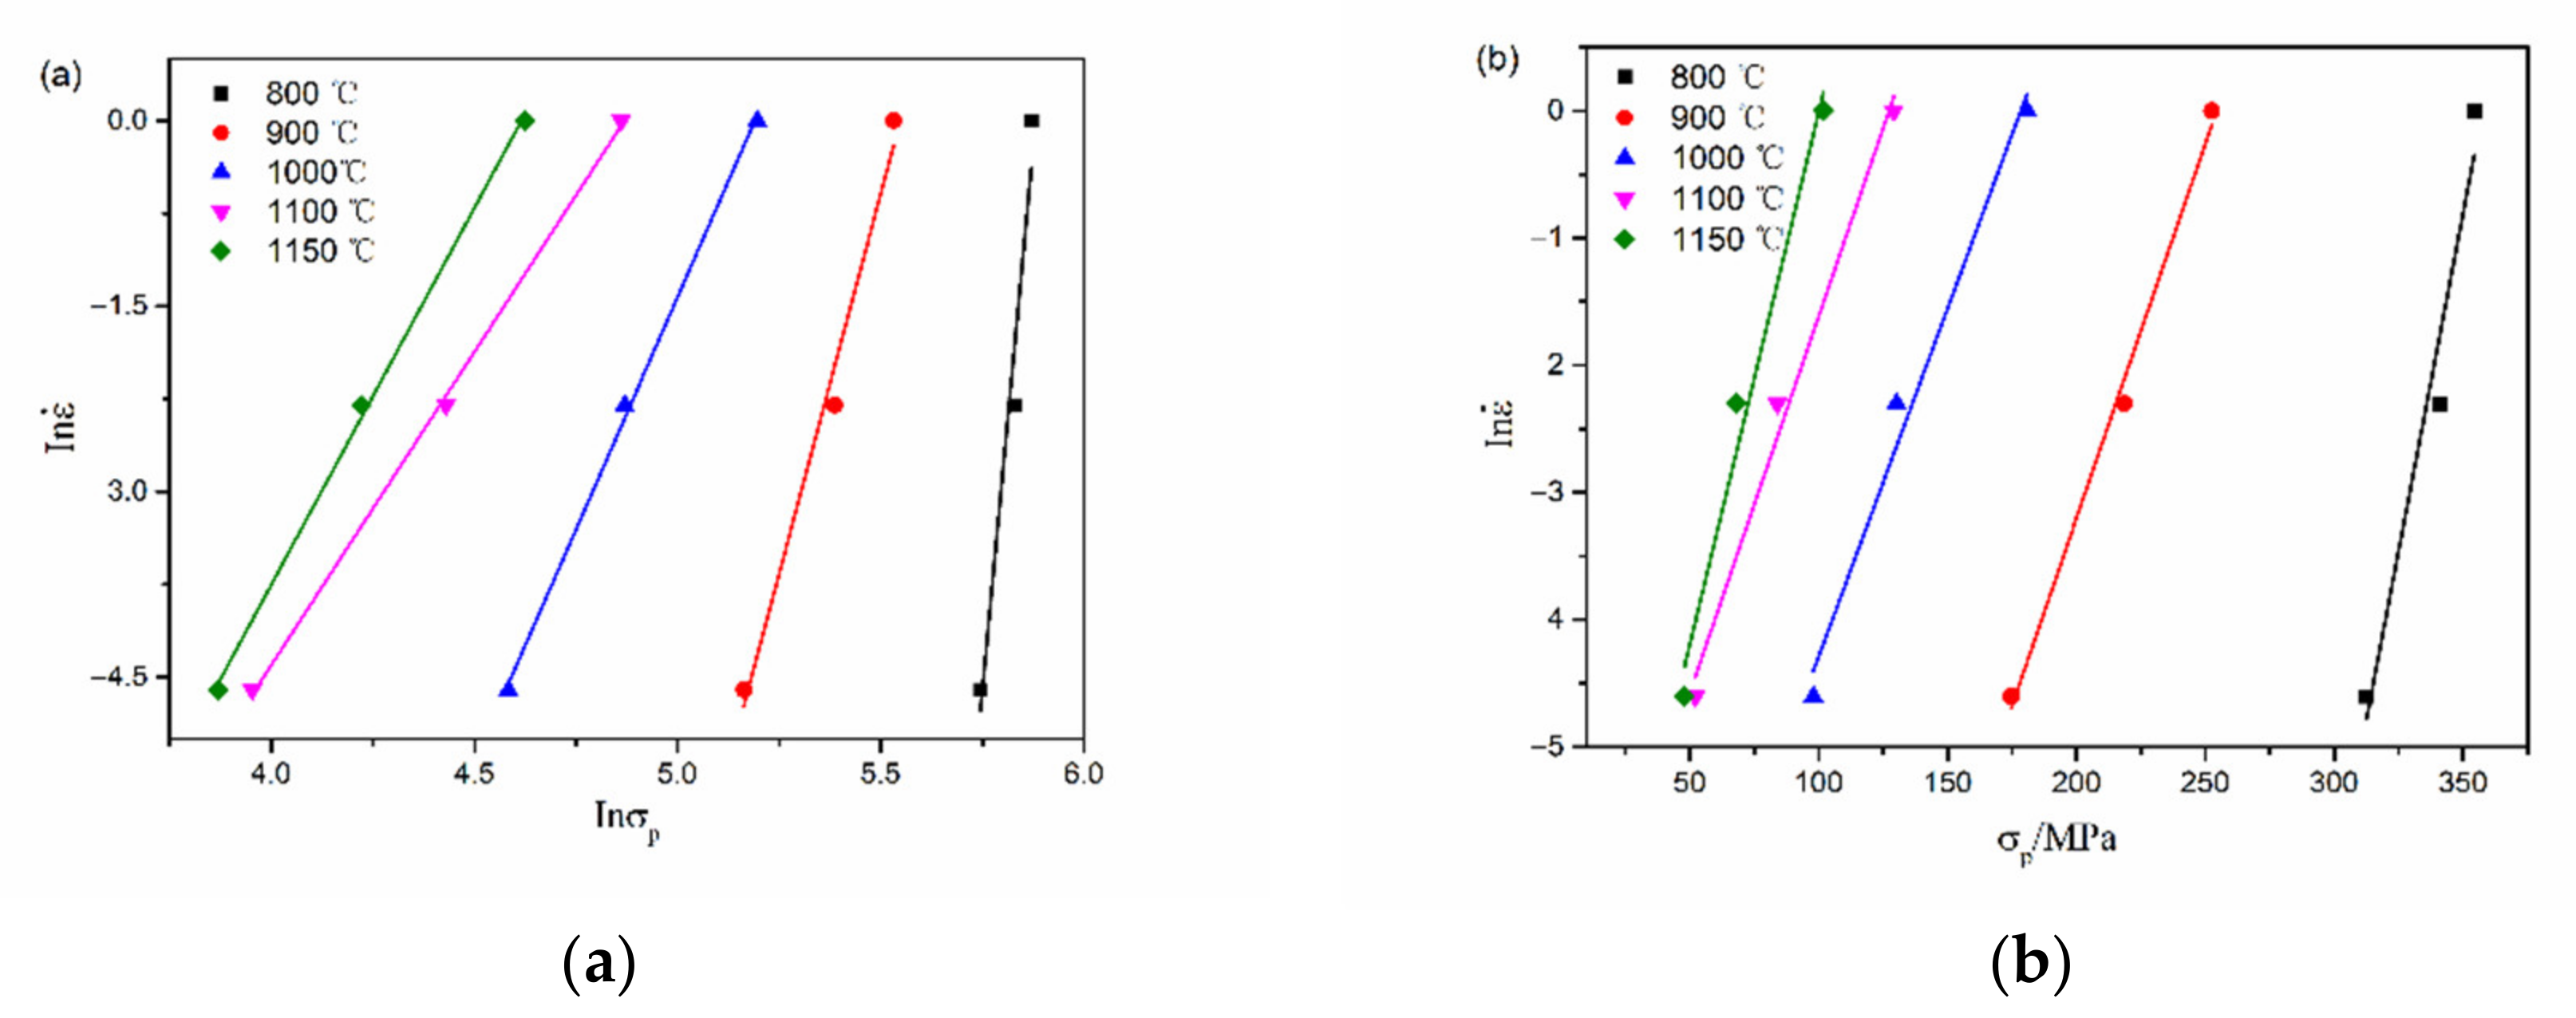
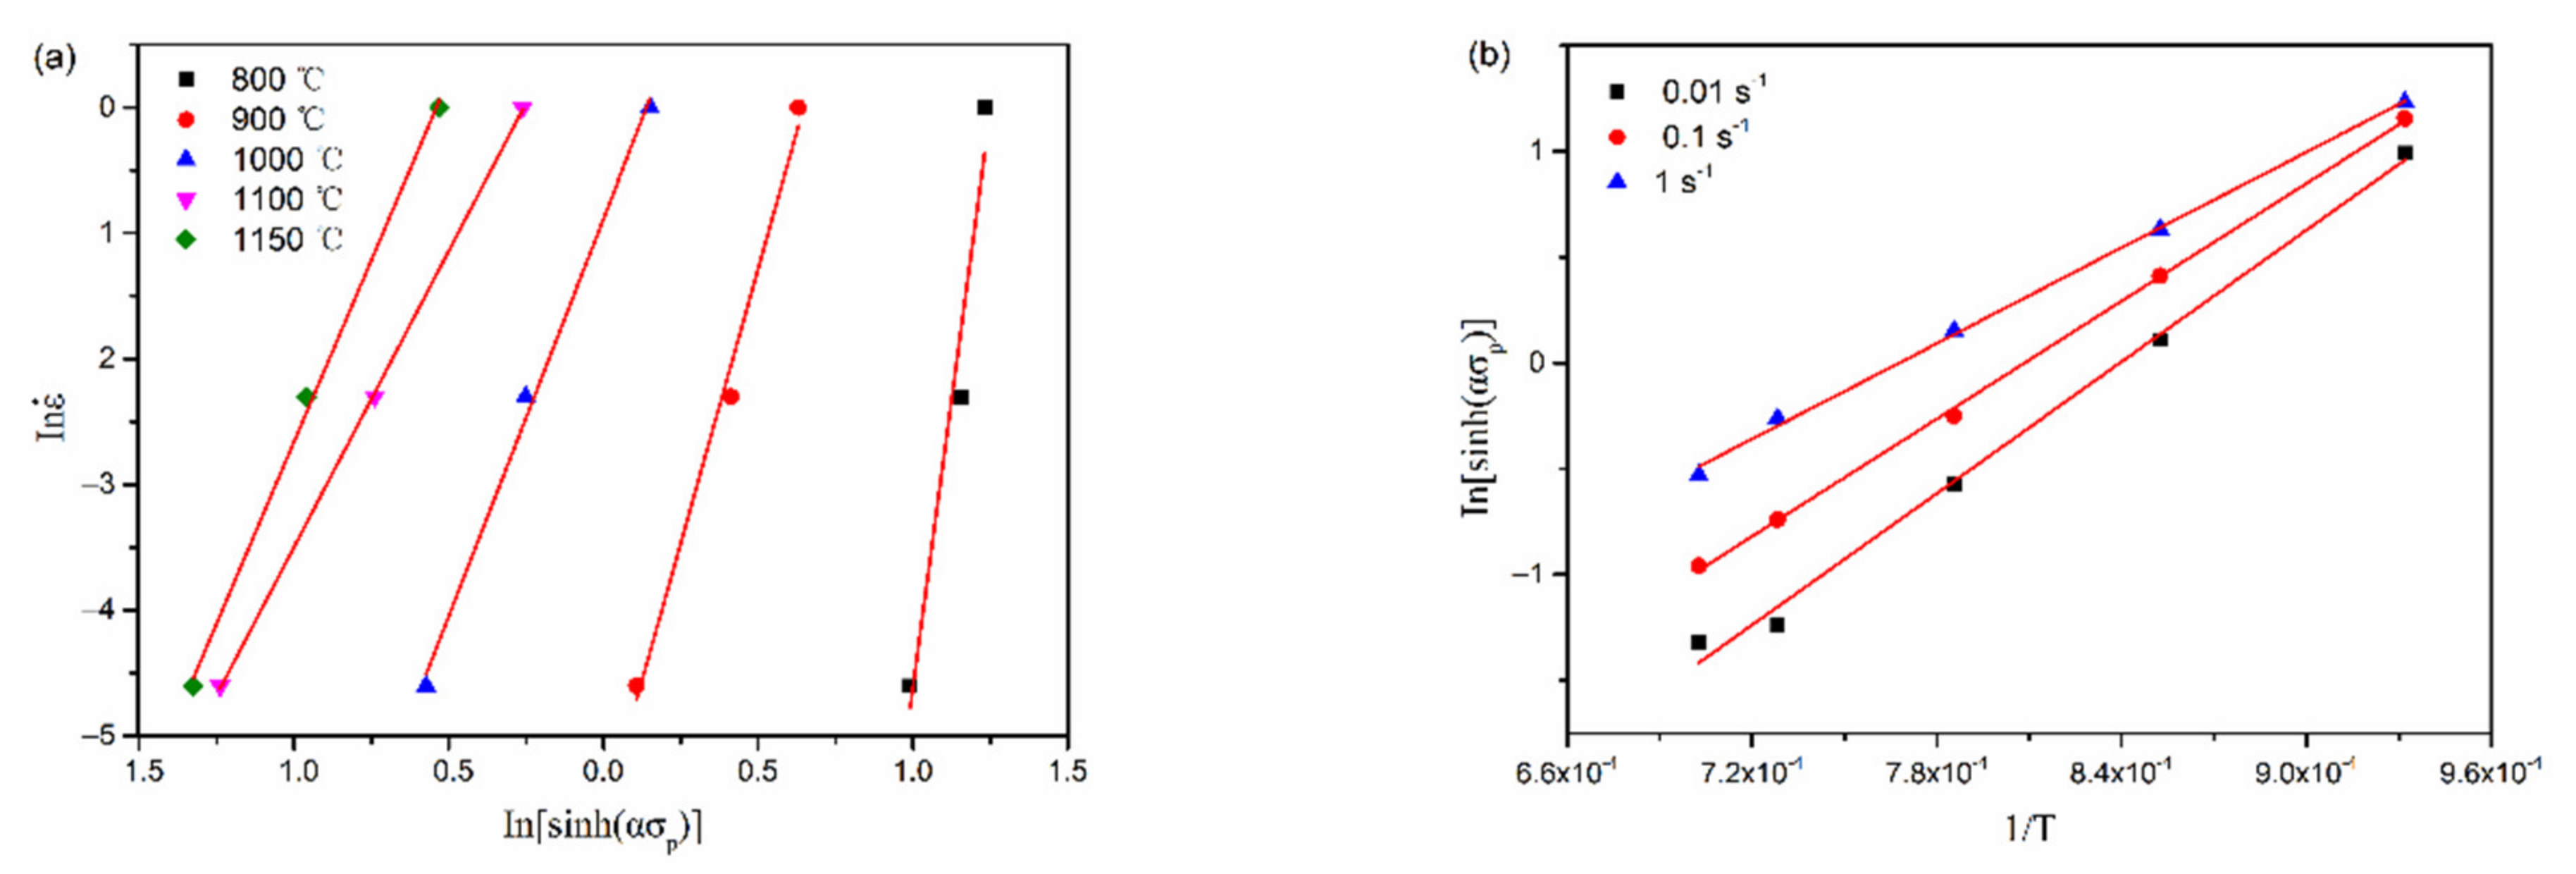
3.2. Establishment of Constitutive Model of Hot Deformation

At present, the Arrhenius model is widely used because it reveals rheological behavior in the plastic deformation process [16]. McQueen et al. [17] issued the Zener–Hollomon parameter (Z) by sorting out a large number of experimental data that can excellently describe the effects of strain rate, deformation temperature, and strain to flow stress [18]. The relationship between parameter Z and stress can be expressed as a hyperbolic sine relationship as follows:
z = A s i n   h α σ n = ε ˙ e x p Q R T
where A, α, and n are material constants; α is the rheological response (MPa); ε ˙ is the strain rate (s−1); R is the molar gas constant 8.314 (J/ (mol. k); Q is the hot deformation activation energy (J/mol); and T is the deformation temperature (K). In the case of high flow stress ( α σ > 1.2 ), it can be expressed by Equation (6). When the flow stress is low ( α σ < 0.8 ), it can be expressed by Equation (7). A 1 , A 2 ,     n , and β are material constants:
z = A 1 σ n = ε ˙ e x p Q R T
z = A 2 e x p β σ = ε ˙ e x p Q R T
The stress level parameter α can be expressed as follows:
α = β n
Taking logarithms on both sides of Equations (6) and (7), we can determine the following equation:
l n ε ˙ = l n A 1 + n l n σ Q / R T
l n ε ˙ = l n A 2 + β σ Q / R T
By entering the peak stress value (Table 1) in the Equation (9) and Equation (10), the diagrams l n ε ˙ - I n σ p and l n ε ˙ - σ p   are obtained (Figure 5). The linear slope n and β will be obtained [19], which is 13.2188 and 0.0725 respectively. When n and β are brought into Equation (8), we can obtain α   = 0.0055.
Taking the logarithm on both sides of Equation (5), the partial derivative of ln[sinh(σp)] with respect to 1/T and the partial derivative of l n ε ˙ with respect to ln[sinh(σp)] were obtained when keeping strain rate and temperature unchanged, respectively. The average slope of l n ε ˙ ln[sinh(σp)] was 8.786, and the average slope of ln[sinh(σp)]−1/T graph was 9050.6, which are also shown in Figure 6. As such, the deformation energy considering the effect of the temperature and strain rate is 661,118 J/mol.
Taking the logarithm of Equation (5), the linear relationship between lnZ and nln[sinh(ασp)] can be found in the Figure 7. The slope of the obtained straight line is 8.45, and this gives the stress index n of the material. The intercept lnA is 62.018 and gives a structure factor of A = 8.59 × 1026.
The relationship between parameter Z and the stress of the high-strength steel can be expressed by Equations (11) and (12).
σ P = 1 0.0055 I n z 8.59 × 10 26 1 8.45 + z 8.59 × 10 26 2 8.45 + 1 1 2
z = ε ˙ e x p 661118 R

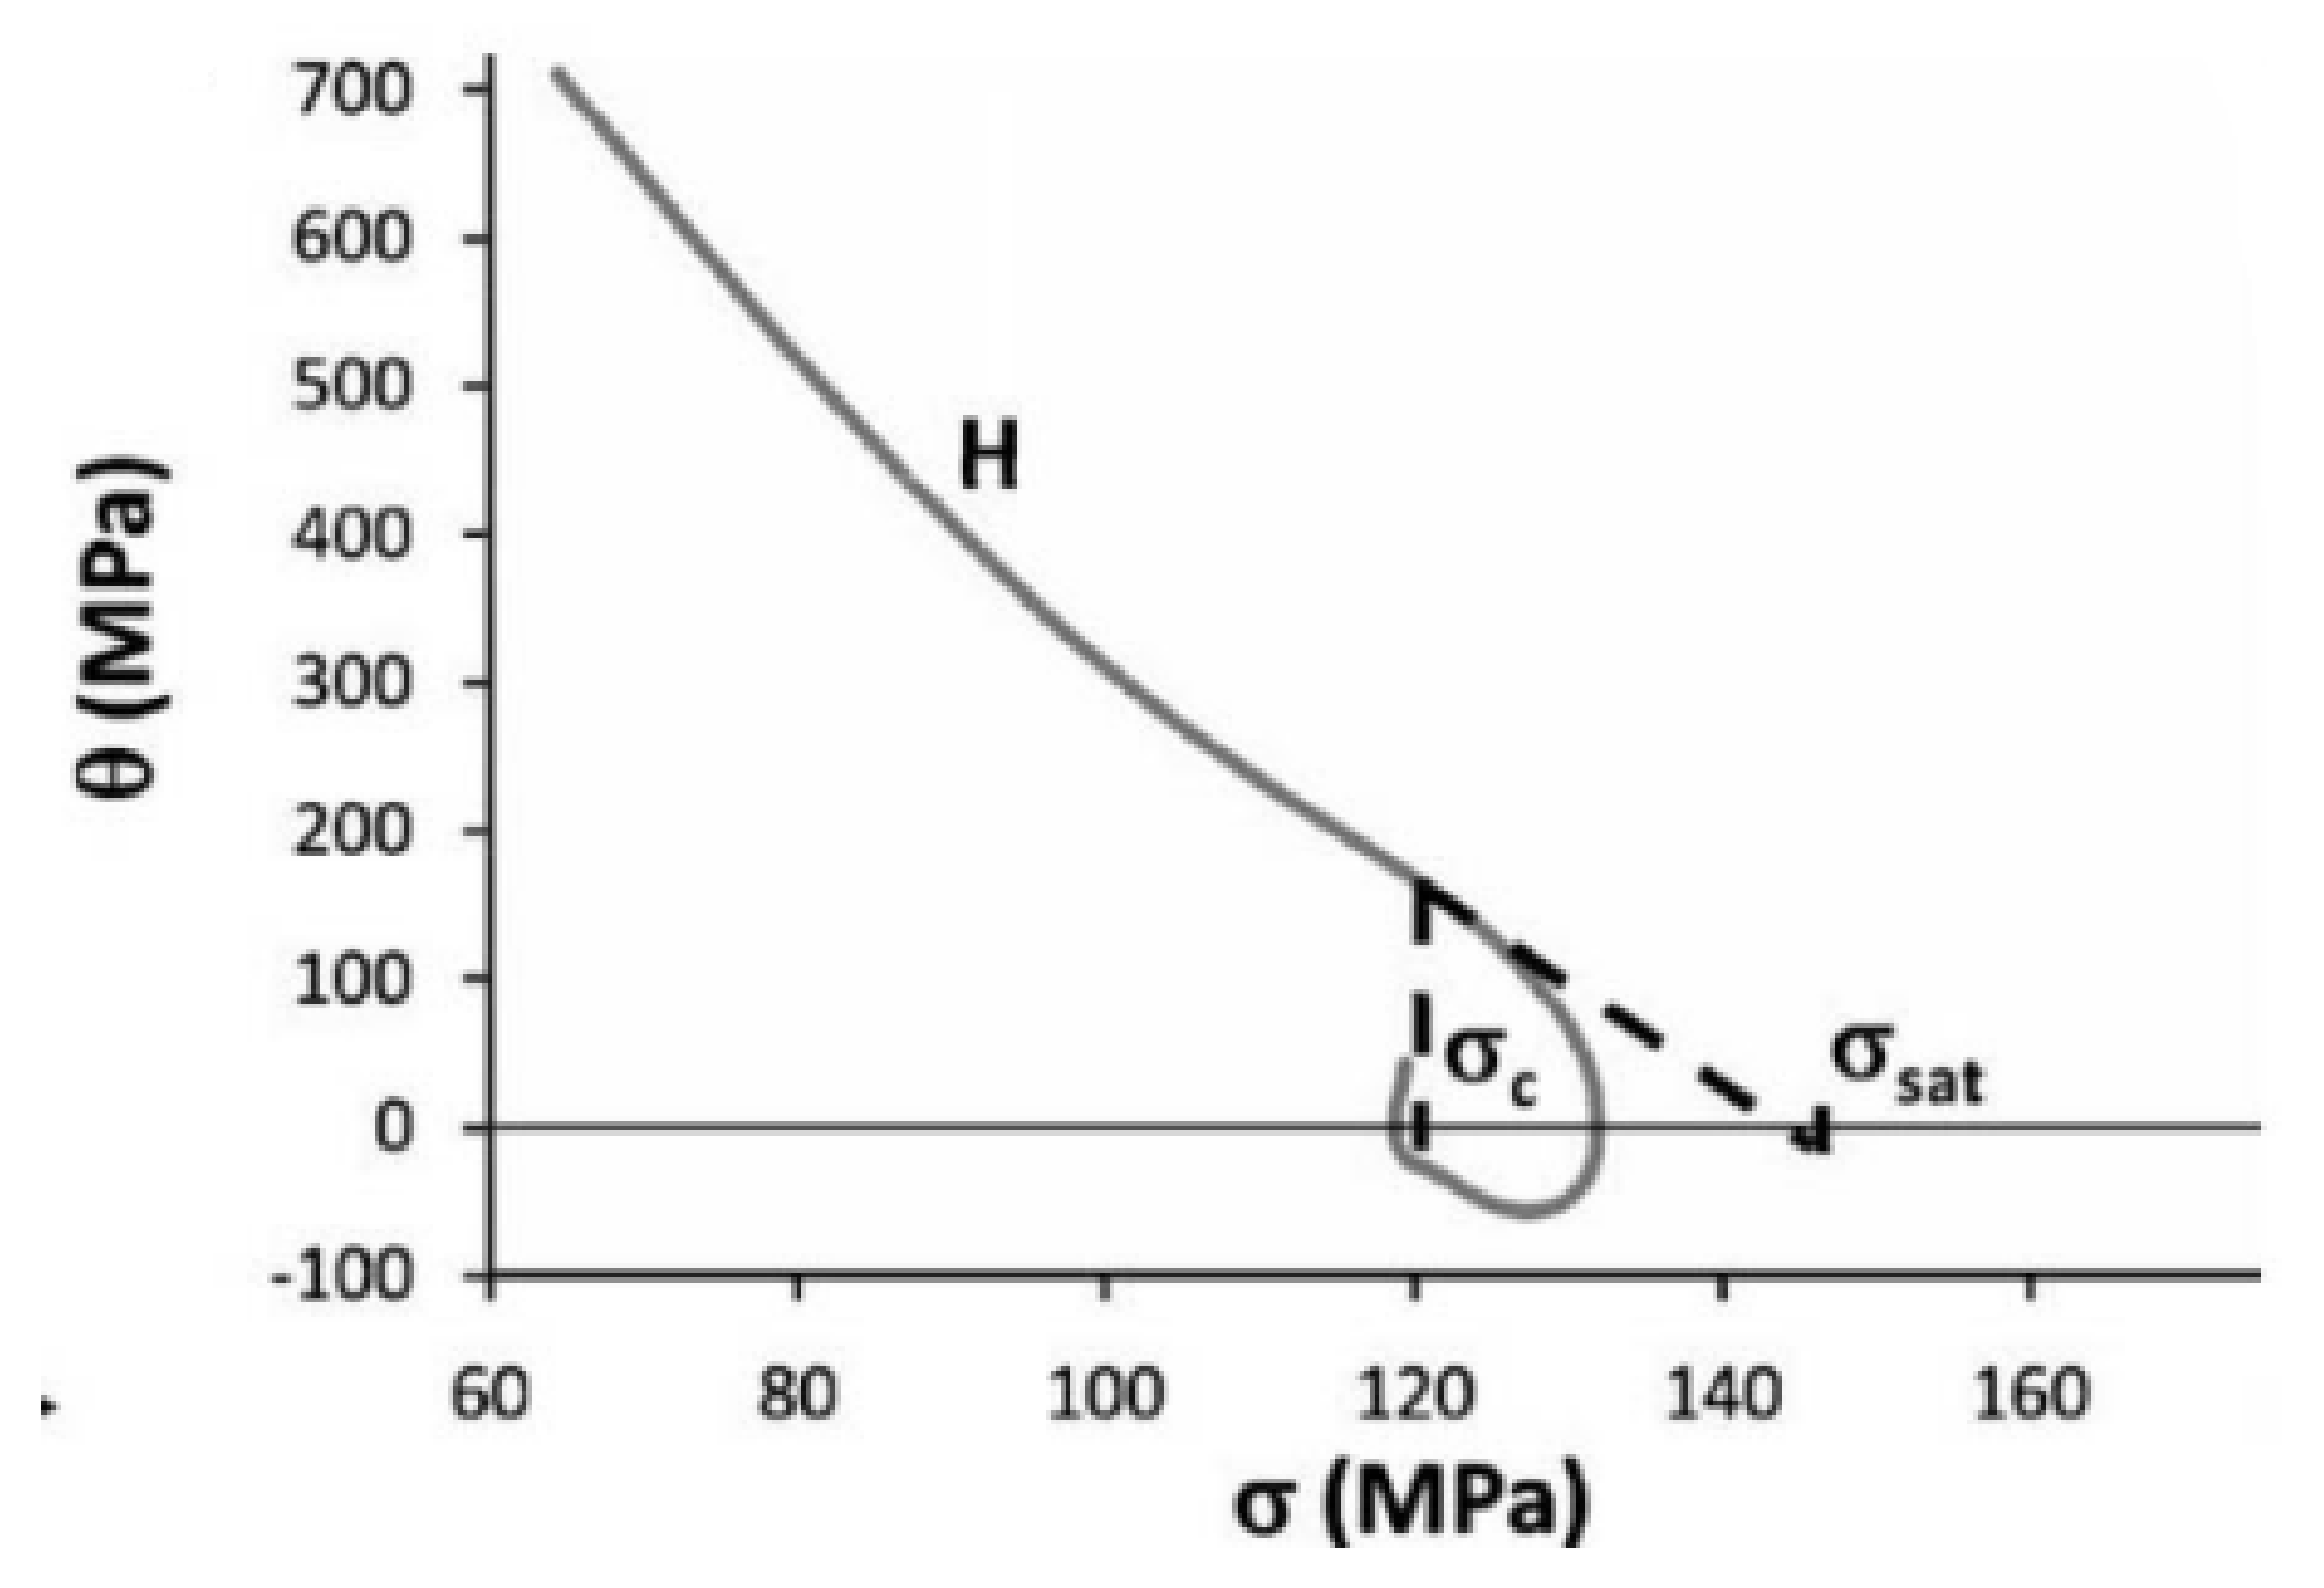
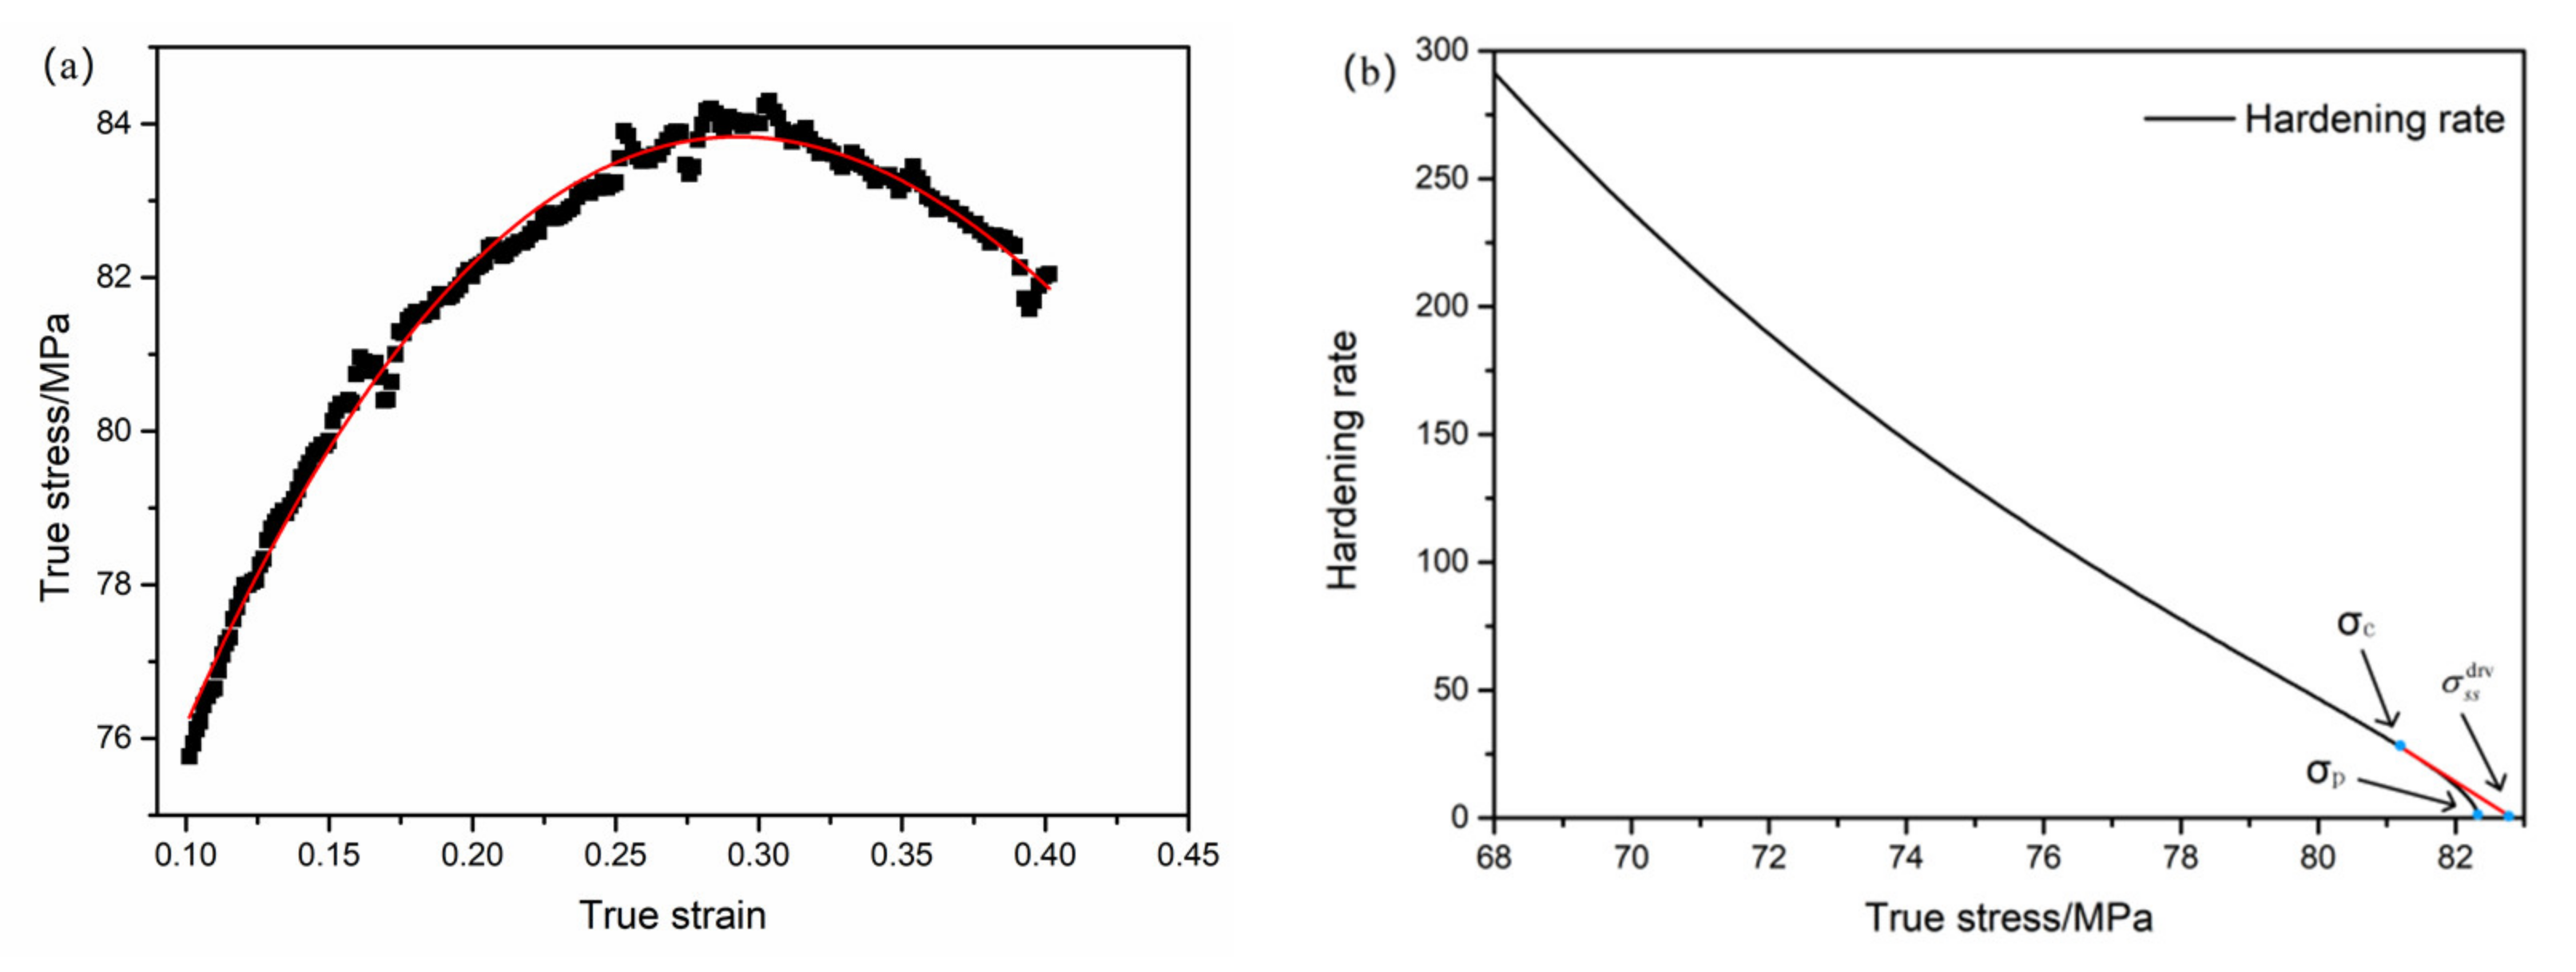
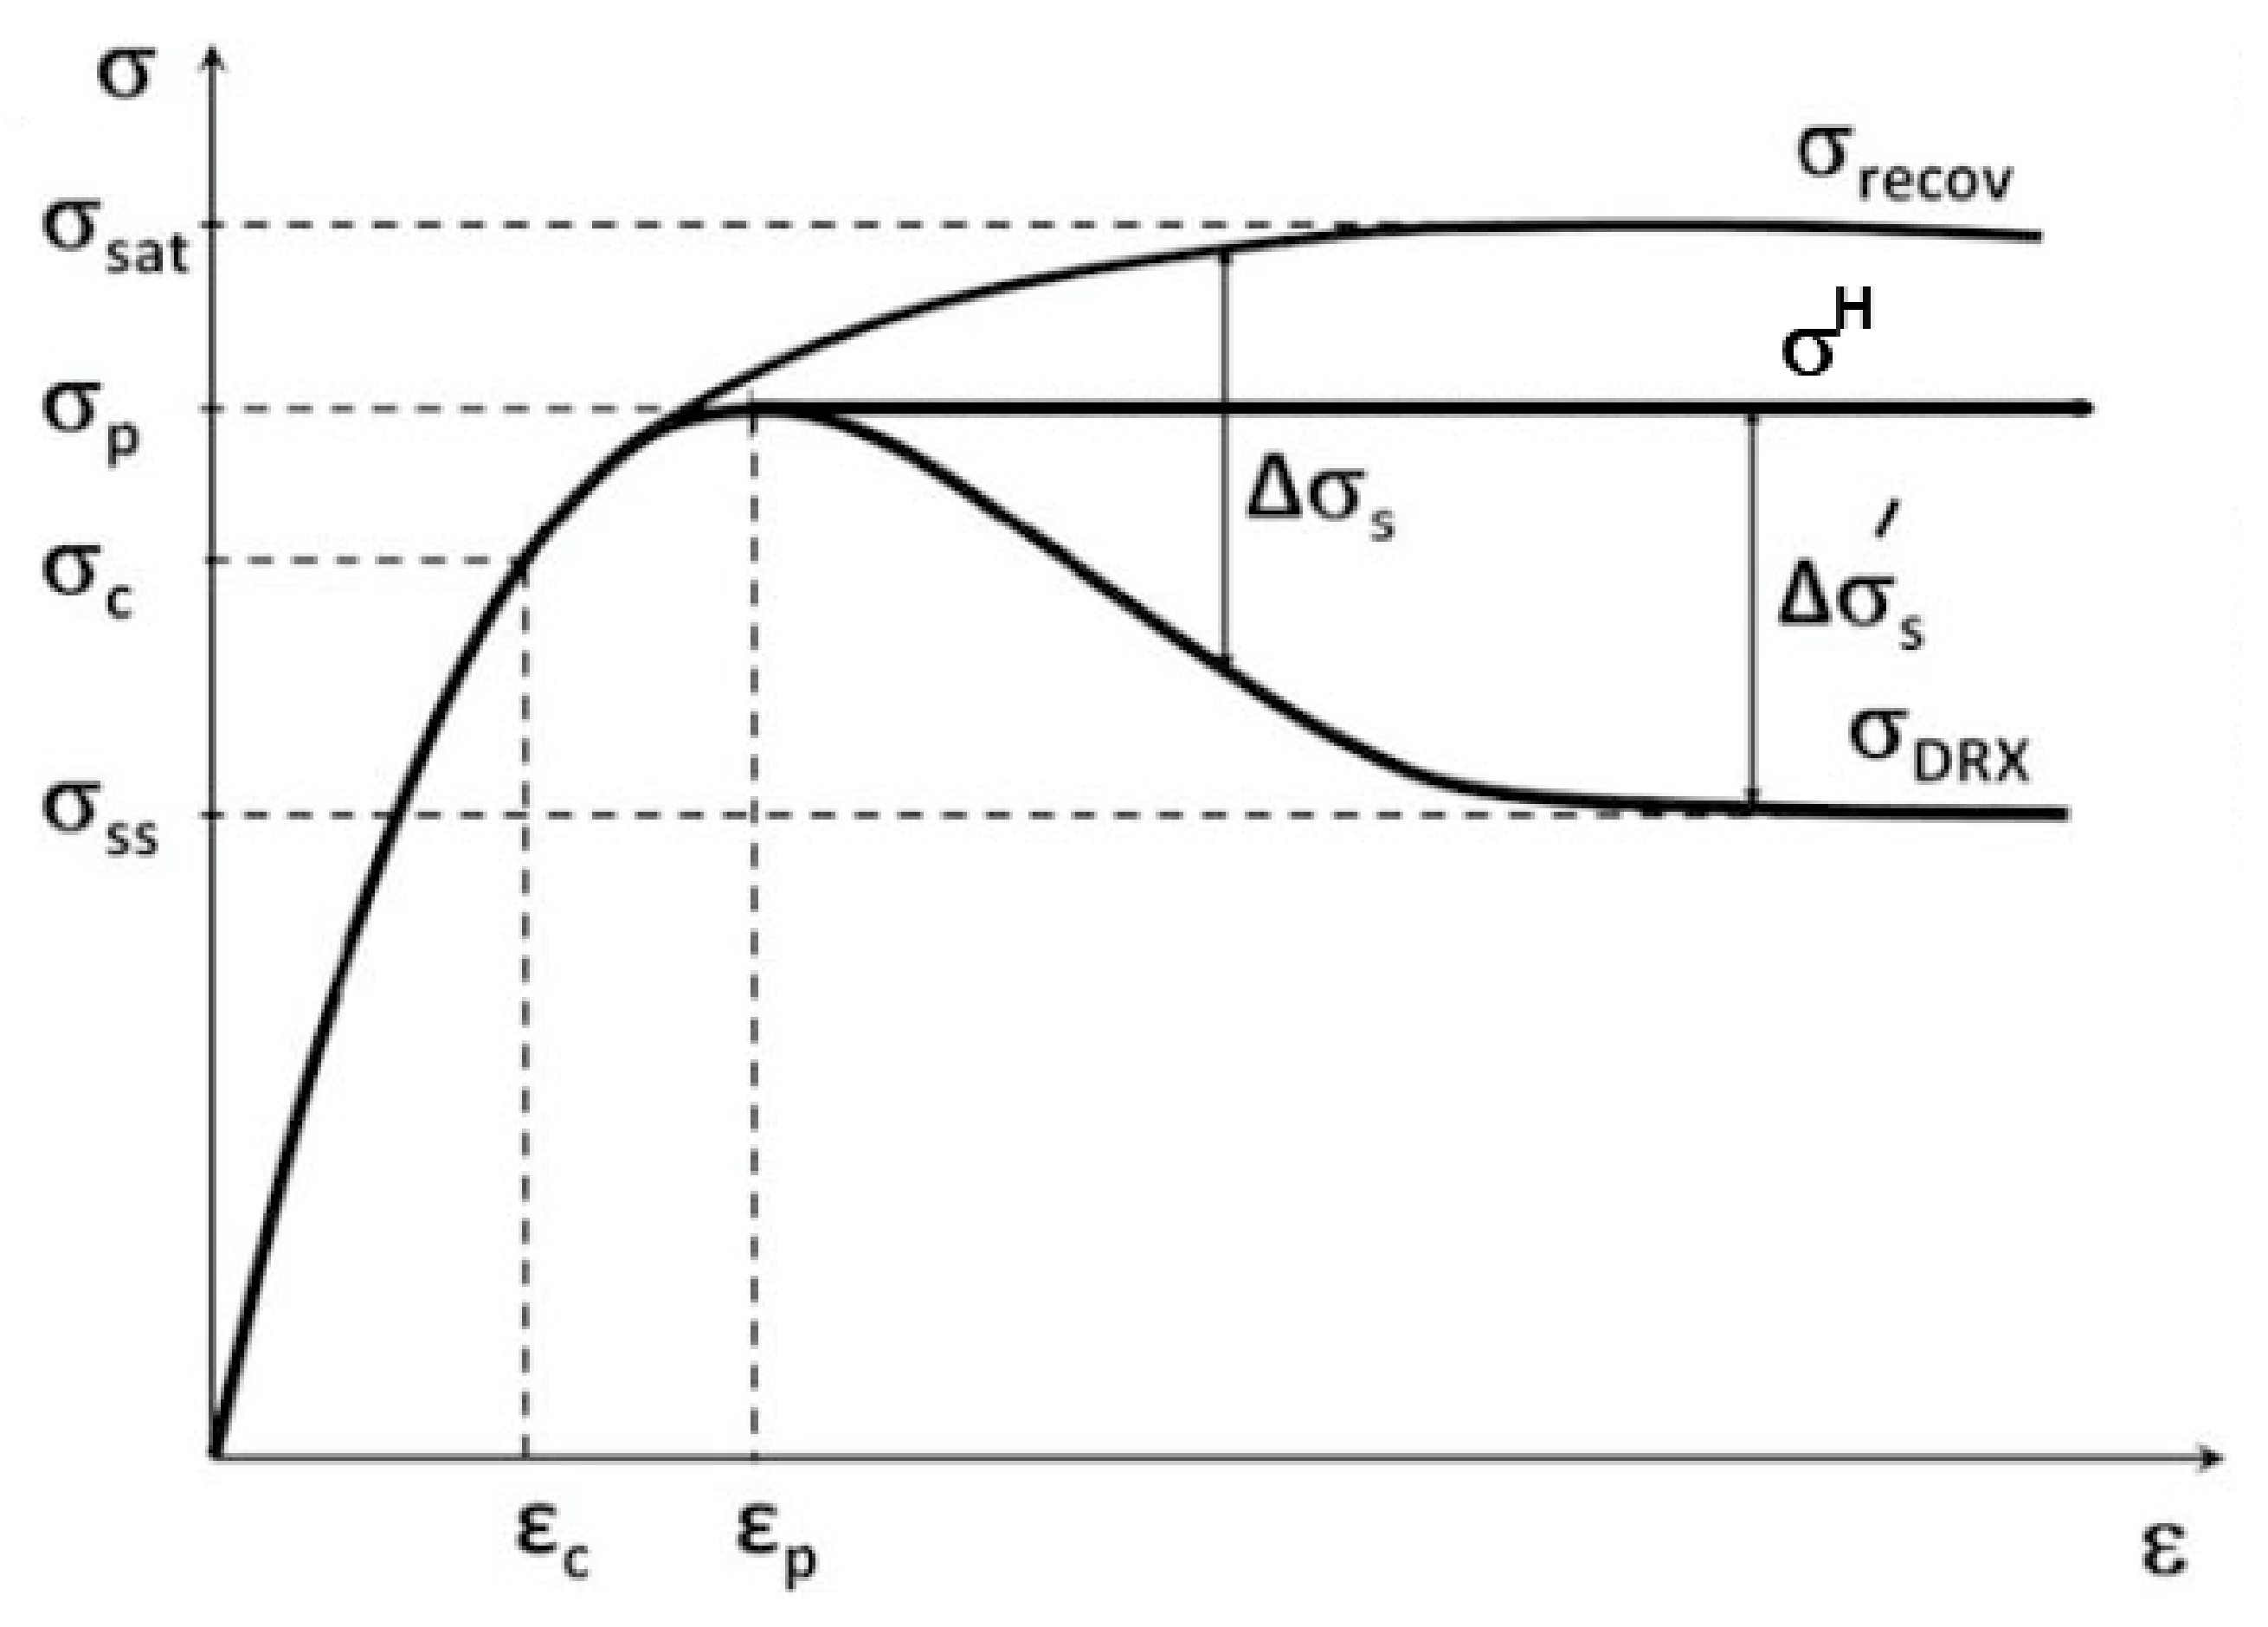
3.3. Constitutive Equation of Hardening Part Considering Dynamic Recrystallization

Dynamic recrystallization is a major process in the high temperature thermal deformation process of the steel. The saturated stress is the corresponding stress when the curve extends to the work hardening rate of 0 depicted by the dotted line, as shown in Figure 8.
The strain hardening rate of work-hardening stage can be obtained by the following Equation (13):
θ = σ ε ε ˙ , T
where, θ is the strain hardening rate; ε is the strain. It can be seen from Figure 9a that the rheological curve obtained by the experiment is not smooth. It is difficult to achieve the strain hardening rate directly with Equation (13). Therefore, the curve should be smoothed.
As shown in Figure 9a, the peak portion of the rheological curve at 1100 °C-0.1 s−1 could be smoothed by the red curve. The strain–hardening rate curve corresponding to each rheological curve and can be obtained by Equation (13). Figure 9b shows a graph of the hardening rate decreasing sharply to zero with strain, from which the curve is concave. The difference between the saturated stress with the peak stress is only 0.5 Mpa.
The relationship between strain and dislocation density, which is affected by work hardening and dynamic recovery, can be expressed by Equation (14) [21].
d ρ d ε = Ω ρ
d ρ d ε   is the rate of rise of dislocation density with strain; is the strain dependent constant; ρ is the dislocation density; and Ω is often referred to as the dynamic recovery coefficient. Equation (15) can be determined from Equation (14) [22].
ρ = ρ 0 e x p Ω ε + U Ω 1 e x p Ω ε
ρ0 is the initial dislocation density at which the strain is zero.
According to the study, the relationship between flow stress and dislocation density when the steel undergoes plastic deformation at high temperature can be shown through Equation (16) [23].
σ = α μ b ρ
α is the material constant; μ is the shear modulus; b is the burgers vector.
As such, when the flow stress reaches a steady state, the dislocation density can be expressed as   ρ drv = U Ω   ,   and   by combining Equations (15) and (16), we can determine Equation (17) for strain hardening by considering dynamic recovery during hot deformation.
σ = σ s s d r v 2 + σ 0 2 σ s s d r v 2 e x p Ω ε 0.5
According to the previous analysis, the saturation stress is close to peak stress. In order to simplify the calculation, the peak stress is replaced by the saturated stress. The extrapolated flow–stress curve in the rheologic behavior diagram of high strength steel as shown in Figure 10 will evolve into a σ H line. In general, the critical strain of dynamic recrystallization is about 0.8 εp [24], but the critical strain will be equal to the peak strain when the extrapolated flow–stress curve evolves into   a   σ H line.
It is difficult to identify the elastic stage of the hot deformation process that the steel undergoes during the large work hardening rate (only a small amount of stress is required to produce plastic deformation). Therefore, the initial stress (yield stress) of σ 0 is negligible. The Ω of different deformation conditions can be obtained by substituting the experimental data into Equation (17), which is simplified. By linear fitting, the value of Ω can be expressed in Equation (18).
Ω = 6.12 × 10 3 z 0.15
The average dynamic recovery coefficient Ω is 15.6. As shown in Figure 11, the dynamic recovery coefficient Ω decreases with increasing Z. This means that the dynamic recovery will play a leading role under a high-deformation temperature and low-strain rate conditions.

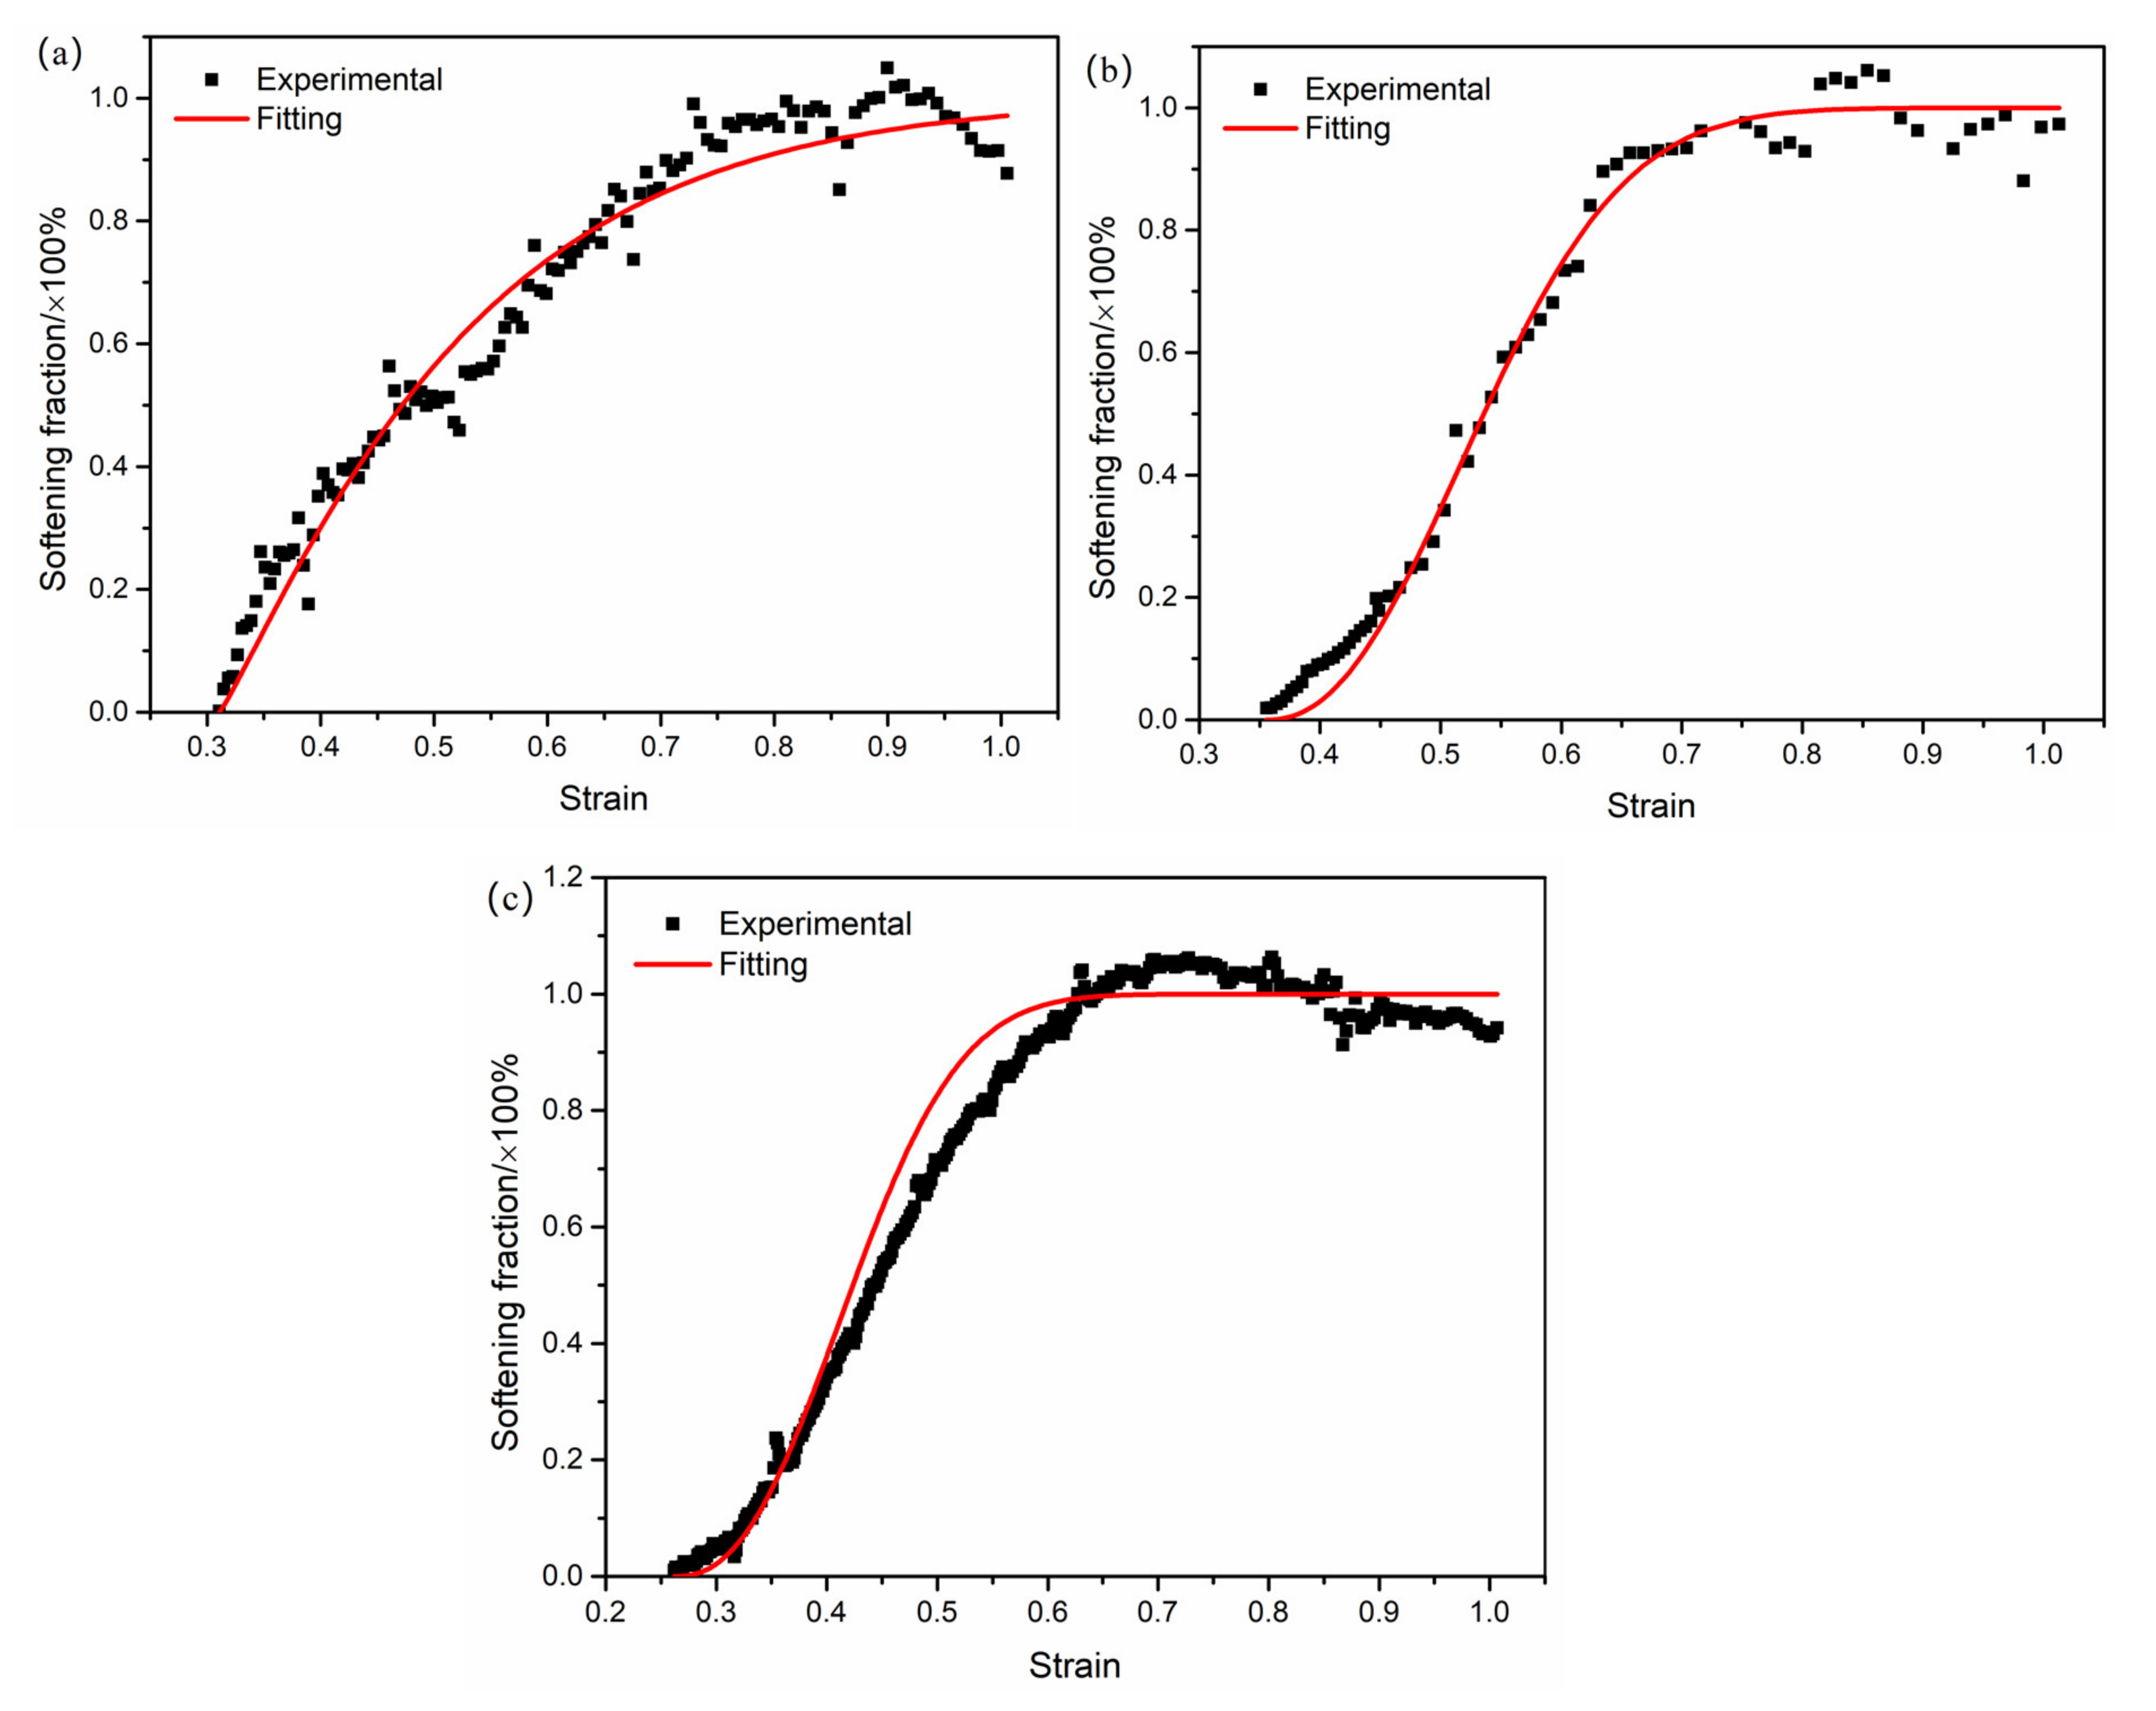
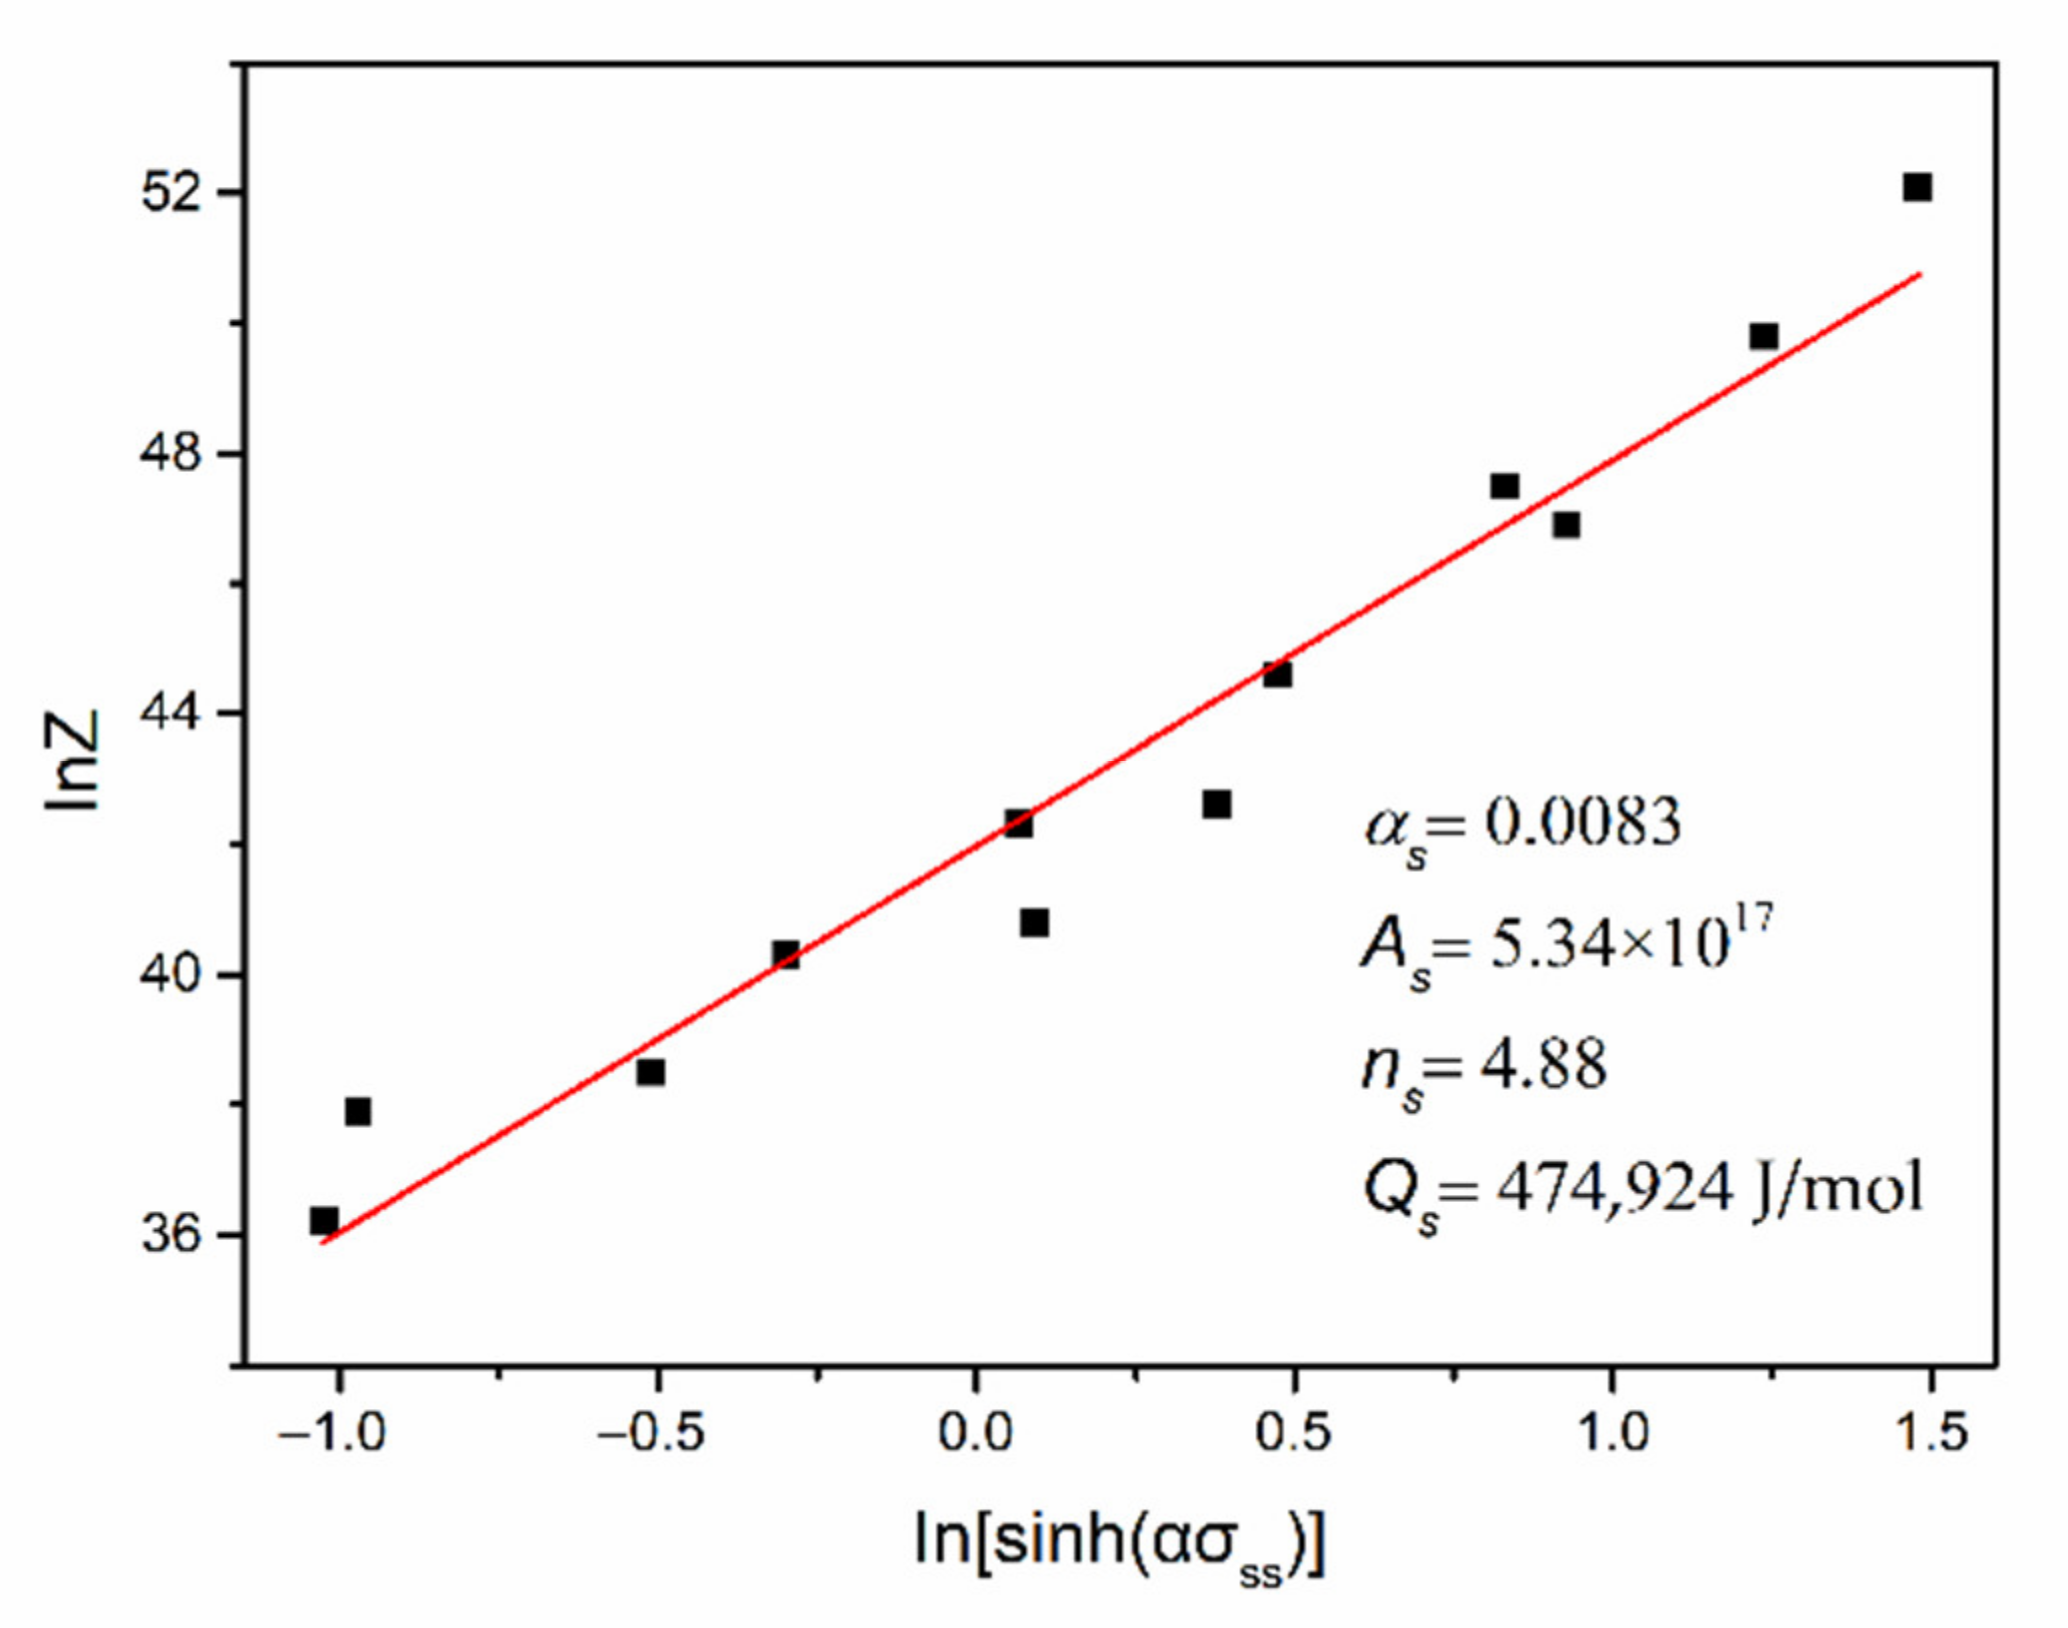
3.4. Constitutive Equation of Softening Part Considering Dynamic Recrystallization

When the critical strain is reached, dynamic recrystallization will occur, which will lead flow stress to decrease. The extrapolated saturation stress is equal to the peak stress along the elaxtrapolated flow–stress curve in Figure 10. The curves for dynamic recrystallization can be estimated by Equation (19) [25,26]:
x s = σ H σ σ p σ s s
σss is steady state flow stress (MPa); Xs is an apparent softening fraction.
As shown in Figure 12, The typical softening fraction curve is an S-curve model. Compared to Figure 12a,b, the incubation period for dynamic recrystallization is significantly increased with strain; on the contrary, the incubation period for dynamic recrystallization significantly decreases when the temperature increases from from 1000 °C to 1150 °C, as shown in Figure 12a,c.
In addition, the dynamic recrystallization fraction can be expressed by the JMAK equation [27]:
x s = 1 e x p k ε ε P ε P n
k is the material constant, n is the Avrami index.
Figure 13 shows the relationship between the peak strain ε P and the parameter Z. The equation of peak strain   ε P with parameter Z can also be obtained by linear fitting:
ε P = 0.1395 z 0.0164
The softening fraction curves can be obtained using Equation (20), and the value of k and n can then be obtained with Equation (21), as shown in Table 2. According to the previous analysis, when the steel is compressed at 800 °C, the flow stress has not yet reached the steady state, so there is no corresponding k value or n value.
There is no regularity of the values of k and n, so, we will assume the average value of k to be 1.53 and that of n to be 1.65.
σ = σ H σ P σ s s 1 e x p k ε ε P ε P n
In Equation (19), the unknown is steady state stress σss, which can be obtained through a hyperbolic sine equation. A part of the data is used to fit the hyperbolic sine equation because of the low-temperature stress–strain curve and the high-strain rate are in the unsteady state. The stress parameter αs is 0.0083, and the deformation activation energy Qs is 474,924 J/mol and can be obtained through the previous method. As shown in Figure 14, the relationship diagram of InZ-ln[sinh(ασss)] is established. Through linear fitting, the structure factor of steady-state stress As is 5.34 × 10¹⁷, and the stress index ns is 4.88.
Therefore, the steady-state stress is as follows:
σ s s = 1 0.0083 I n Z 5.34 × 10 17 1 4.88 + z 5.34 × 10 17 2 4.88 + 1 0 5
The prediction value was well matched with the experimental values, as shown in Figure 15. In order to further verify the accuracy of the established constitutive model, 630 data points were selected for correlation analysis and for average relative error between the predicted values and experimental values of the constitutive model, as shown in Figure 16.

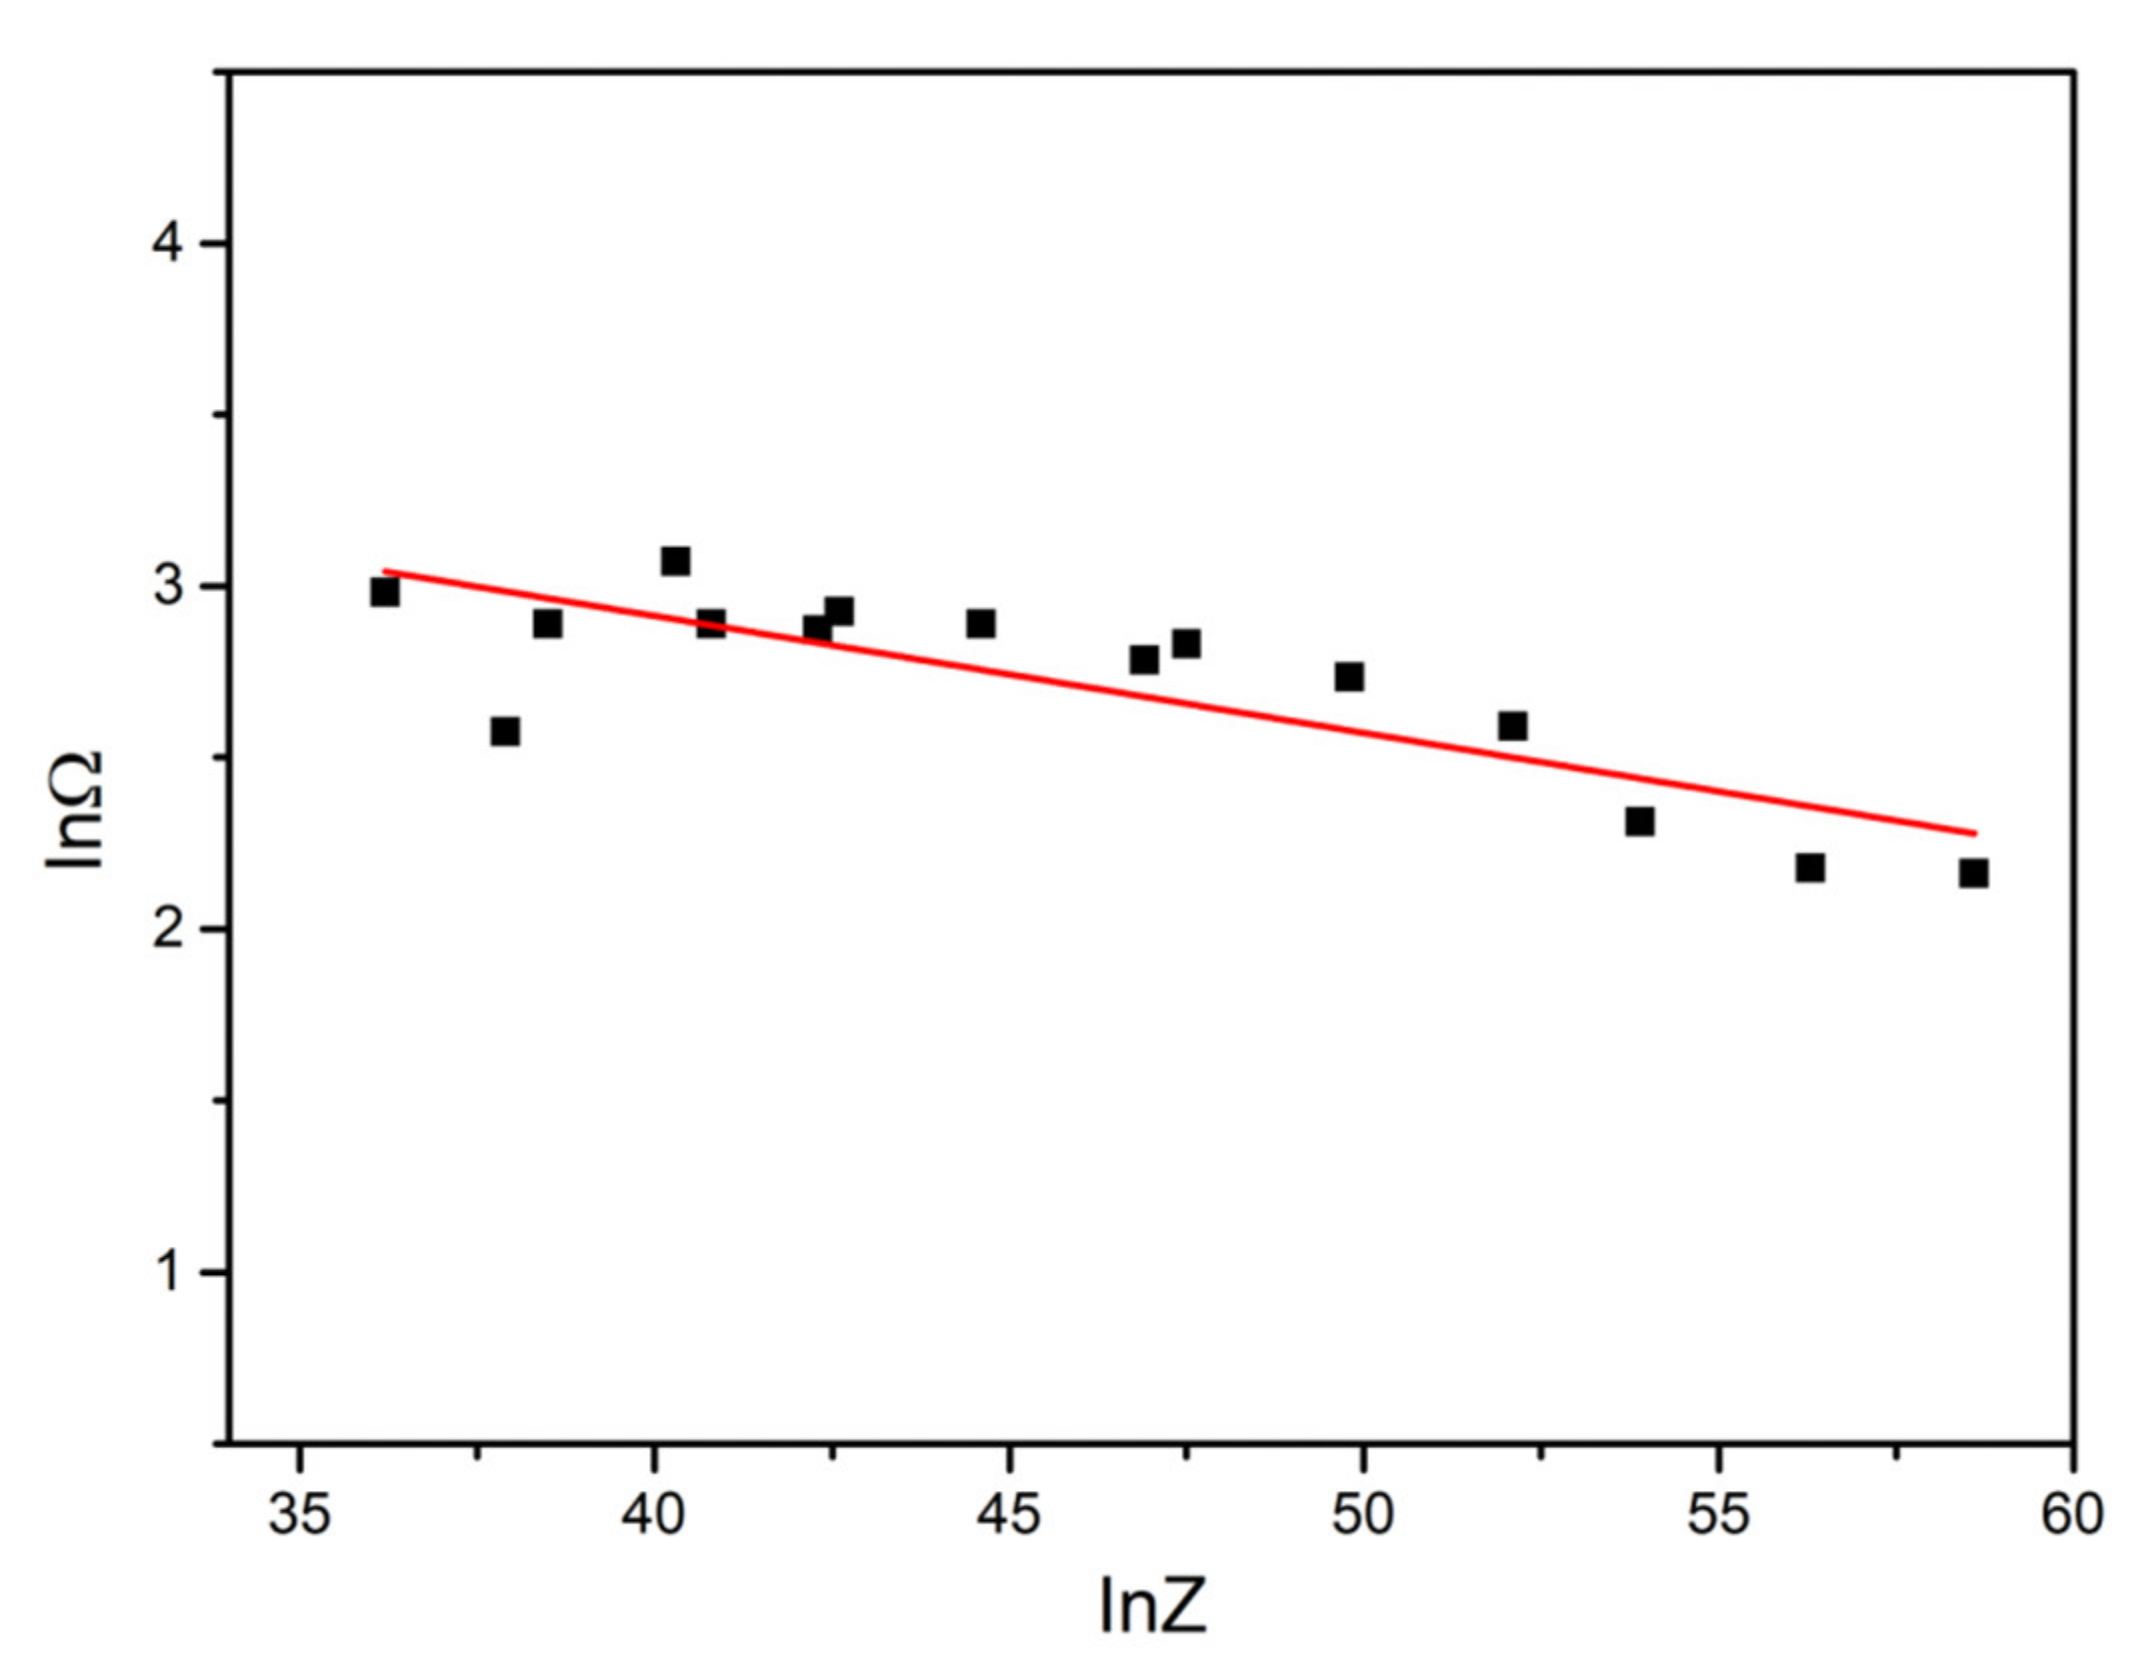
3.5. Grain Size Model of Dynamic Recrystallization

It is necessary to establish a recrystallization grain size model to simulate the microstructure evolution [28]:
D drex = a d 0 ε ˙ m e x p Q R T
D drex is the grain size of dynamic recrystallization; d 0 is the original grain size; Q’ is the grain growth activation energy; and a’ and m are constants.
The effect of the initial grain size is not considered in the model because the size of the initial grain can be simply obtained using a metallography diagram, which shows the microstructure that is retained through quenching after heating to a presupposed temperature. It is difficult to distinguish recrystallized and non-recrystallized grains from the metallography diagrams of samples without fully dynamic recrystallization, which leads to an inaccurate recrystallized grain size. As such, metallography diagrams of temperatures above 1000 °C are selected. As shown in Figure 17, I n ε ˙ and 1/T represent the abscissa, and lnDdrex represents the ordinate.
The unknown coefficient of Equation (24) can be obtained based on linear fitting. The average of the values a’, Q’, and m under different conditions are obtained through regression analysis. a’ is 1.159 × 10 3 , Q’ is −54,118.129, and m is −0.124. The recrystallized grain sizes at different conditions can be obtained using Equation (25).
D d r e x = 1.159 × 10 3 ε ˙ 0.124 e x p 54118.129 R T
Comparing the grain sizes obtained in the recrystallization grain size model with the experimental data, it can be seen that the simulation is reliable, as shown in Figure 18.

3.6. Simulation and Experimental Results

The results of the simulation using DEFORMv10.2, in which the constitutive model and recrystallization grain size model have been imported are shown below. In the simulation, the initial grain size was 134.5 μm, and the deformation was 0.65. Considering the axial symmetry of the sample, the 1/4 model was used to reduce unnecessary time.
In Figure 19, the average volume fraction of dynamic recrystallization increases with the temperature because the recrystallization process of metals can be regarded as a thermal activation process related to atomic diffusion. With the increase of deformation temperature, the migration ability of grain boundaries improves, and the time required for recrystallization is shortened; thus, the nucleation rate and grain recrystallization grain growth rate increase. In the region where the value of the standard deviation (S.D.) of the homogenization of the microstructure of the sample increases, but the center is not affected by the external temperature, so the non-uniformity of the dynamic recrystallization volume fraction decreases. The higher the temperature, the larger the volume of complete recrystallization in the center. Compared to the metallographic diagram, which is shown in Figure 20, most of the compressive protomorphic grains at 900 °C have disappeared, which means that there is obvious dynamic recrystallization. The dynamic recrystallization grains gradually replace the fibriform grains with the driving force of recrystallization, which is enhanced by temperature. There is no obvious deformation in the direction of compression in Figure 20b when the deformation temperature reaches 1000 °C, and the average grain size is significantly smaller. After that, the dynamic recrystallization grains will grow slowly with the temperature, as shown in Figure 20c. The grains gradually develop from fine equiaxed grains to non-uniform grains. The trend of small grains absorbed by the large grains emerges when the deformation temperature reaches 1150 °C (Figure 20d).
The above phenomenon shows that the deformation temperature has a significant effect on the process of the steel in hot deformation. When the deformation temperature decreases, the diffusion ability of the atoms is worse, which not only reduces the nucleation rate of dynamic recrystallization but also slows down the growth rate of the recrystallized grains. There are still fibrous grains after deformation at lower temperatures. However, that does not mean that the higher temperature is better. It raises the overall inhomogeneity because the grains will grow quickly due to the increase of temperature, which makes it easier for dislocations to occur. It can be seen from the simulation results and the metallographic diagram for 1100 °C in Figure 21 that the growth of recrystallization grains is suppressed. When the strain rate increases appropriately, on the one hand, some dislocations do not have enough time to counteract and merge. On the other hand, new dislocations are formed in the recrystallized grains under the action of compressive force. All of these will cause a dynamic recrystallization nucleation rate that is more than the growth rate of the recrystallized grains, resulting in the appearance of grains that are uniform and fine. As such the S.D. value the of sample decreases.
The simulation results and the metallographic diagram of 900 °C in Figure 22 show that the dynamic recrystallization grains obviously decrease with the strain rate. More nuclei and storage deformation energy will be produced with the dislocation defects when the strain rate exceeds a certain range. There is not only the phenomenon of incomplete dynamic recrystallization, but also the fibrous and coarse microstructure. The diminution of S.D. is smaller at 900 °C. Therefore, at a certain strain rate, a suitable deformation temperature is needed to obtain a uniform and small microstructure.

4. Conclusions

  • Amend the flow-stress curve through the friction correction formula to reflect the actual deformation process accurately.
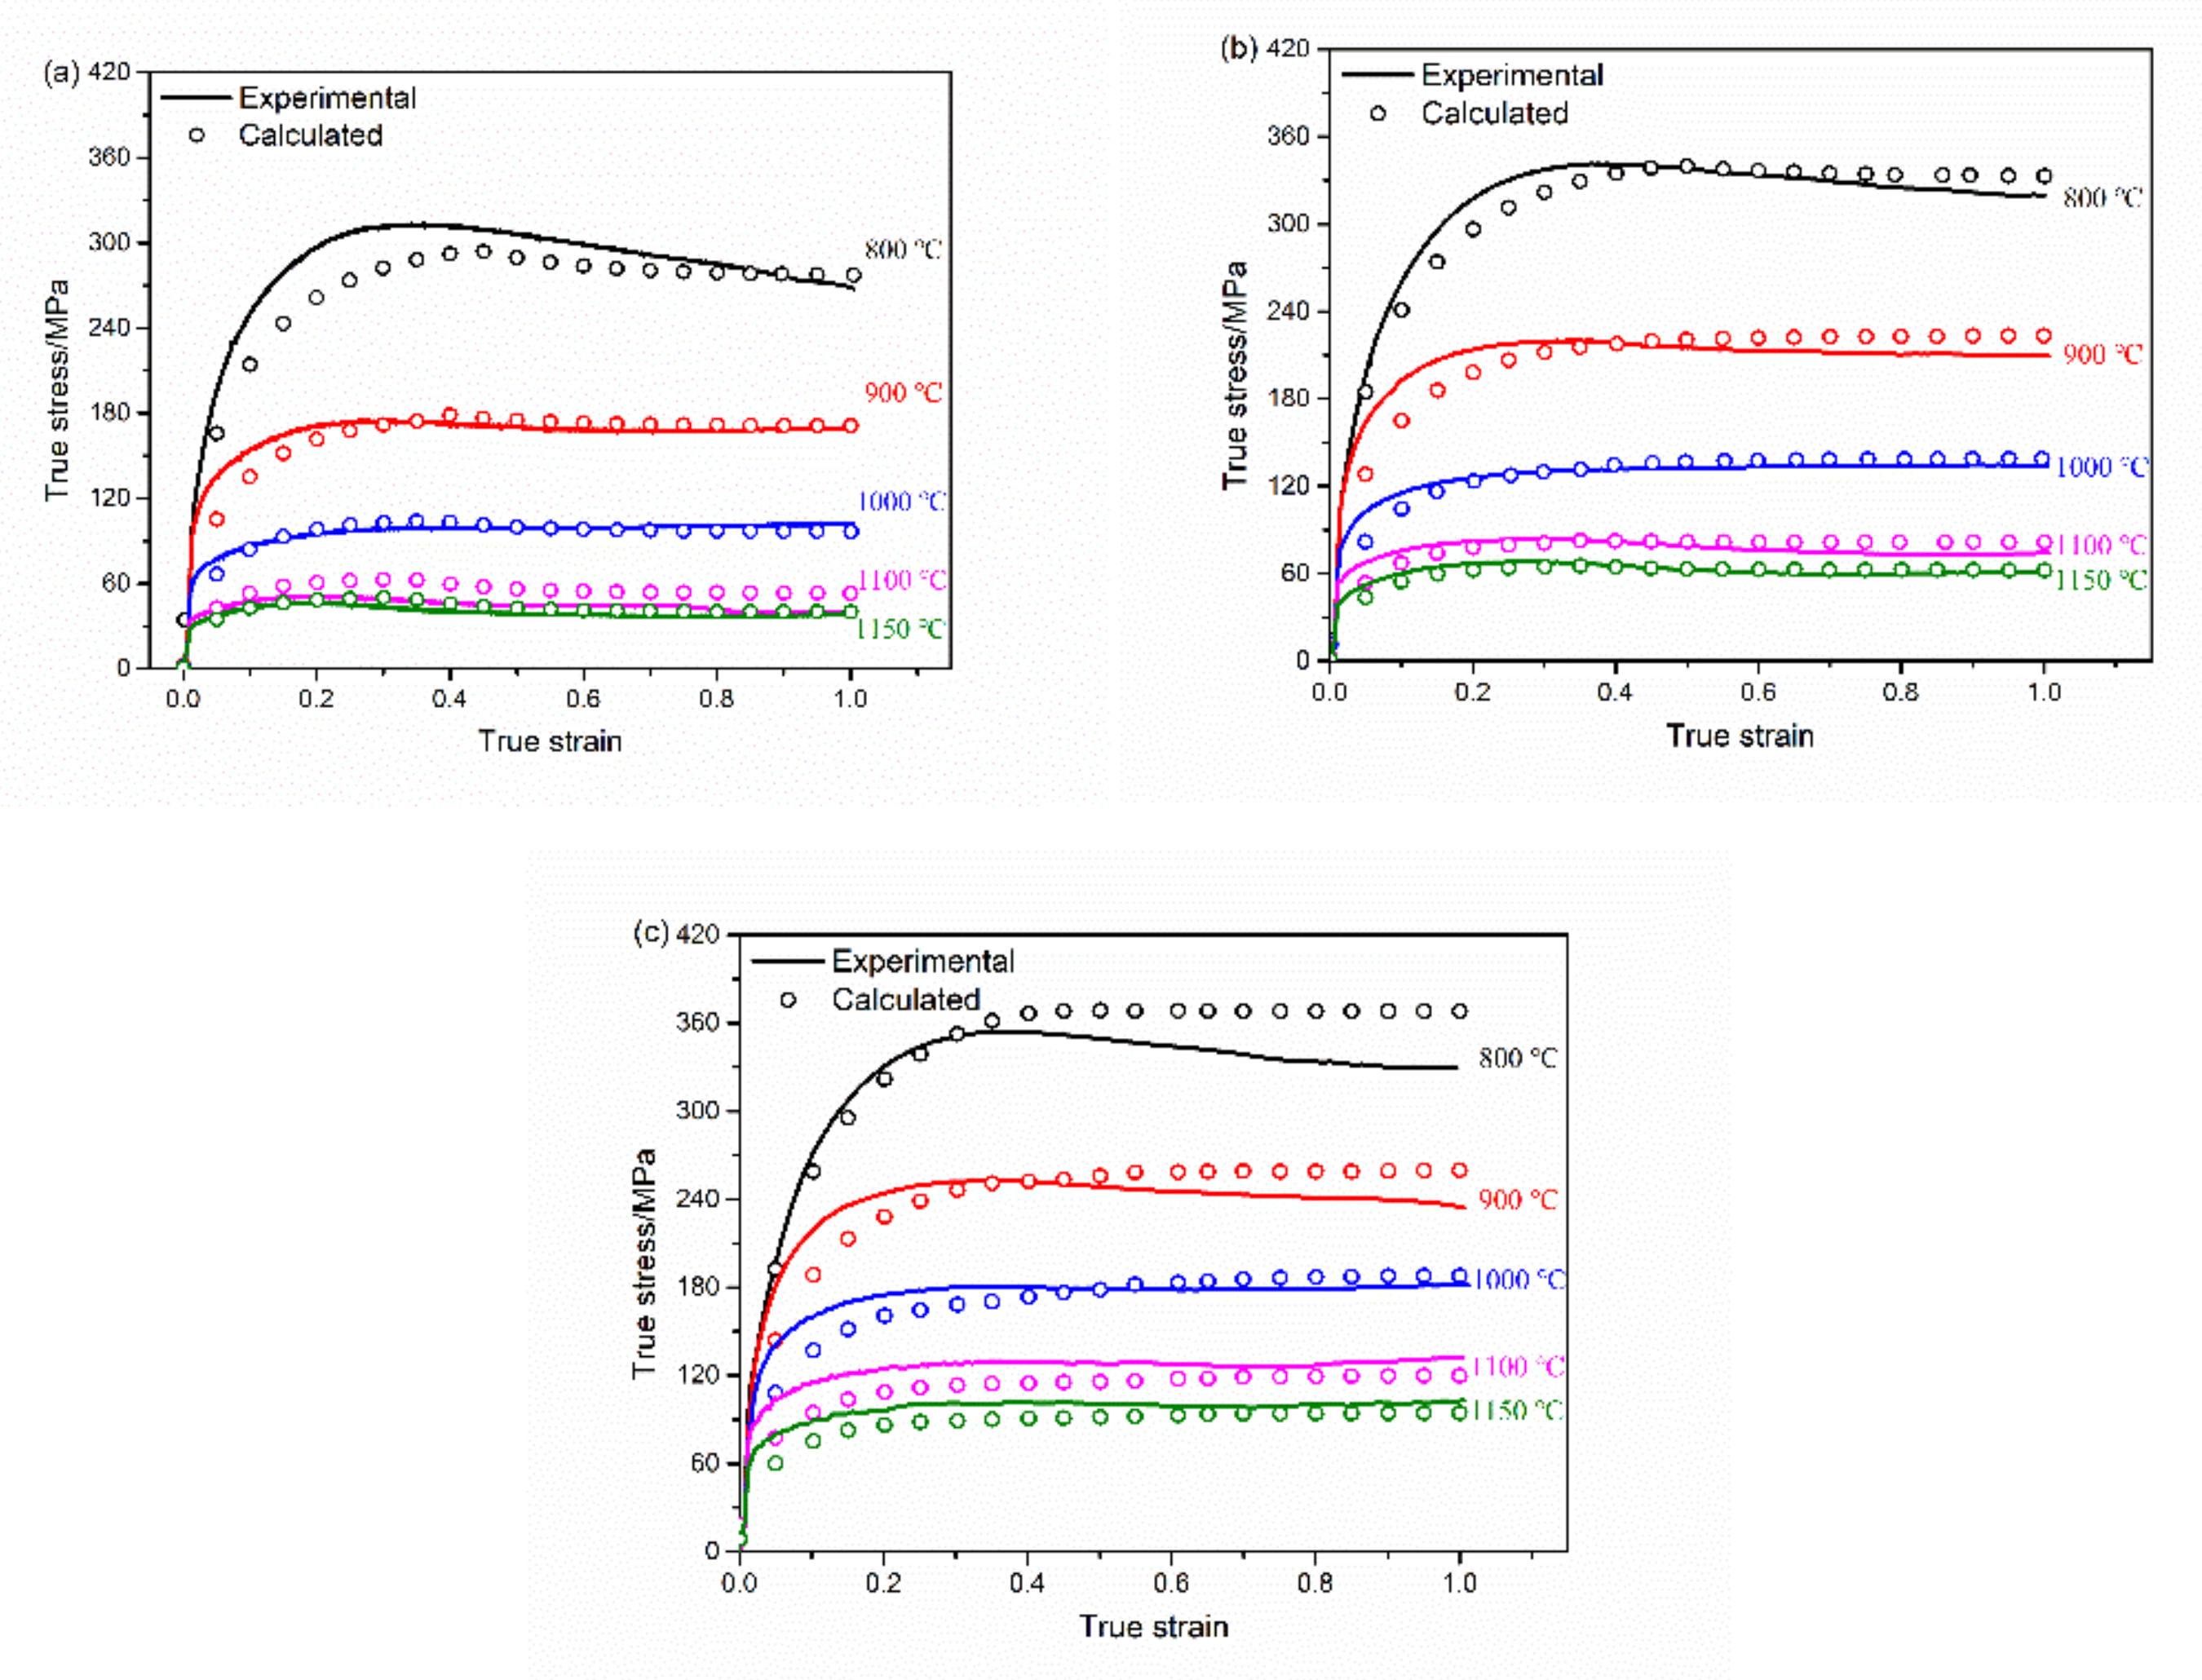
  • According to the constitutive equation below, the average relative error of the predicted flow stress and the experiment is 7.46%, which can be used for the finite element analysis of thermal deformation process.
    σ H = σ p 1 exp Ω ε   ε < ε p
    σ = σ H x s σ p σ s s   ε ε p
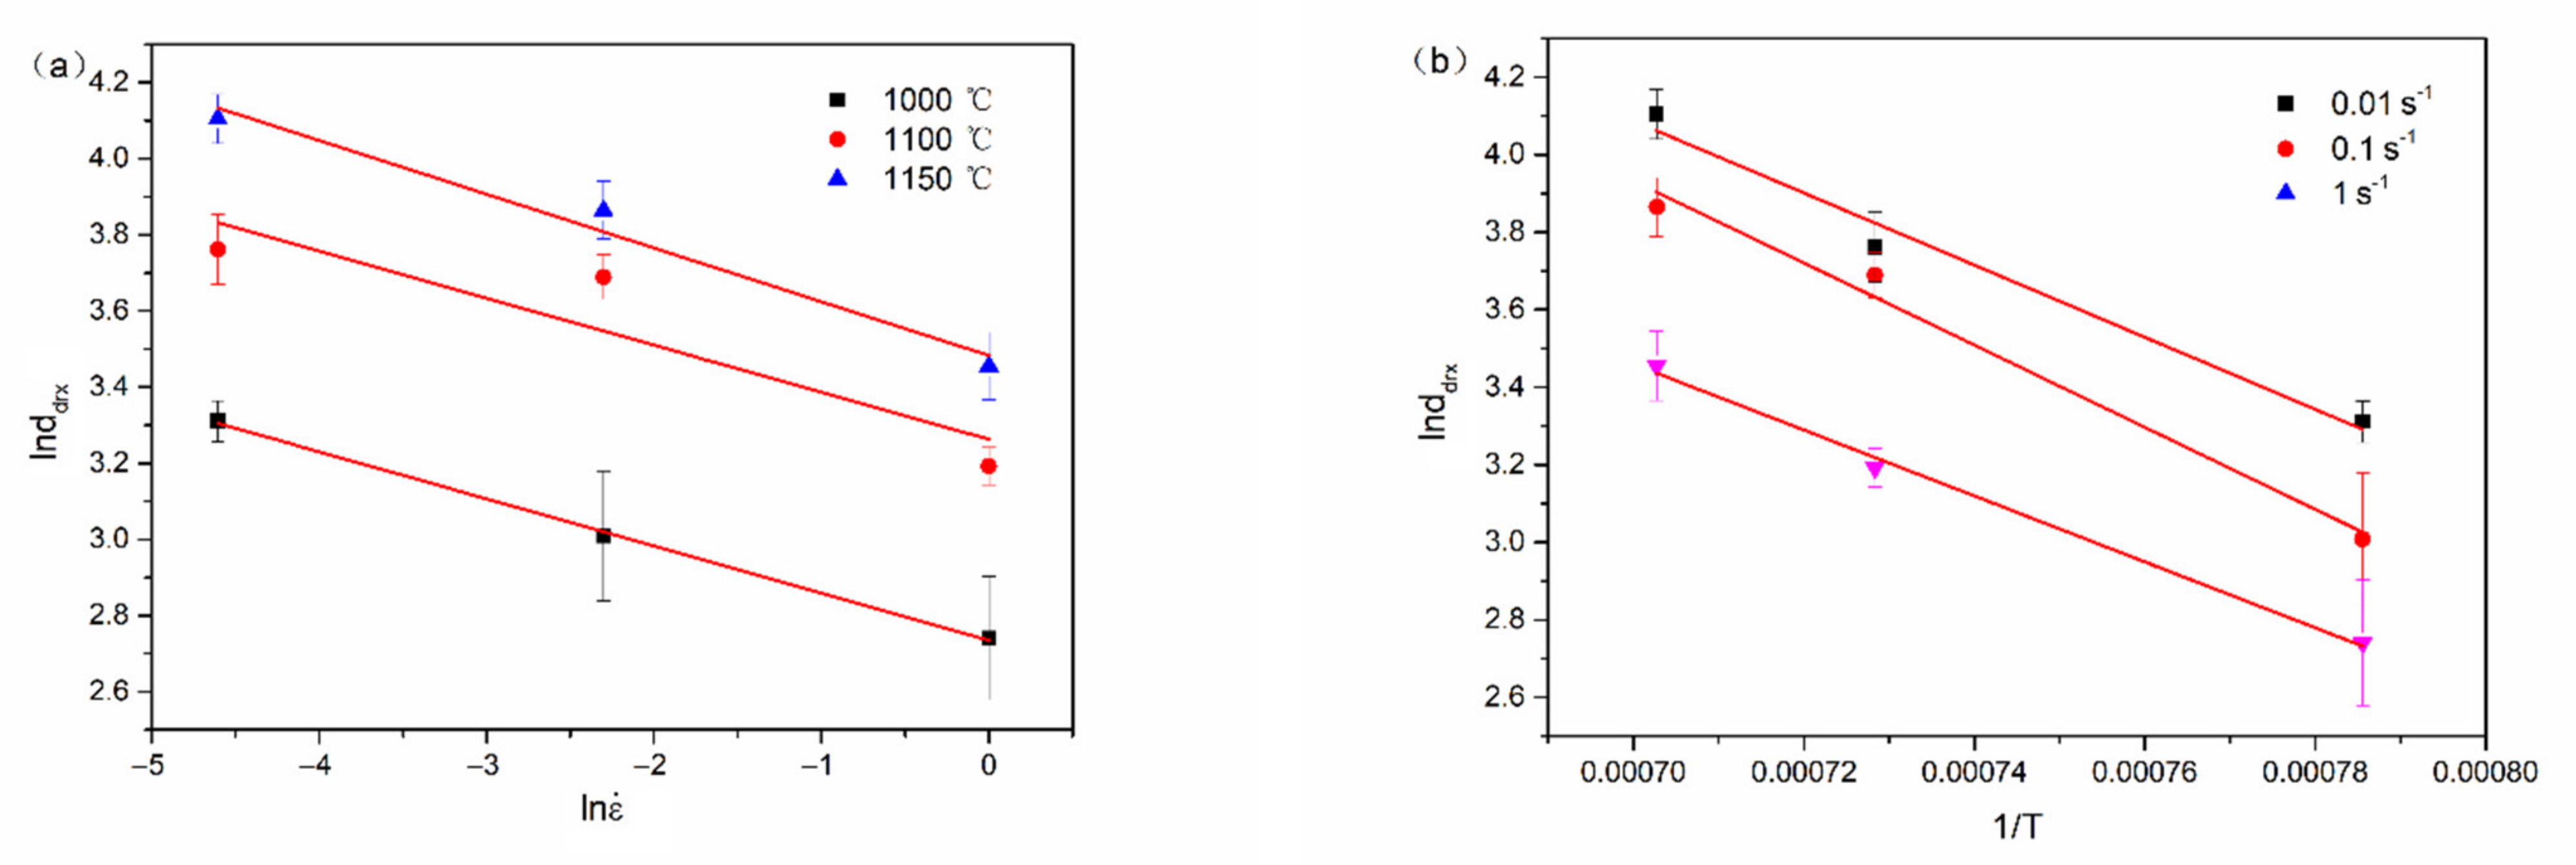
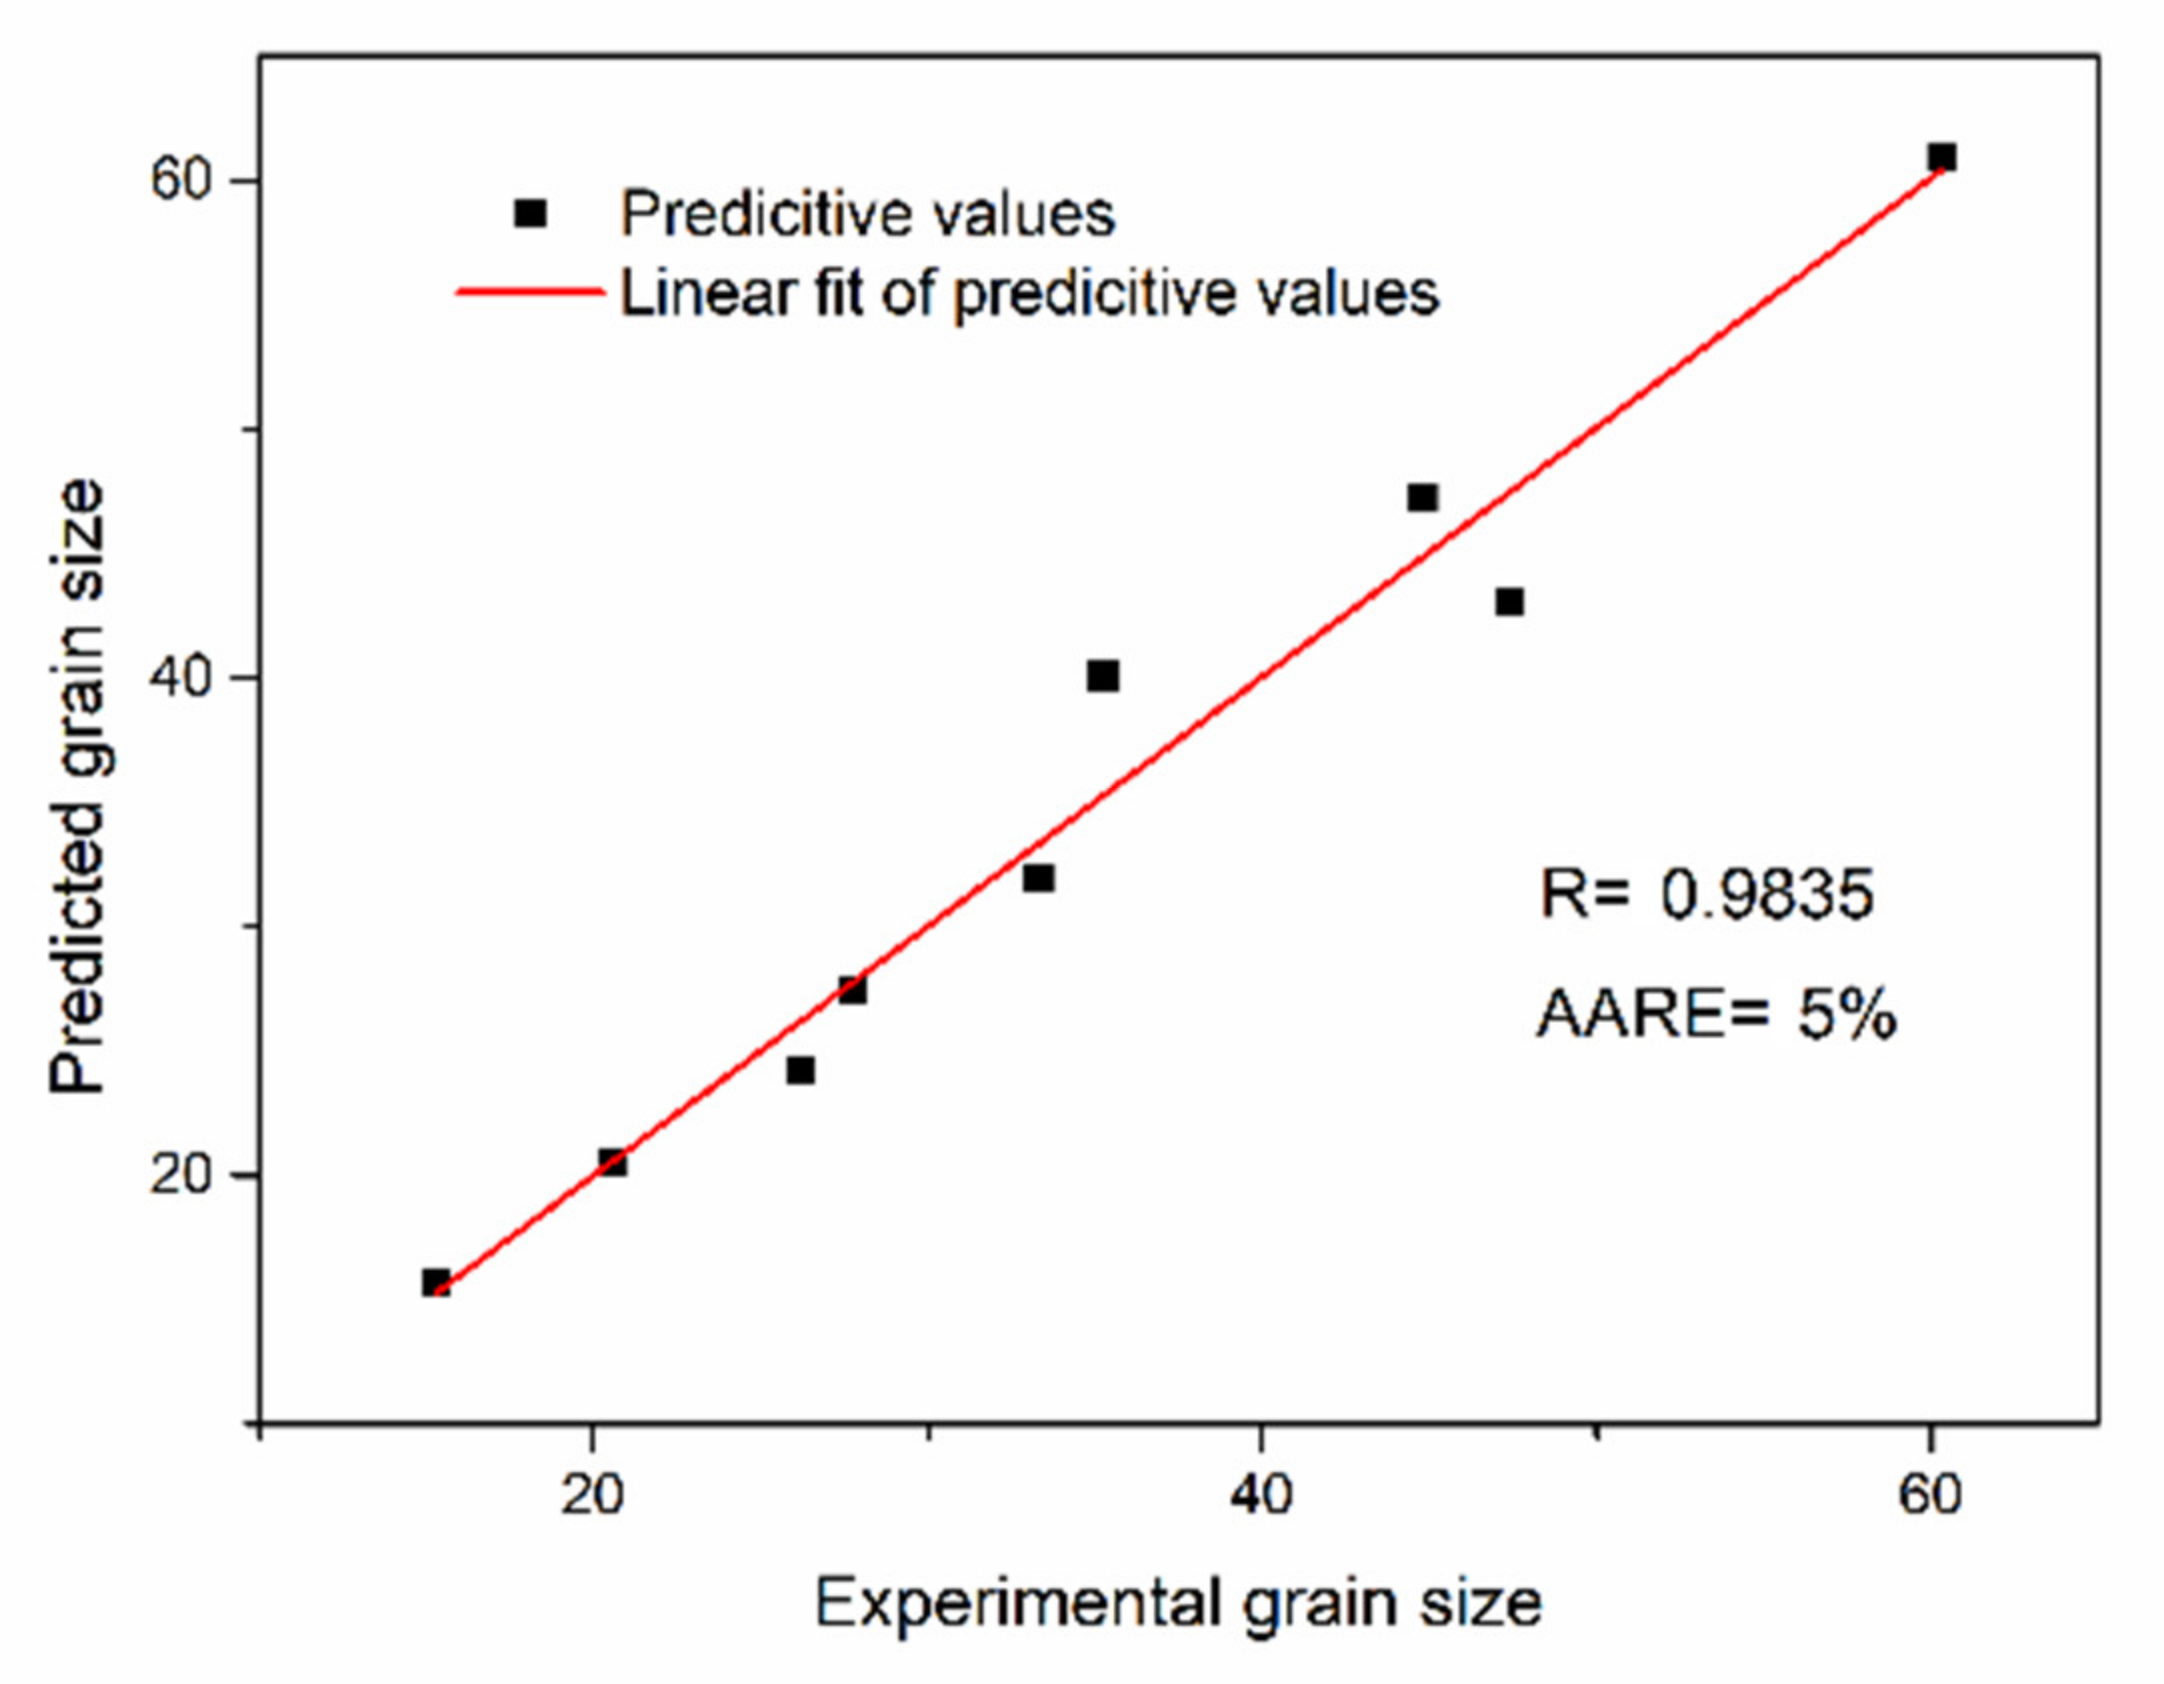
  • The following dynamic recrystallization grain size model can predict the change of recrystallization grain size during hot deformation well.
    D d r e x = 1.159 * 10 3 ε ˙ 0.124 e x p 54118.129 R T
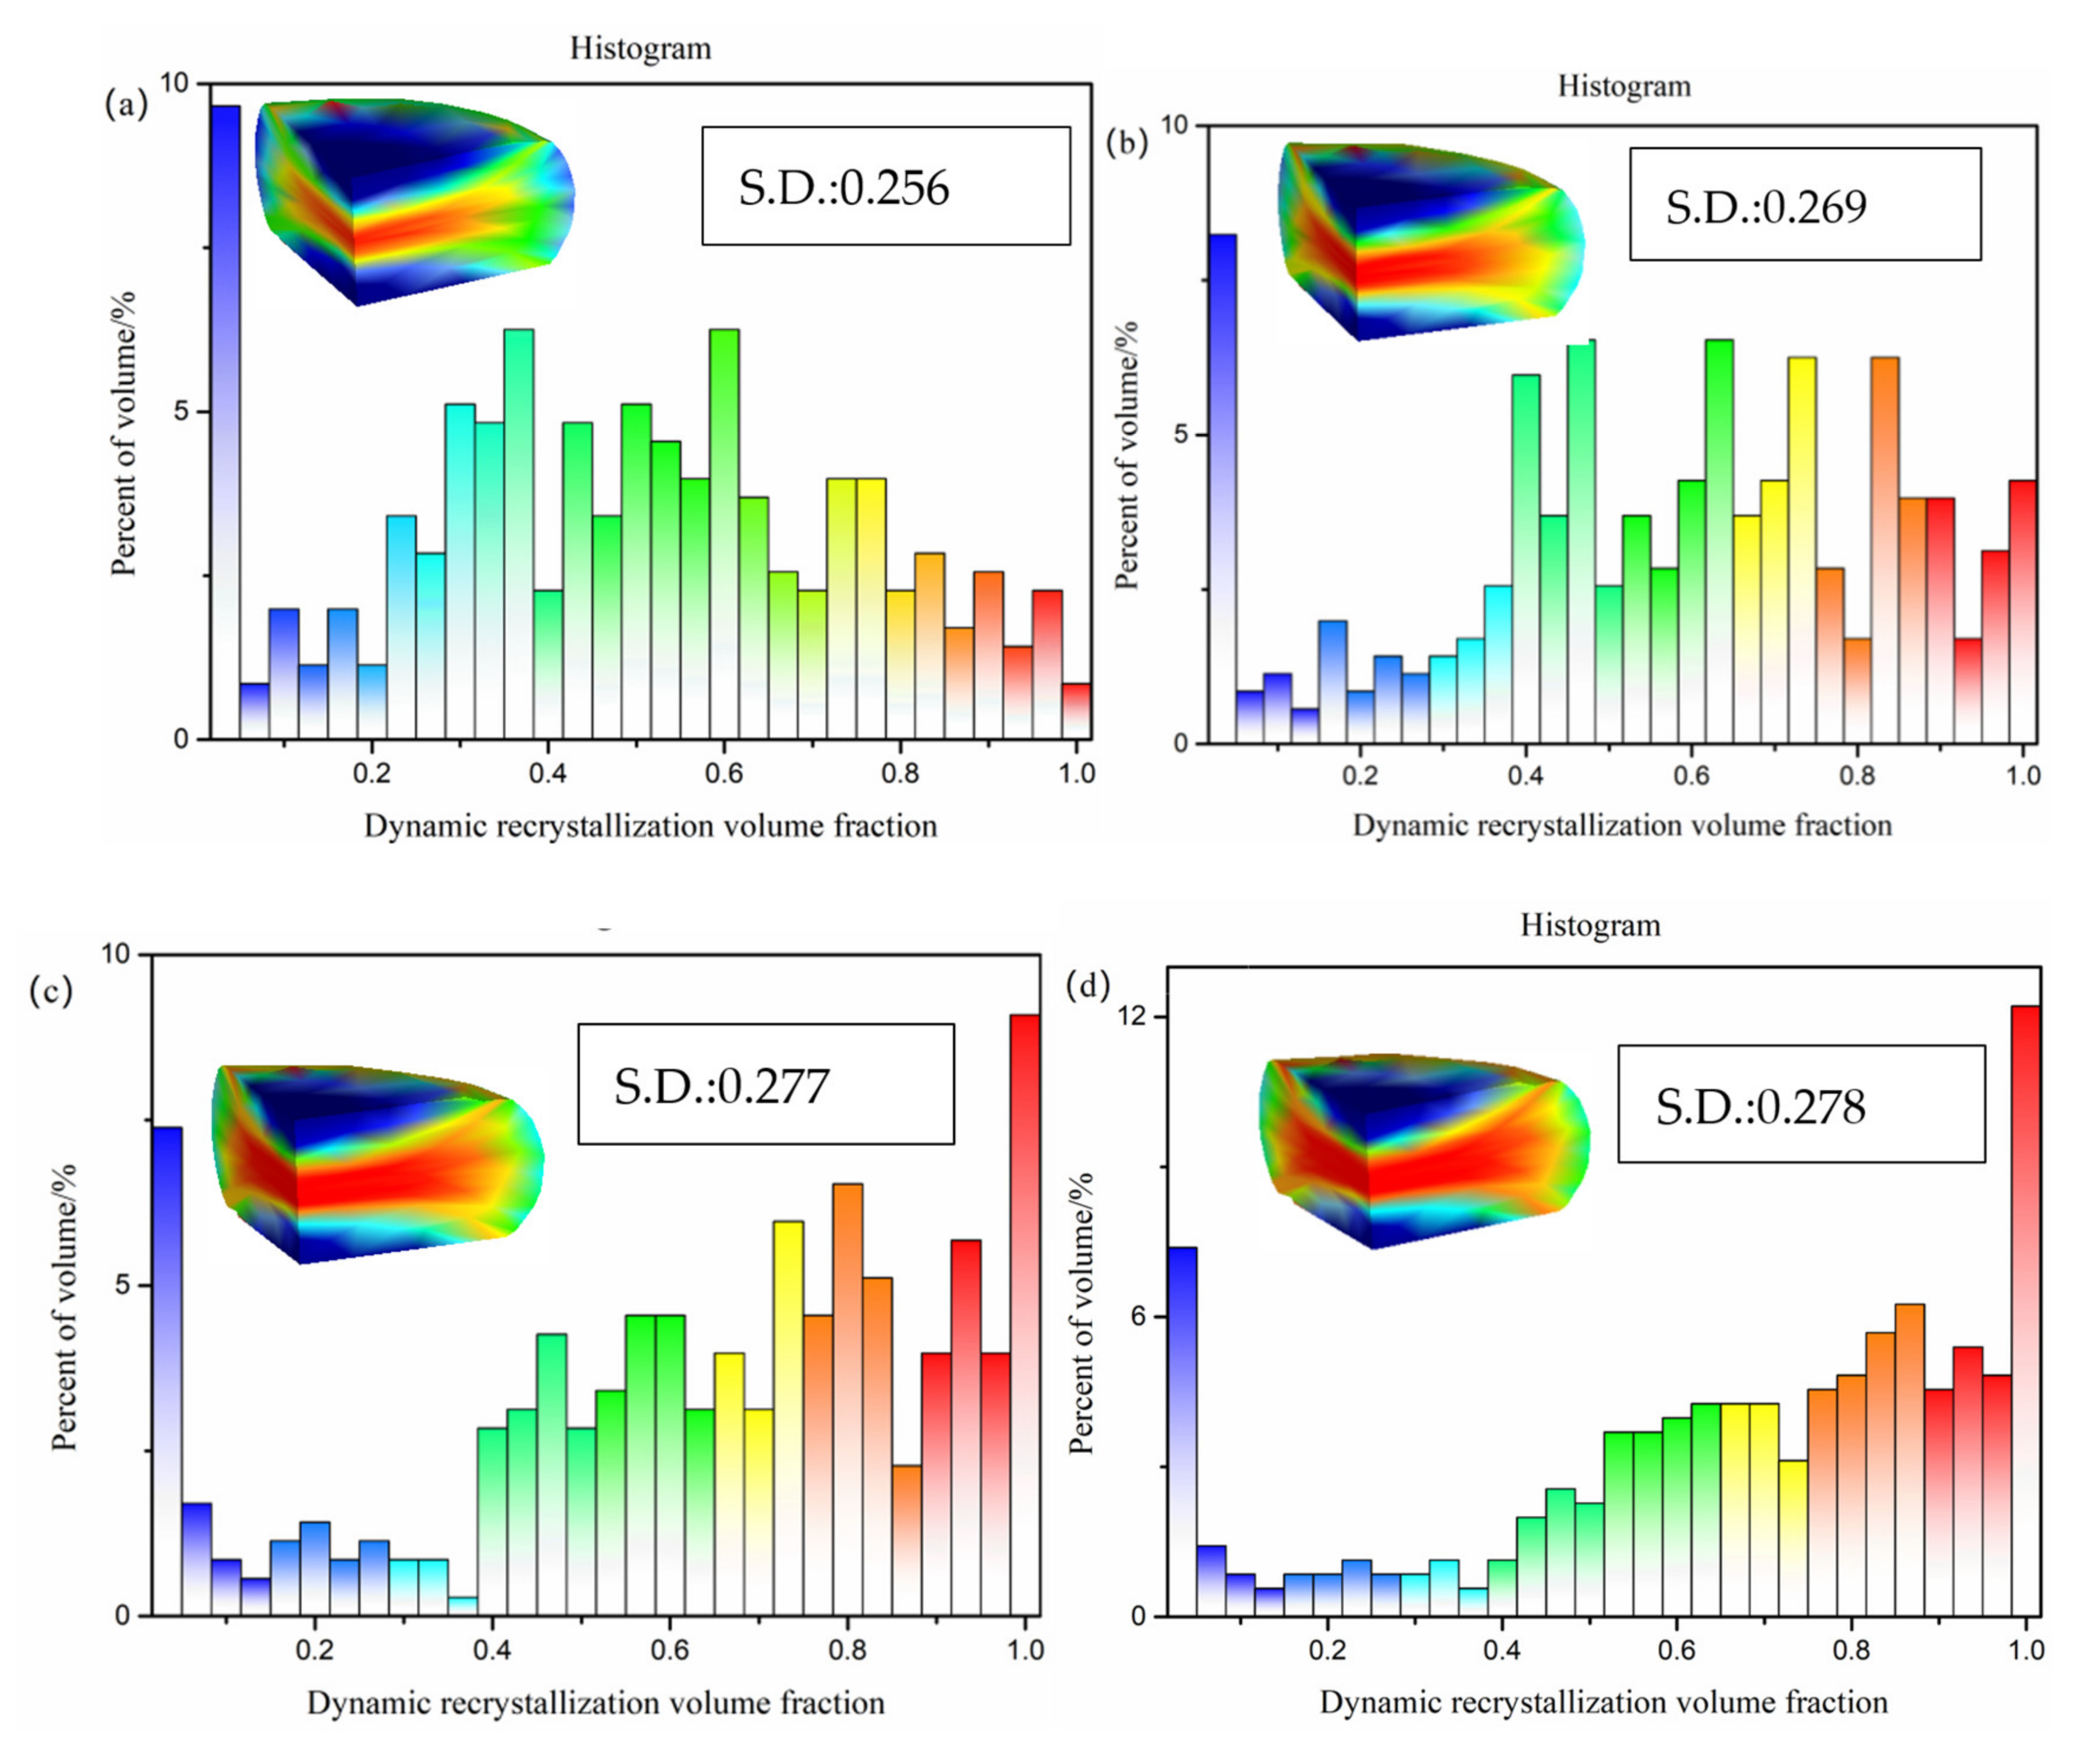
  • After the above model is implemented, software can be used to simulate the thermal deformation process of the material. The simulation results are in good agreement with the experimental results.

Author Contributions

Conceptualization, B.W. and C.H.; methodology, Y.Y.; software, L.Z.; validation, L.Z.; formal analysis, L.Z. and Y.Y.; investigation, L.Z.; resources, J.Z. and B.W.; data curation, L.Z.; writing—original draft preparation, L.Z.; writing—review and editing, L.Z. and B.W.; visualization, L.Z.; supervision, B.W.; project administration, L.Z. and B.W.; funding acquisition, B.W. and J.Z.; All authors have read and agreed to the published version of the manuscript.

Funding

This research was funded by the Innovation Program of the Shanghai Municipal Education Commission (NO.2019-01-07-00-09-E00024).

Data Availability Statement

Data presented in this article is available on request from the corresponding author.

Conflicts of Interest

The authors declare no conflict of interest. The funders had no role in the design of the study; in the collection, analyses, or interpretation of data; in the writing of the manuscript, or in the decision to publish the results.

References

  1. Malakondaiah, G.; Srinivas, M.; Rama Rao, P. Ultrahigh-strength low-alloy steels with enhanced fracture toughness. Prog. Mater. Sci. 1997, 42, 209–242. [Google Scholar] [CrossRef]
  2. Wu, Z. Ultra-high strength steel. Iron Steel 1986, 21, 71–75. [Google Scholar]
  3. Wang, B.Y.; Liu, Z.; Shi, W. Application of numerical simulation technology in the heavy forgings production. Heavy Cast. Forg. 1999, 1, 15–20. [Google Scholar]
  4. Sun, Z.C.; Yang, H.; Li, M.Q. FEM simulation od tube axial compressive precision forming process. Chin. J. Mech. Eng. 2001, 9, 34–38. [Google Scholar] [CrossRef]
  5. Jong, T.Y.; Chong, S.L.; Jeoung, H.K.; Nho-Kwang, P. Finite-element analysis of microstructure evolution in the cogging of alloy 781 ingot. Mater. Sci. Eng. A 2007, 449, 722–726. [Google Scholar]
  6. Cho, J.R.; Park, C.Y.; Yang, D.Y. Investigation of the cogging process by three-dimensional thermos-viscoplastic finite element analysis. Proc. Inst. Mech. Eng. Part B J. Eng. Manuf. 1992, 206, 277–286. [Google Scholar] [CrossRef]
  7. Dembiczak, T.; Knapinski, M.; Garbarz, B. Mathematical modeling of phenomena of dynamic recrystallization during hot plastic deformation in high-carbon bainitic steel. Metalurgija 2017, 56, 107–110. [Google Scholar]
  8. Knapinski, M.; Dyja, H.; Kawalek, A.; Fraczek, T.; Laber, K. Analysis of the microstructure evolution during thermo-mechanical treatment of the steel plates in grade X80-X100. Mater. Sci. 2013, 52, 239–242. [Google Scholar]
  9. Wu, M.W.; Zhang, S.J.; Ma, S.B.; Yan, H.J.; Wang, W.; Li, Q. Hot Deformation Behavior of Q345 Steel and Its Application in Rapid Shear Connection. Materials 2019, 12, 2186. [Google Scholar] [CrossRef] [Green Version]
  10. Ramana, A.V.; Balasundar, I.; Davidson, M.J.; Balamuralikrishnan, R.; Raghu, T. Constitutive Modelling of a New High-Strength Low-Alloy Steel Using Modified Zerilli–Armstrong and Arrhenius Model. Trans. Indian Inst. Met. 2019, 72, 2869–2876. [Google Scholar] [CrossRef]
  11. Suwaree, C.; Dmitry, G.E.; Chaowalit, L. Constitutive Behavior of an AA4032 Piston Alloy with Cu and Er Additions upon High-Temperature Compressive Deformation. Metall. Mater. Trans. A 2020, 51, 467–481. [Google Scholar]
  12. Lei, B.W.; Chen, G.Q.; Liu, K.H.; Wang, X.; Jiang, X.M.; Pan, J.L.; Shi, Q.Y. Constitutive analysis on high-temperature flow behavior of 3Cr-1Si-1Ni ultra-high strength steel for modeling of flow stress. Metals 2019, 9, 42. [Google Scholar] [CrossRef] [Green Version]
  13. Ren, S.J.; Luo, F.; Tian, Y.; Liu, D.B.; Wang, K.L.; Lu, S.Q. Flow stress curve correction and phenomenological constitutive relationship of A100 ultra-high strength steel. J. Mater. Eng. 2019, 47, 144–151. [Google Scholar]
  14. Cheng, L.; Chang, H.; Tang, B.; Kou, H.C.; Li, J.S. Flow stress prediction of high-Nb TiAl alloys under high temperature deformation. Adv. Mater. Res. 2012, 510, 723–728. [Google Scholar] [CrossRef]
  15. Ebrahimi, R.; Najafizadeh, A.A. new method for evaluation of friction in bulk metal forming. J. Mater. Pro. Tec. 2004, 152, 136–143. [Google Scholar] [CrossRef]
  16. Chen, M.M. Study on Surface Metal Flow Behavior and Residual Microstructure of Aluminum Alloy during Hot Extrusion; Shandong University: Jinan, China, 2018. [Google Scholar]
  17. McQueen, H.; Ryan, N. Constitutive analysis in hot working. Mater. Sci. Eng. A 2002, 322, 43–63. [Google Scholar] [CrossRef]
  18. Hu, Z.C.; Zhang, D.F.; Huang, T.; Wang, F. Flow Stress Behavior and Dynamic Recrystallization of 3104 Aluminum Alloy. Mater. Mech. Eng. 2005, 29, 6–9. [Google Scholar]
  19. Li, X.C.; Wu, W.F.; Sun, Q.P. “Study of hot-working steels” thermal-fatigue property prediction based on PLS. J. Mech. Strength 2010, 32, 824–828. [Google Scholar]
  20. Jonas, J.J.; Quelennec, X.; Jiang, L.; Martin, E. The Avrami kinetics of dynamic recrystallization. Acta Mater. 2009, 57, 2748–2756. [Google Scholar] [CrossRef]
  21. Laasraoui, A.; Jones, J.J. Prediction of steel flow stresses at high temperatures and strain rates. Metall. Mater. Trans. A 1991, 22, 1545–1558. [Google Scholar] [CrossRef]
  22. Lin, Y.C.; Chen, M.S.; Zhong, J. Prediction of 42CrMo steel flow stress at high temperature and strain rate. Mech. Res. Commun. 2008, 35, 142–150. [Google Scholar] [CrossRef]
  23. Bailey, J.E.; Hirsch, P.B. The dislocation distribution, flow stress, and stored energy in cold-worked polycrystalline silver. Philos. Mag. 1960, 5, 485–497. [Google Scholar] [CrossRef]
  24. Mirzadeh, H.; Najafizadeh, A. Extrapolation of flow curves at hot working conditions. Mater. Sci. Eng. A 2010, 527, 1856–1860. [Google Scholar] [CrossRef]
  25. Cheng, L.; Xue, X.Y.; Tang, B.; Kou, H.C.; Li, J.S. Flow characteristics and constitutive modeling for elevated temperature deformation of a high Nb containing TiAl alloy. Intermetallics 2014, 49, 23–28. [Google Scholar] [CrossRef]
  26. Sellars, C.M.; Whiteman, J.A. Recrystallization and grain growth in hot rolling. Met. Sci. 1979, 13, 187–194. [Google Scholar] [CrossRef]
  27. Li, Y.J.; Zhang, Y.; Chen, Z.Y.; Ji, Z.C.; Zhu, H.Y.; Sun, C.F.; Dong, W.P.; Li, X.; Sun, Y.; Yao, S. Hot deformation behavior and dynamic recrystallization of GH690 nickel-based superalloy. J. Alloy. Compd. 2020, 847, 156507. [Google Scholar] [CrossRef]
  28. Zhao, J.; Xie, F.Z. Fundamentals of Materials Science, 2rd ed.; Dalian University of Technology Press: Dalian, China, 2009; pp. 113–116. [Google Scholar]
Figure 1. The initial grain size and morphology of high-strength steel.
Metals 11 01239 g001
Figure 2. Graph of thermal compression protocol.
Metals 11 01239 g002
Figure 3. (a) Schematic diagram of the sample before and after thermal compression; (b) physical picture of the sample after compression.
Metals 11 01239 g003
Figure 4. The true stress–strain curves of the experiment modified under different deformation temperatures. (a) 0.01 s−1; (b) 0.1 s−1; (c) 1 s−1.
Metals 11 01239 g004aMetals 11 01239 g004b
Figure 5. The relationship between peak stress σ p and strain rate ε ˙ (a) and the relation curve of l n ε ˙ I n σ p ; (b) the relation curve of l n ε ˙ σ p .
Metals 11 01239 g005
Figure 6. The relationship between peak stress σ p strain rate   ε ˙   and T; (a) the relation curve of l n ε ˙ -ln[sinh(σp)]; (b) the relation curve of ln[sinh(σp)]−1/T.
Metals 11 01239 g006
Figure 7. The relationship between InZ and ln[sinh(ασp)].
Metals 11 01239 g007
Figure 8. Schematic description of the change in the work-hardening rate with stress. Reproduced from [20], with permission from Elsevier, 2021.
Metals 11 01239 g008
Figure 9. (a) The peak part of the flow curve at 1100 °C-0.1 s−1; (b) the variation curve of the work-hardening rate with stress.
Metals 11 01239 g009
Figure 10. Schematic description of the flow behavior of the high-strength steel. Reproduced from [20], with permission from Elsevier, 2021.
Metals 11 01239 g010
Figure 11. The graph of the dynamic recovery coefficient Ω and parameter Z.
Metals 11 01239 g011
Figure 12. Softening fraction curve and its fitting curve under different deformation conditions: (a) 1000 °C-0.1 s−1; (b) 1000 °C-1 s−1; (c) 1150 °C-0.1 s−1.
Metals 11 01239 g012
Figure 13. Correlations between the peak strain and parameter Z.
Metals 11 01239 g013
Figure 14. The relationship between InZ and ln[sinh(ασss)].
Metals 11 01239 g014
Figure 15. Comparison chart of actual values and predicted values under different deformation conditions: (a) 0.01 s−1; (b) 0.1 s−1; (c) 1 s−1.
Metals 11 01239 g015
Figure 16. Error analysis of predicted value and experimental value of constitutive model.
Metals 11 01239 g016
Figure 17. (a) The relation curve of I n ε ˙   -lnDdrex; (b) the relation curve of 1/T-lnDdrex (with error bars).
Metals 11 01239 g017
Figure 18. Error analysis of predicted values and experimental values of recrystallized grain size.
Metals 11 01239 g018
Figure 19. Distribution of volume fraction of DRX at   ε ˙   = 0.1 s−1 under different deformation temperatures: (a) 900 °C, (b) 1000 °C, (c) 1100 °C, (d) 1150 °C.
Metals 11 01239 g019
Figure 20. Microstructure of the alloy under the deformation strain rate of 0.1 s−1 at various temperatures: (a) 900 °C, (b) 1000 °C, (c) 1100 °C, (d) 1150 °C.
Metals 11 01239 g020
Figure 21. Histogram of the simulated recrystallization volume fraction and the average grain size after compression deformation and microstructures under the deformation temperature of 1100 °C with strain rates of (a) 0.1 s−1, (b) 1 s−1.
Metals 11 01239 g021
Figure 22. Histogram of the simulated recrystallization volume fraction and the average grain size after compression deformation and microstructures under the deformation temperature of 900 °C with strain rates of (a) 0.1 s−1, (b) 1 s−1.
Metals 11 01239 g022
Table 1. The values of peak stress (MPa) and peak strain under different deformation conditions.
Strain Rates s−1Deformation Temperature
800 °C900 °C1000 °C1100 °C1150 °C
σ p ε p σ p ε p σ p ε p σ p ε p σ p ε p
0.01312.60.356174.70.31597.90.27452.10.26247.90.200
0.1340.80.367218.60.334130.20.30883.90.27168.10.250
1354.20.368252.60.355180.70.311129.10.274101.80.253
Table 2. k and n values under different deformation conditions.
Strain Rates s−1Deformation Temperature
800 °C900 °C1000 °C1100 °C1150 °C
knknknknkn
0.01--2.392.291.581.030.960.811.481.18
0.1--0.731.821.451.120.742.172.212.39
1--0.711.453.152.221.771.811.231.51
Publisher’s Note: MDPI stays neutral with regard to jurisdictional claims in published maps and institutional affiliations.

