Article

Molecular Dynamics Study of Bulk Properties of Polycrystalline NiTi

Center for Laser-Based Manufacturing, School of Mechanical Engineering, Purdue University, West Lafayette, IN 47907, USA
*
Author to whom correspondence should be addressed.
Metals 2021, 11(8), 1237; https://doi.org/10.3390/met11081237
Submission received: 23 June 2021 / Revised: 13 July 2021 / Accepted: 29 July 2021 / Published: 4 August 2021
(This article belongs to the Special Issue Structure, Texture and Functional Properties of Shape Memory Alloys)

Abstract

:
Molecular dynamics (MD) simulations were carried out to study the bulk polycrystalline properties of NiTi. Thermally driven phase transitions of NiTi between martensite and austenitewere simulated using single crystalline simulation domains. With external stress boundary conditions, MD simulation successfully predicted experimentally observed phase transformation temperatures of bulk polycrystalline. Elastic characteristics of NiTi martensite were simulated using polycrystalline simulation domains that consist of realistic disorientations and grain boundary structures. The existence of grain disorientation and grain boundary lowered the potential energy of the simulation domain, which led to more realistic elastic modulus prediction. Analysis of simulation domains that predicted realistic bulk polycrystalline properties showed that the major difference between single crystalline and polycrystalline structures is atomic stress distribution.

1. Introduction

Shape-memory alloys (SMAs) have been utilized in many fields due to their attendant shape-memory effect and superelasticity. Applications of SMAs have been widely developed in the biomedical, aerospace, construction, and automotive industries [1]. Specifically, nickel–titanium alloy (i.e., Nitinol) has been one of the most promising shape-memory alloys for commercial applications. Due to this reason, many molecular dynamics (MD) studies focused on understanding and predicting its atomic structure and related phenomena.
Although many aspects of NiTi were revealed, most of the studies focused on the characteristics of single crystalline NiTi. However, some of the predicted properties from MD simulations of single crystalline NiTi do not accurately represent the characteristics of bulk polycrystalline NiTi, including thermally induced phase transformation and elastic characteristics. For thermally induced phase transformation, Ko et al. [2] used the second-nearest-neighbor (2NN) MEAM potential to show phase transitions between twinned B19′ structure and B2 structure, but the prediction of too high austenite finish temperature (A_f above 480 K) made the result unrealistic. Zhong et al. [3] used the Finnis–Sinclair (FS) potential in heating and cooling simulation of NiTi, but only showed abrupt changes of a sum of all the shear components without structural information of martensite structure. Mutter and Nielaba [4] showed abrupt changes in both bonding angle and edge lengths indicating phase transitions during heating/cooling, but the martensite structure with different edge lengths and bonding angles was formed after one heating/cooling cycle. Moreover, phase transformation temperatures were only calculated in the forms of T M = 0.5 ( M s + M f ) and T A = 0.5 ( A s + A f ) , which are difficult to compare with experimental data. For elastic characteristics of NiTi, the prediction of elastic properties of martensite NiTi has been an issue. Many simulation studies from single crystalline NiTi calculated elastic constants and associated Young’s modulus using Hill methods [5]. While experimentally observed Young’s modulus was 20–40 GPa [6], predictions from MD and first-principle studies showed much higher values of 133–526 GPa [7,8,9]. NiTi has been widely used since its mechanical properties can be tailored by composition and post heat treatment. Therefore, precise prediction of phase transformation temperatures and elastic properties is important for designing mechanical properties of specific purposes.
Recently, MD studies using polycrystalline NiTi simulation domains were conducted to achieve a more accurate prediction of bulk properties. Stress-induced martensitic transformations of NiTi were studied using polycrystalline simulation domains that consist of nano-sized grains [10,11,12,13]. Although very high strain rates ( 10 7 10 9   s 1 ) were used, the above studies successfully showed the elastic modulus of austenite as 60–80 GPa, which agreed well with experimental data [14]. It should be noted that elastic modulus is independent of strain rate [15]. However, no attempts have been made to predict realistic elastic properties of martensite NiTi using polycrystalline microstructure. In addition, the predicted A f by MD simulation was 200 K and 300 K from 10 nm and 15 nm polycrystalline simulation domains, respectively [10]. Considering that the experimentally observed A f is 380 K [16], it can be concluded that either a different approach or a more realistic polycrystalline simulation domain is necessary.
Applying proper stress boundary conditions needs to be carefully considered since studies showed that the role of hydrostatic pressure and shear stress is important when predicting the properties of martensite NiTi. Bakhtiari et al. [17] showed that stable martensite (B19′) can be achieved with the hydrostatic pressure above 2 GPa. Huang et al. [18] reported that the B19′ structure is unstable and can be stabilized only with shear stresses between 0.77 and 1.4 GPa. Wagner and Windl [19] stated that shear stress above 1 GPa is necessary to stabilize B19′ structure. While the above studies showed the importance of applied stress, there remain a number of issues to be considered. Such large stress states from both hydrostatic pressure and shear stress cases for stabilizing B19′ structure can only exist during loading (normal or shear directions) situations or after cold deformation processes such as cold rolling or extrusion. Considering that martensite NiTi can also be formed in stress-free conditions [20], it is doubtful that such large stress is required in the prediction of bulk NiTi properties.
The effects of grain structure should also be considered since MD simulation results showed that both stress-induced and thermally induced phase transformations are influenced by grain structures. Zhang et al. [12] showed that simulation domains of different polycrystalline structures experienced different stress-induced martensitic transformation behaviors, which emphasized the importance of grain size, grain orientation, and grain boundary. Wang et al. [21] compared single crystalline and polycrystalline structures in MD simulations to show the effects of grain boundaries on stress-induced phase transformations. Li et al. [10] showed that MD simulation domains with different grain structures exhibited different thermally induced phase transformation temperatures. The above studies showed the importance of proper grain structure in the prediction of bulk polycrystalline properties.
This study is focused on predictions of bulk polycrystalline NiTi properties using MD simulations by considering the effects of stress boundary conditions and grain structures. Thermally induced phase transitions of NiTi under different external stresses were simulated in order to properly predict precise phase transformation characteristics. External stresses were applied in both normal and shear directions on a single crystalline simulation domain to represent the bulk material state. In this way, bulk polycrystalline properties can be predicted without spending extremely large computational resources. Elastic characteristics of polycrystalline NiTi martensite were calculated using different grain structures including experimentally observed grain disorientations and grain boundaries. Simulation domains that successfully predicted bulk polycrystalline properties were analyzed to understand bulk polycrystalline structure. While properties of NiTi are well known, but it is also well known they are sensitive to the Ni percentage and grain size. Being able to predict such affects would be beneficial to the future design and applications of NiTi.

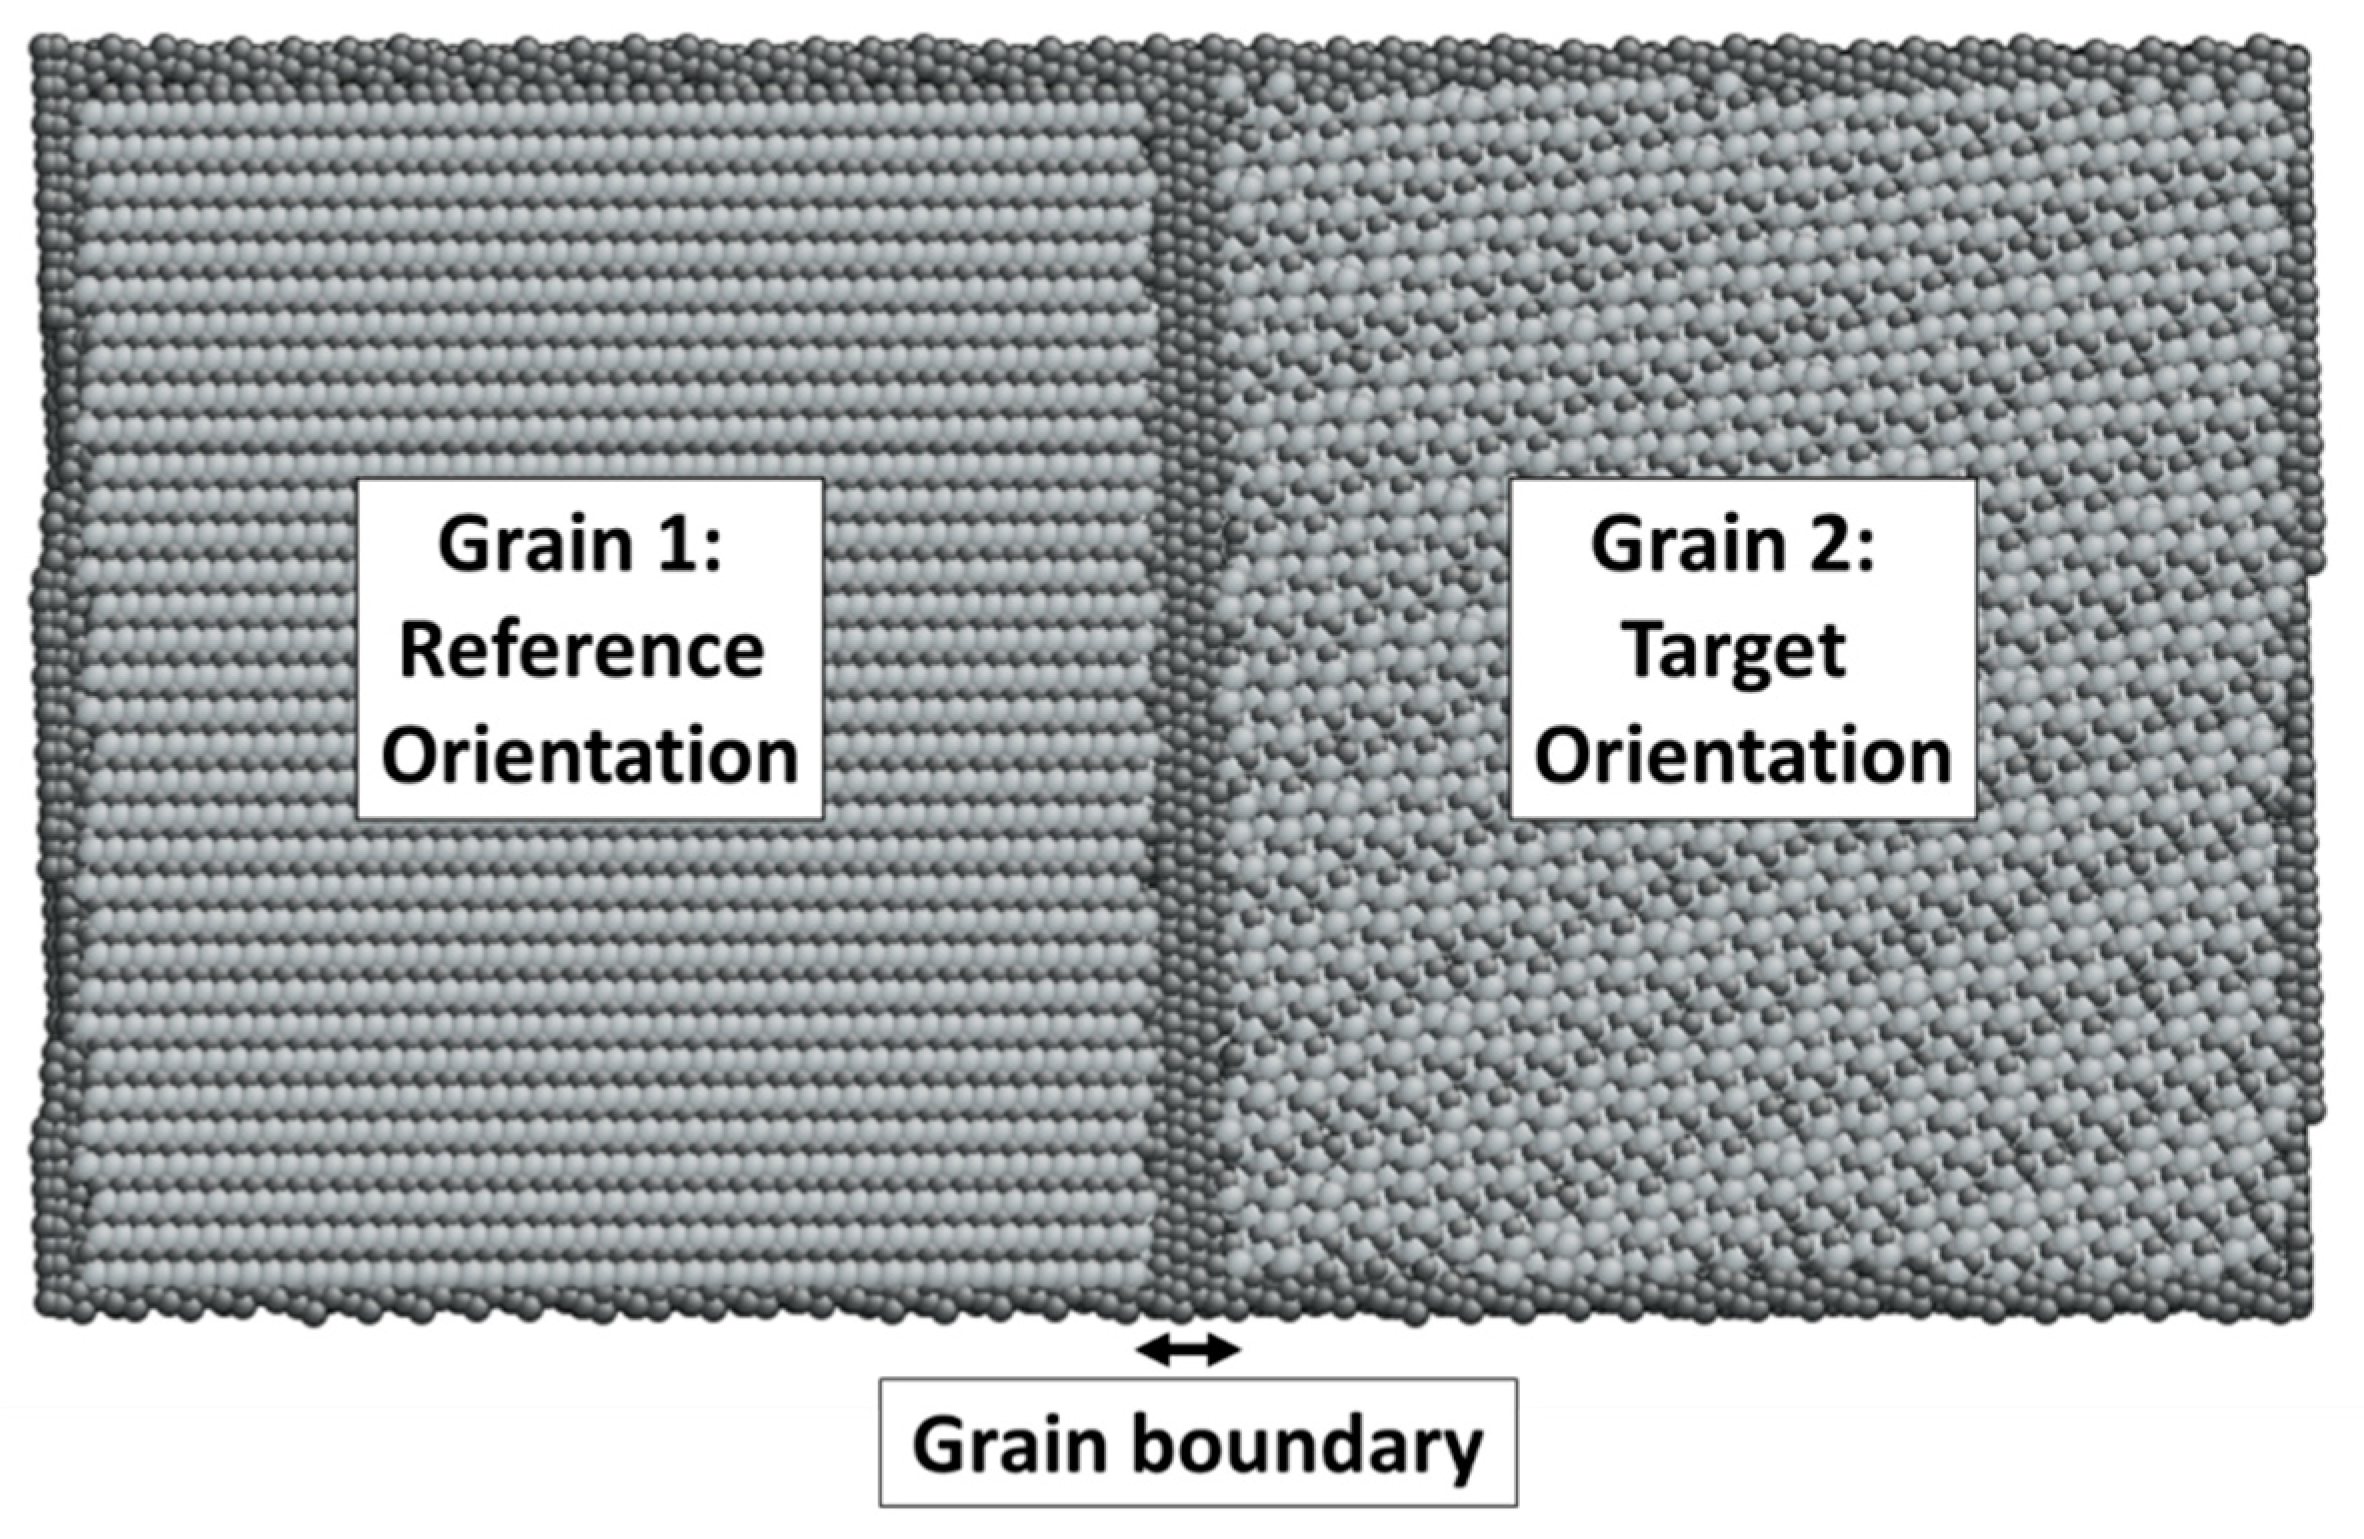
2. Simulation Method

The open-source MD program LAMMPS [22] and the FS potential developed by Zhong et al. [3,9] were used. Two MD simulations were conducted: i) thermally induced phase transformation under external stress conditions, and ii) elastic constant calculations of polycrystalline with misorientations and grain boundary.
Thermally induced phase transformation of NiTi was simulated by changing the temperature of the system. Atom positions were generated and velocities were sampled from the isothermal–isobaric ensemble with constant N, p, and T (NPT) controlling temperature and external stress tensors, where N is the number of particles, p is pressure, and T is temperature. B2 (austenite) structure in an orthogonal shape box was constructed and first stabilized at 450 K for 500 ps (250,000 time steps). The temperature was decreased from 450 K to 10 K and then increased again to 450 K with a rate of 0.1 K/ps. External stresses on the domain were applied in both normal and shear directions (x, y, z, xy, xz, and yz). Each stress component was controlled independently. In this study, seven different external stress settings were applied on simulation domains: 0 GPa, 10 4 GPa, 10 3 GPa, 0.01 GPa, 0.05 GPa, 0.1 GPa, 0.5 GPa, and 1.1 GPa. The time step of ∆t = 0.002 ps was used under periodic boundary conditions. Additional simulation cases were conducted only with hydrostatic pressure applied (normal stresses in a coupled manner) in order to provide comparison data.
The adiabatic elastic constants at a finite temperature were calculated from the stress tensor fluctuation during elastic deformation of the simulation domain. The compliance tensor ( S i j k l ) and the elastic constants ( C i j k l ) are calculated using the Equations (1) and (2).
δ ( ε i j ε k l ) = ε i j ε k l a v ε i j a v ε k l a v = k B T V 0 S i j k l
C i j k l = V 0 k B T δ ( P i j P k l ) + 2 N k B T V 0 ( δ i l δ j k + δ i k δ j l ) + 1 V 0 b > a f ( r a b ) x a b i x a b j x a b k x a b l a v
where ε i j is the strain tensor, V 0 is the equilibrium volume of the N particle system, P i j is the internal stress tensor, x a b is the vector joining a and b of length r a b , and f is the function of f = r 2 ( u r 1 u ) with the pair potential denoted by u(r). The ensemble average is denoted by the bracket,   a v . The detailed methodology is referred to in the work of Kimizuka et al. [23].
Bulk mechanical properties of polycrystalline structures were calculated from elastic constants. Macroscopic elastic modulus E, shear modulus G, and bulk modulus B were calculated by using Voigt [24], Reuss [25], and Hill averaged values [5], as described by the following Equations (3)–(9):
9 B V = ( C 11 + C 22 + C 33 ) + 2 ( C 12 + C 23 + C 31 )
15 G V = ( C 11 + C 22 + C 33 ) ( C 12 + C 23 + C 31 ) + 3 ( C 44 + C 55 + C 66 )
1 B R = ( S 11 + S 22 + S 33 ) + 2 ( S 12 + S 23 + S 31 )
15 G R = 4 ( S 11 + S 22 + S 33 ) 4 ( S 12 + S 23 + S 31 ) + 3 ( S 44 + S 55 + S 66 )
1 E V = 1 3 G V + 1 9 B V
1 E R = 1 3 G R + 1 9 B R
E = E V + E R 2
where B and G are Voigt–Reuss–Hill average of bulk modulus and shear modulus, respectively. Subscripts R and V represent the Reuss and the Voigt averages. E V and E R are the elastic modulus calculated by the Voigt and Reuss methods.
Prediction of bulk polycrystalline properties was conducted using simple, but realistic simulation domains. As shown in Figure 1, the simulation domain was constructed with different grain distributions and grain boundaries, which were reported as important factors affecting the elastic modulus calculation [26,27]. Two adjacent grains were arranged following the experimentally observed sigma disorientations (Σ3, Σ5, Σ9, and Σ15) according to the coincident site lattice (CSL) theory [28]. While the left-side grain 1 had a constant orientation angle of 0°, orientation angles for the right-side grain 2 were changed to match sigma disorientation values of Σ3, Σ5, Σ9, and Σ15. Multiple simulation domains were constructed with different initial grain boundary (GB) thickness values of 0–15 Å. It was set in the range to represent realistic grain structure since the grain boundary thickness of NiTi was reported as approximately 1 nm [29,30]. The maximum grain boundary thickness was set as 15 Å to consider widely accepted grain boundary thickness, which is equivalent to 2–3 atomic layers [31]. The total numbers of atoms inside each grain for the simulations of thermally induced phase transformation and elastic constant calculation were selected to be 60,016 and 221,050 on the basis of domain size sensitivity test results.

3. Simulation Results and Discussions

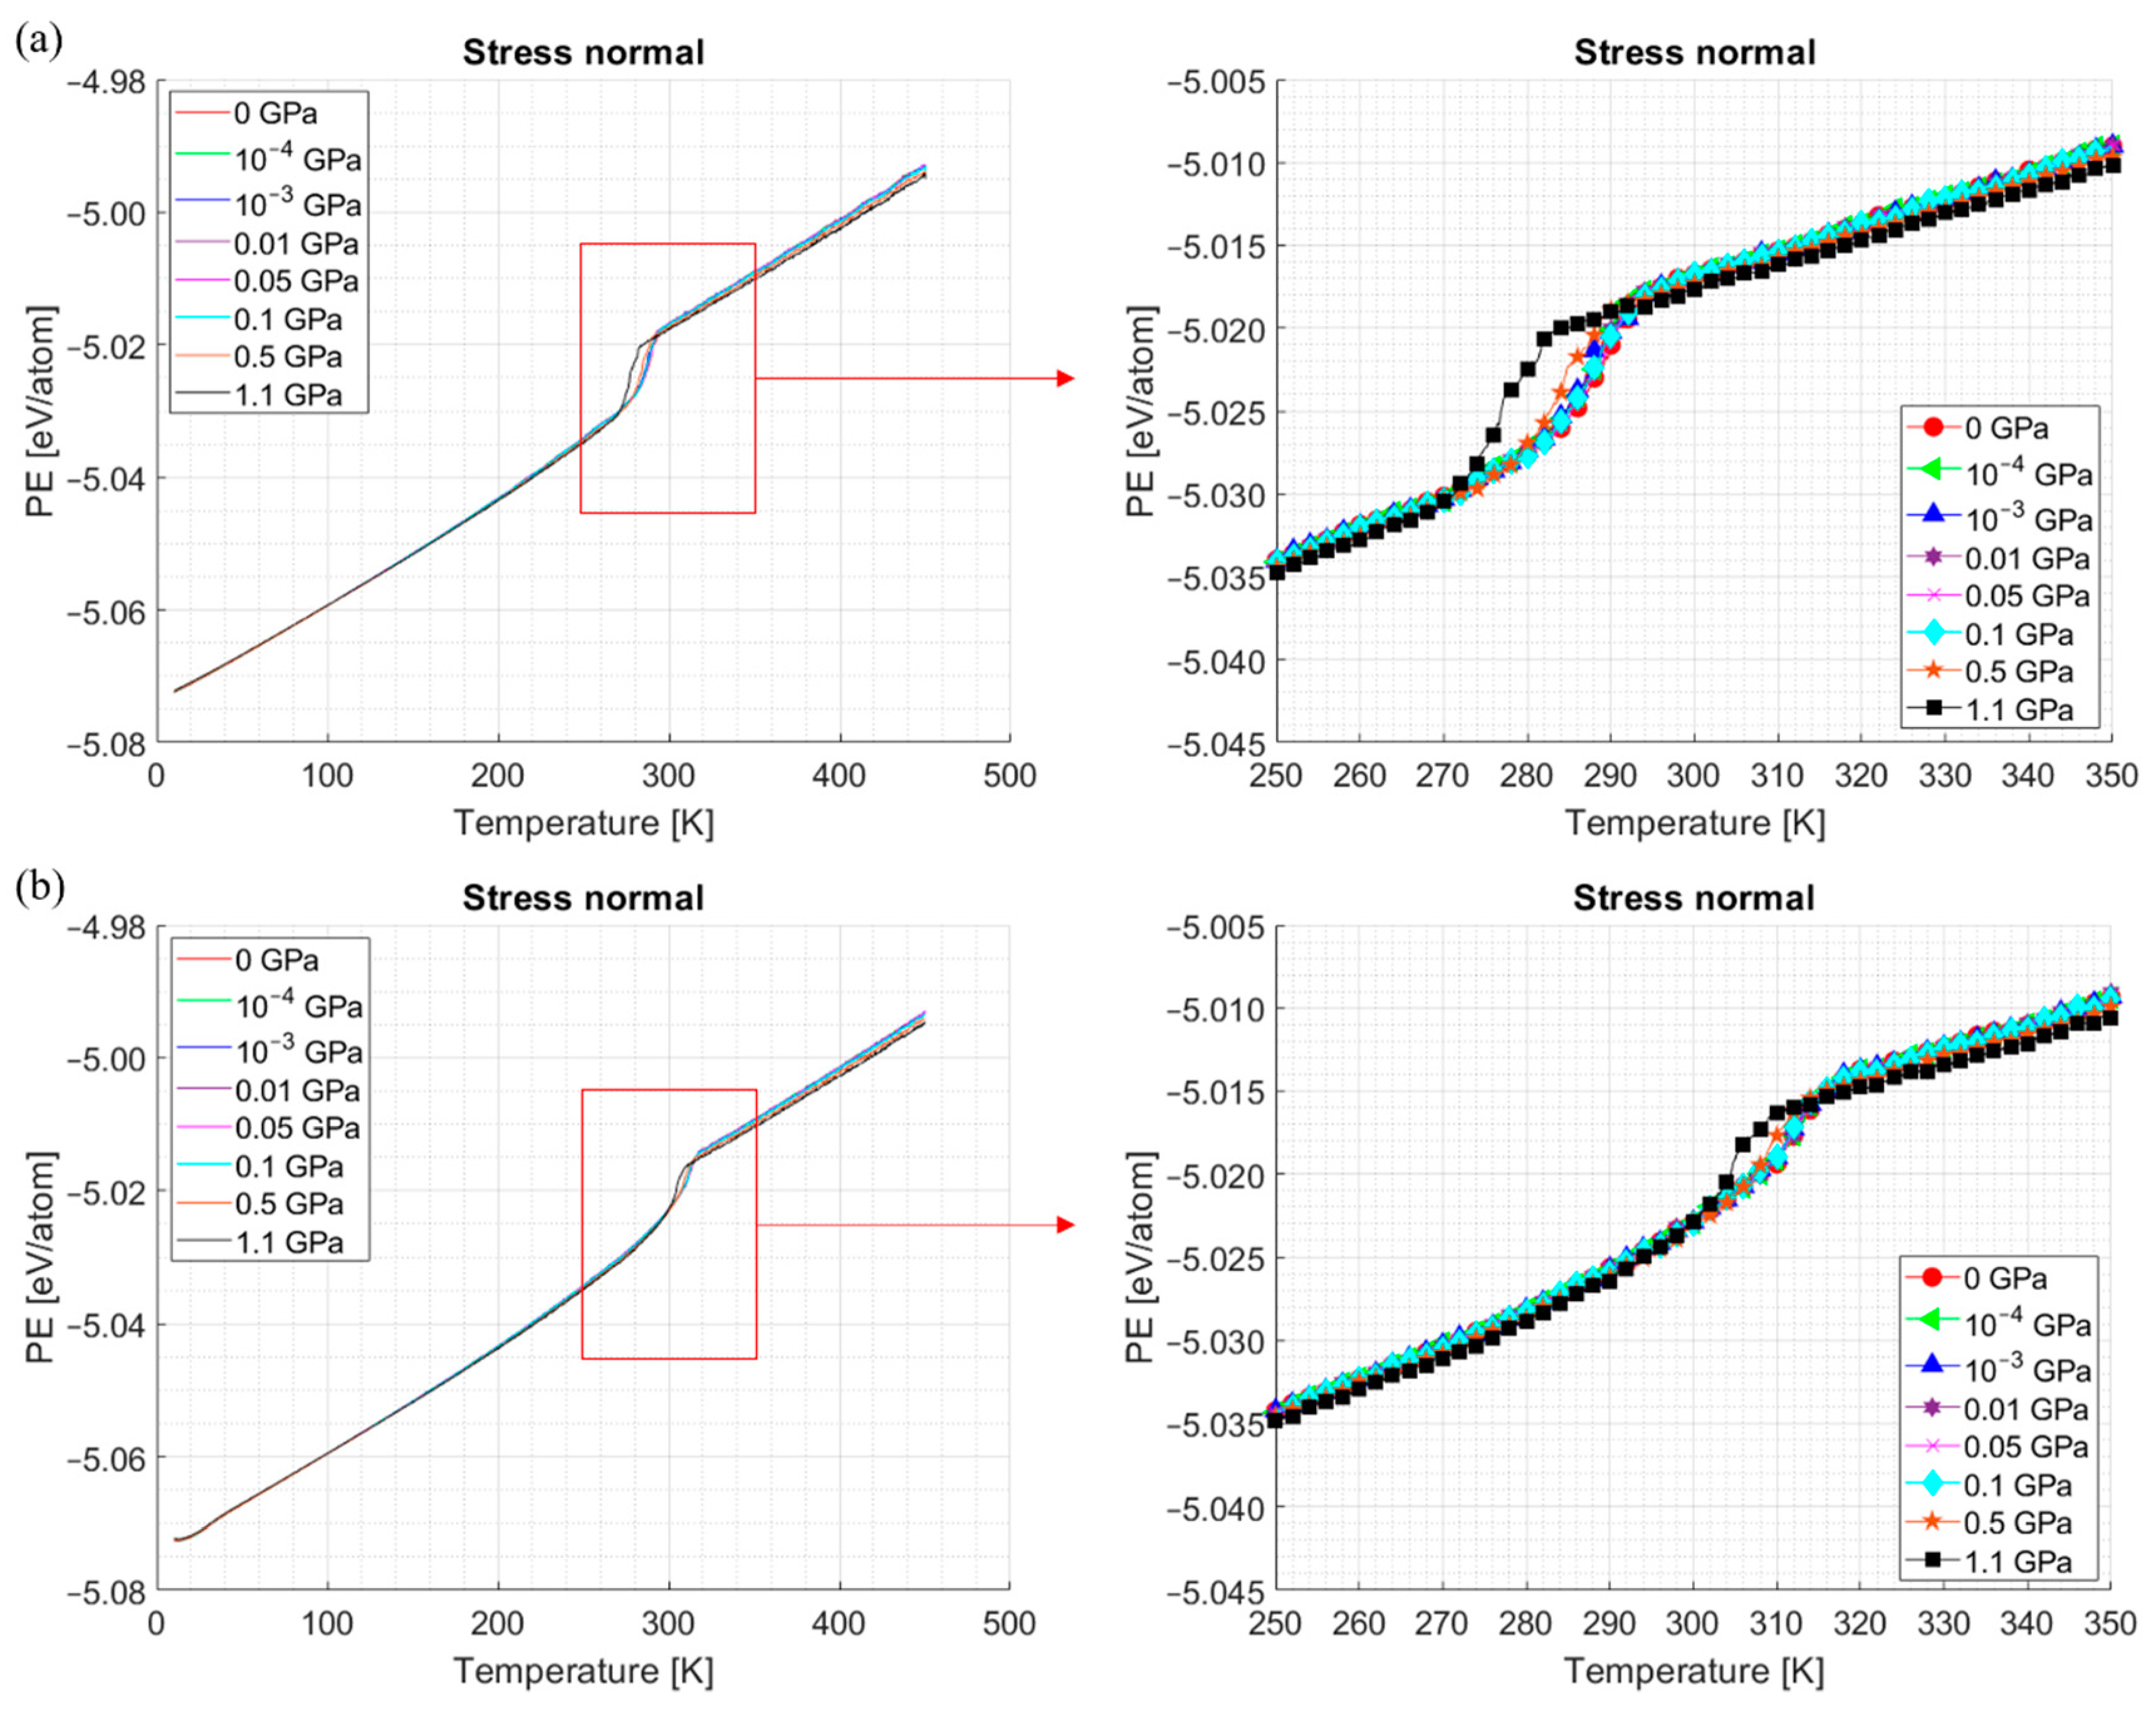
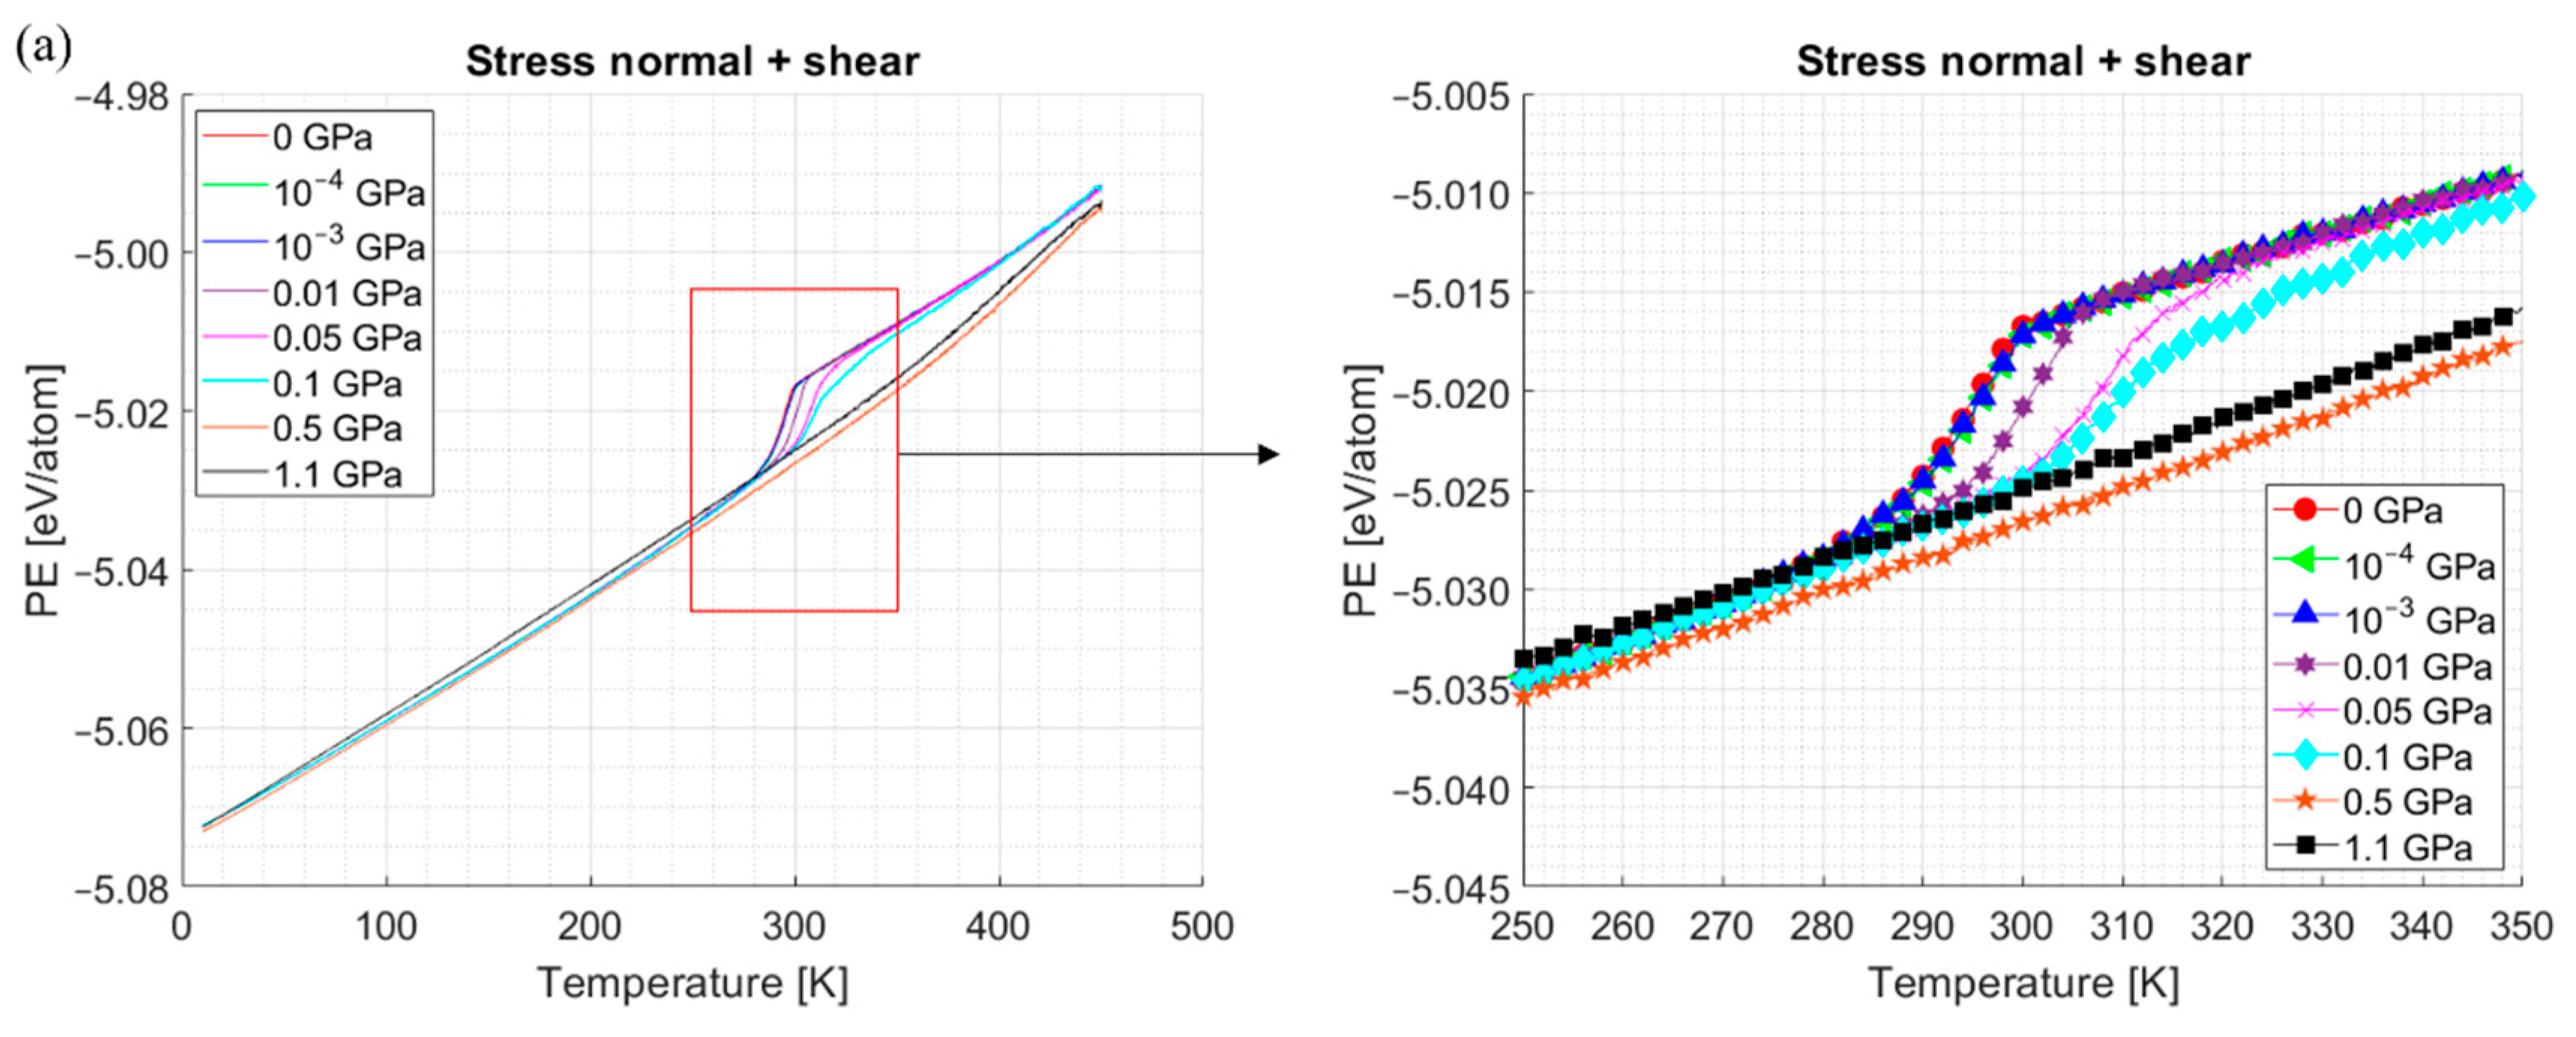
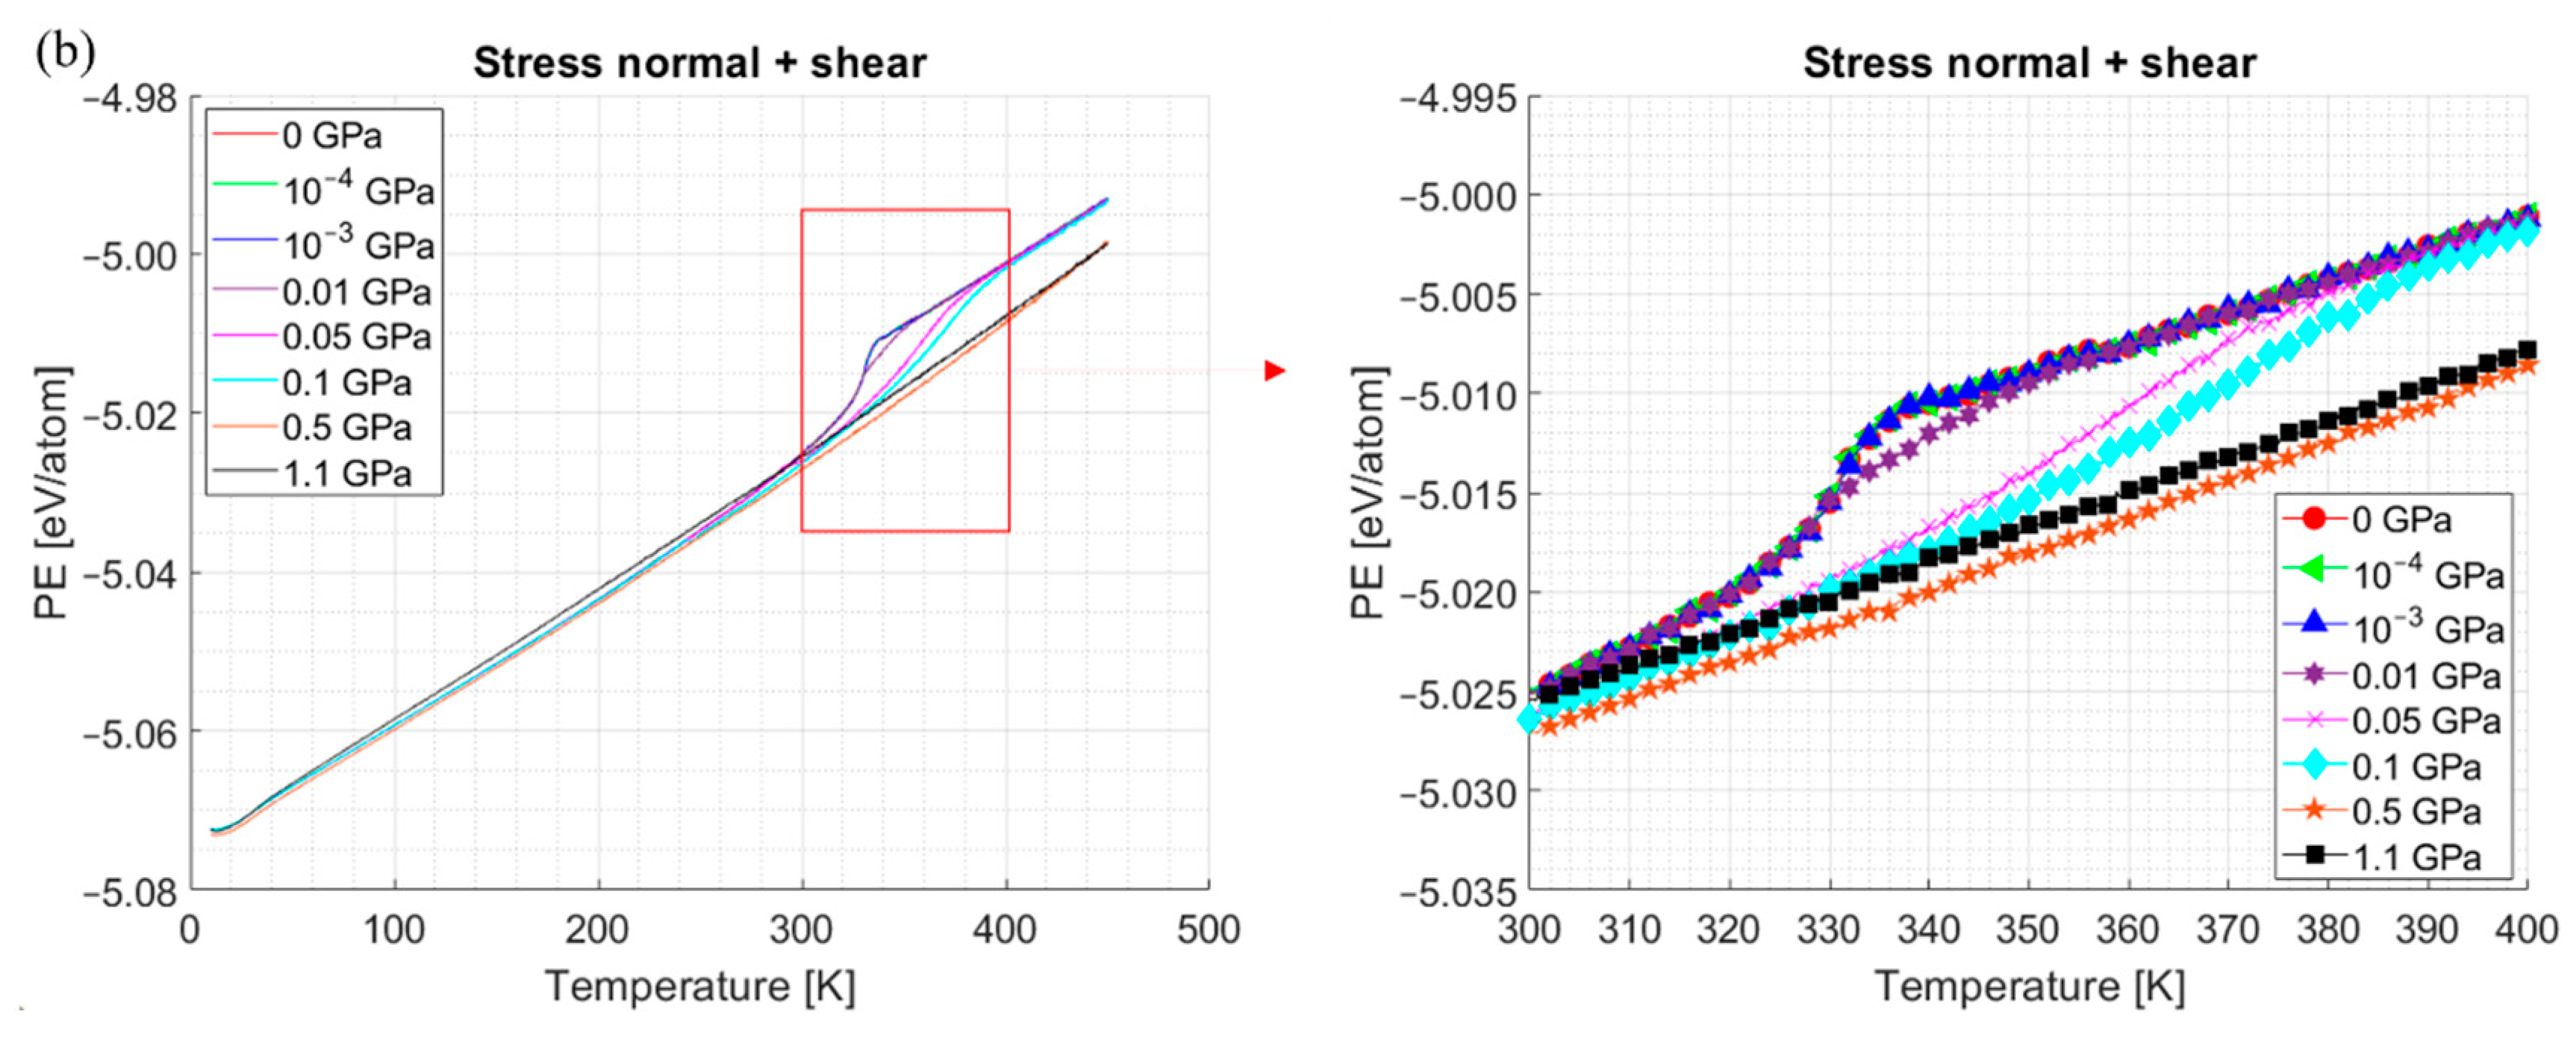
3.1. Thermally Induced Phase Transition under External Stress

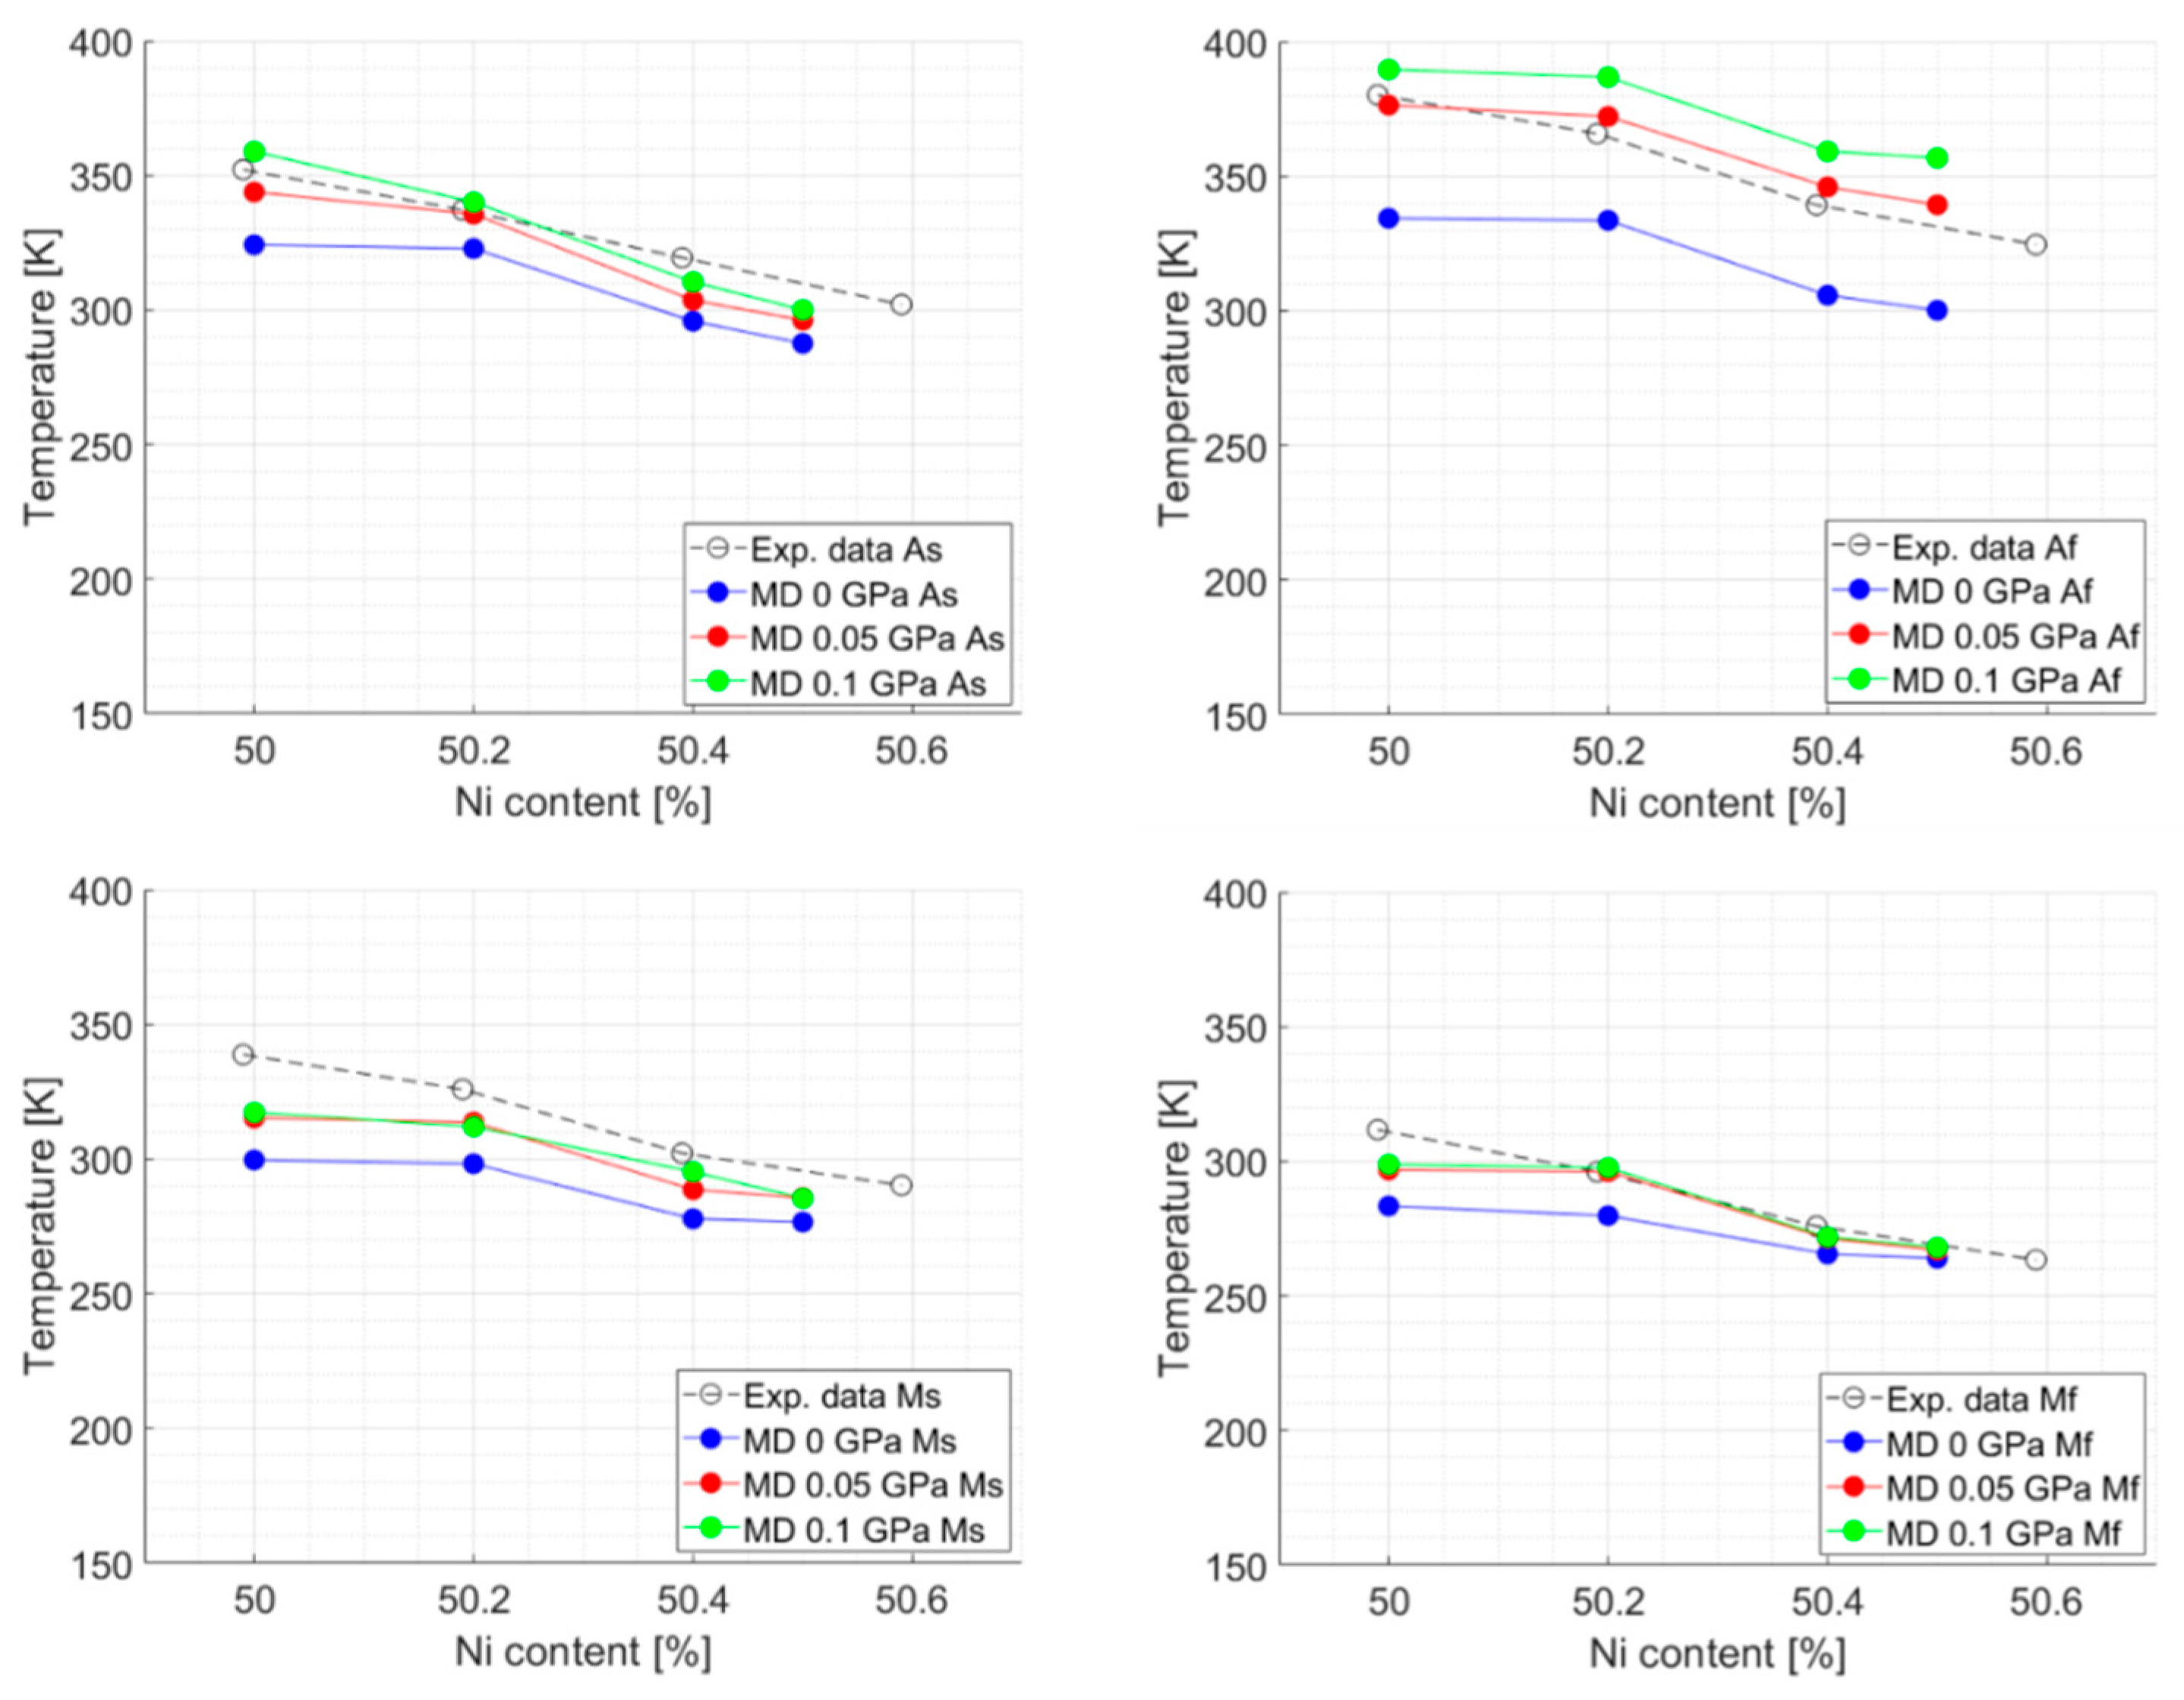
3.1.1. Phase Transformation Temperature

Effects of external stress on thermally induced phase transition were studied from two simulation groups: normal stress (hydrostatic pressure) only and both normal and shear stresses. Potential energy (PE) profile results from the two groups during cooling and heating simulations are shown in Figure 2 and Figure 3, respectively. Abrupt changes in PE profiles indicate clear transitions between austenite and martensite structures at phase transformation temperatures. Phase transformation temperatures ( M s , M f , A s , and A f ) from two simulation groups were acquired from tangential lines drawn from PE profiles where abrupt changes were observed and compared, as shown in Figure 4. It was observed that phase transformation temperatures were not strongly affected by increased normal stress within the 0–1.1 GPa range. Phase transformation temperatures decreased by ~4 K and ~11 K as normal stress increased to 0.5 GPa and 1.1 GPa, as shown in Figure 4b. Wan et al. [32] reported similar results such that phase transformation temperatures decreased by 5–10 K as hydrostatic pressure increased from 0 GPa to 1 GPa. On the other hand, results from normal + shear stresses showed a different trend. As shown in Figure 4c, phase transformation temperatures increased as external stress increased. In addition, phase transformation temperatures were more strongly affected by increased external stress when both stresses were applied. Especially, A f temperatures increased by 43 K and 56 K respectively as external stress was increased to 0.05 GPa and 0.1 GPa. No abrupt changes in PE profiles were observed, indicating that phase transformation was suppressed when external stresses in both normal and shear directions exceeded 0.1 GPa. The comparison of phase transformation temperatures from the two groups clearly showed that the presence of shear stress affected phase transformation temperatures.

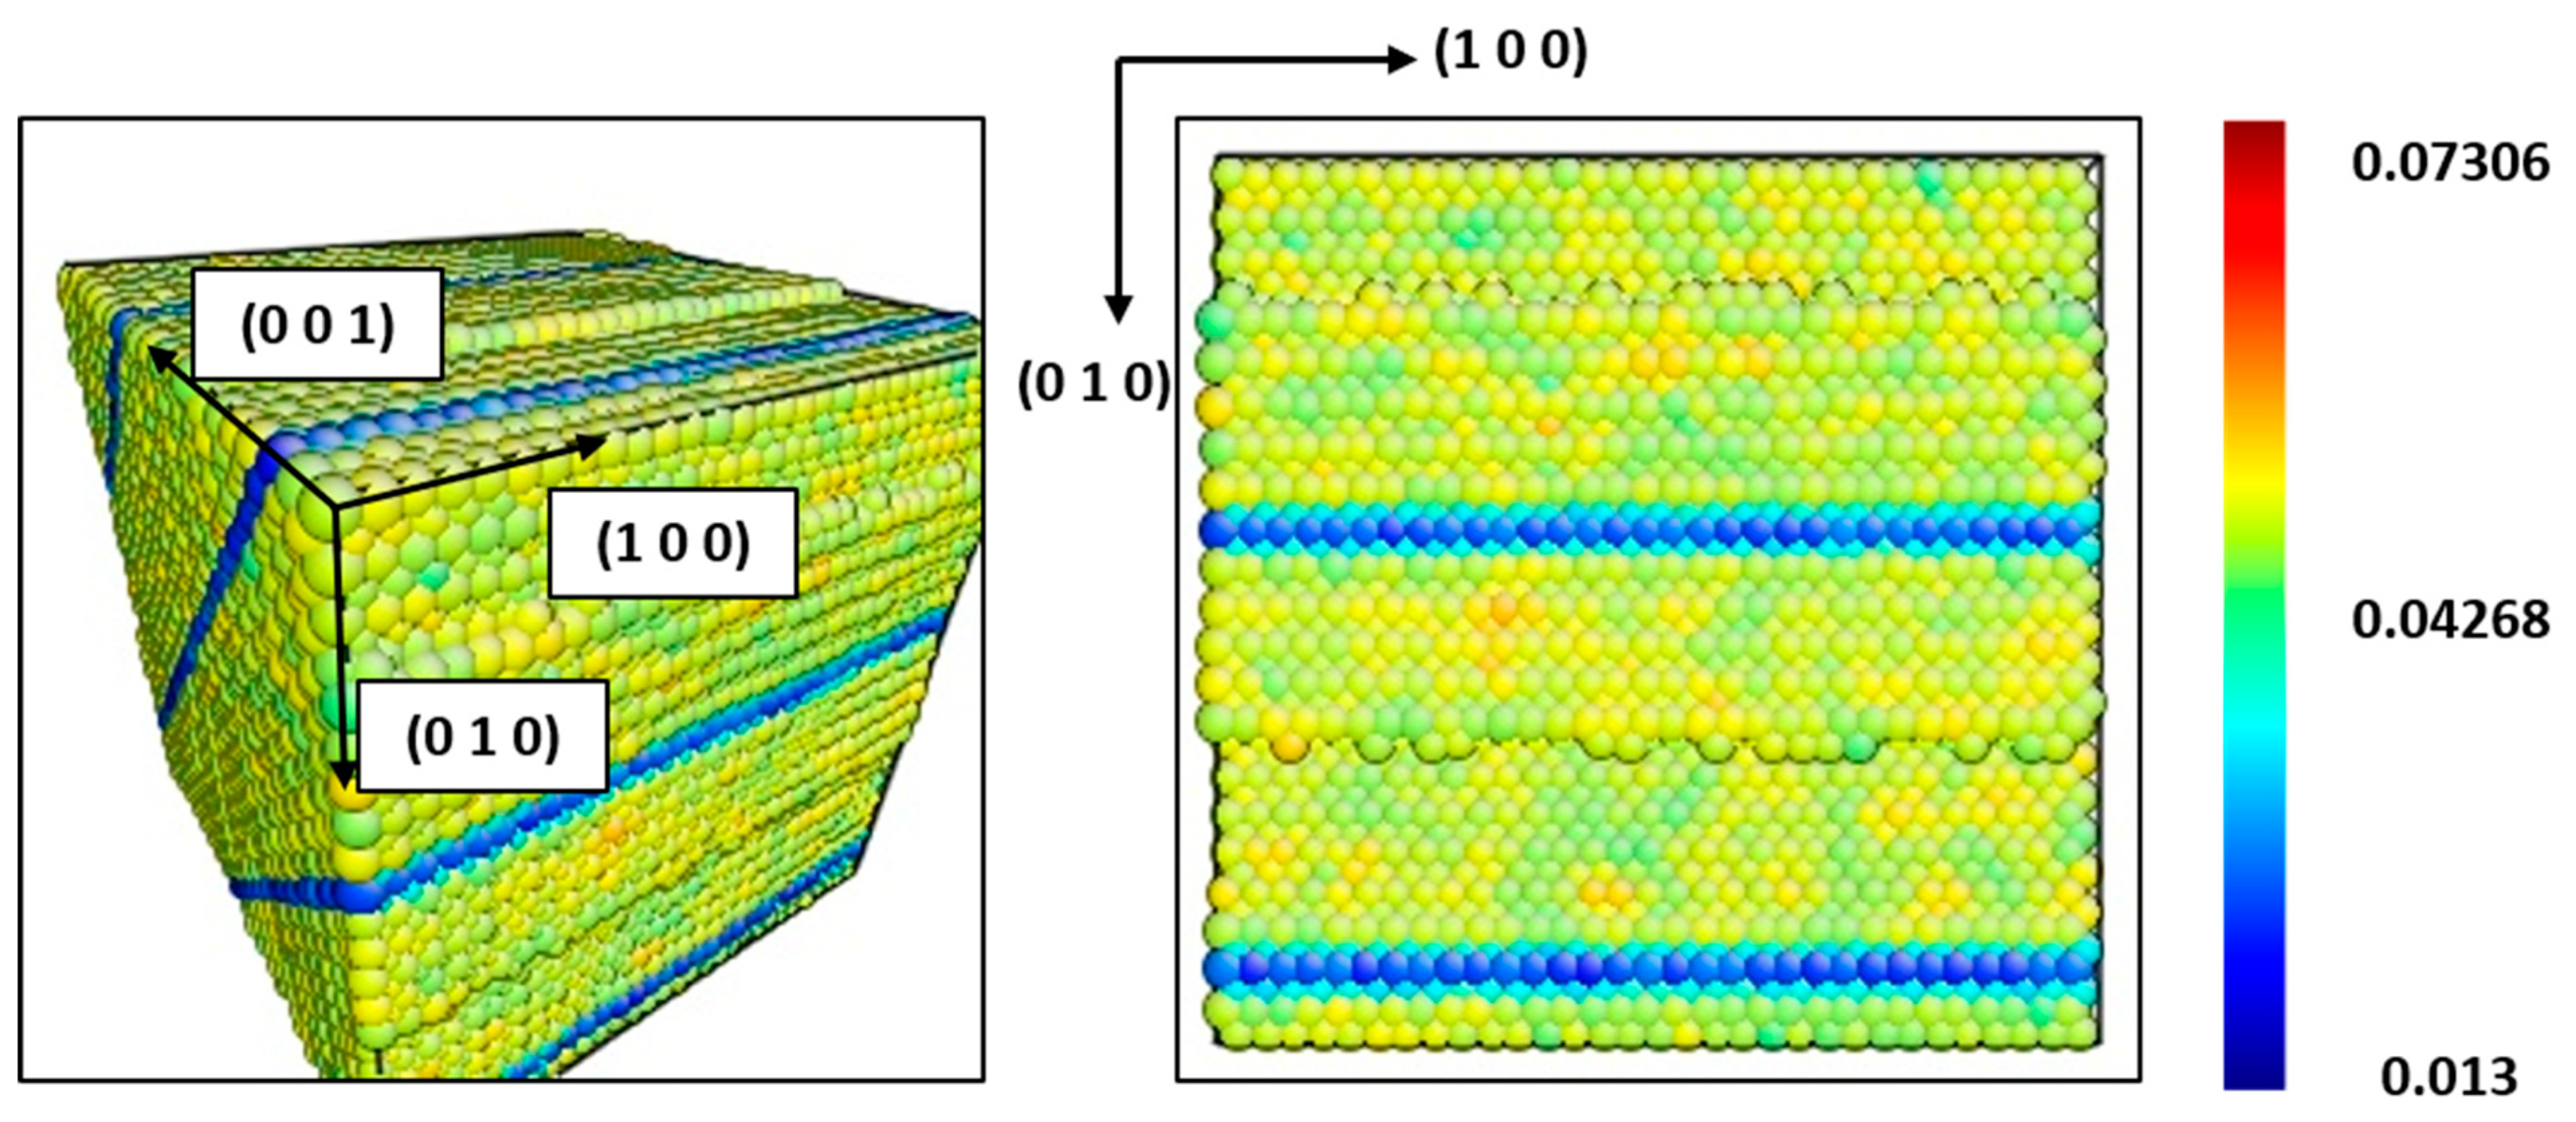
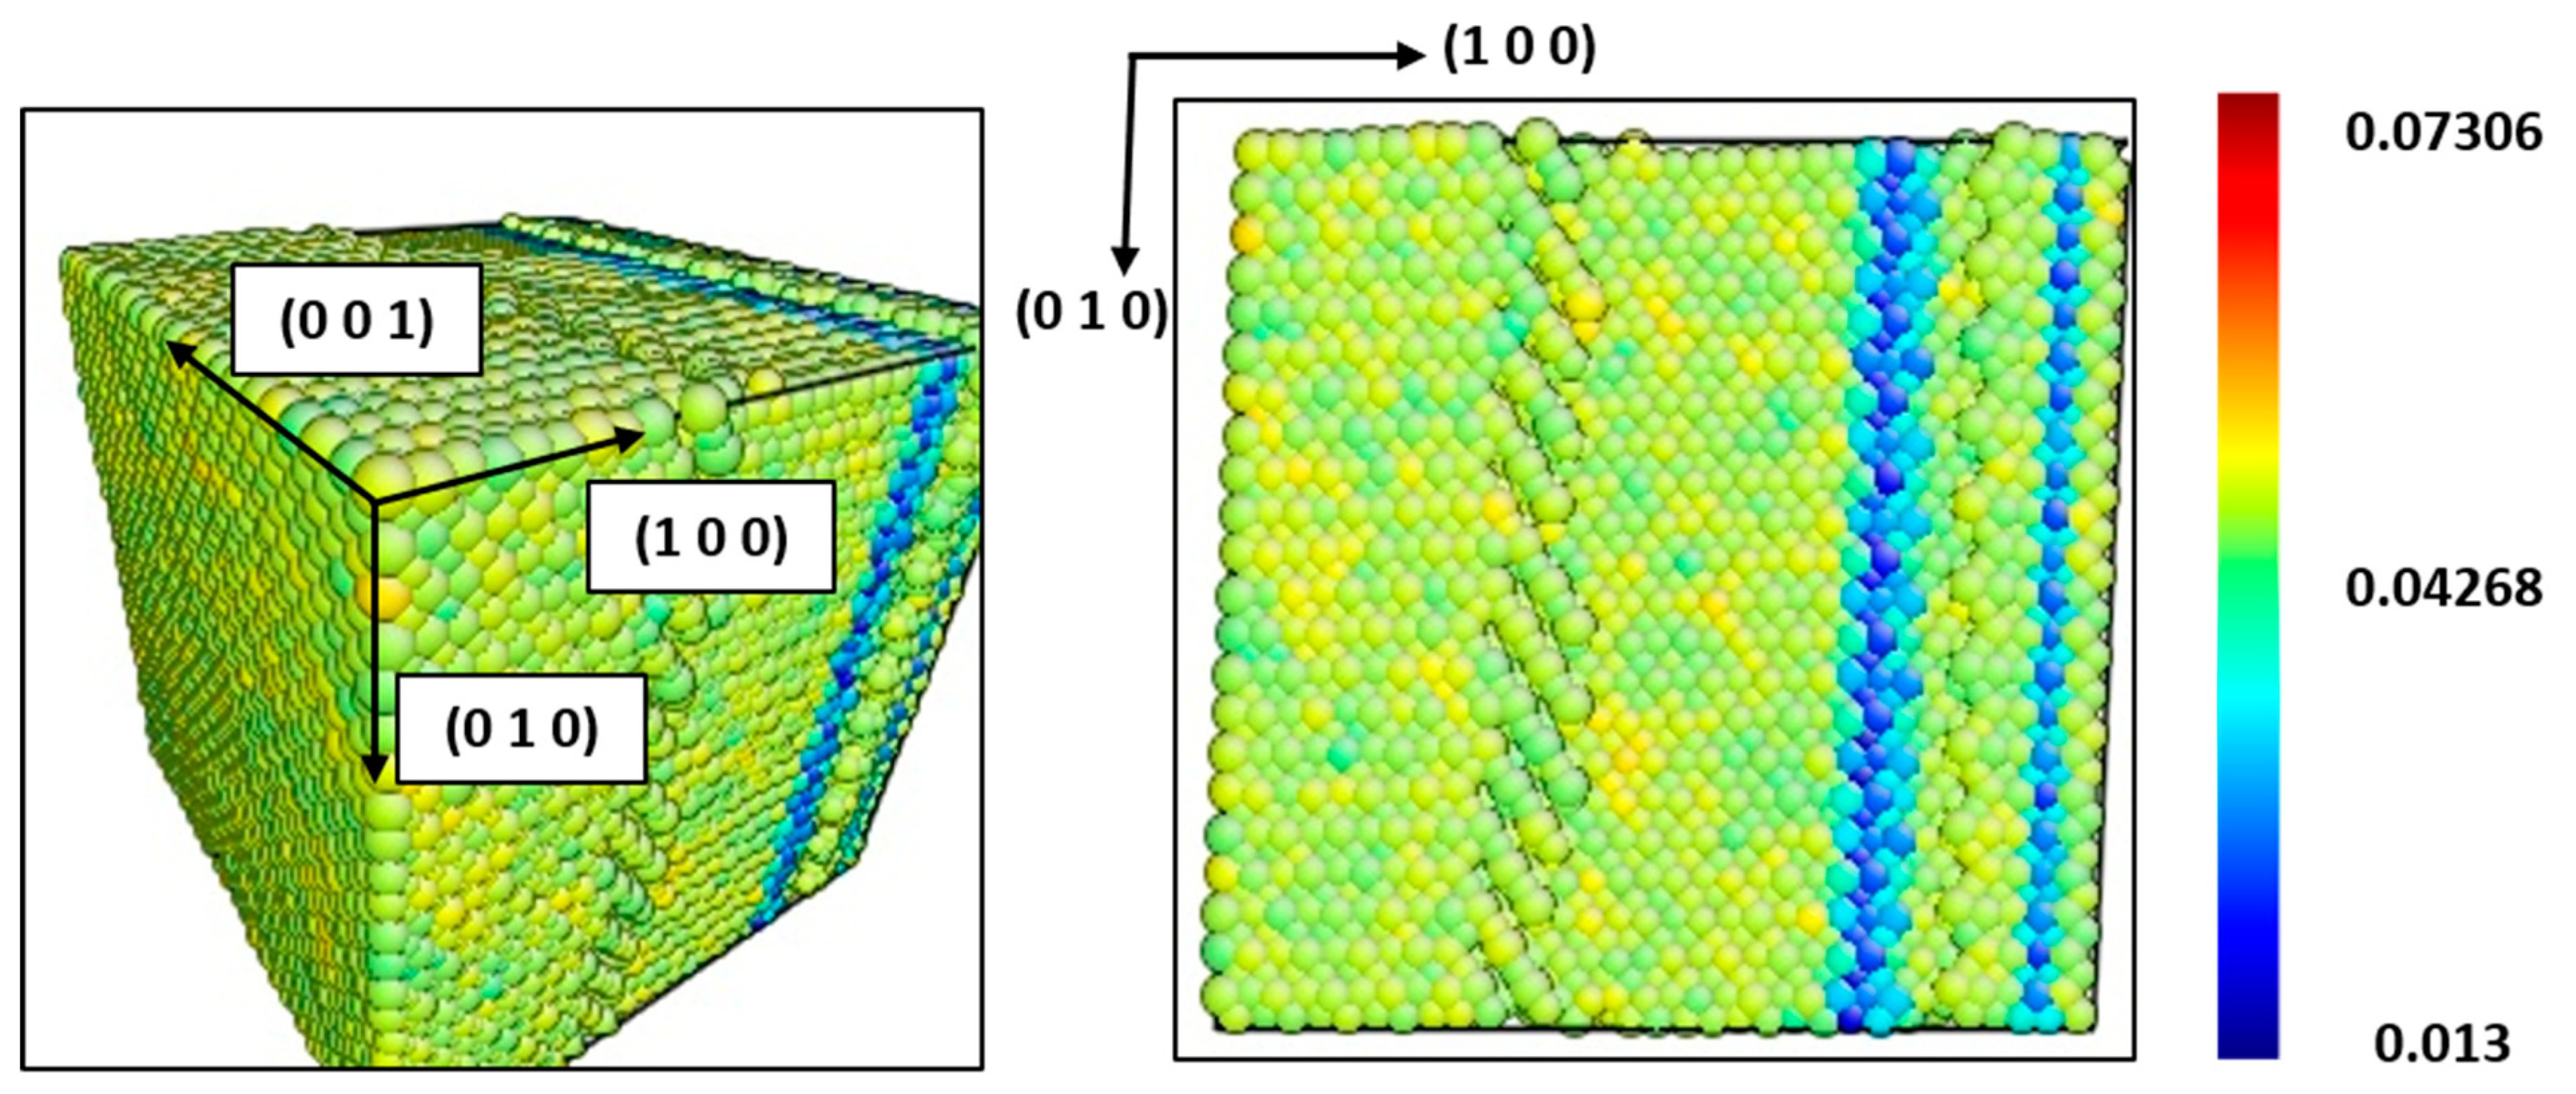
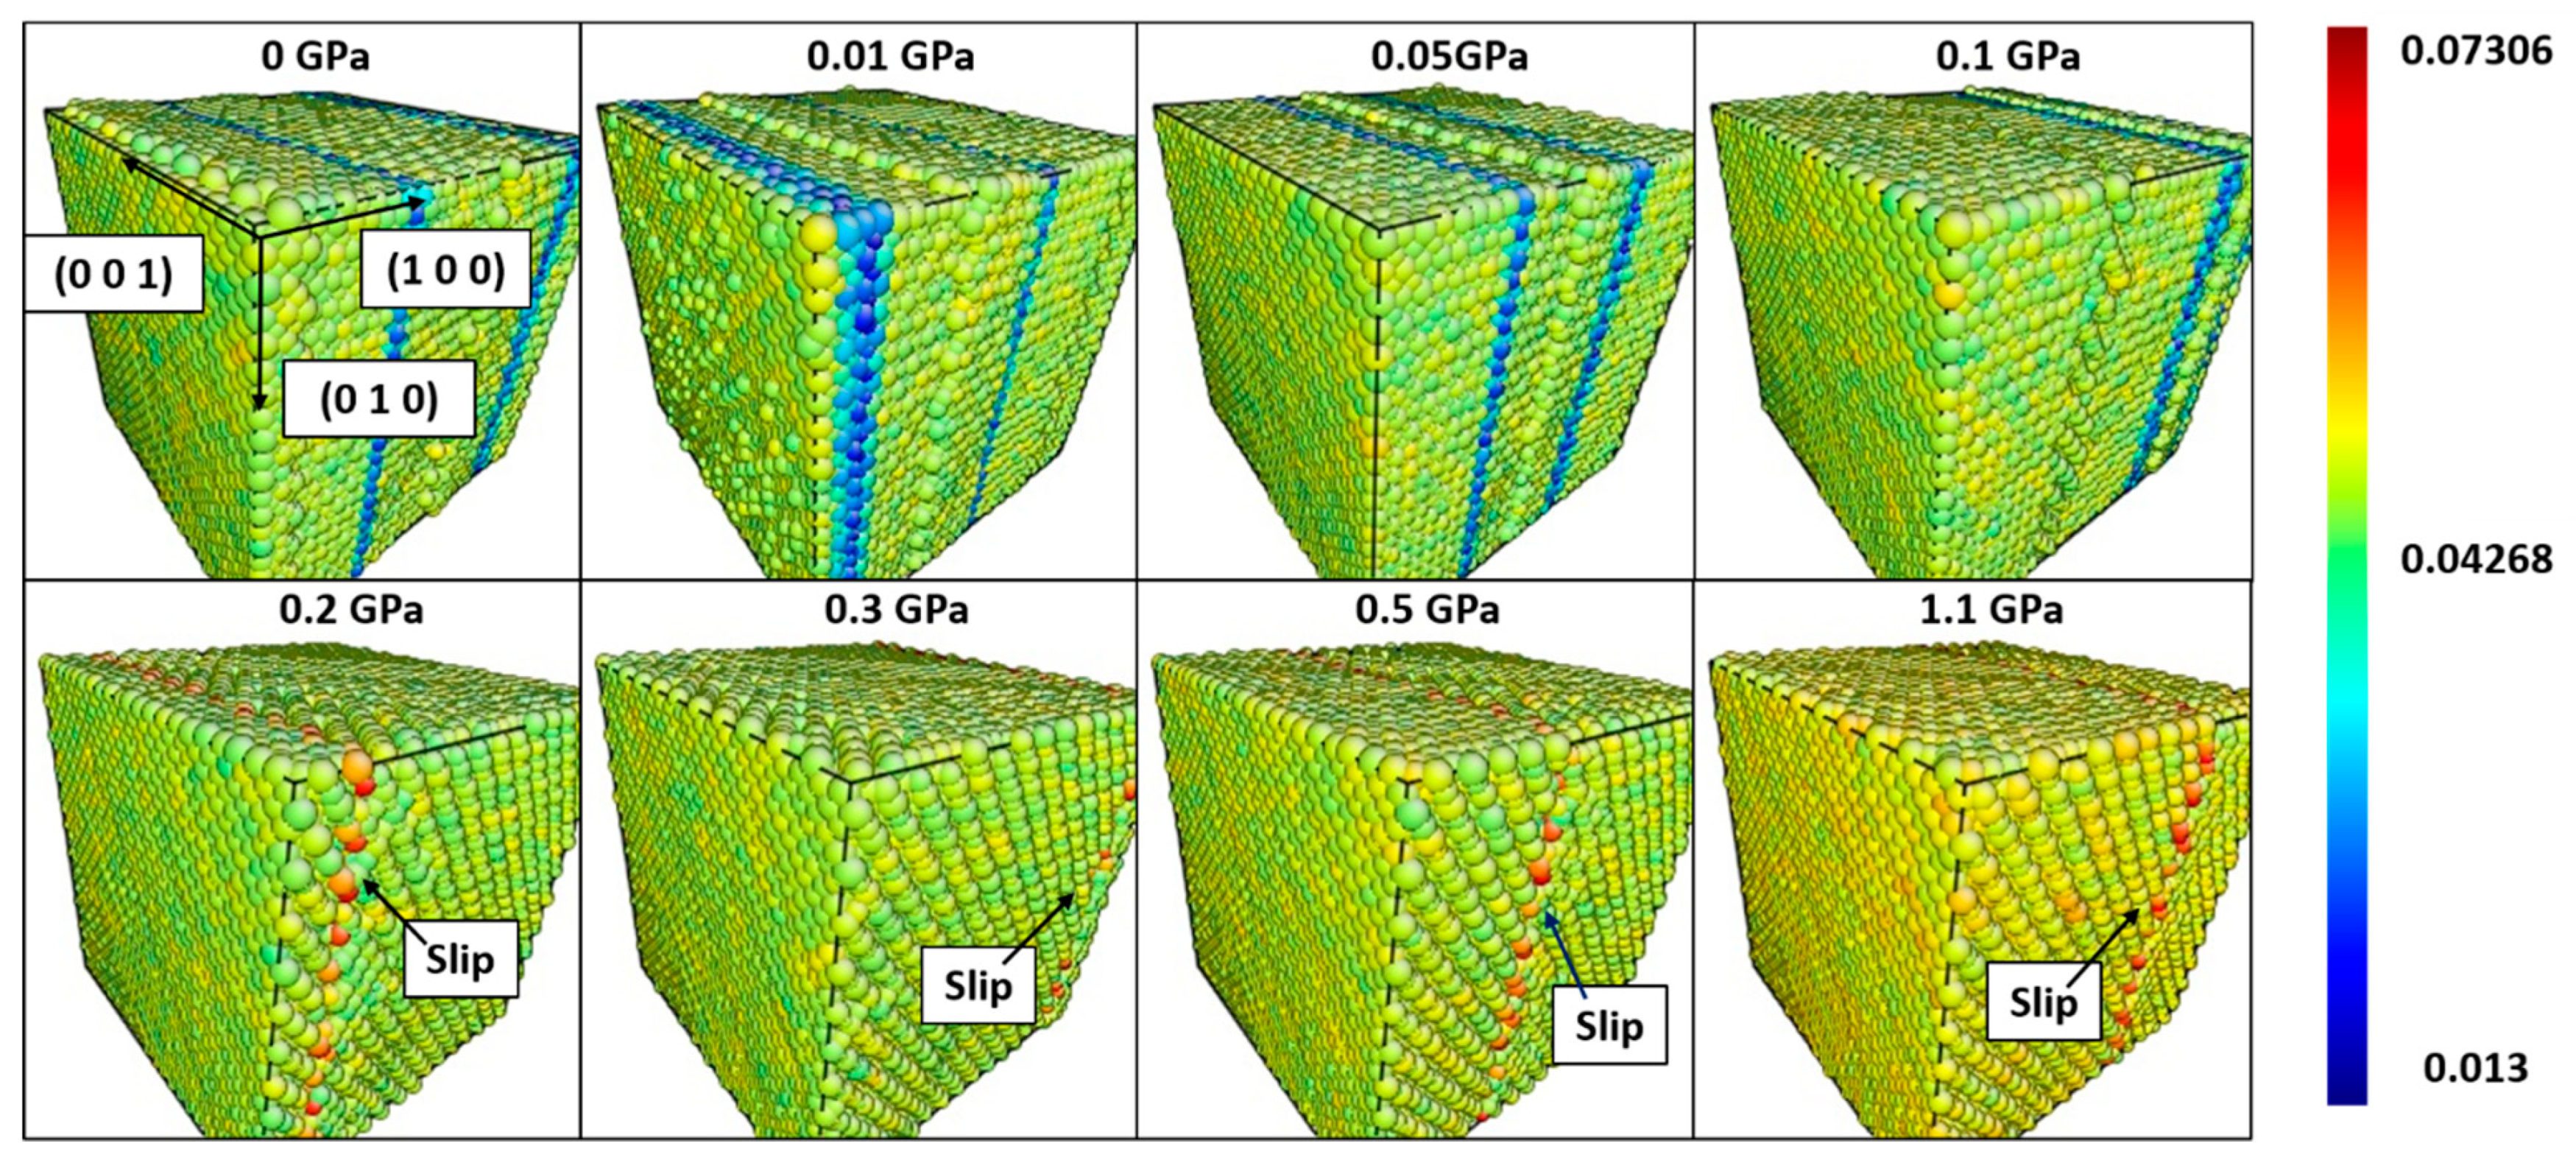
3.1.2. Martensite Twin Formation

Different trends of phase transformation temperatures should be explained by the atomic structure of martensite. Figure 5 and Figure 6 show the atomic structures colored by local von Mises shear strain invariant [33] at 10 K from two simulation groups with applied stresses of 0.1 GPa for both. Martensite twins were observed from both cases, but their orientations were different. The orientation of the twin was expressed in the form of (h k l) [a b c], indicating the (h k l) shear plane along with the [a b c] direction. Orientations were (0 1 1) (1 0 0) and (1 0 0) [11] for normal stress (hydrostatic pressure) case and normal + shear stress case, respectively. Martensite twin of (0 1 1) was reported as type II twinning mode [34], which was dominantly observed in experiments [35,36]. These results show the effect of shear stress on the simulation domain, which not only increased phase transformation temperatures but also achieved a realistic form of the martensite twin (1 0 0) (0 1 1).
Simulation domains at 10 K under different normal + shear stresses are shown in Figure 7. Additional stress cases of 0.2 GPa and 0.3 GPa are also shown in Figure 7. It should be noted that martensite twins were not formed when large external stresses (equal to or greater than 0.2 GPa) were applied. The formation of the martensite twin was suppressed, and the slip was observed instead. Similarly, phase transformation between martensite and austenite was suppressed with large external stresses as shown in Figure 3. It is the known characteristics of NiTi that detwinning and slip occur beyond the critical stress [37]. Therefore, it is important to compare simulation results with experimental cases to validate whether this simulation study predicted a realistic critical stress value. Stress-induced martensite starts forming under a certain amount of stress (critical stress), as indicated by plateau lines in stress–strain plots. Andani and Elahinia [38] experimentally showed critical stress values of 0.13–0.25 GPa when both tensional and torsional stresses were applied at the same time with axial and shear strain rates proportional to each other. This experiment result can be compared with simulation cases when external stresses were applied in both normal and shear directions. According to observed slips in simulation domains as shown in Figure 7, the critical stress predicted was 0.1–0.2 GPa, which indicates simulations captured the realistic phenomena of bulk NiTi structure.

3.1.3. Comparison with Experiments

Table 1 shows phase transformation temperatures from simulation cases with different external stresses in both normal and shear directions. Experimental data [16] and simulation results from other MD studies [39,40] are also included for comparison. It should be noticed that calculated phase transformation temperatures from MD simulations were lower (~40 K) with external stress of 0–0.01 GPa. As external stress increased to 0.05–0.1 GPa, simulation results agreed well with experimental data showing the A f discrepancy decreased from 45.4 K to 4.6 K and 11.5 K for 0.05 GPa and 0.1 GPa cases, respectively. These results indicate two things: a) phase transformation temperatures were affected by external stress in normal and shear directions, and b) more realistic properties, bulk material properties in this case, required external stresses in MD simulations for precise prediction. Bulk material always contains internal stress caused by microstructural features such as point defects, concentration fluctuations, line defects, phase boundaries, and grain boundaries that are known to play important roles in transformation characteristics [19]. Then, the question is what is the typical amount of internal stress in bulk Nitinol that exhibits shape-memory ability. Residual stresses obtained from X-ray diffraction studies showed 0.06–0.13 GPa [41] and 0.1–0.2 GPa [42] from bulk NiTi alloys in the form of 1mm plates. The amount of stress observed in experiments agreed well with applied stresses in simulations when predicted phase transformation temperatures matched well with experimental data. Therefore, it can be concluded that applying the realistic stress leads to the correct prediction of bulk characteristics of Nitinol: (a) formation of martensite twins and (b) more accurate prediction of phase transformation temperatures.
Phase transformation temperatures of Ni-rich NiTi with different Ni contents were simulated and compared with experimental data [16], as shown in Figure 8. Simulation domains were under normal + shear stresses of 0 GPa, 0.05 GPa, and 0.1 GPa. For bulk Ni-rich NiTi alloys, phase transformation temperatures are not only affected by Ni contents but also by a post-aging heat treatment that produces precipitates within the NiTi matrix [43]. Therefore, experimental data of NiTi alloys without post-aging heat treatment were selected for comparison to exclude any effects from precipitates. Phase transformation temperatures from Ni-rich NiTi simulation cases agreed well with experimental data with applied stresses of 0.05 GPa and 0.1 GPa. Results again verified that external stress on simulation is necessary to predict the realistic physical properties of bulk NiTi material.

3.2. Elastic Properties

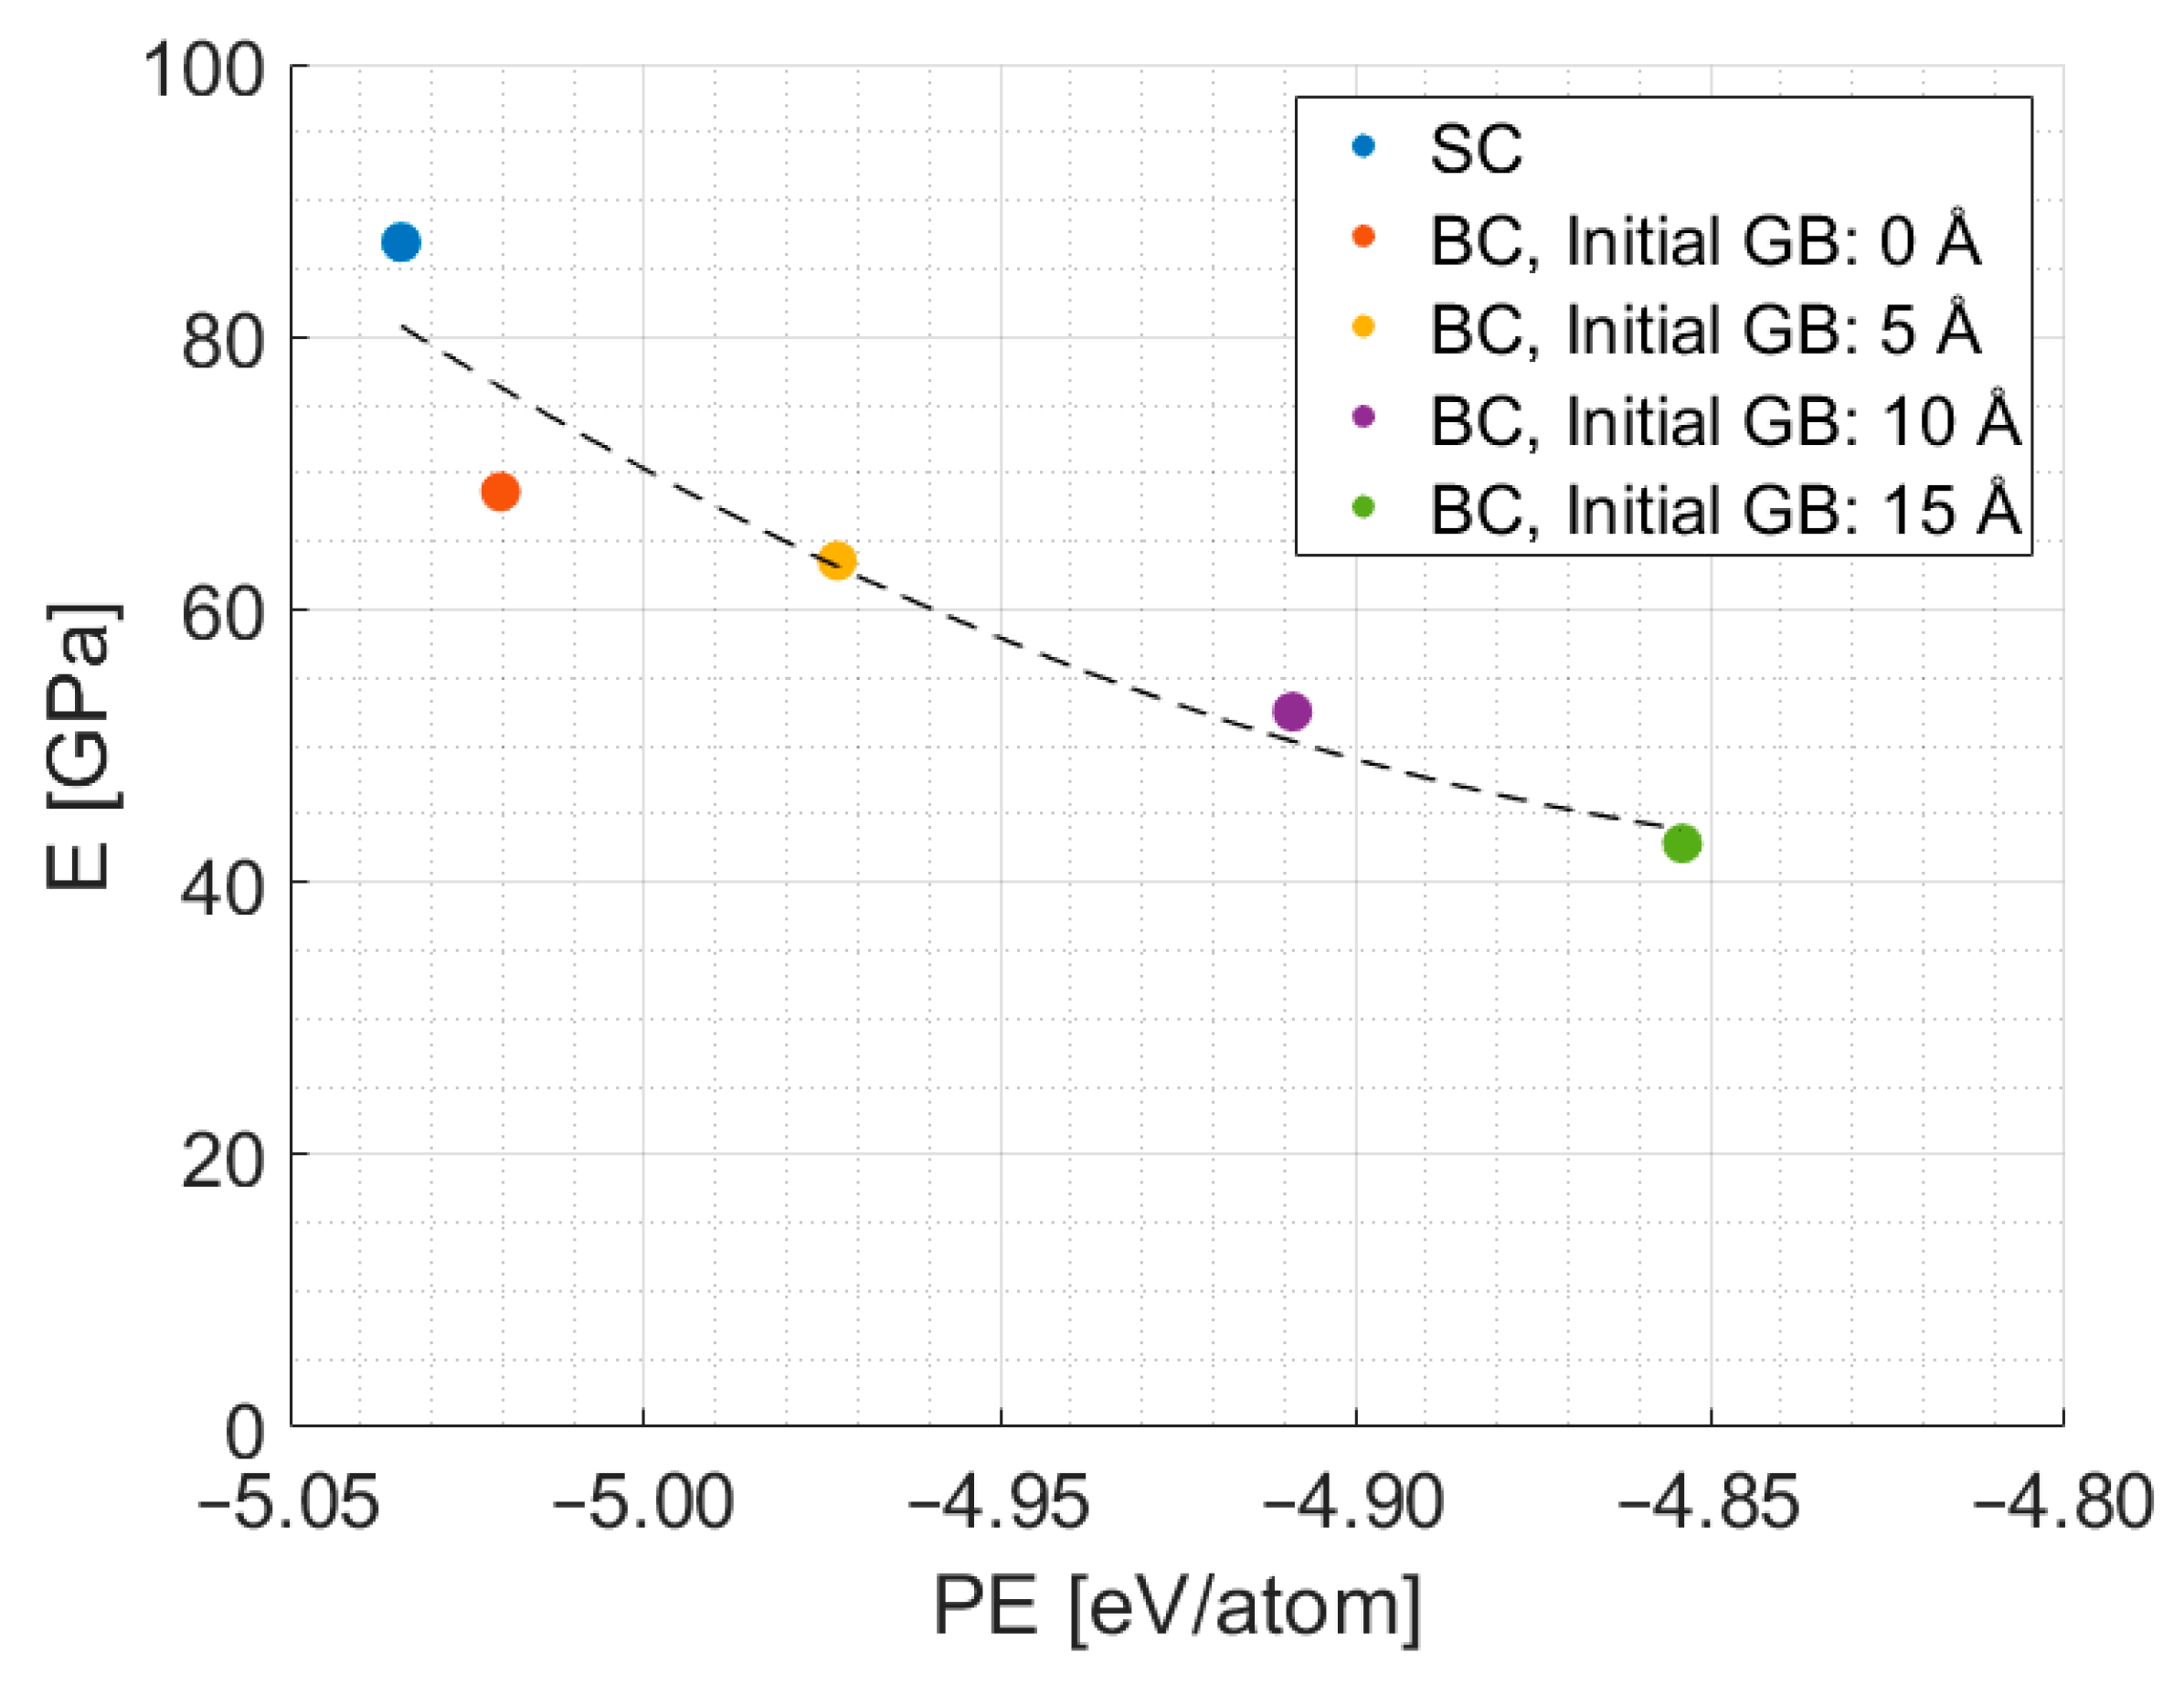
3.2.1. Elastic Modulus Results

Elastic constants of martensite structure were calculated from two different simulation cases: single crystalline (SC) and bi-crystalline (BC) with an initial grain boundary thickness of 0 Å. Equi-atomic NiTi structures were used in simulations at 200 K, when entire structures exist as martensite. The elastic constants obtained from MD, experiments, and ab initio simulations are shown in Table 2. Two ab initio calculations, Abinit and VASP, were conducted on the super-cell containing (1 0 0) twins using the linear response function (RF) method and ground state (GS) calculations, respectively [44]. All constants from BC cases were smaller than those of SC cases such that BC simulations predicted C44, C55, and C66 values as small as 16–28 GPa while SC and ab initio results showed larger values of 35–55 GPa and 21–90 GPa, respectively. The importance of C55 on the elastic modulus of B19′ was discussed by Šittner et al. [14], indicating that C55 has a large impact on the martensite elastic modulus of B19′ in tension. Similar to C55, C44 and C66 also affect the shear characteristics of the structure. Therefore, it can be stated that BC structure with grain boundary is overall softer and especially softer in shear deformation.
Elastic properties B, G, and E were calculated from elastic constants as shown in Table 3. BC simulation cases yielded lower elastic modulus (49–59 GPa) compared with the SC case (86 GPa) and ab initio (119–137 GPa), and are closer to experimentally observed values of 20–40 GPa [6]. However, it is still debatable whether BC simulation results are truly predicting bulk polycrystalline properties. For martensite NiTi, elastic modulus can be measured differently by different techniques: static loading/unloading [6], dynamic impulse excitation of vibration [45], and in situ synchrotron X-ray diffraction [14]. While the static method yielded low measured elastic modulus in the range of 20–40 GPa [6], the measured values by the dynamic method and the X-ray diffraction method were much higher at 55–70 GPa [45] and 120 GPa [14], respectively. BC simulation results agreed well with results from the dynamic method; however, this study aims to predict static bulk properties of NiTi. Moreover, it was reported that the dynamic method cannot depict stress history [46], which cannot be ignored easily in shape-memory applications.
In addition to the disorientation of adjacent grains, grain boundary also affects the elastic modulus of the simulation domain. The BC simulation domains with different initial grain boundary thicknesses are shown in Figure 9. Atoms are colored by their potential energy, and it can be observed that the grain boundary region is composed of atoms with lower potential energy. The averaged potential energy distributions of Ni and Ti atoms across grain boundaries for different simulation cases are shown in Figure 10. The potential energy distribution of the SC case was also plotted for comparison. Grain boundaries consisting of atoms with lower potential energy were observed between two grains. It should be noted that Ni atoms in non-boundary regions of the BC domains showed lower potential energy compared with the SC case, while Ti atoms in both BC and SC domains showed similar potential energy.
The calculated elastic modulus from simulation domains is shown in Figure 11. The average potential energy of atoms was calculated to represent each simulation domain. Due to atoms with lower potential energies in grain boundary regions, as shown in Figure 9 and Figure 10, BC simulation domains showed lower potential energy compared with the SC simulation domain. Moreover, the increased grain boundary thickness in BC cases led to even lower potential energy and elastic modulus. The trend line in Figure 11 shows the relationship between potential energy and elastic modulus. Elastic modulus decreased to 42.8 GPa as the potential energy of the simulation domain increased to−4.854 eV/atom, following the second-order polynomial trend curve. According to the result, experimentally observed elastic modulus of 20–40 GPa [6] is expected to be achieved with a large simulation domain consisting of many grains and grain boundaries. While it is difficult to simulate such a large simulation domain due to the required prohibitive computational cost at present, this study clearly shows the way of predicting the characteristics of polycrystalline NiTi.

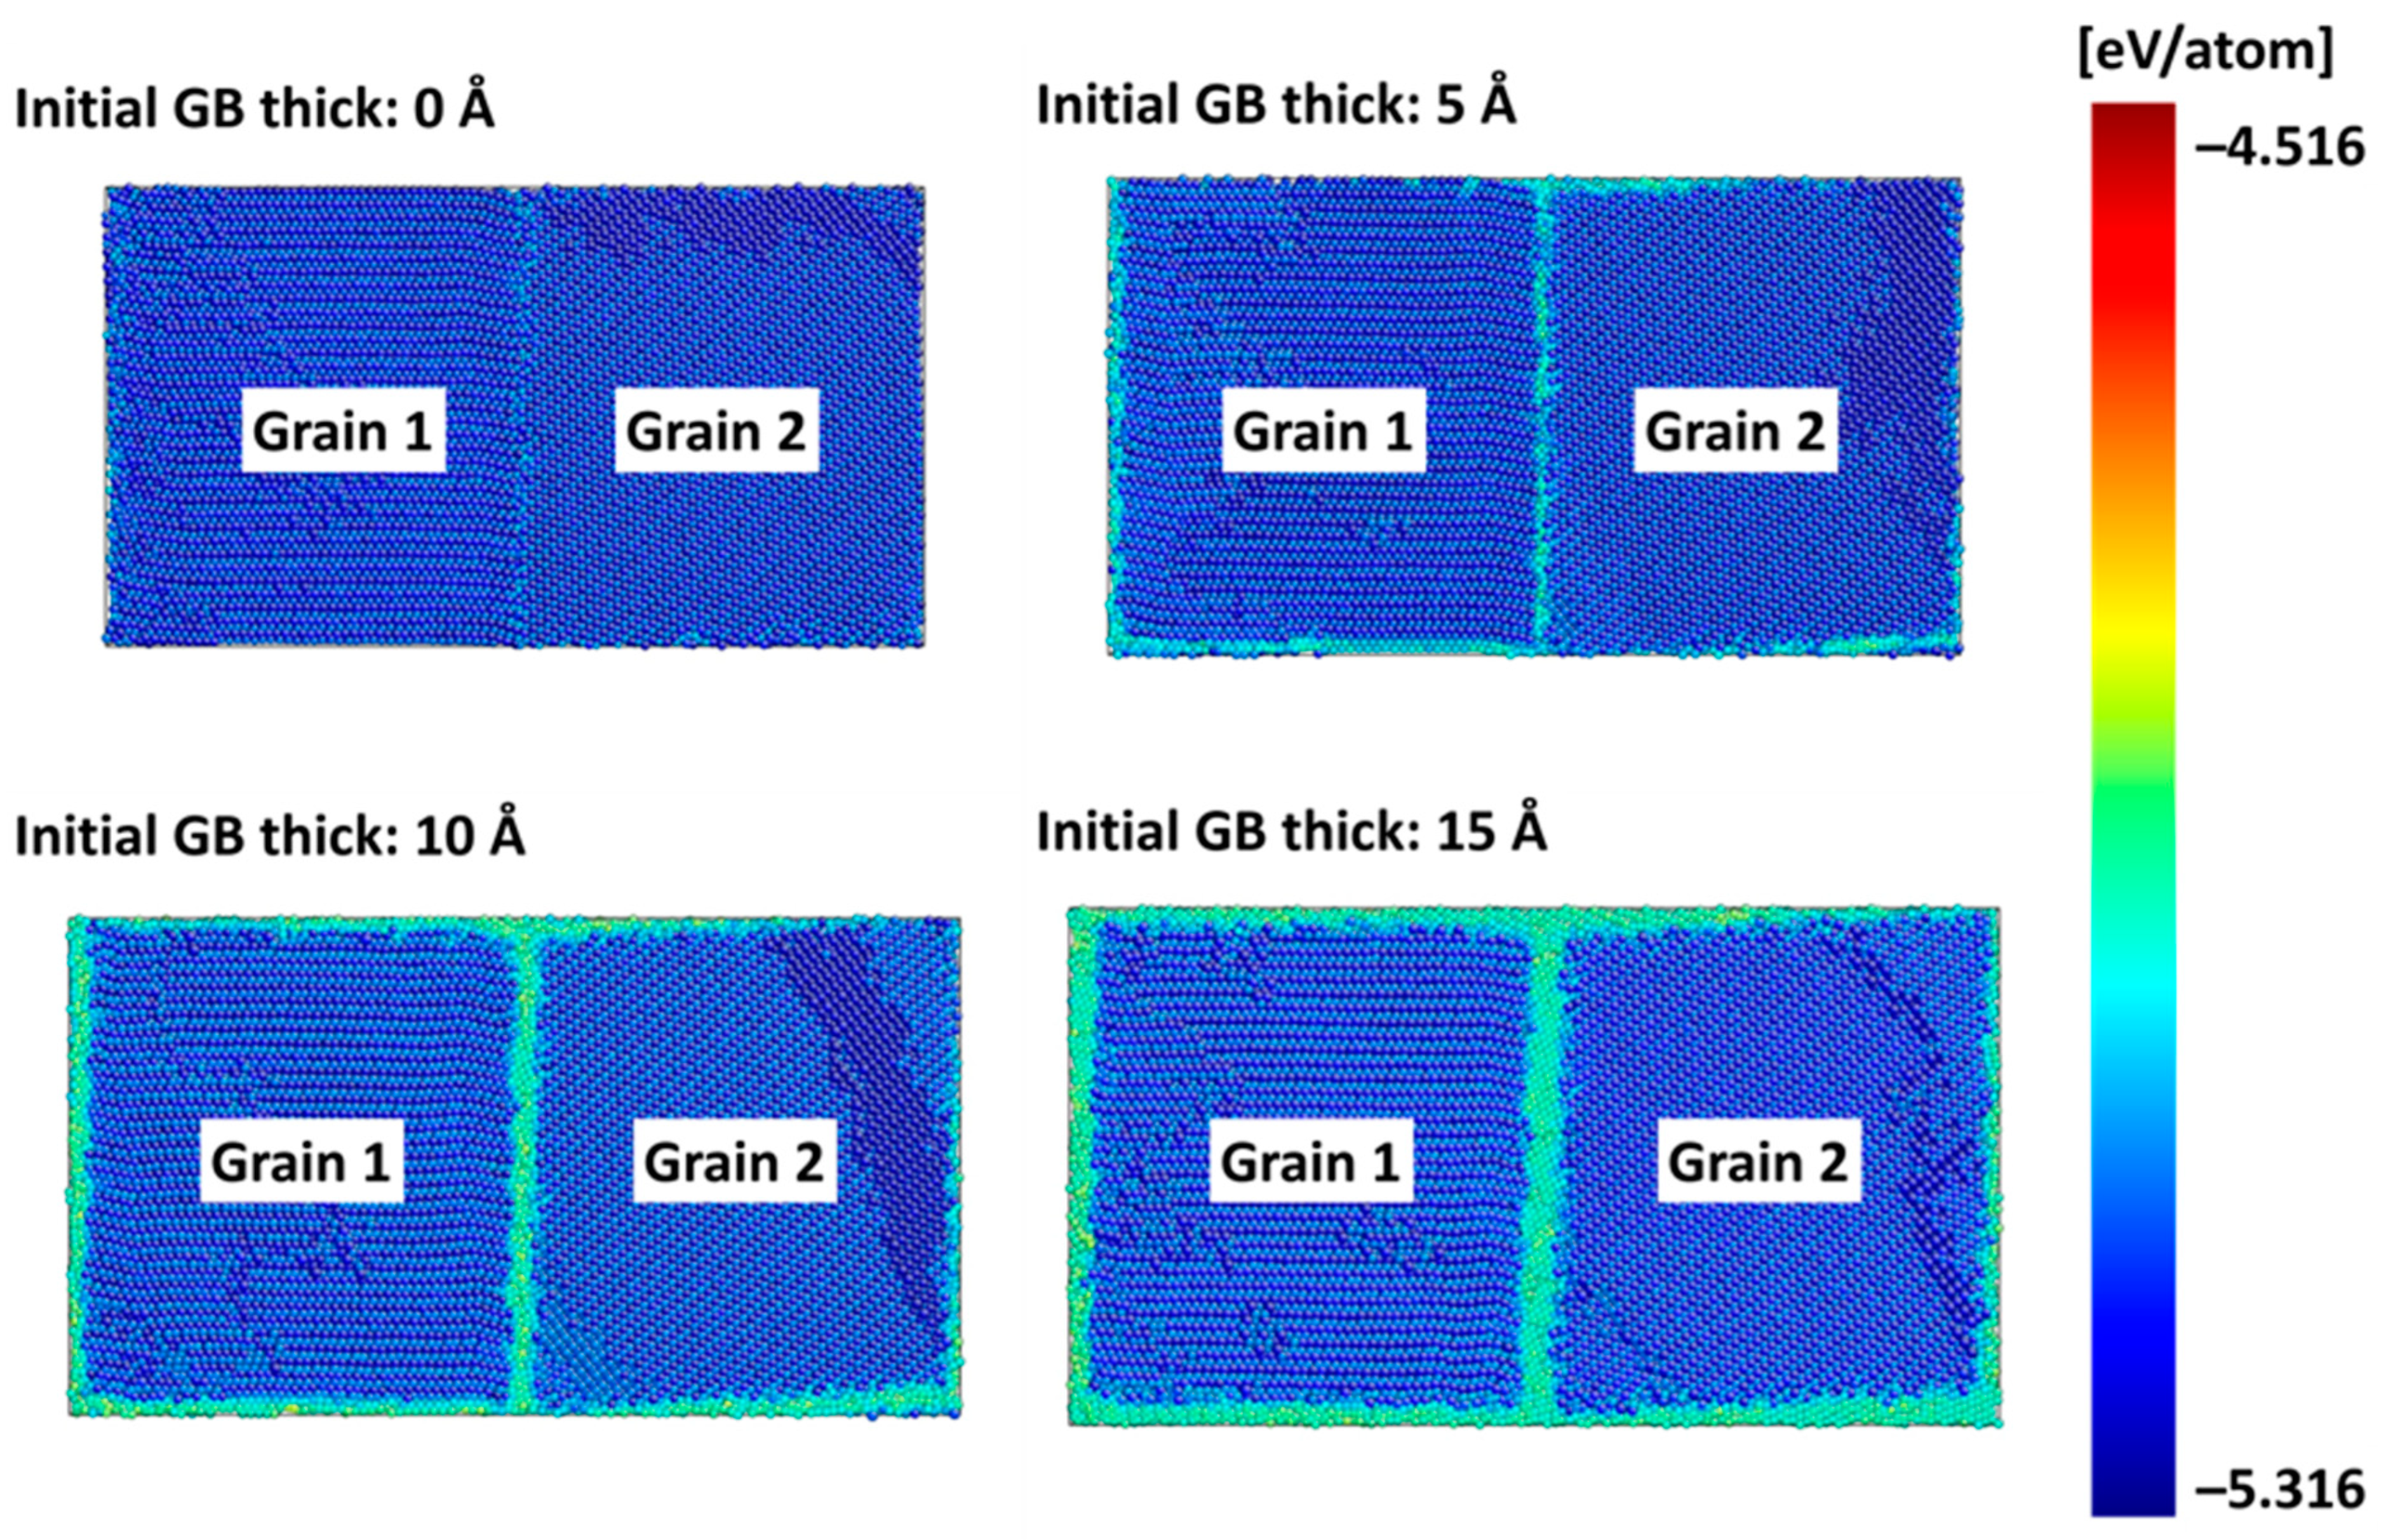
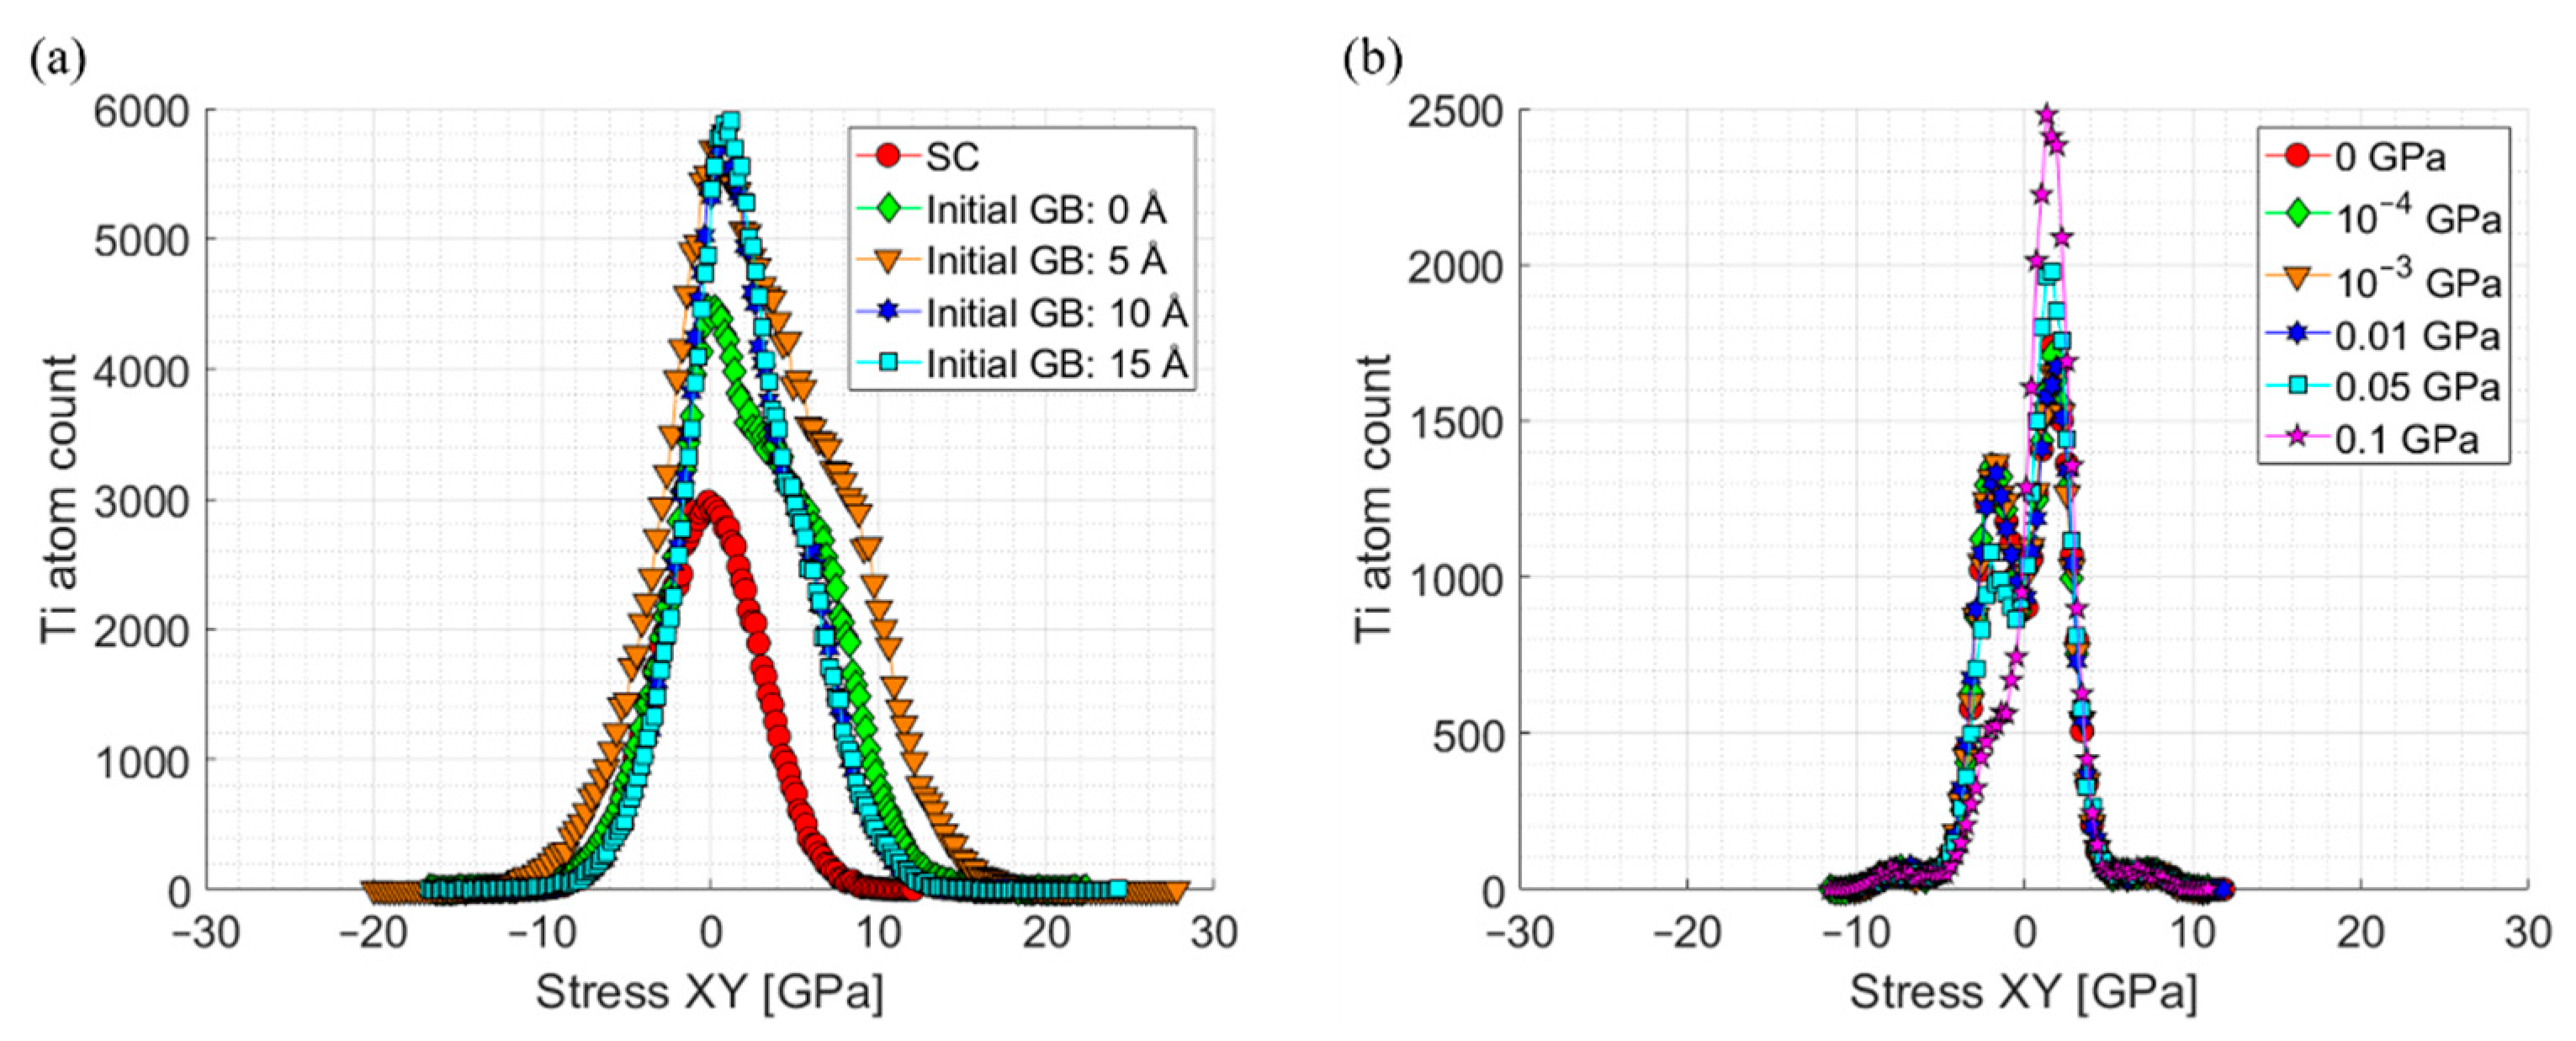
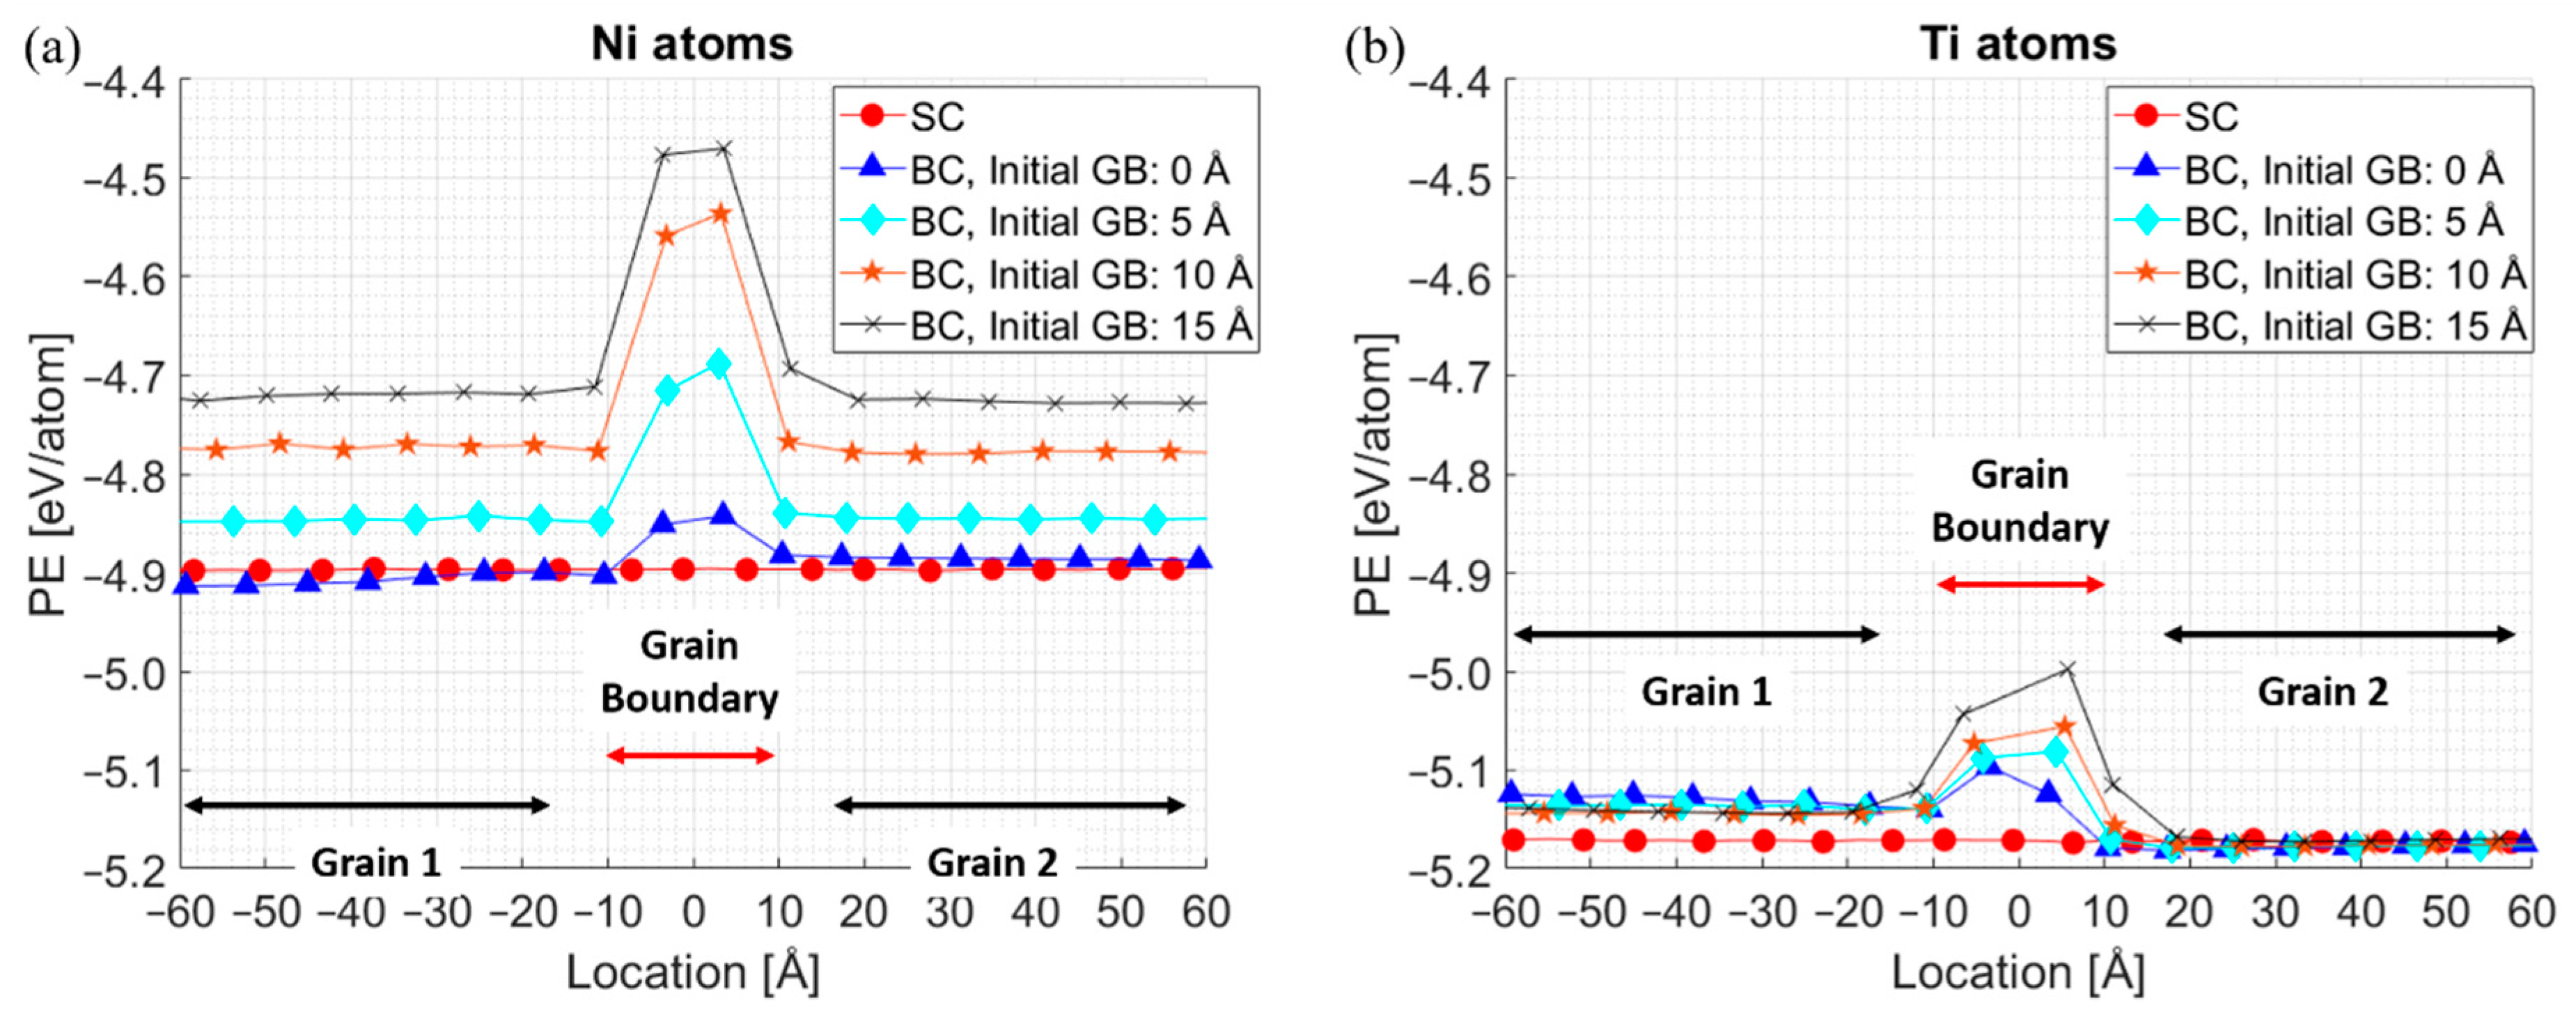
3.2.2. Atomic Stress Distribution in the Simulation Domain

The above results showed that realistic predictions of bulk polycrystalline properties (phase transformation temperatures and elastic modulus) were achieved by either applying increased external stress (up to 0.1 GPa) on the simulation domain or by constructing grain disorientations and grain boundaries. Although the two methods seem completely separate from each other, both methods changed atomic stress distributions in simulation domains, especially in the shear direction. Ti atoms with different stress XY values from both simulation domains (elastic modulus and phase transformation temperature simulation cases) were plotted in the form of a histogram, as shown in Figure 12. It should be noted that more Ti atoms with positive stress XY were observed from both simulation domains that predicted more realistic bulk polycrystalline properties: initial GB above 10 Å in Figure 12a and applied external stress of 0.1 GPa in Figure 12b. In addition, those cases showed very similar XY stress distribution of Ti atoms. The similarity can also be checked by comparing the average shear stress XY applied on simulation domains. Stress XY was 0.26 GPa and 0.32 GPa from elastic modulus simulation domains with an initial grain boundary thickness of 10 Å and 15 Å, respectively. The values are close to 0.1 GPa, which was applied as external stress on the phase transformation temperature simulation domain. The results indicate that the polycrystalline structure properties can be predicted by applying proper stress boundary conditions, especially in the XY direction. Therefore, it can be concluded that such different atomic stress distributions are the major difference between single crystalline and bulk polycrystalline structures.

4. Conclusions

This work presented an MD study using an FS potential to predict bulk properties of polycrystalline NiTi: phase transformation temperatures and elastic modulus. Thermally induced phase transformation between martensite and austenite was more accurately simulated with external stress in both normal and shear directions. With applied stress of 0.05–0.1 GPa, which agreed well with experimentally observed internal stress, the type II martensite twins (1 0 0) (0 1 1) were formed as observed from experiments. Simulation domains with applied stress boundary conditions predicted experimentally reported phase transformation temperatures of bulk polycrystalline NiTi with various Ni contents. While other simulation studies predicted the maximum A f discrepancy of 45 K or above, it was reduced to less than 12 K in this study. Such results are important since phase transformation temperatures are very sensitive to the components, and the difference of ~50 K is equivalent to 0.5% of compositional difference [47]. Considering that a very small difference in Ni content has a large effect on precipitate formation and mechanical properties [43], the precise prediction of phase transformation temperatures is critical.
Elastic characteristics of NiTi were studied with single crystalline and bi-crystalline simulation domains with different grain structures: experimentally reported grain disorientations and grain boundaries thicknesses. The existence of grain boundaries showed the major effect on softening C55 and C66. Moreover, the potential energy of simulation domains was lowered with the existence of grain disorientations and grain boundaries. While single crystalline simulation predicted martensite elastic modulus to be too high (87 GPa), lower elastic modulus (as low as 43 GPa) was observed from BC cases, which was close to the experimentally observed 20–40 GPa. [6]
The precise prediction of elastic modulus is necessary in designing mechanical properties of NiTi. The relationship between potential energy and elastic modulus clearly showed that a realistic prediction of polycrystalline NiTi martensite properties can be achieved with proper simulation domains.
Similarities in atomic stress distribution were observed from two different simulation domains that predicted realistic bulk polycrystalline properties: single crystalline with pressure boundary conditions and bi-crystalline with grain disorientations and grain boundaries. Results showed that the major difference between single crystalline and polycrystalline structures is atomic stress distribution, which is necessary for prediction of realistic material properties.
In summary, this paper provides a way of predicting realistic polycrystalline NiTi properties by using bi-crystalline MD. The new knowledge this work provides includes the proper amount of stresses to be applied to the MD simulation to correctly predict phase transformation temperatures, and how considering the boundary conditions can improve the prediction of elastic modulus. While properties of NiTi are well known, it is also well known they are sensitive to the Ni content and grain structure. Being able to predict such effects would be beneficial to the future design and applications of NiTi. This work provides a way of correctly predicting both phase transformation temperatures and elastic properties with the different Ni and Ti compositions.

Author Contributions

J.L.: conceptualization, methodology, software, validation, formal analysis, data curation and writing—original draft preparation; Y.C.S.: conceptualization, resources, writing—review and editing, supervision, project administration. All authors have read and agreed to the published version of the manuscript.

Funding

This research received no external funding.

Data Availability Statement

Data is not available because it is a part of on-going study.

Conflicts of Interest

The authors declare no conflict of interest.

References

  1. Yamauchi, K.; Ohkata, I.; Tsuchiya, K.; Miyazaki, S. Shape Memory and Superelastic Alloys: Applications and Technologies; Elsevier: Amsterdam, The Netherlands, 2011. [Google Scholar]
  2. Ko, W.; Grabowski, B.; Neugebauer, J. Development and application of a Ni-Ti interatomic potential with high predictive accuracy of the martensitic phase transition. Phys. Rev. B 2015, 92, 134107. [Google Scholar] [CrossRef] [Green Version]
  3. Zhong, Y.; Gall, K.; Zhu, T. Atomistic study of nanotwins in NiTi shape memory alloys. J. Appl. Phys. 2011, 110, 033532. [Google Scholar] [CrossRef] [Green Version]
  4. Mutter, D.; Nielaba, P. Simulation of structural phase transitions in NiTi. Phys. Rev. B 2010, 82, 224201. [Google Scholar] [CrossRef] [Green Version]
  5. Hill, R. The elastic behaviour of a crystalline aggregate. Proc. Phys. Soc. Sect. A 1952, 65, 349. [Google Scholar] [CrossRef]
  6. Bidaux, J.E.; Bataillard, L.; Månson, J.A.; Gotthardt, R. Phase transformation behavior of thin shape memory alloy wires embedded in a polymer matrix composite. J. Phys. IV (Proc.) 1993, 3, 561–564. [Google Scholar] [CrossRef]
  7. Chowdhury, P.; Patriarca, L.; Ren, G.; Sehitoglu, H. Molecular dynamics modeling of NiTi superelasticity in presence of nanoprecipitates. Int. J. Plast. 2016, 81, 152–167. [Google Scholar] [CrossRef]
  8. Wang, J.; Sehitoglu, H. Martensite modulus dilemma in monoclinic NiTi-theory and experiments. Int. J. Plast. 2014, 61, 17–31. [Google Scholar] [CrossRef]
  9. Zhong, Y.; Gall, K.; Zhu, T. Atomistic characterization of pseudoelasticity and shape memory in NiTi nanopillars. Acta Mater. 2012, 60, 6301–6311. [Google Scholar] [CrossRef]
  10. Li, Y.; Zeng, X.; Wang, F. Investigation on the micro-mechanism of martensitic transformation in nano-polycrystalline NiTi shape memory alloys using molecular dynamics simulations. J. Alloys Compd. 2020, 821, 153509. [Google Scholar] [CrossRef]
  11. Wang, B.; Kang, G.; Wu, W.; Zhou, K.; Kan, Q.; Yu, C. Molecular dynamics simulations on nanocrystalline super-elastic NiTi shape memory alloy by addressing transformation ratchetting and its atomic mechanism. Int. J. Plast. 2020, 125, 374–394. [Google Scholar] [CrossRef]
  12. Zhang, Y.; Jiang, S.; Wang, M. Atomistic investigation on superelasticity of NiTi shape memory alloy with complex microstructures based on molecular dynamics simulation. Int. J. Plast. 2020, 125, 27–51. [Google Scholar] [CrossRef]
  13. Nie, K.; Li, M.-P.; Wu, W.-P.; Sun, Q.-P. Grain size-dependent energy partition in phase transition of NiTi shape memory alloys studied by molecular dynamics simulation. Int. J. Solids Struct. 2021, 221, 31–41. [Google Scholar] [CrossRef]
  14. Šittner, P.; Heller, L.; Pilch, J.; Curfs, C.; Alonso, T.; Favier, D. Young’s modulus of austenite and martensite phases in superelastic NiTi wires. J. Mater. Eng. Perform. 2014, 23, 2303–2314. [Google Scholar] [CrossRef]
  15. Yang, Z.; Wang, H.; Huang, Y.; Ye, X.; Li, J.; Zhang, C.; Li, H.; Pang, B.; Tian, Y.; Huang, C. Strain rate dependent mechanical response for monoclinic NiTi shape memory alloy: Micromechanical decomposition and model validation via neutron diffraction. Mater. Des. 2020, 191, 108656. [Google Scholar] [CrossRef]
  16. Frenzel, J.; George, E.; Dlouhy, A.; Somsen, C.; Wagner, M.; Eggeler, G. Influence of Ni on martensitic phase transformations in NiTi shape memory alloys. Acta Mater. 2010, 58, 3444–3458. [Google Scholar] [CrossRef]
  17. Bakhtiari, S.R.; Liu, J.Z.; Shariat, B.S.; Yang, H.; Liu, Y. Role of hydrostatic pressure on the phase stability, the ground state, and the transformation pathways of NiTi alloy. Scr. Mater. 2018, 151, 57–60. [Google Scholar] [CrossRef]
  18. Huang, X.; Ackland, G.; Rabe, K. Crystal structures and shape-memory behaviour of NiTi. Nat. Mater. 2003, 2, 307–311. [Google Scholar] [CrossRef]
  19. Wagner, M.; Windl, W. Lattice stability, elastic constants and macroscopic moduli of NiTi martensites from first principles. Acta Mater. 2008, 56, 6232–6245. [Google Scholar] [CrossRef]
  20. Pelton, A.R.; Huang, G.H.; Moine, P.; Sinclair, R. Effects of thermal cycling on microstructure and properties in Nitinol. Mater. Sci. Eng. A 2012, 532, 130–138. [Google Scholar] [CrossRef]
  21. Wang, B.; Kang, G.; Kan, Q.; Wu, W.; Zhou, K.; Yu, C. Atomistic study on the super-elasticity of nanocrystalline NiTi shape memory alloy subjected to a cyclic deformation. Comput. Mater. Sci. 2018, 152, 85–92. [Google Scholar] [CrossRef]
  22. Plimpton, S. Fast parallel algorithms for short-range molecular dynamics. J. Comput. Phys. 1995, 117, 1–19. [Google Scholar] [CrossRef] [Green Version]
  23. Kimizuka, H.; Kaburaki, H.; Kogure, Y. Molecular-dynamics study of the high-temperature elasticity of quartz above the alpha-beta phase transition. Phys. Rev. B 2003, 67, 024105. [Google Scholar] [CrossRef]
  24. Voigt, W. Lehrbuch der Kristallphysik:(mit Ausschluss der Kristalloptik); Teubner, B.G.: Leipzig, Germany, 1910. [Google Scholar]
  25. Reuß, A. Berechnung der fließgrenze von mischkristallen auf grund der plastizitätsbedingung für einkristalle. ZAMM Z. Angew. Math. Mech. 1929, 9, 49–58. [Google Scholar] [CrossRef]
  26. Giallonardo, J.D.; Erb, U.; Aust, K.T.; Palumbo, G. The influence of grain size and texture on the Young’s modulus of nanocrystalline nickel and nickel–iron alloys. Philos. Mag. 2011, 91, 4594–4605. [Google Scholar] [CrossRef]
  27. Yazdandoost, F.; Mirzaeifar, R. Tilt grain boundaries energy and structure in NiTi alloys. Comput. Mater. 2017, 131, 108–119. [Google Scholar] [CrossRef]
  28. Bowers, M.L.; Gao, Y.; Yang, L.; Gaydosh, D.J.; de Graef, M.; Noebe, R.D.; Wang, Y.; Mills, M.J. Austenite grain refinement during load-biased thermal cycling of a Ni49. 9Ti50. 1 shape memory alloy. Acta Mater. 2015, 91, 318–329. [Google Scholar] [CrossRef] [Green Version]
  29. Yin, H.; He, Y.; Moumni, Z.; Sun, Q. Effects of grain size on tensile fatigue life of nanostructured NiTi shape memory alloy. Int. J. Fatigue 2016, 88, 166–177. [Google Scholar] [CrossRef]
  30. Sun, Q.; Aslan, A.; Li, M.; Chen, M. Effects of grain size on phase transition behavior of nanocrystalline shape memory alloys. Sci. China Technol. Sci. 2014, 57, 671–679. [Google Scholar] [CrossRef]
  31. Ding, J.; Neffati, D.; Li, Q.; Su, R.; Li, J.; Xue, S.; Shang, Z.; Zhang, Y.; Wang, H.; Kulkarni, Y. Thick grain boundary induced strengthening in nanocrystalline Ni alloy. Nanoscale 2019, 11, 23449–23458. [Google Scholar] [CrossRef]
  32. Wan, J.L.; Chen, Z.B.; Qin, S.J.; Shang, J.-X. Effect of hydrostatic pressure on thermally induced phase transformation in NiTi alloy: A molecular dynamics study. Comput. Mater. Sci. 2018, 153, 119–125. [Google Scholar] [CrossRef]
  33. Li, J. AtomEye: An efficient atomistic configuration viewer. Model. Simul. Mater. Sci. Eng. 2003, 11, 173–177. [Google Scholar] [CrossRef]
  34. Knowles, K.M.; Smith, D.A. The crystallography of the martensitic transformation in equiatomic nickel-titanium. Acta Metall. 1981, 29, 101–110. [Google Scholar] [CrossRef]
  35. Liu, Y.; Xie, Z.; van Humbeeck, J.; Delaey, L. Asymmetry of stress–strain curves under tension and compression for NiTi shape memory alloys. Acta Mater. 1998, 46, 4325–4338. [Google Scholar] [CrossRef]
  36. Otsuka, K.; Ren, X. Physical metallurgy of Ti-Ni-based shape memory alloys. Prog. Mater. Sci. 2005, 50, 511–678. [Google Scholar] [CrossRef]
  37. Ezaz, T.; Sehitoglu, H.; Maier, H.J. Energetics of twinning in martensitic NiTi. Acta Mater. 2011, 59, 5893–5904. [Google Scholar] [CrossRef]
  38. Andani, M.T.; Elahinia, M. A rate dependent tension–torsion constitutive model for superelastic nitinol under non-proportional loading; a departure from von Mises equivalency. Smart Mater. Struct. 2013, 23, 015012. [Google Scholar] [CrossRef]
  39. Ma, G.; Qin, S.; Shang, J.; Wang, F.; Chen, Y. Atomistic study on the phase transformation in NiTi under thermal cycling. J. Alloys Compd. 2017, 705, 218–225. [Google Scholar] [CrossRef]
  40. Qin, S.; Shang, J.; Wang, F.; Chen, Y. The role of strain glass state in the shape memory alloy Ni50+xTi50-x: Insight from an atomistic study. Mater. Des. 2017, 120, 238–254. [Google Scholar] [CrossRef]
  41. Meisner, L.L.; Lotkov, A.I.; Ostapenko, M.G.; Gudimova, E.Y. X-ray diffraction study of residual elastic stress and microstructure of near-surface layers in nickel-titanium alloy irradiated with low-energy high-current electron beams. Appl. Surf. Sci. 2013, 280, 398–404. [Google Scholar] [CrossRef]
  42. Oliveira, J.P.; Fernandes, F.M.B.; Miranda, R.M.; Schell, N.; Ocaña, J.L. Residual stress analysis in laser welded NiTi sheets using synchrotron X-ray diffraction. Mater. Des. 2016, 100, 180–187. [Google Scholar] [CrossRef] [Green Version]
  43. Fan, Q.; Zhang, Y.; Wang, Y.; Sun, M.; Meng, Y.; Huang, S.; Wen, Y. Influences of transformation behavior and precipitates on the deformation behavior of Ni-rich NiTi alloys. Mater. Sci. Eng. A 2017, 700, 269–280. [Google Scholar] [CrossRef]
  44. Šesták, P.; Černý, M.; Pokluda, J. Elastic Constants of Austenitic and Martensitic Phases of NiTi Shape Memory Alloy. Recent Advances in Mechatronicsed; Springer: Berlin, Germany, 2010; pp. 1–6. [Google Scholar]
  45. Benafan, O.; Noebe, R.D.; Ii, S.A.P.; Gaydosh, D.J.; Lerch, B.A.; Garg, A.; Bigelow, G.S.; An, K.; Vaidyanathan, R. Temperature-dependent behavior of a polycrystalline NiTi shape memory alloy around the transformation regime. Scr. Mater. 2013, 68, 571–574. [Google Scholar] [CrossRef]
  46. Gheibi, A.; Hedayat, A. The relation between static Young’s modulus and dynamic bulk modulus of granular materials and the role of stress history. In Geotechnical Earthquake Engineering and Soil Dynamics V: Slope Stability and Landslides, Laboratory Testing, and In Situ Testing; American Society of Civil Engineers Reston: Reston, VA, USA, 2018; pp. 373–382. [Google Scholar]
  47. Tang, W.; Sundman, B.; Sandstrom, R.; Qiu, C. New modelling of the B2 phase and its associated martensitic transformation in the Ti-Ni system. Acta Mater. 1999, 47, 3457–3468. [Google Scholar] [CrossRef]
Figure 1. Simulation domain for elastic constants calculation. Grain 1 and grain 2 are arranged following specific disorientations. Grain boundaries are constructed between adjacent grains.
Metals 11 01237 g001
Figure 2. PE profiles during cooling and heating from simulation domain under hydrostatic pressure only: (a) cooling, (b) heating.
Metals 11 01237 g002
Figure 3. PE profiles during cooling and heating from simulation domain under both hydrostatic pressure and shear stress: (a) cooling, (b) heating.
Metals 11 01237 g003aMetals 11 01237 g003b
Figure 4. Phase transformation temperatures obtained from simulation domains. (a) Phase transformation temperatures obtained from PE profile; (b) stress applied in normal directions; (c) stress applied in both normal and shear directions.
Metals 11 01237 g004
Figure 5. Atomic structure from simulation domain at 10 K under normal stress of 0.1 GPa. Atoms were colored by local von Mises shear strain invariant. Martensite twin was formed as (0 1 1) (1 0 0).
Metals 11 01237 g005
Figure 6. Atomic structure from simulation domain at 10 K under normal and shear stresses of 0.1 GPa. Atoms were colored by local von Mises shear strain invariant. Martensite twin was formed as (1 0 0) (0 1 1).
Metals 11 01237 g006
Figure 7. Atomic structure from simulation domain at 10 K under normal and shear stresses of 0–11 kbar. Atoms were colored by local von Mises shear strain invariant.
Metals 11 01237 g007
Figure 8. Phase transformation temperatures of Ni-rich NiTi with different Ni contents. Experimental data were adapted from Ref. [16].
Metals 11 01237 g008
Figure 9. Simulation domains of BC with different initial grain boundary thicknesses. Atoms were colored by their potential energy.
Metals 11 01237 g009
Figure 10. Potential energy distribution of Ni and Ti atoms across the grain boundary: (a) Ni atoms (b) Ti atoms.
Metals 11 01237 g010
Figure 11. Calculated elastic modulus vs. potential energy of simulation domains.
Metals 11 01237 g011
Figure 12. Atomic stress XY distribution in simulation domains. Data points were obtained from the histogram distribution of Ti atoms: (a) Elastic modulus cases (b) Phase transformation temperature cases.
Metals 11 01237 g012
Table 1. Phase transformation temperatures from simulation results. Experimental data are included for comparison.
External StressPhase Transformation Temperatures [K]
MsMfAsAf
0 GPa, MD simulation [36,37]302296325334
0 GPa, this work298.7287.5317.4334.8
0.01 GPa, this work307295317.1337.3
0.05 GPa, this work315.4301.8325.5375.6
0.1 GPa, this work318.7301.6343.9391.7
0 GPa (Ni 49.99% (.at))
Experimental [16]
338.7311.7352.1380.2
0 GPa (Ni 50.19% (.at)) Experimental [16]325.8296.1337.1365.8
Table 2. Simulation results of elastic constants from different simulations at 200 K. Units in gigapascal (GPa).
Elastic ConstantsSingle Crystalline
(SC)
Bi-Crystalline (BC)
Initial Grain Boundary Thickness: 0 Å
Abinit
Ab
Initio [41]
VASP
Ab
Initio [41]
Ʃ3Ʃ5Ʃ9Ʃ15
C11161.57120.2994.46115.09118.82188200
C22126.95111.9079.8097.28104.71231241
C33123.90114.1380.97100.9086.16245223
C12100.4671.4346.3171.0068.48122125
C13102.9072.1560.7369.3375.978999
C23130.5883.1069.3785.1881.92108129
C4435.2129.1330.9229.9427.957777
C5554.1023.6327.3725.5625.934521
C6654.7521.6916.7725.1223.139076
Table 3. Simulation results of elastic properties from different simulations at 200 K. Units in gigapascal (GPa).
Elastic PropertiesSingle Crystalline
(SC)
Bi-Crystalline (BC)
Initial Grain Boundary Thickness: 0 Å
Abinit
Ab
Initio [41]
VASP
Ab
Initio [41]
Ʃ3Ʃ5Ʃ9Ʃ15
B V 120.0488.8667.5684.9284.72144.67152.22
B R 13.029.457.129.149.1314.0615.30
G V 34.0522.8720.2721.9820.9665.4055.53
G R 85.8847.9847.2651.4748.22189.6087.00
E V 93.3263.1955.2860.7058.09170.51148.54
E R 80.5553.4744.1453.6852.41103.5290.16
E 86.9358.3349.7157.1955.25137.02119.35
Publisher’s Note: MDPI stays neutral with regard to jurisdictional claims in published maps and institutional affiliations.

