
Nano-Bainitic Steels: Acceleration of Transformation by High Aluminum Addition and Its Effect on Their Mechanical Properties


Abstract
1. Introduction
2. Materials and Methods
3. Results
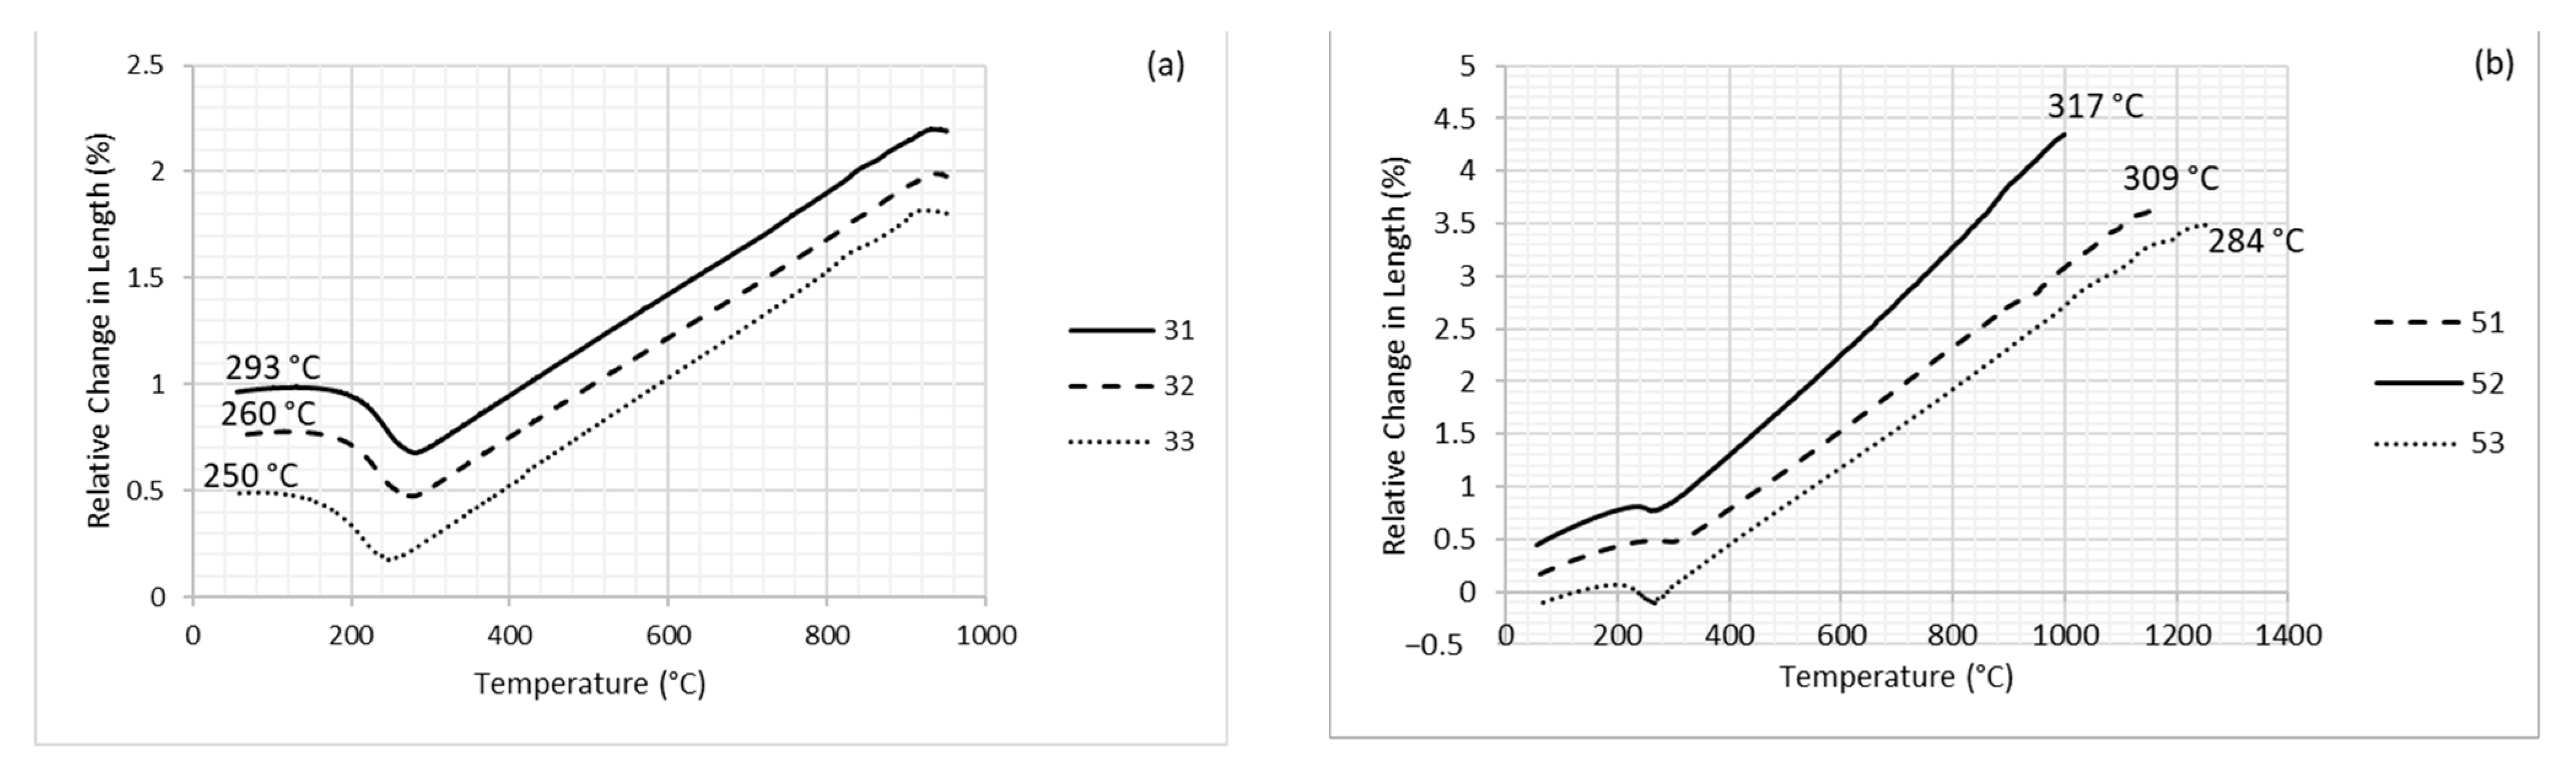
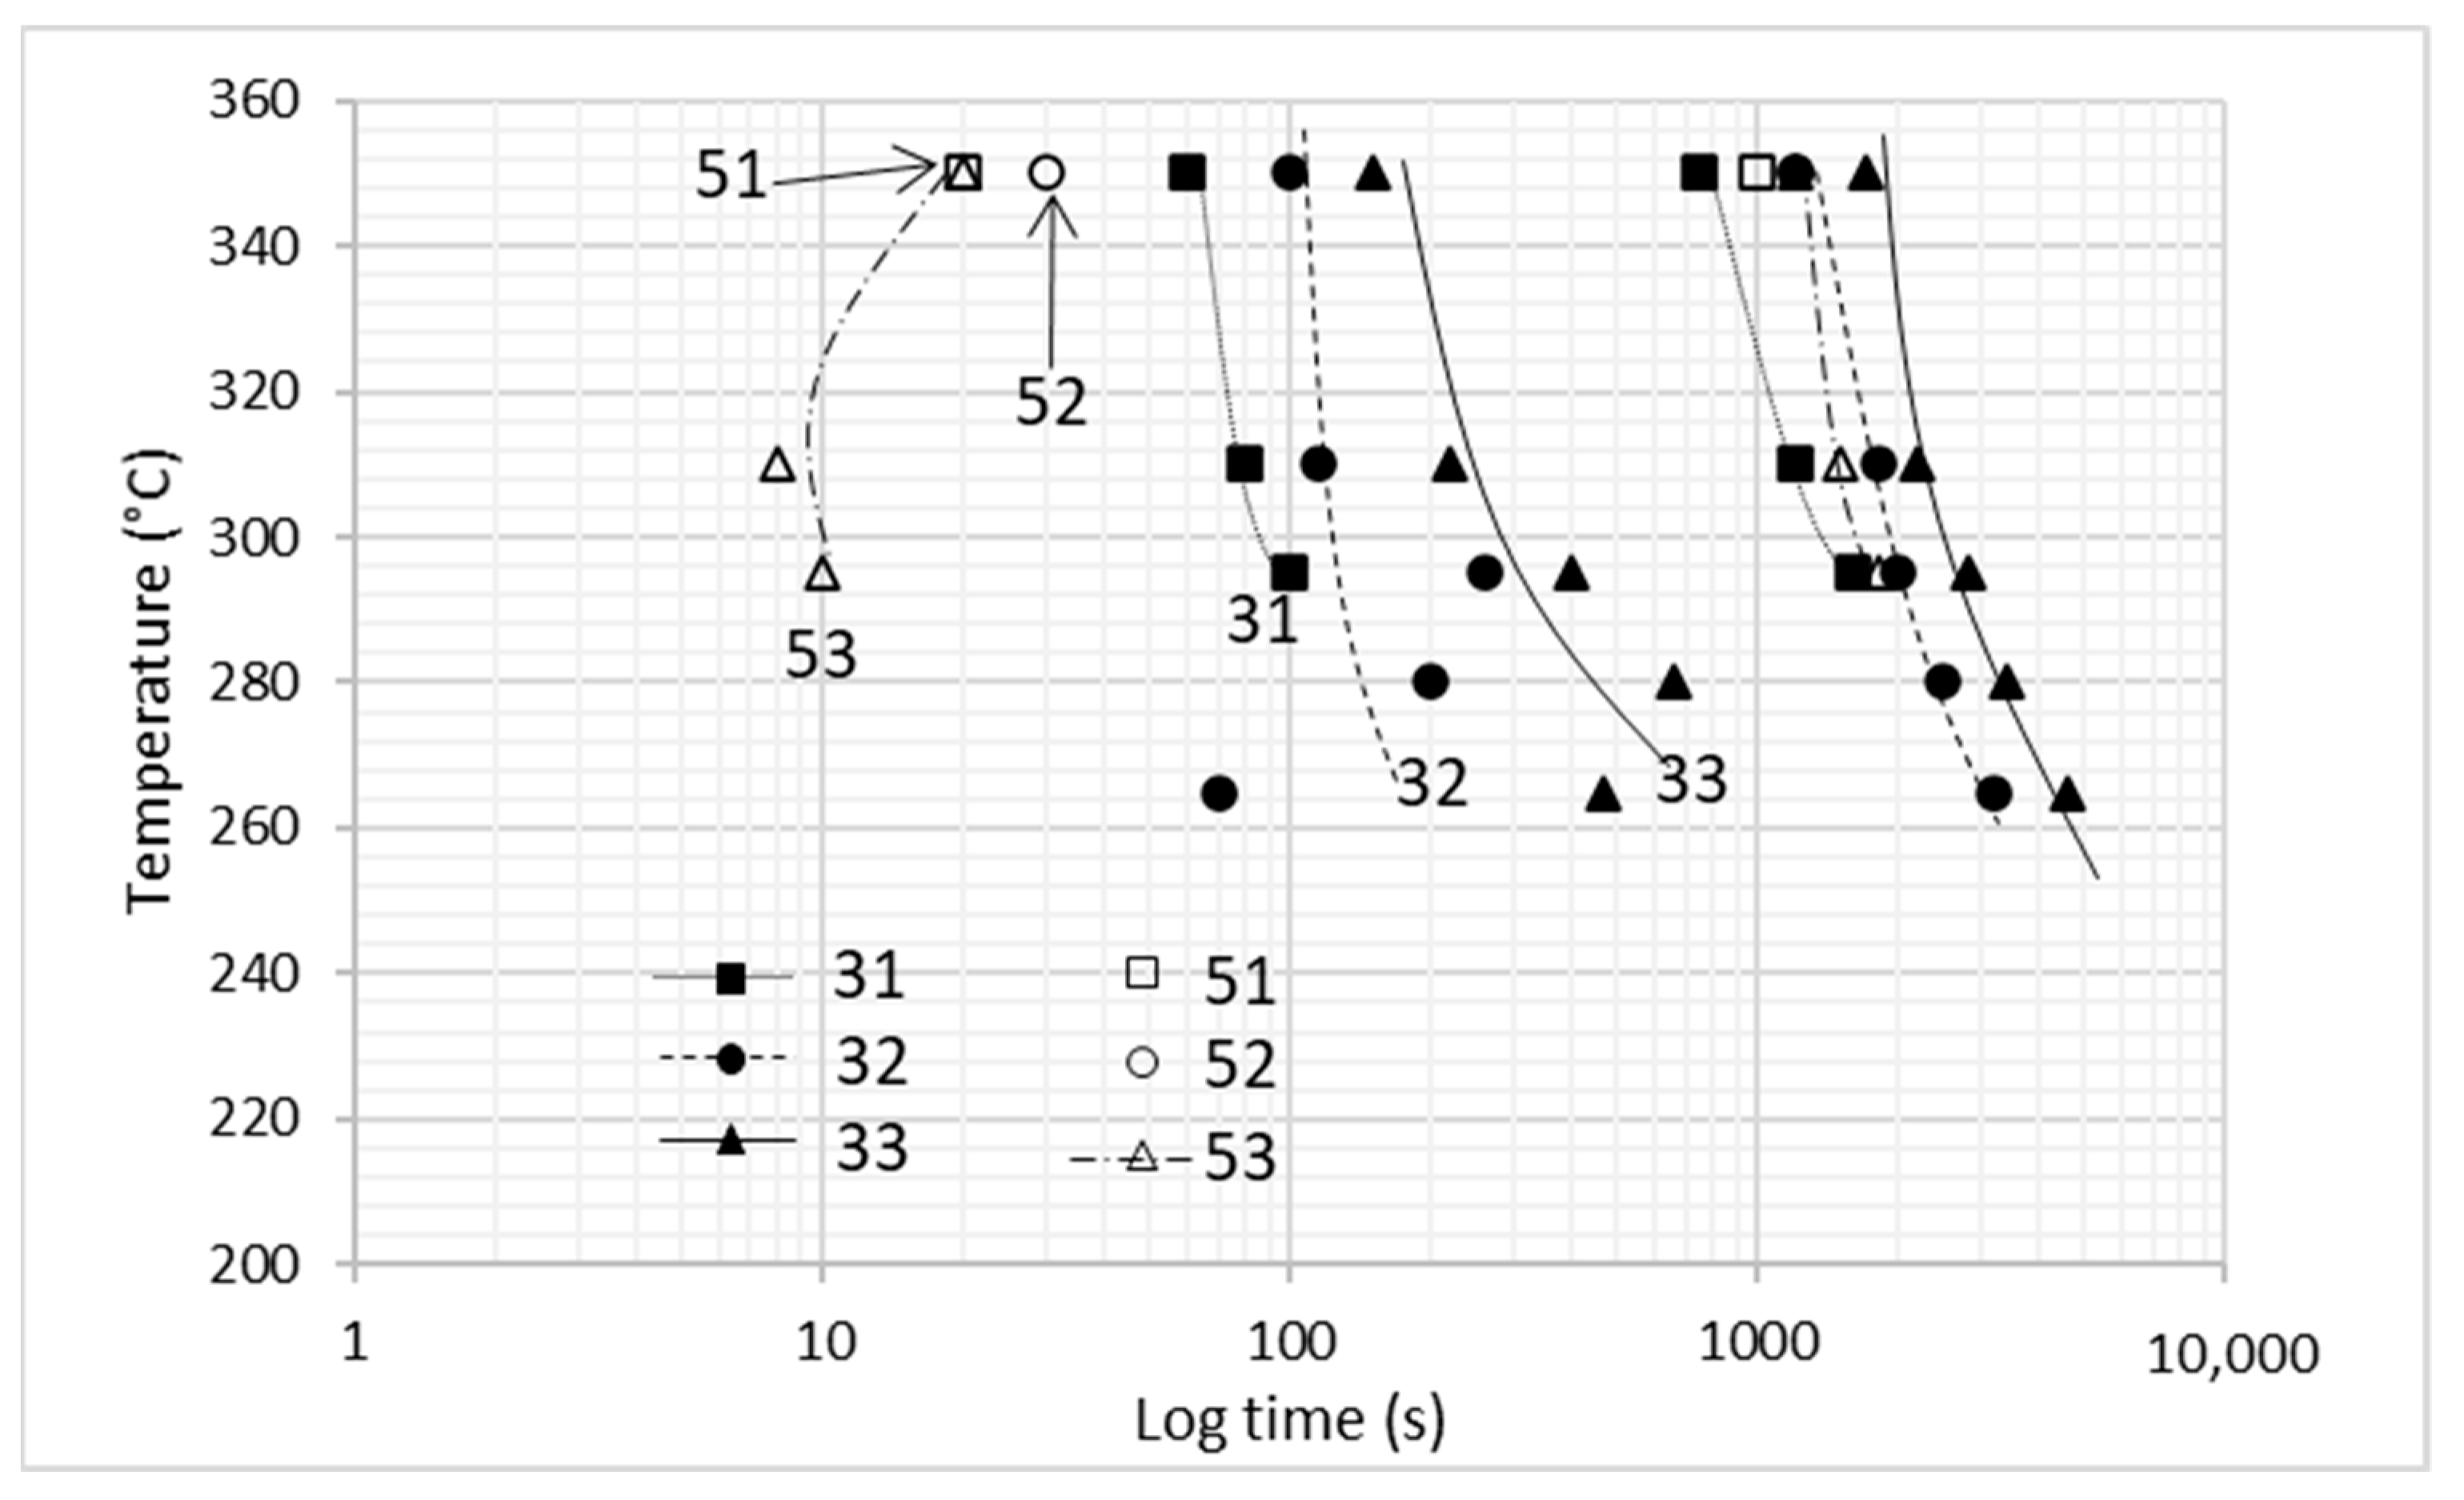
3.1. Dilatometry
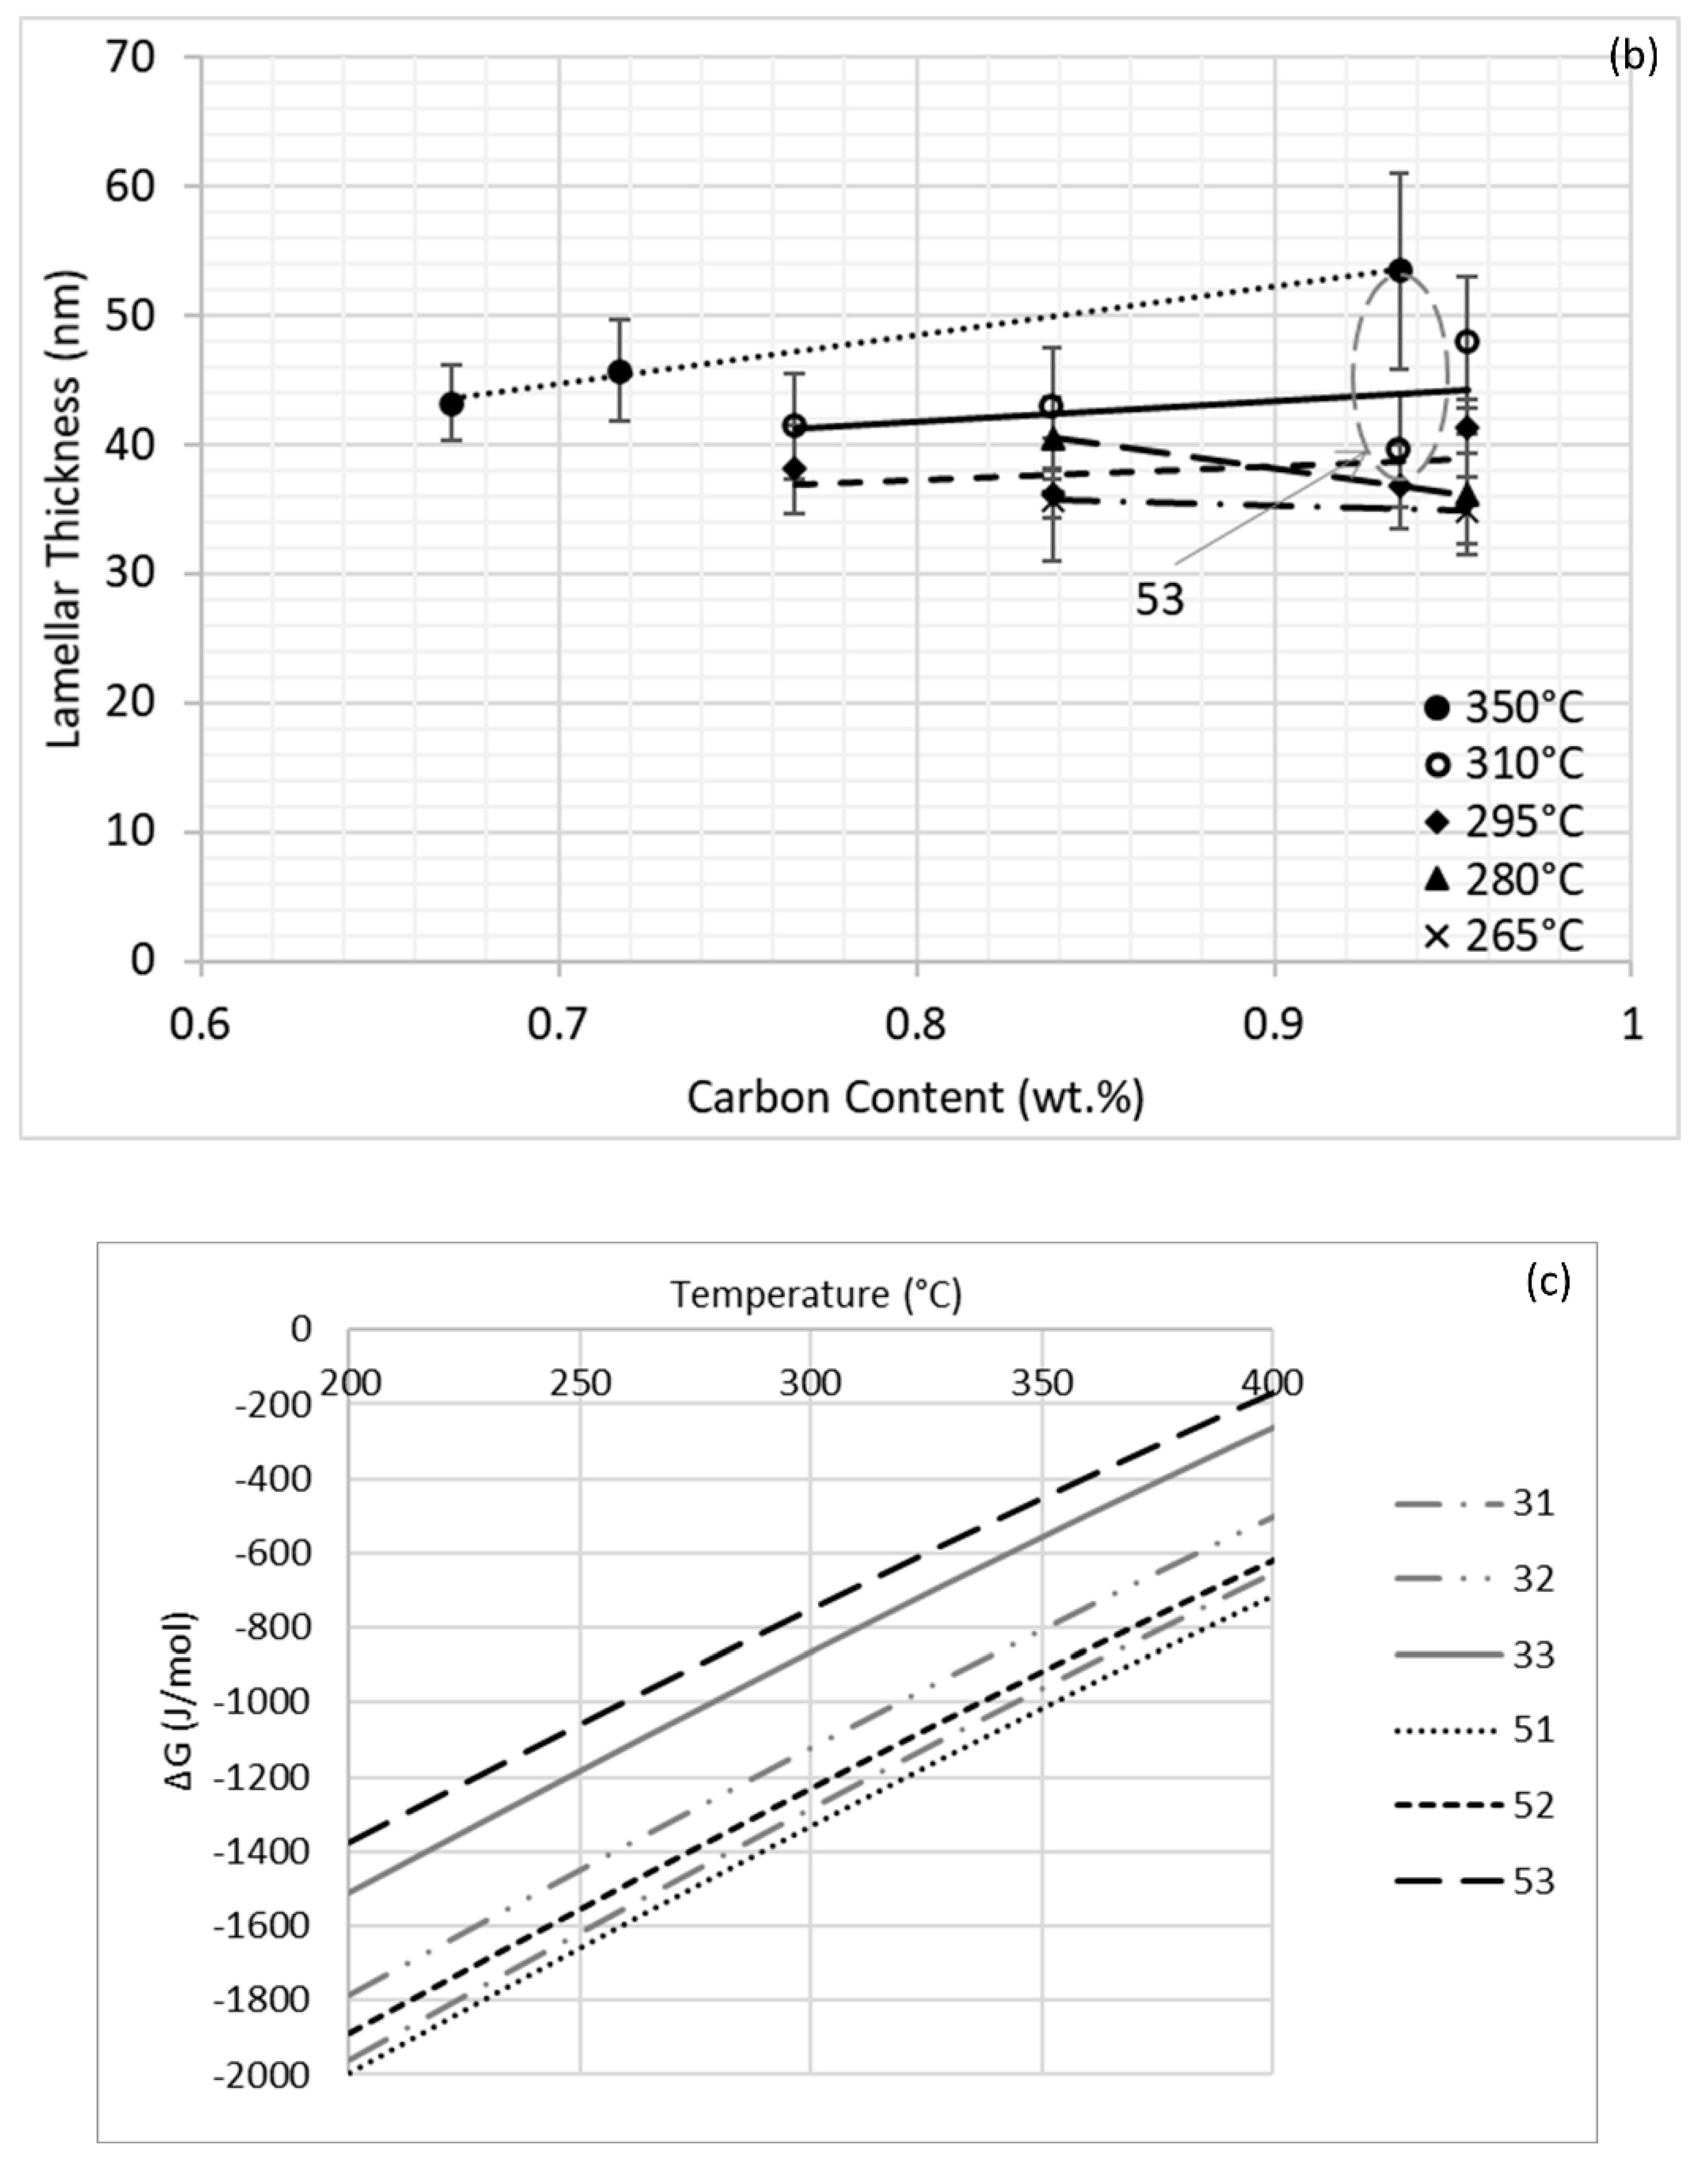
3.2. Mechanical Behavior
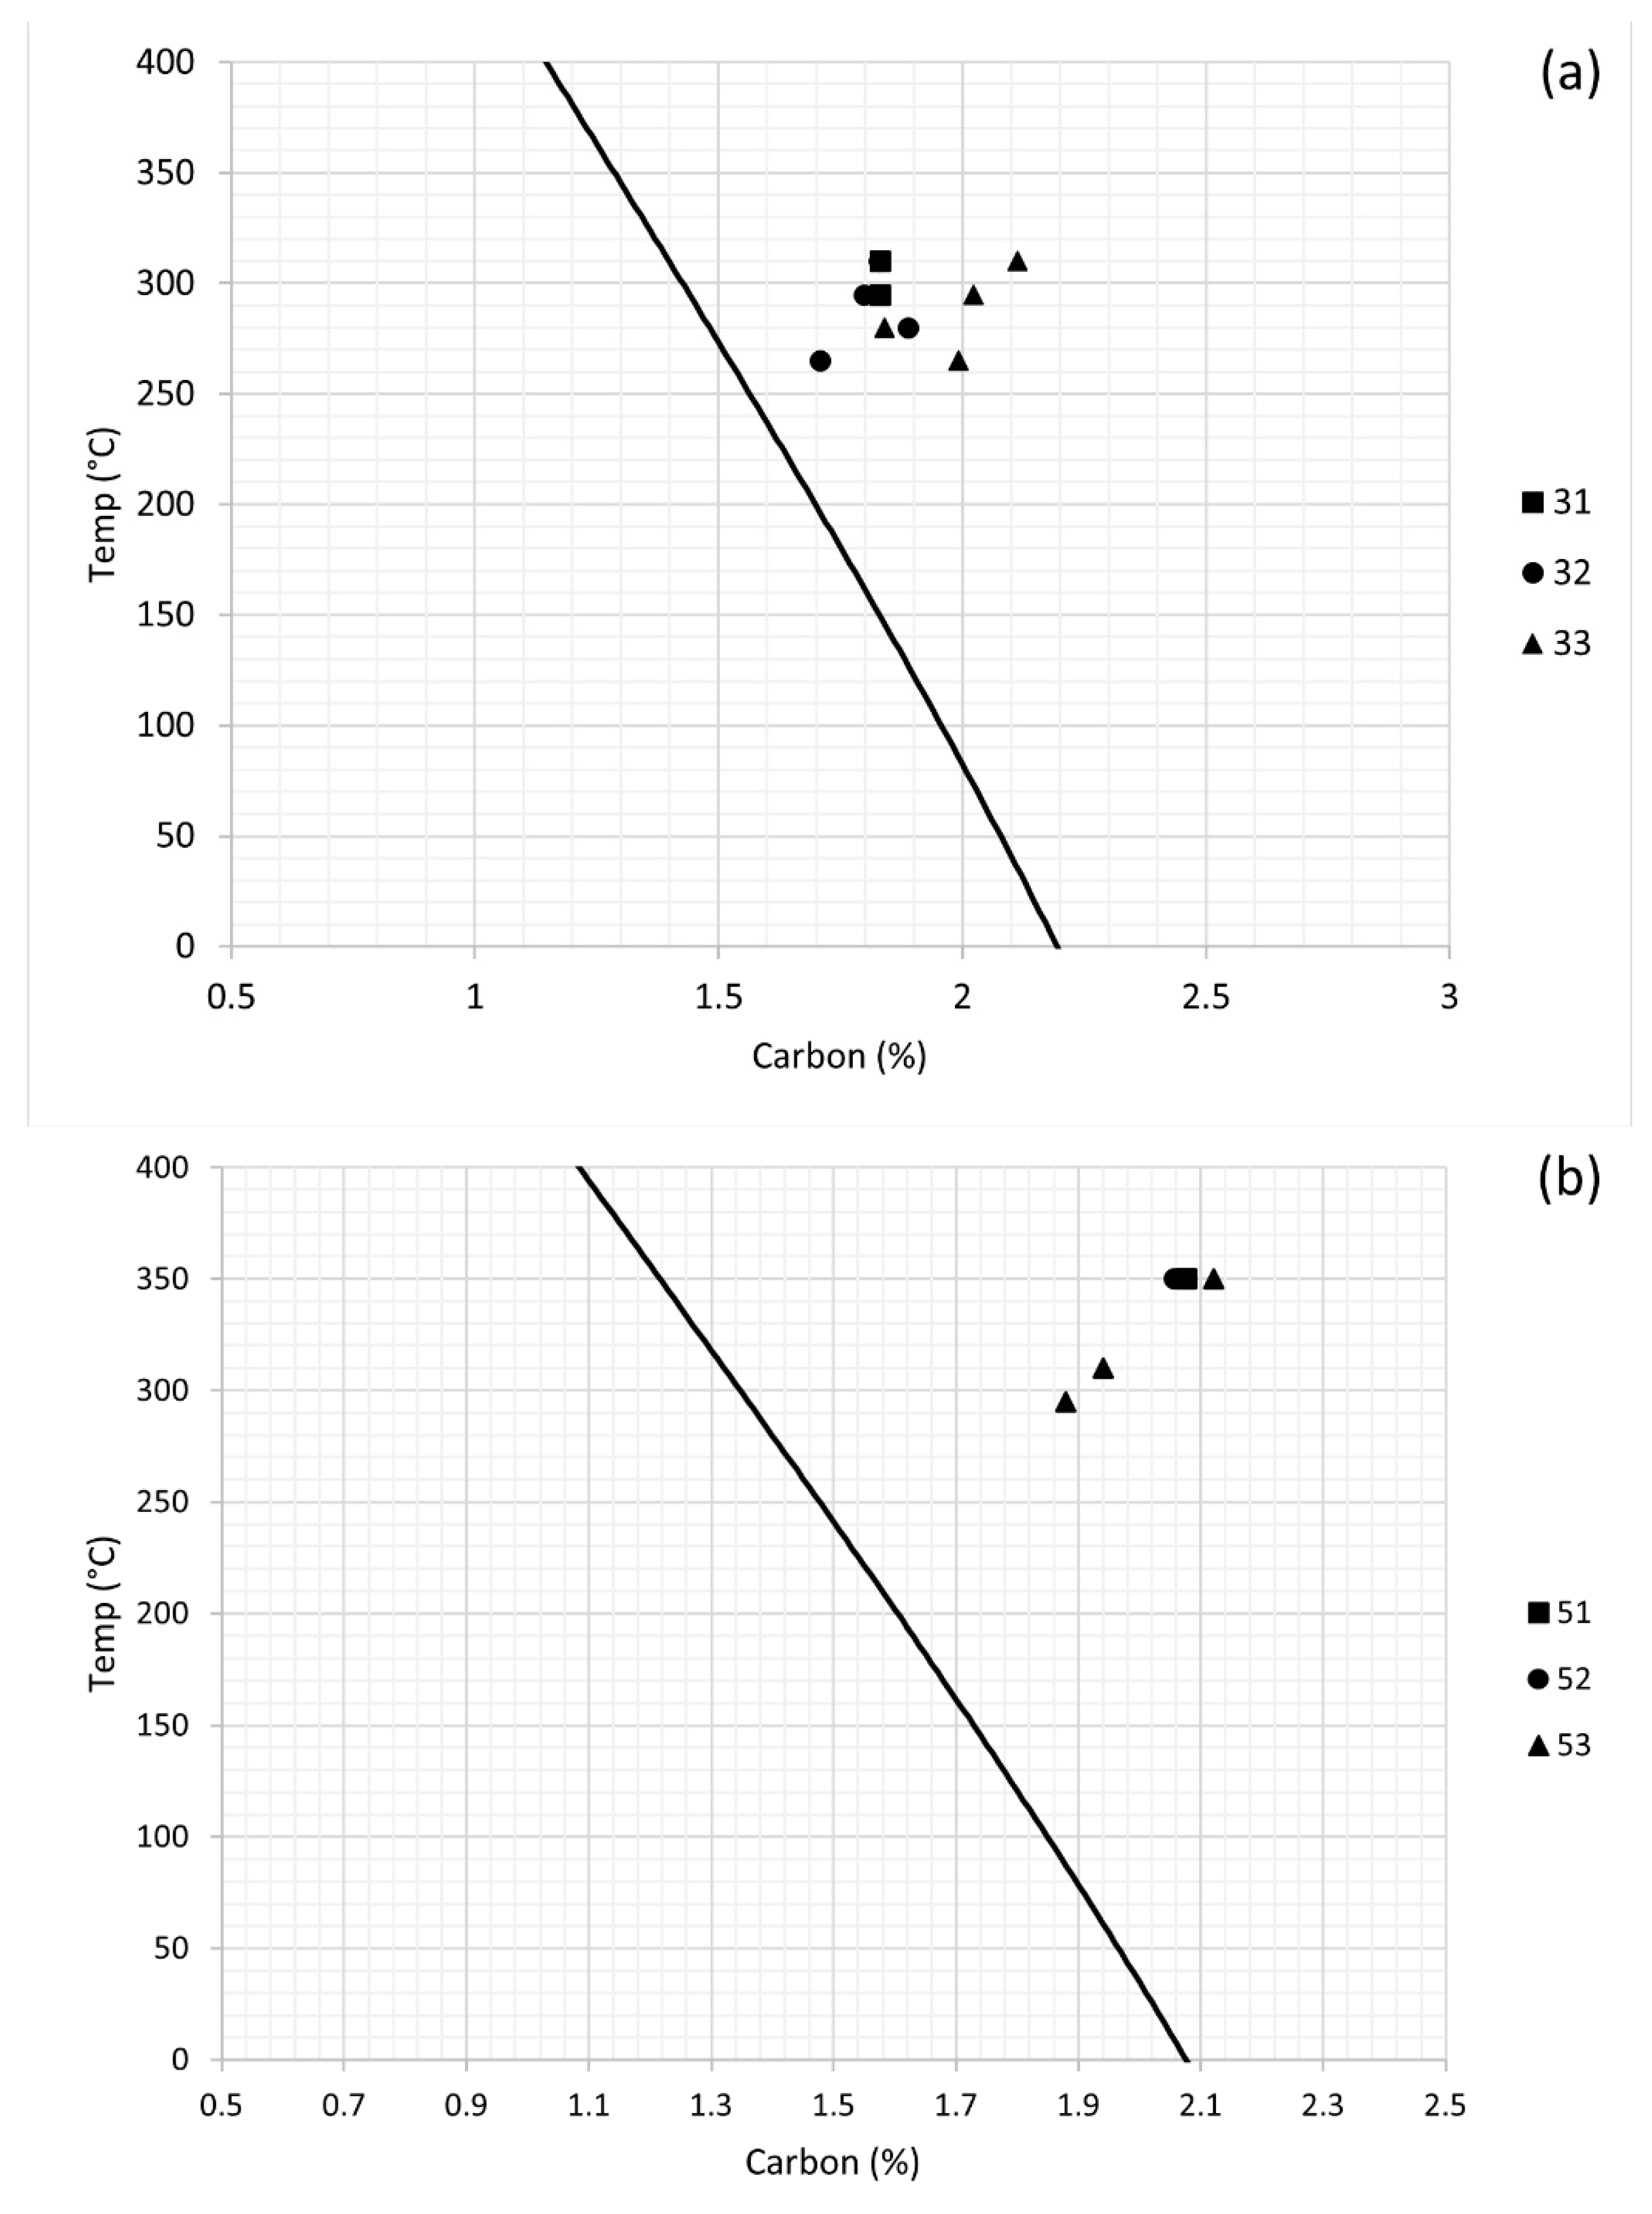
4. Discussion
5. Conclusions
Author Contributions
Funding
Institutional Review Board Statement
Informed Consent Statement
Data Availability Statement
Acknowledgments
Conflicts of Interest
References
- Soliman, M.; Palkowski, H. Ultra-fine Bainite Structure in Hypo-eutectoid Steels. ISIJ Int. 2007, 47, 1703–1710. [Google Scholar] [CrossRef]
- Zhao, J.; Jia, X.; Guo, K.; Jia, N.N.; Wang, Y.F.; Wang, Y.H.; Wang, T.S. Transformation behavior and microstructure feature of large strain ausformed low-temperature bainite in a medium C—Si rich alloy steel. Sci. Eng. 2017, 682, 527–534. [Google Scholar] [CrossRef]
- Ravi, A.M.; Sietsma, J.; Santofimia, M.J. Exploring bainite formation kinetics distinguishing grain-boundary and autocatalytic nucleation in high and low-Si steels. Acta Mater. 2016, 105, 155–164. [Google Scholar] [CrossRef]
- Kabirmohammadi, M.; Avishan, B.; Yazdani, S. Transformation kinetics and microstructural features in low-temperature bainite after ausforming process. Mater. Chem. Phys. 2016, 184, 306–317. [Google Scholar] [CrossRef]
- Ravi, A.M.; Sietsma, J.; Santofimia, M.J. Bainite formation kinetics in steels and the dynamic nature of the autocatalytic nucleation process. Scr. Mater. 2017, 140, 82–86. [Google Scholar] [CrossRef]
- Samanta, S.; Biswas, P.; Singh, S.B. Analysis of the kinetics of bainite formation below the MS temperature. Scr. Mater. 2017, 136, 132–135. [Google Scholar] [CrossRef]
- Wu, H.D.; Miyamoto, G.; Yang, Z.G.; Zhang, C.; Chen, H.; Furuhara, T. Incomplete bainite transformation in Fe-Si-C alloys. Acta Mater. 2017, 133, 1–9. [Google Scholar] [CrossRef]
- Soliman, M.; Palkowski, H. Development of the low temperature bainite. Arch. Civ. Mech. Eng. 2016, 16, 403–412. [Google Scholar] [CrossRef]
- Varshney, A.; Sangal, S.; Kundu, S.; Mondal, K. Super strong and highly ductile low alloy multiphase steels consisting of bainite, ferrite and retained austenite. Mater. Des. 2016, 95, 75–88. [Google Scholar] [CrossRef]
- Tsai, Y.T.; Lin, C.R.; Lee, W.S.; Huang, C.Y.; Yang, J.R. Mechanical behavior and microstructural evolution of nanostructured bainite under high-strain rate deformation by Hopkinson bar. Scr. Mater. 2016, 115, 46–51. [Google Scholar] [CrossRef]
- Golchin, S.; Avishan, B.; Yazdani, S. Effect of 10% ausforming on impact toughness of nano bainite austempered at 300 °C. Mater. Sci. Eng. A 2016, 656, 94–101. [Google Scholar] [CrossRef]
- Asako, S.; Kawabata, T.; Aihara, S.; Kimura, S.; Kagehira, K. Micro-processes of brittle fracture initiation in bainite steel manufactured by ausforming. Procedia Struct. Integrity 2016, 2, 3668–3675. [Google Scholar] [CrossRef][Green Version]
- Yang, J.; Wang, T.S.; Zhang, B.; Zhang, F.C. Microstructure and mechanical properties of high-carbon Si–Al-rich steel by low-temperature austempering. Mater. Des. 2012, 35, 170–174. [Google Scholar] [CrossRef]
- Yoozbashi, M.N.; Yazdani, S.; Wang, T.S. Design of a new nanostructured, high-Si bainitic steel with lower cost production. Mater. Des. 2011, 32, 3248–3253. [Google Scholar] [CrossRef]
- Khare, S.; Lee, K.; Bhadeshia, H.K.D.H. Carbide-Free Bainite: Compromise between Rate of Transformation and Properties. Met. Mater. Trans. A 2010, 41, 922–928. [Google Scholar] [CrossRef]
- Soliman, M.; Mostafa, H.; El-Sabbagh, S.; Palkowski, H. Low temperature bainite in steel with 0.26 wt.% C. Mater. Sci. Eng. A 2010, 527, 7706–7713. [Google Scholar] [CrossRef]
- Gong, W.; Tomota, Y.; Koo, M.S.; Adachi, Y. Effect of ausforming on nanobainite steel. Scr. Mater. 2010, 63, 819–822. [Google Scholar] [CrossRef]
- Bhadeshia, H.K.D.H. Nanostructured bainite. Proc. R. Soc. A Math. Phys. Eng. Sci. 2009, 466, 3–18. [Google Scholar] [CrossRef]
- Garcia-Mateo, C.; Caballero, F.; Bhadeshia, H.K.D.H. Development of Hard Bainite. ISIJ Int. 2003, 43, 1238–1243. [Google Scholar] [CrossRef]
- Caballero, F.G.; Bhadeshia, H.K.D.H. Very strong bainite. Curr. Opin. Solid State Mater. Sci. 2004, 8, 251–257. [Google Scholar] [CrossRef]
- Ji, C.-X.; Cui, Y.; Zeng, Z.; Tian, Z.-H.; Zhao, C.-L.; Zhu, G.-S. Continuous casting of high-Al steel in shougang jingtang steel works. J. Iron Steel Res. Int. 2015, 22, 53–56. [Google Scholar] [CrossRef]
- Cui, H.; Zhang, K.; Wang, Z.; Chen, B.; Liu, B.; Qing, J.; Li, Z. Formation of surface depression during continuous casting of high-Al TRIP steel. Metals 2019, 9, 204. [Google Scholar] [CrossRef]
- Akram, M.; Palkowski, H.; Soliman, M. High-Strength Low-Cost Nano-Bainitic Steel. J. Mater. Eng. Perform. 2020, 29, 2418–2427. [Google Scholar] [CrossRef]
- Tian, J.-Y.; Xu, G.; Zhou, M.-X.; Hu, H.-J.; Xue, Z.-L. Effects of Al addition on bainite transformation and properties of high-strength carbide-free bainitic steels. J. Iron Steel Res. Int. 2019, 26, 846–855. [Google Scholar] [CrossRef]
- Toji, Y.; Matsuda, H.; Raabe, D. Effect of Si on the acceleration of bainite transformation by pre-existing martensite. Acta Mater. 2016, 116, 250–262. [Google Scholar] [CrossRef]
- Gong, W.; Tomota, Y.; Harjo, S.; Su, Y.H.; Aizawa, K. Effect of prior martensite on bainite transformation in nanobainite steel. Acta Materialia 2015, 85, 243–249. [Google Scholar] [CrossRef]
- Huang, H.; Sherif, M.; Rivera-Díaz-Del-Castillo, P. Combinatorial optimization of carbide-free bainitic nanostructures. Acta Mater. 2013, 61, 1639–1647. [Google Scholar] [CrossRef]
- Soliman, M.; Palkowski, H. Tensile properties and bake hardening response of dual phase steels with varied martensite volume fraction. Mater. Sci. Eng. A 2020, 777, 139044. [Google Scholar] [CrossRef]
- Soliman, M.; Palkowski, H. Influence of hot working parameters on microstructure evolution, tensile behavior and strain aging potential of bainitic pipeline steel. Mater. Des. 2015, 88, 759–773. [Google Scholar] [CrossRef]
- Cullity, B.D. Elements of X-ray Diffraction, 2nd ed.; Addison-Wesley, Reading, Mass.: London, UK, 1978. [Google Scholar]
- Dyson, D.J. Effect of alloying additions on the lattice parameter of austenite. J. Iron Steel Inst. 1970, 208, 469–474. [Google Scholar]
- Mateo, C.G.; Caballero, F.; Miller, M.K.; Jiménez, J.A. On measurement of carbon content in retained austenite in a nanostructured bainitic steel. J. Mater. Sci. 2011, 47, 1004–1010. [Google Scholar] [CrossRef]
- Podder, A.S.; Bhadeshia, H. Thermal stability of austenite retained in bainitic steels. Mater. Sci. Eng. A 2010, 527, 2121–2128. [Google Scholar] [CrossRef]
- Xu, Y.; Xu, G.; Mao, X.; Zhao, G.; Bao, S. Method to Evaluate the Kinetics of Bainite Transformation in Low-Temperature Nanobainitic Steel Using Thermal Dilatation Curve Analysis. Metals 2017, 7, 330. [Google Scholar] [CrossRef]
- Garcia-Mateo, C.; Caballero, F.; Bhadeshia, H.K.D.H. Acceleration of Low-temperature Bainite. ISIJ Int. 2003, 43, 1821–1825. [Google Scholar] [CrossRef]
- Garcia-Mateo, C.; Caballero, F. Ultra-high-strength Bainitic Steels. ISIJ Int. 2005, 45, 1736–1740. [Google Scholar] [CrossRef]
- Singh, S.; Bhadeshia, H. Estimation of bainite plate-thickness in low-alloy steels. Mater. Sci. Eng. A 1998, 245, 72–79. [Google Scholar] [CrossRef]
- Jacques, P.; Girault, E.; Mertens, A.; Verlinden, B.; Van Humbeeck, J.; Delannay, F. The Developments of Cold-rolled TRIP-assisted Multiphase Steels. Al-alloyed TRIP-assisted Multiphase Steels. ISIJ Int. 2001, 41, 1068–1074. [Google Scholar] [CrossRef]
- Singh, K.; Kumar, A.; Singh, A. Effect of Prior Austenite Grain Size on the Morphology of Nano-Bainitic Steels. Met. Mater. Trans. A 2018, 49, 1348–1354. [Google Scholar] [CrossRef]
- Yang, J.; Qiu, H.; Xu, P.; Yu, H.; Wang, Y. The substitution of aluminum for cobalt in nanostructured bainitic steels. AIP Conf. Proc. 2018, 1971, 20001. [Google Scholar] [CrossRef]
- Guo, L.; Roelofs, H.; Lembke, M.I.; Bhadeshia, H.K.D.H. Modelling of size distribution of blocky retained austenite in Si-containing bainitic steels. Mater. Sci. Technol. 2018, 34, 54–62. [Google Scholar] [CrossRef]
- Isasti, N.; Jorge-Badiola, D.; Taheri, M.L.; Uranga, P. Microstructural Features Controlling Mechanical Properties in Nb-Mo Microalloyed Steels. Part II: Impact Toughness. Met. Mater. Trans. A 2014, 45, 4972–4982. [Google Scholar] [CrossRef]
- Gutiérrez, I. Effect of microstructure on the impact toughness of Nb-microalloyed steel: Generalisation of existing relations from ferrite–pearlite to high strength microstructures. Mater. Sci. Eng. A 2013, 571, 57–67. [Google Scholar] [CrossRef]
- Kim, M.T.; Park, T.M.; Baik, K.H.; Choi, W.S.; Choi, P.P.; Han, J. Crucial microstructural feature to determine the impact toughness of intercritically annealed medium-Mn steel with triplex-phase microstructure. Acta Materialia 2019, 164, 122–134. [Google Scholar] [CrossRef]
- Li, J.; Cheng, L.; Zhang, P.; Wang, L.; Li, H. Effect of delta ferrites on the anisotropy of impact toughness in martensitic heat-resistant steel. Mater. Res. Technol. 2019, 8, 1781–1788. [Google Scholar] [CrossRef]
- Bhadeshia, H.; Edmonds, D. The mechanism of bainite formation in steels. Acta Met. 1980, 28, 1265–1273. [Google Scholar] [CrossRef]


| Alloy | C | Mn | Si | Al | Mo | B | Fe |
|---|---|---|---|---|---|---|---|
| 31 | 0.766 | 0.98 | 0.27 | 3.08 | 0.45 | - | Balance |
| 32 | 0.838 | 0.98 | 0.28 | 3.09 | 0.46 | - | Balance |
| 33 | 0.954 | 0.99 | 0.28 | 3.02 | 0.45 | - | Balance |
| 51 | 0.672 | 0.98 | 0.26 | 5.03 | 0.44 | 0.0008 | Balance |
| 52 | 0.717 | 0.99 | 0.27 | 4.97 | 0.44 | 0.0012 | Balance |
| 53 | 0.935 | 0.98 | 0.26 | 4.75 | 0.47 | 0.0013 | Balance |
| Alloy | Austenitization Temperature (°C) |
|---|---|
| 3-Group | 950 |
| 51 | 1150 (10 vol.% δ-ferrite) |
| 52 | 1200 |
| 53 | 1250 |
| Alloy | Ms (°C) | Transformation Temperature (°C) | ||||
|---|---|---|---|---|---|---|
| 31 | 293 | - | - | 295 | 310 | 350 |
| 32 | 260 | 265 | 280 | 295 | 310 | 350 |
| 33 | 250 | 265 | 280 | 295 | 310 | 350 |
| 51 | 309 | - | - | - | - | 350 |
| 52 | 317 | - | - | - | - | 350 |
| 53 | 284 | - | - | 295 | 310 | 350 |
Publisher’s Note: MDPI stays neutral with regard to jurisdictional claims in published maps and institutional affiliations. |
© 2021 by the authors. Licensee MDPI, Basel, Switzerland. This article is an open access article distributed under the terms and conditions of the Creative Commons Attribution (CC BY) license (https://creativecommons.org/licenses/by/4.0/).
Share and Cite
Akram, M.; Soliman, M.; Palkowski, H. Nano-Bainitic Steels: Acceleration of Transformation by High Aluminum Addition and Its Effect on Their Mechanical Properties. Metals 2021, 11, 1210. https://doi.org/10.3390/met11081210
Akram M, Soliman M, Palkowski H. Nano-Bainitic Steels: Acceleration of Transformation by High Aluminum Addition and Its Effect on Their Mechanical Properties. Metals. 2021; 11(8):1210. https://doi.org/10.3390/met11081210
Chicago/Turabian StyleAkram, Mohamad, Mohamed Soliman, and Heinz Palkowski. 2021. "Nano-Bainitic Steels: Acceleration of Transformation by High Aluminum Addition and Its Effect on Their Mechanical Properties" Metals 11, no. 8: 1210. https://doi.org/10.3390/met11081210
APA StyleAkram, M., Soliman, M., & Palkowski, H. (2021). Nano-Bainitic Steels: Acceleration of Transformation by High Aluminum Addition and Its Effect on Their Mechanical Properties. Metals, 11(8), 1210. https://doi.org/10.3390/met11081210