
Effect of abc Pressing at 573 K on the Microstructure and Martensite Transformation Temperatures in Ti49.8Ni50.2 (at%)


 ,
, 
Abstract
1. Introduction
2. Materials and Methods
3. Results
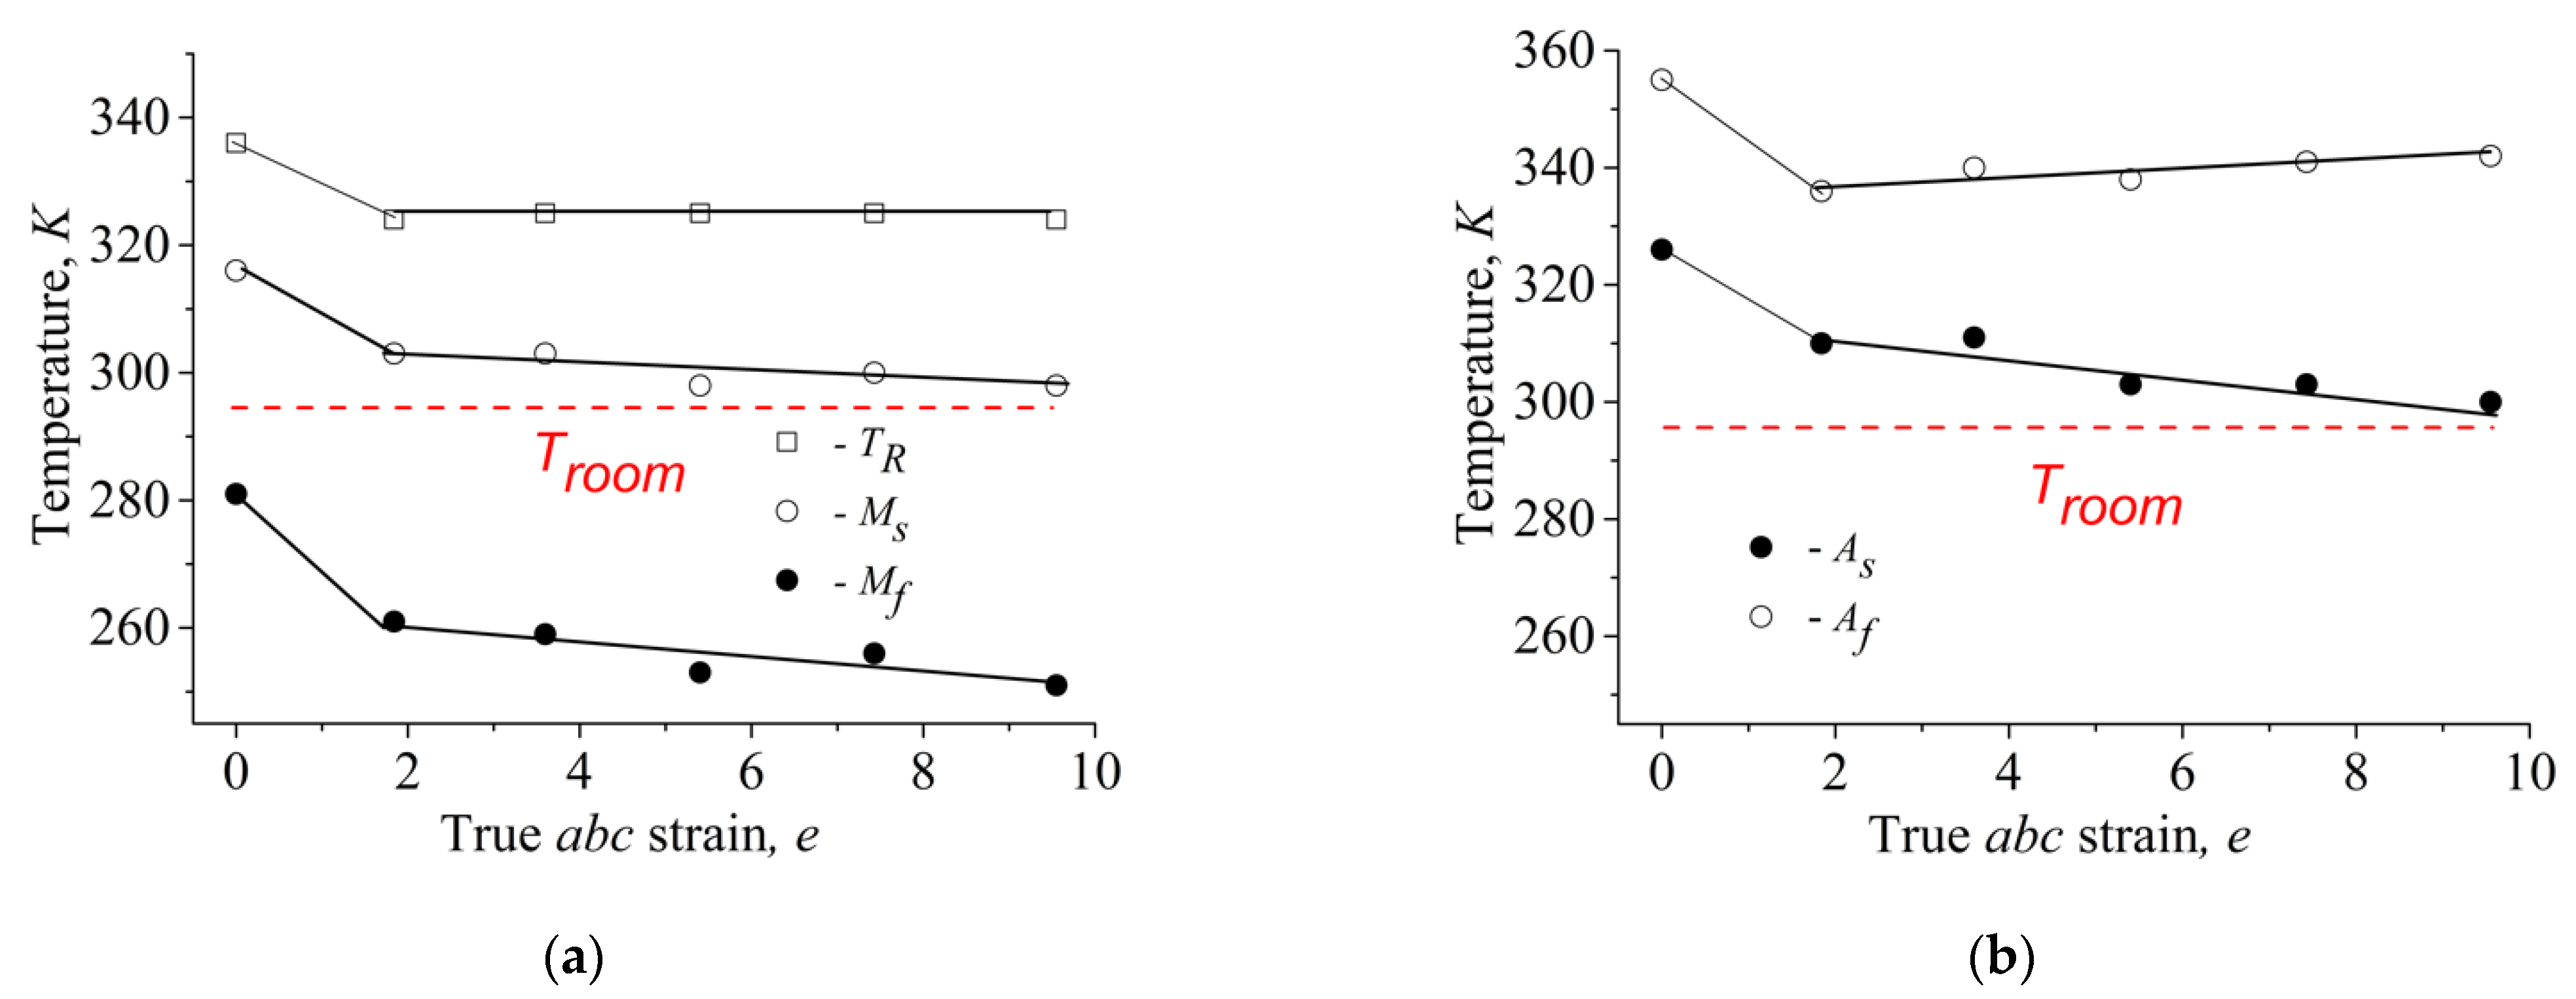
3.1. Temperatures of Martensite Transformation
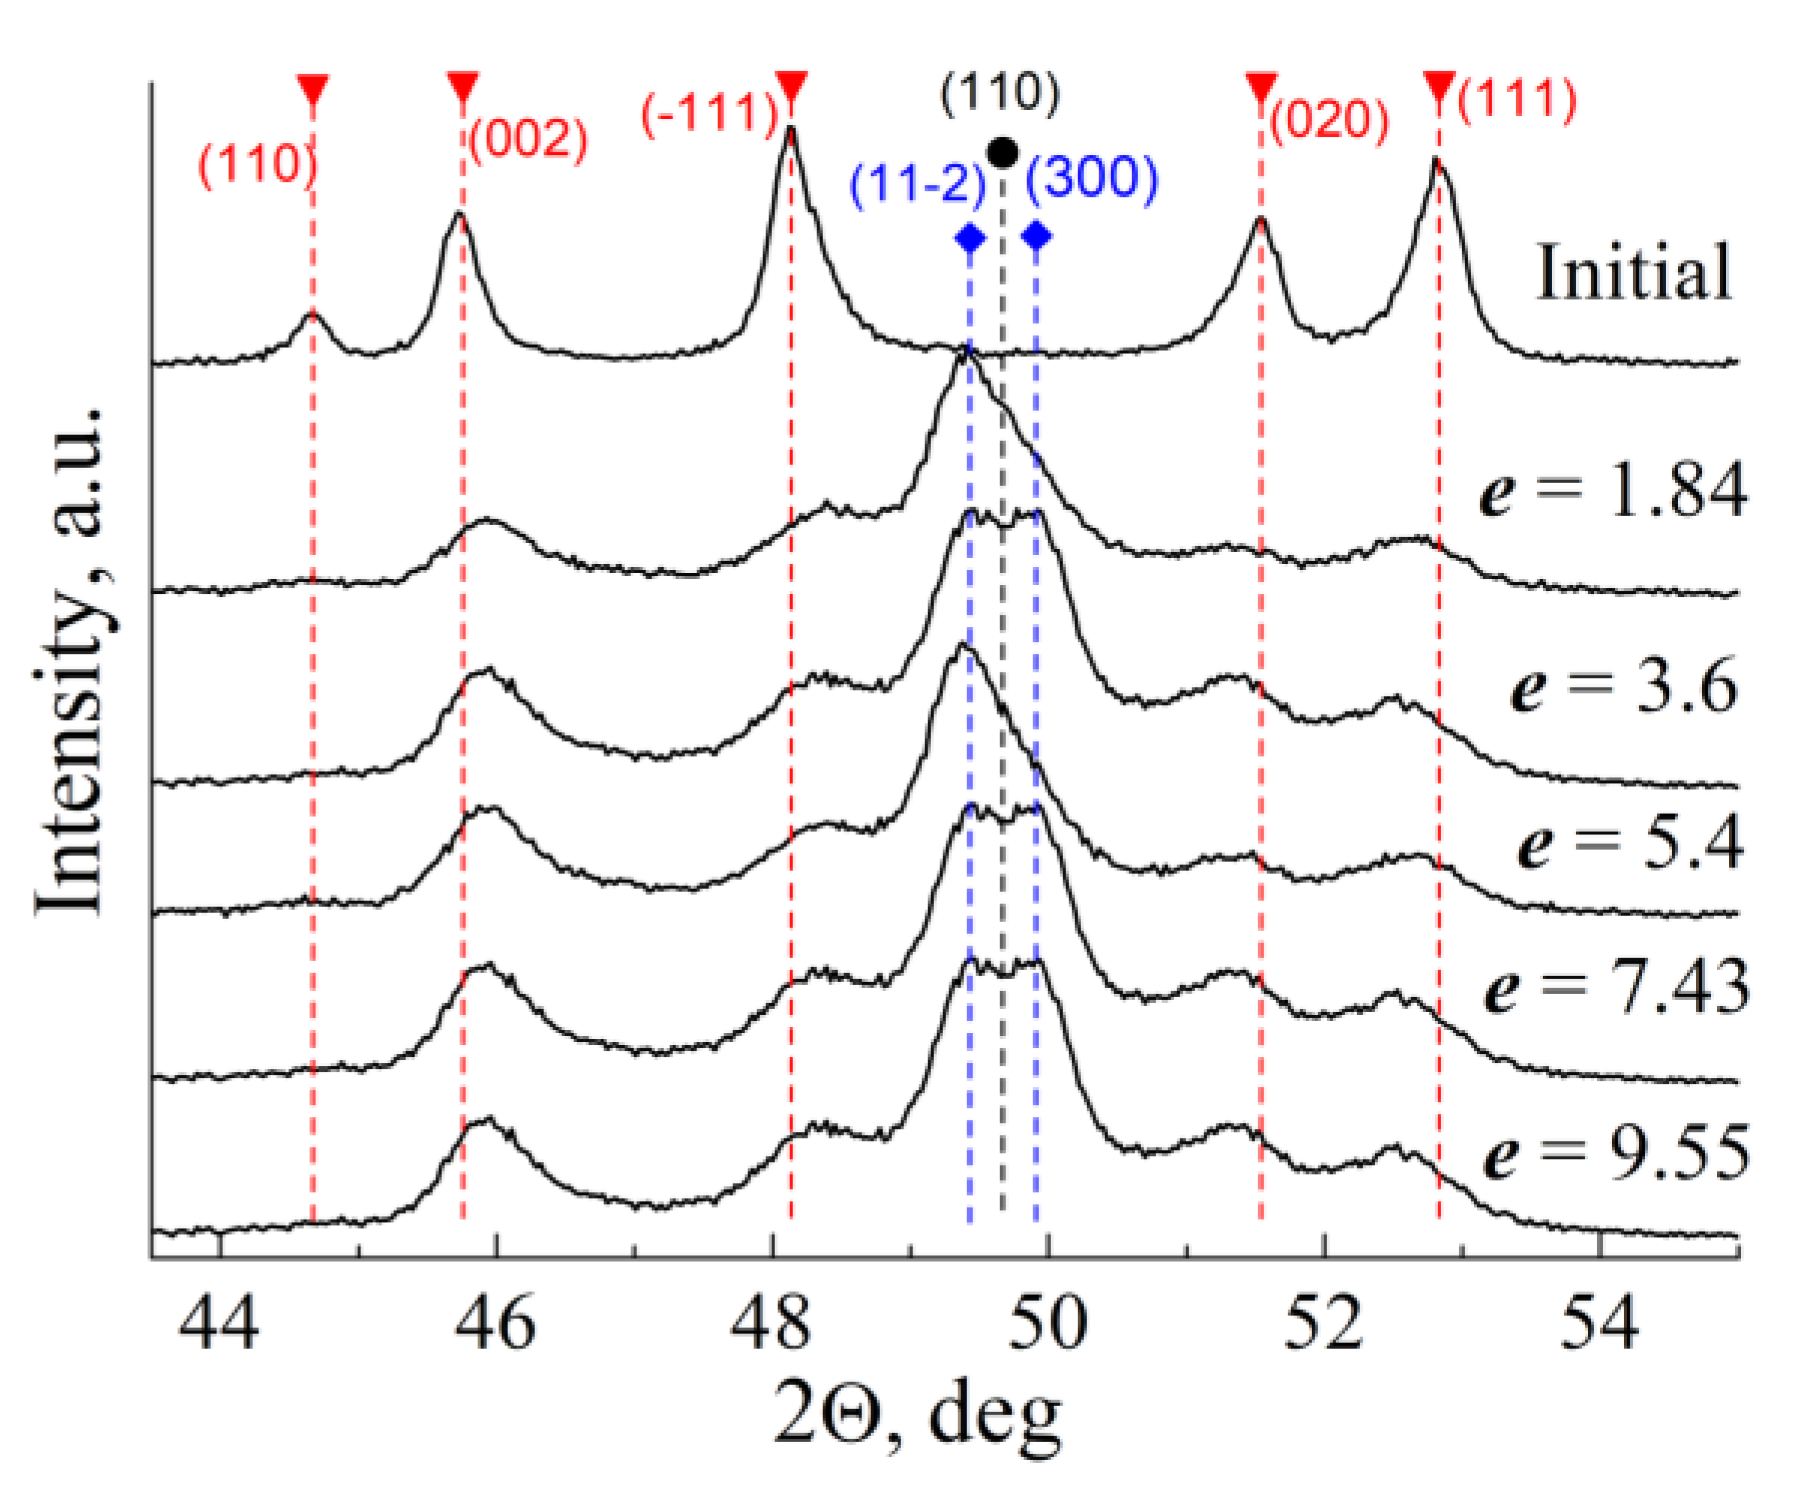
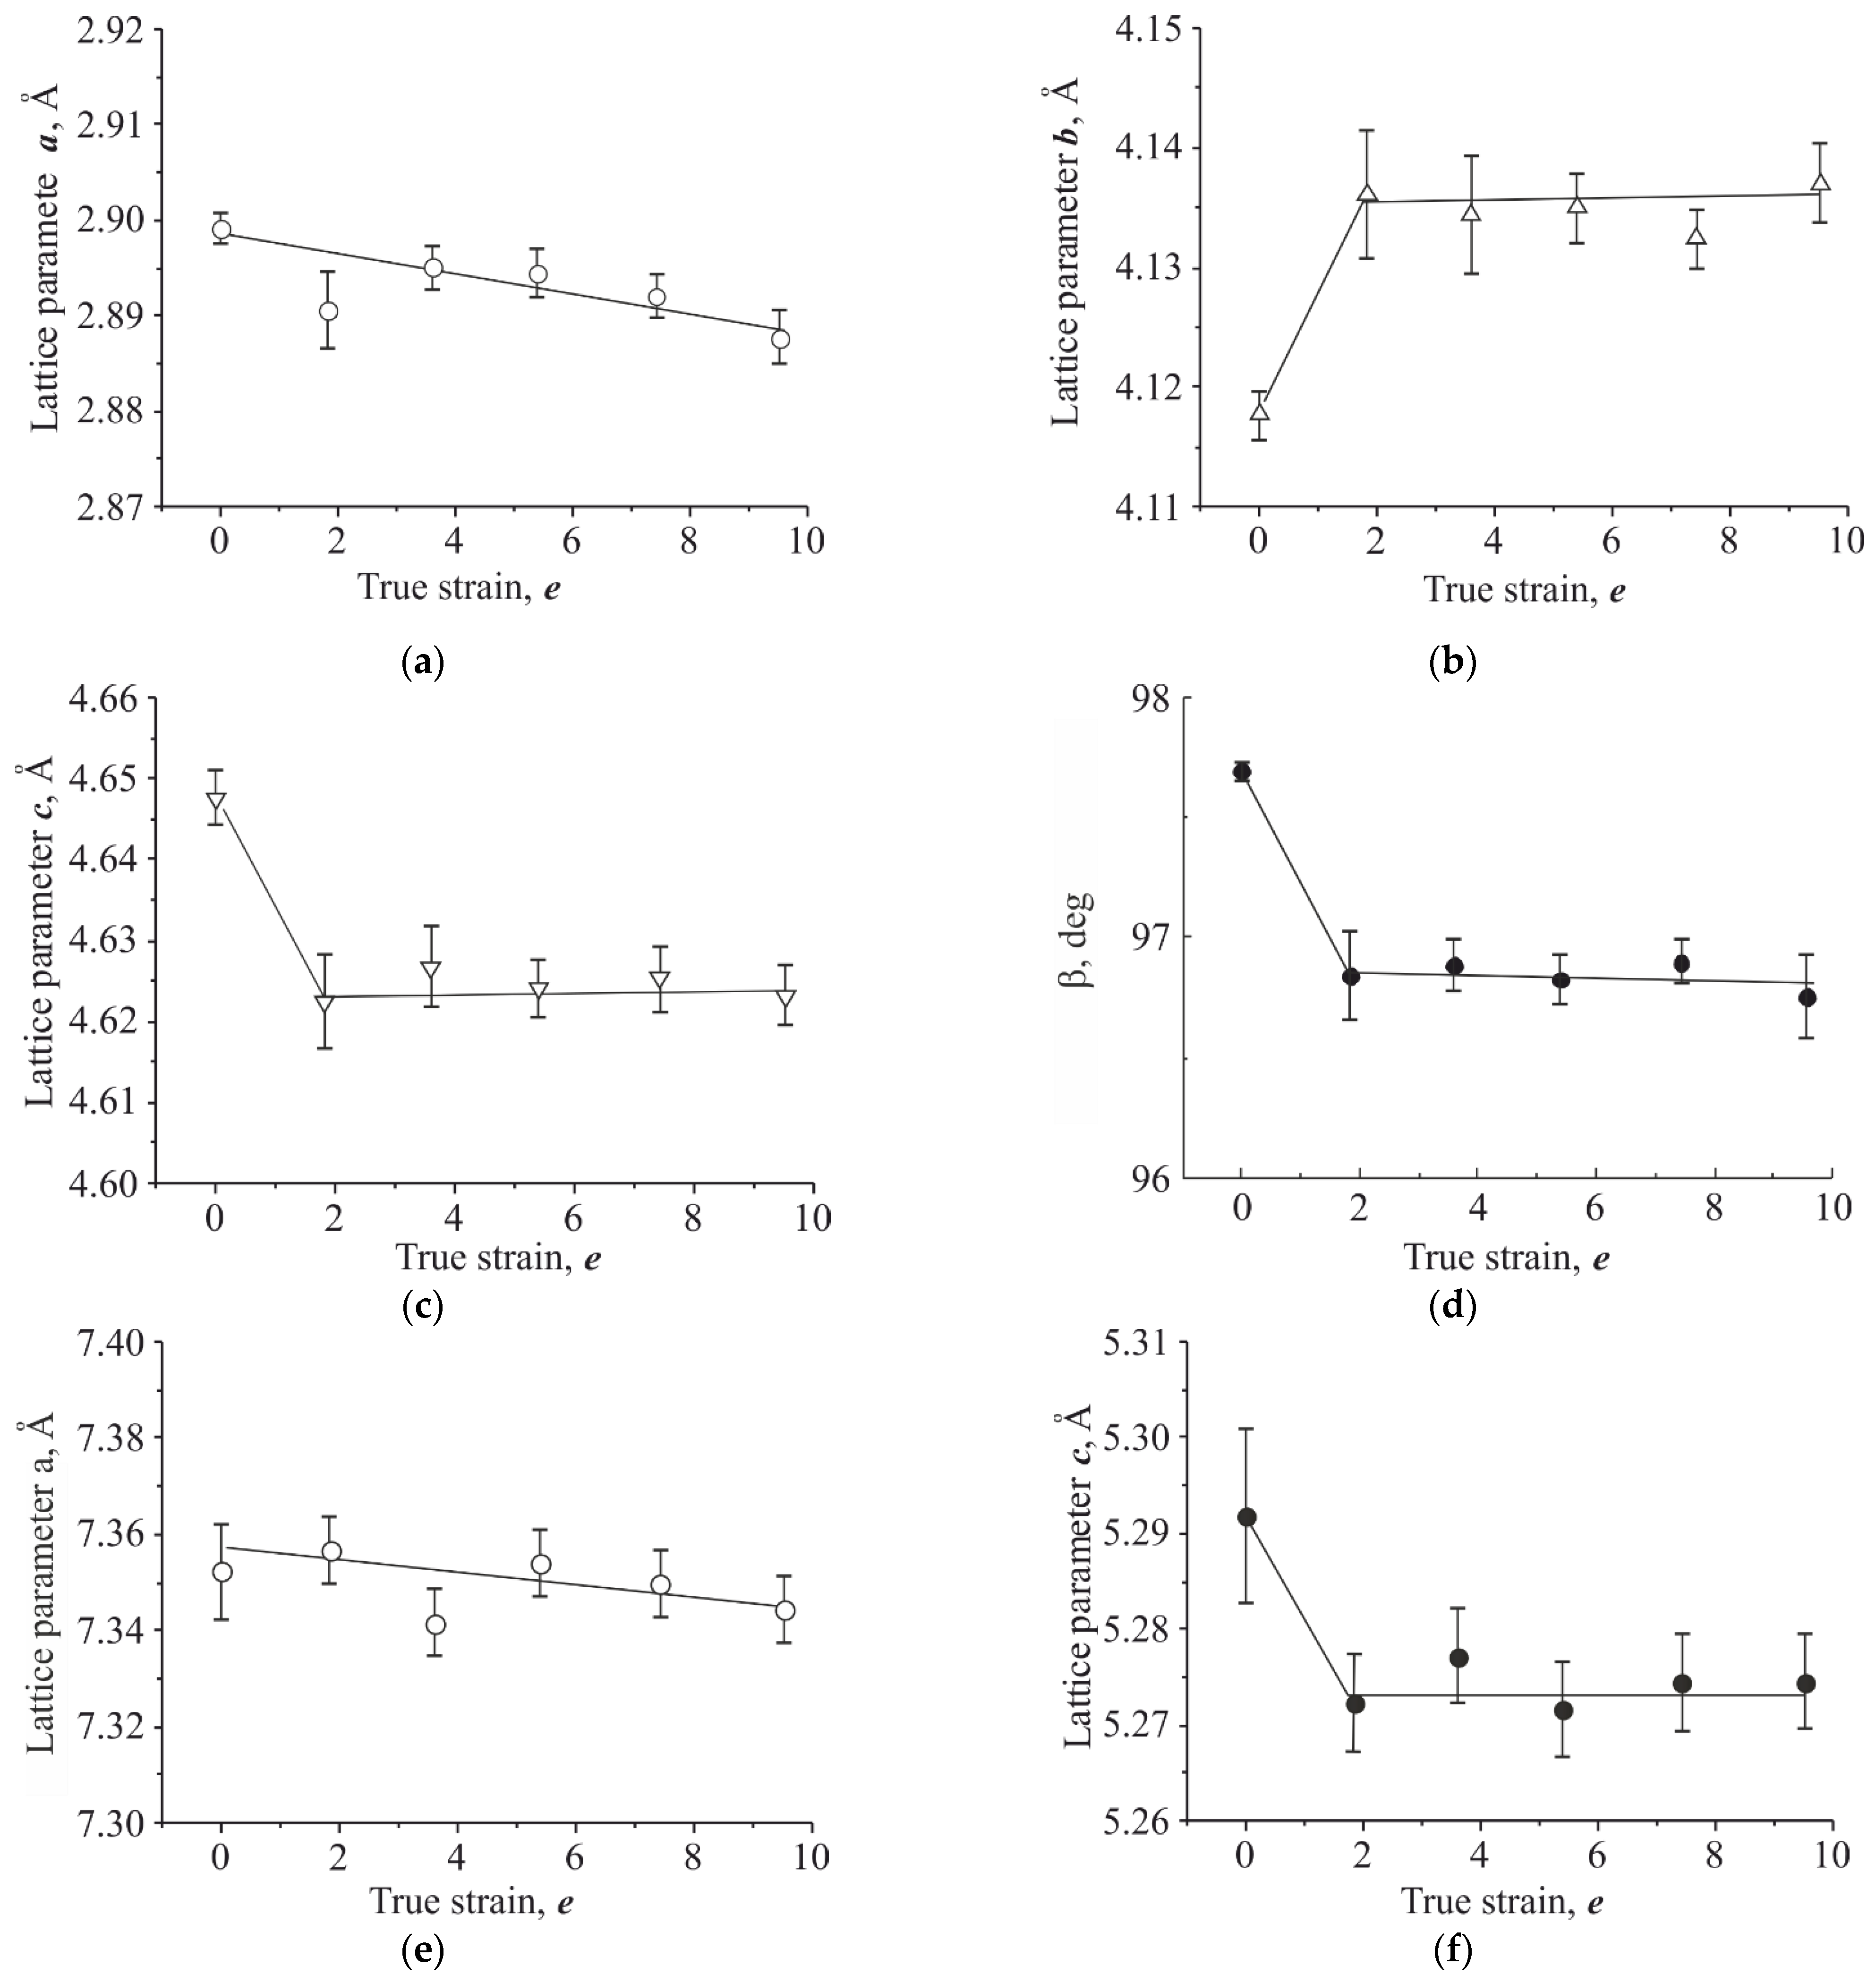
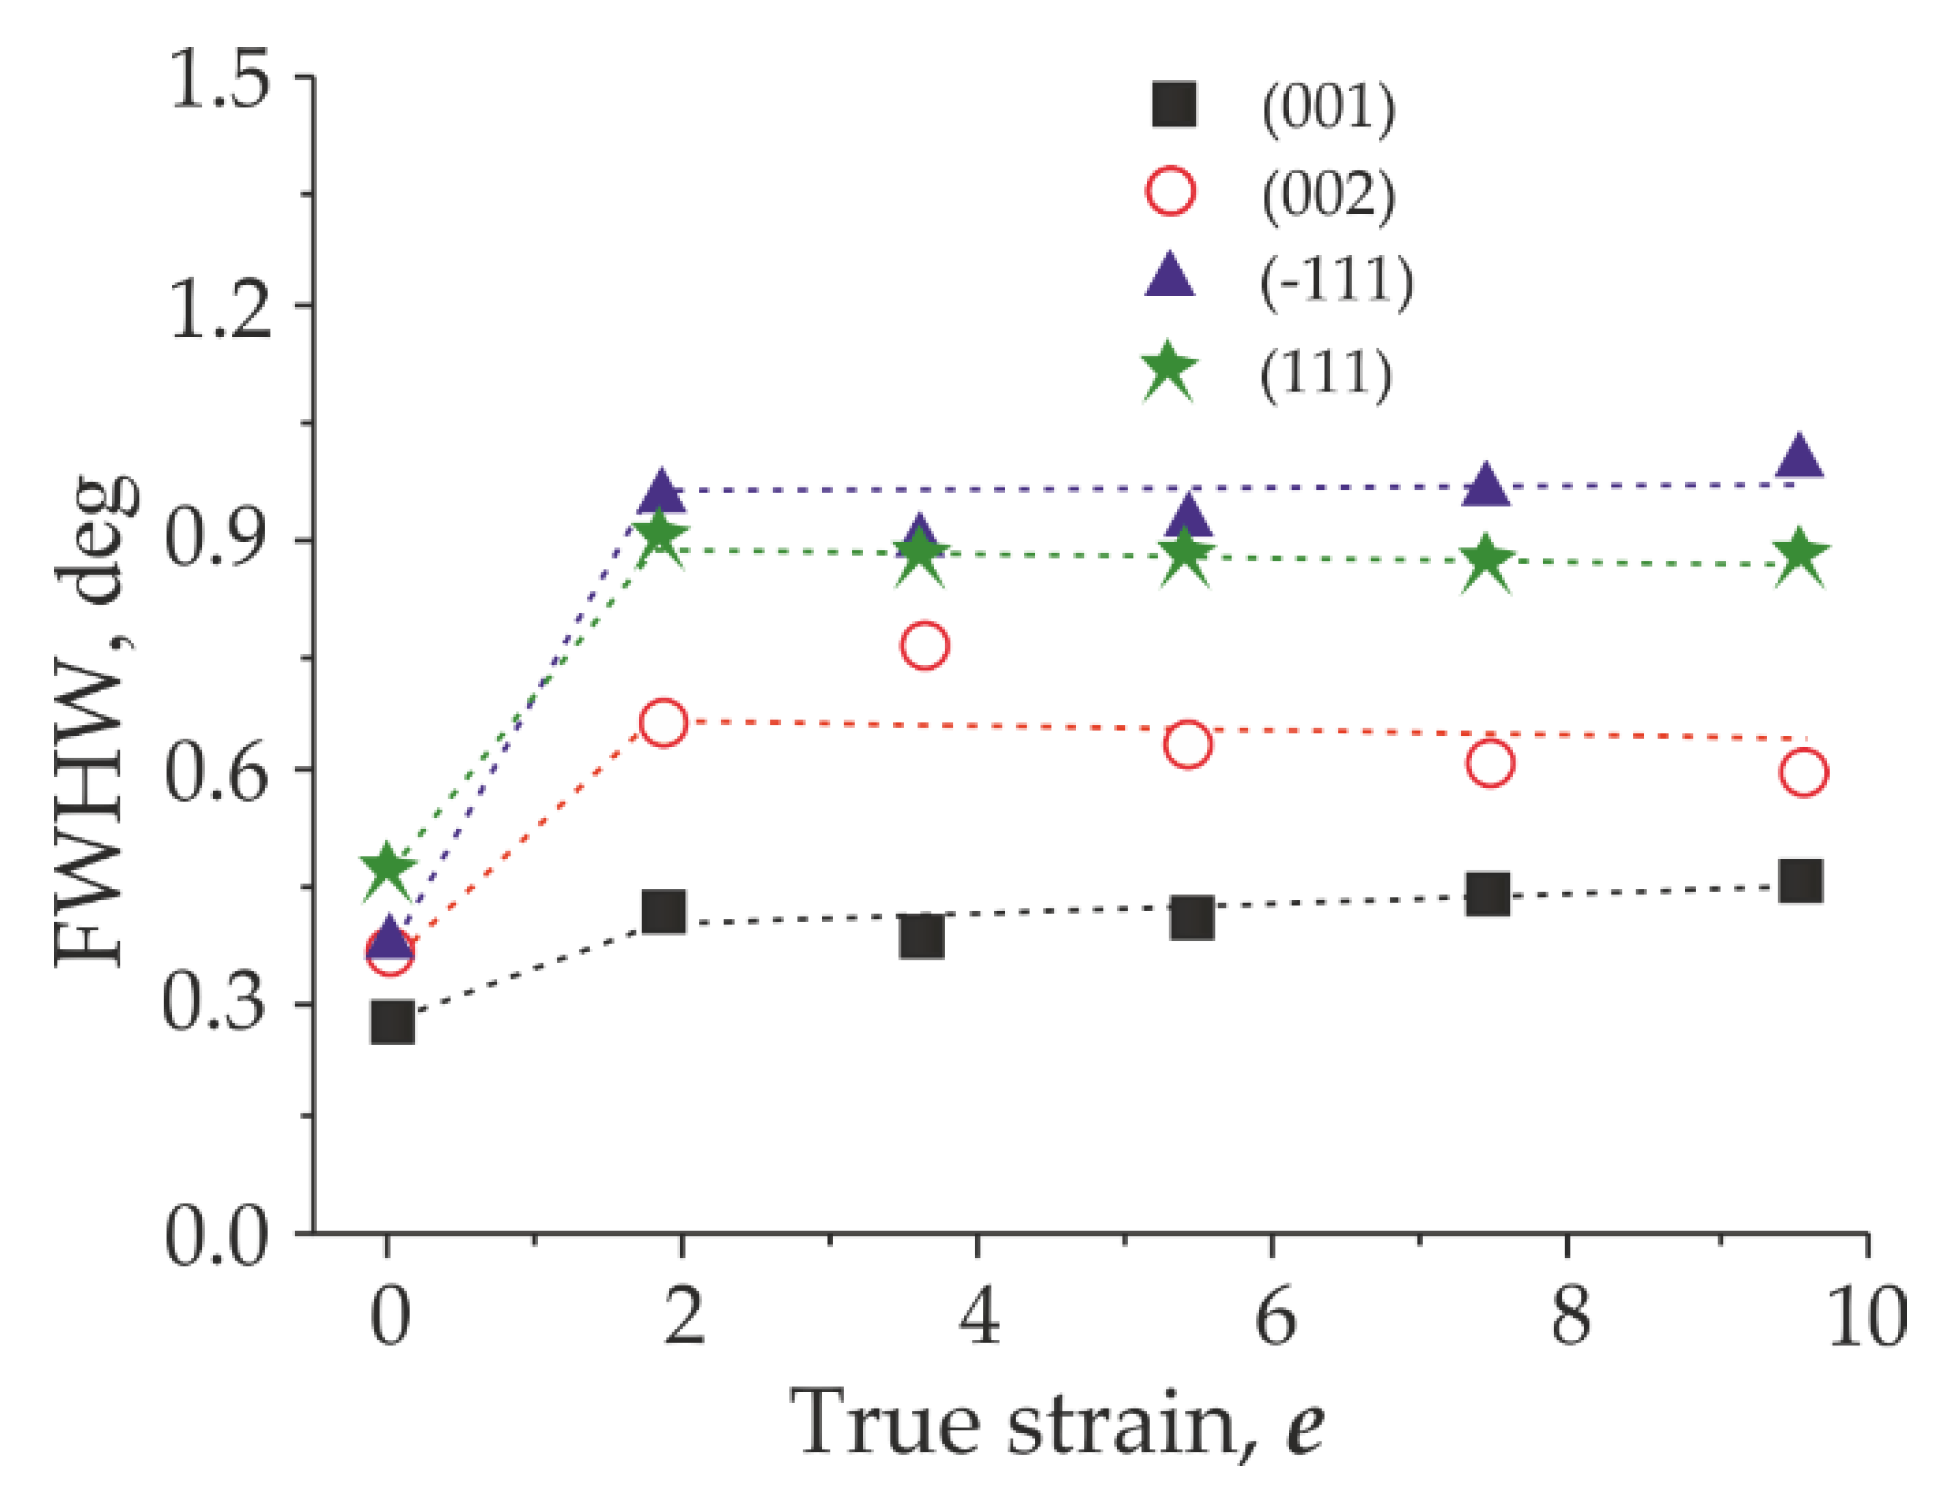
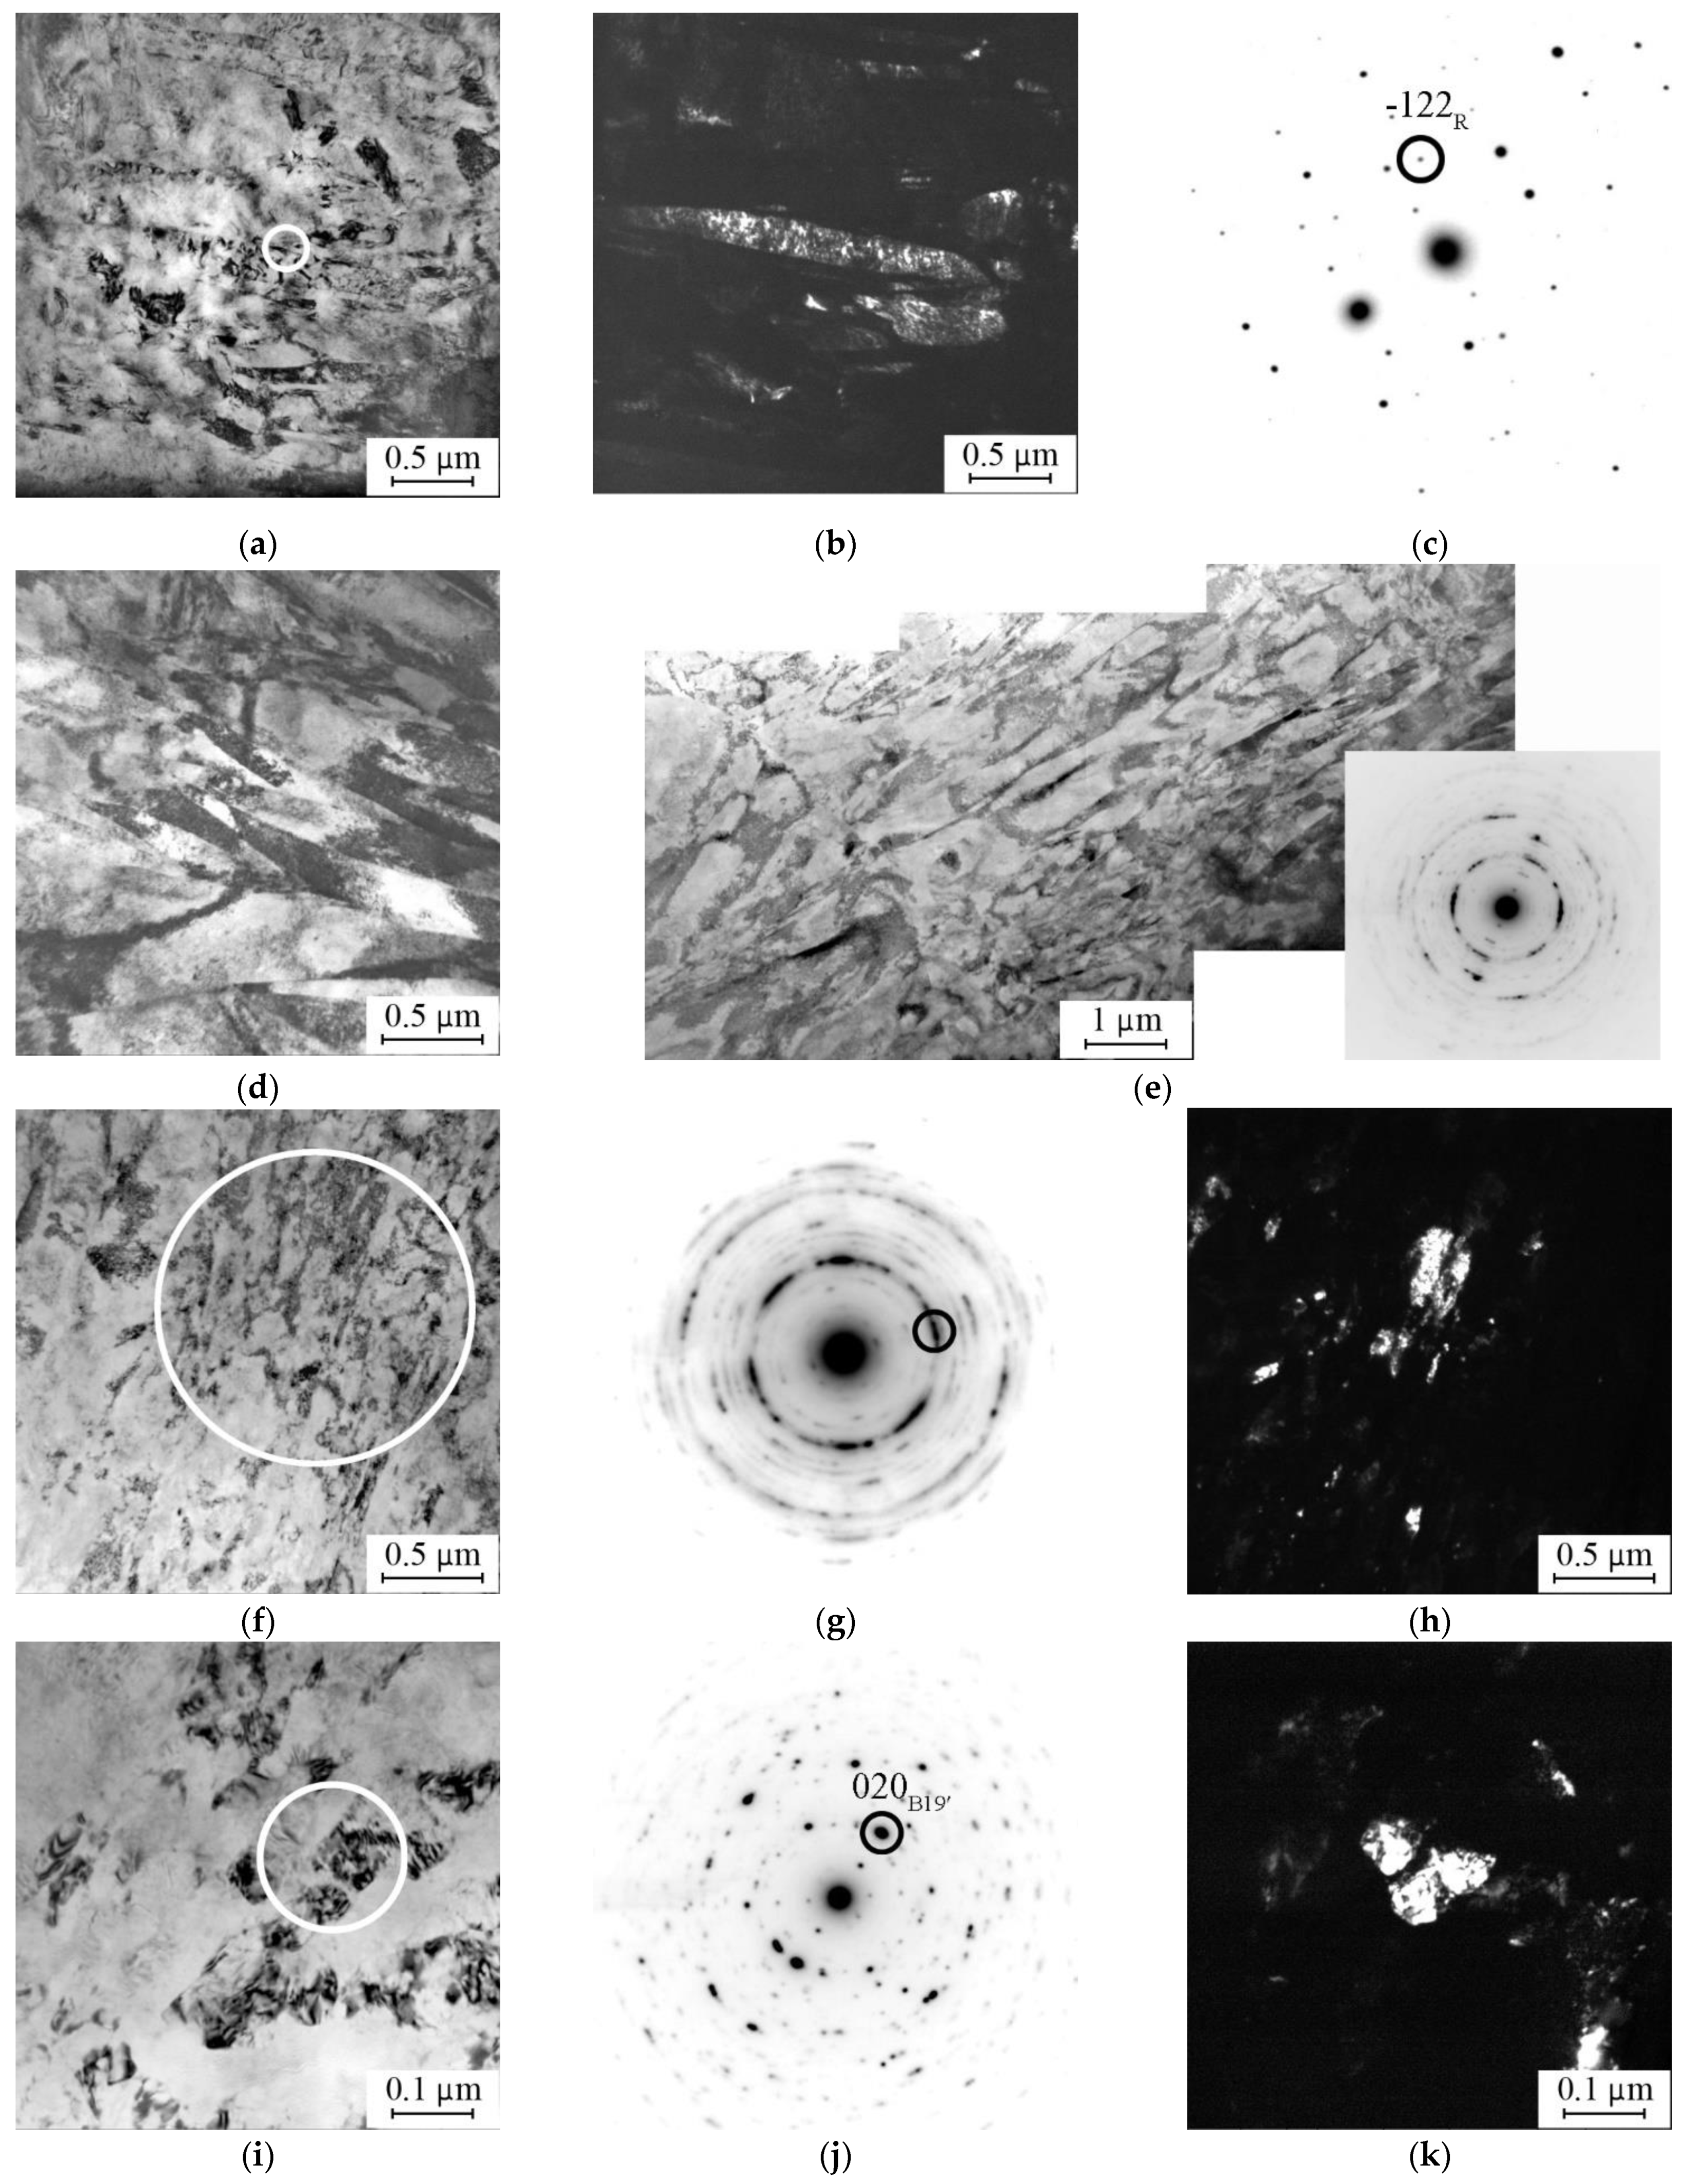
3.2. Phase States
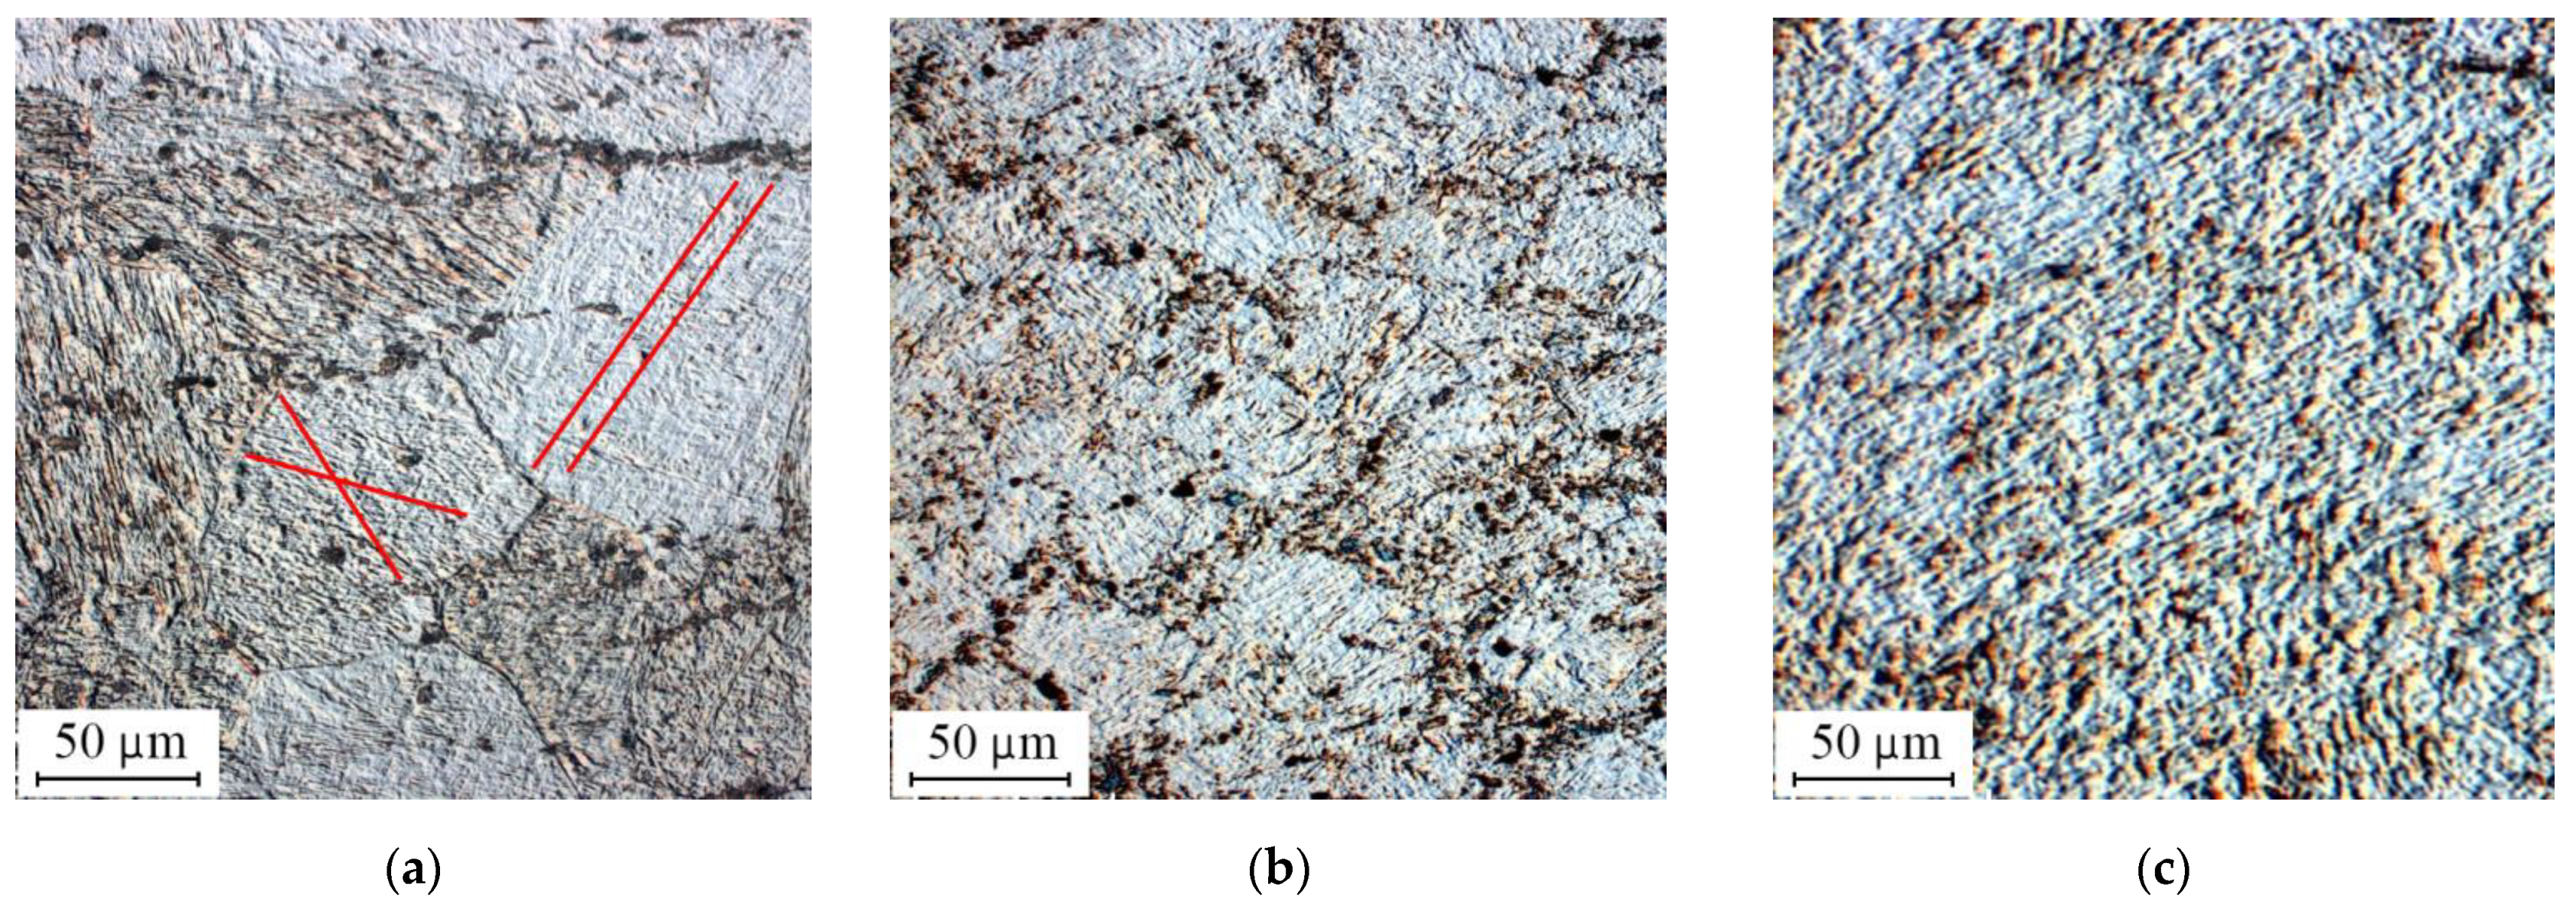
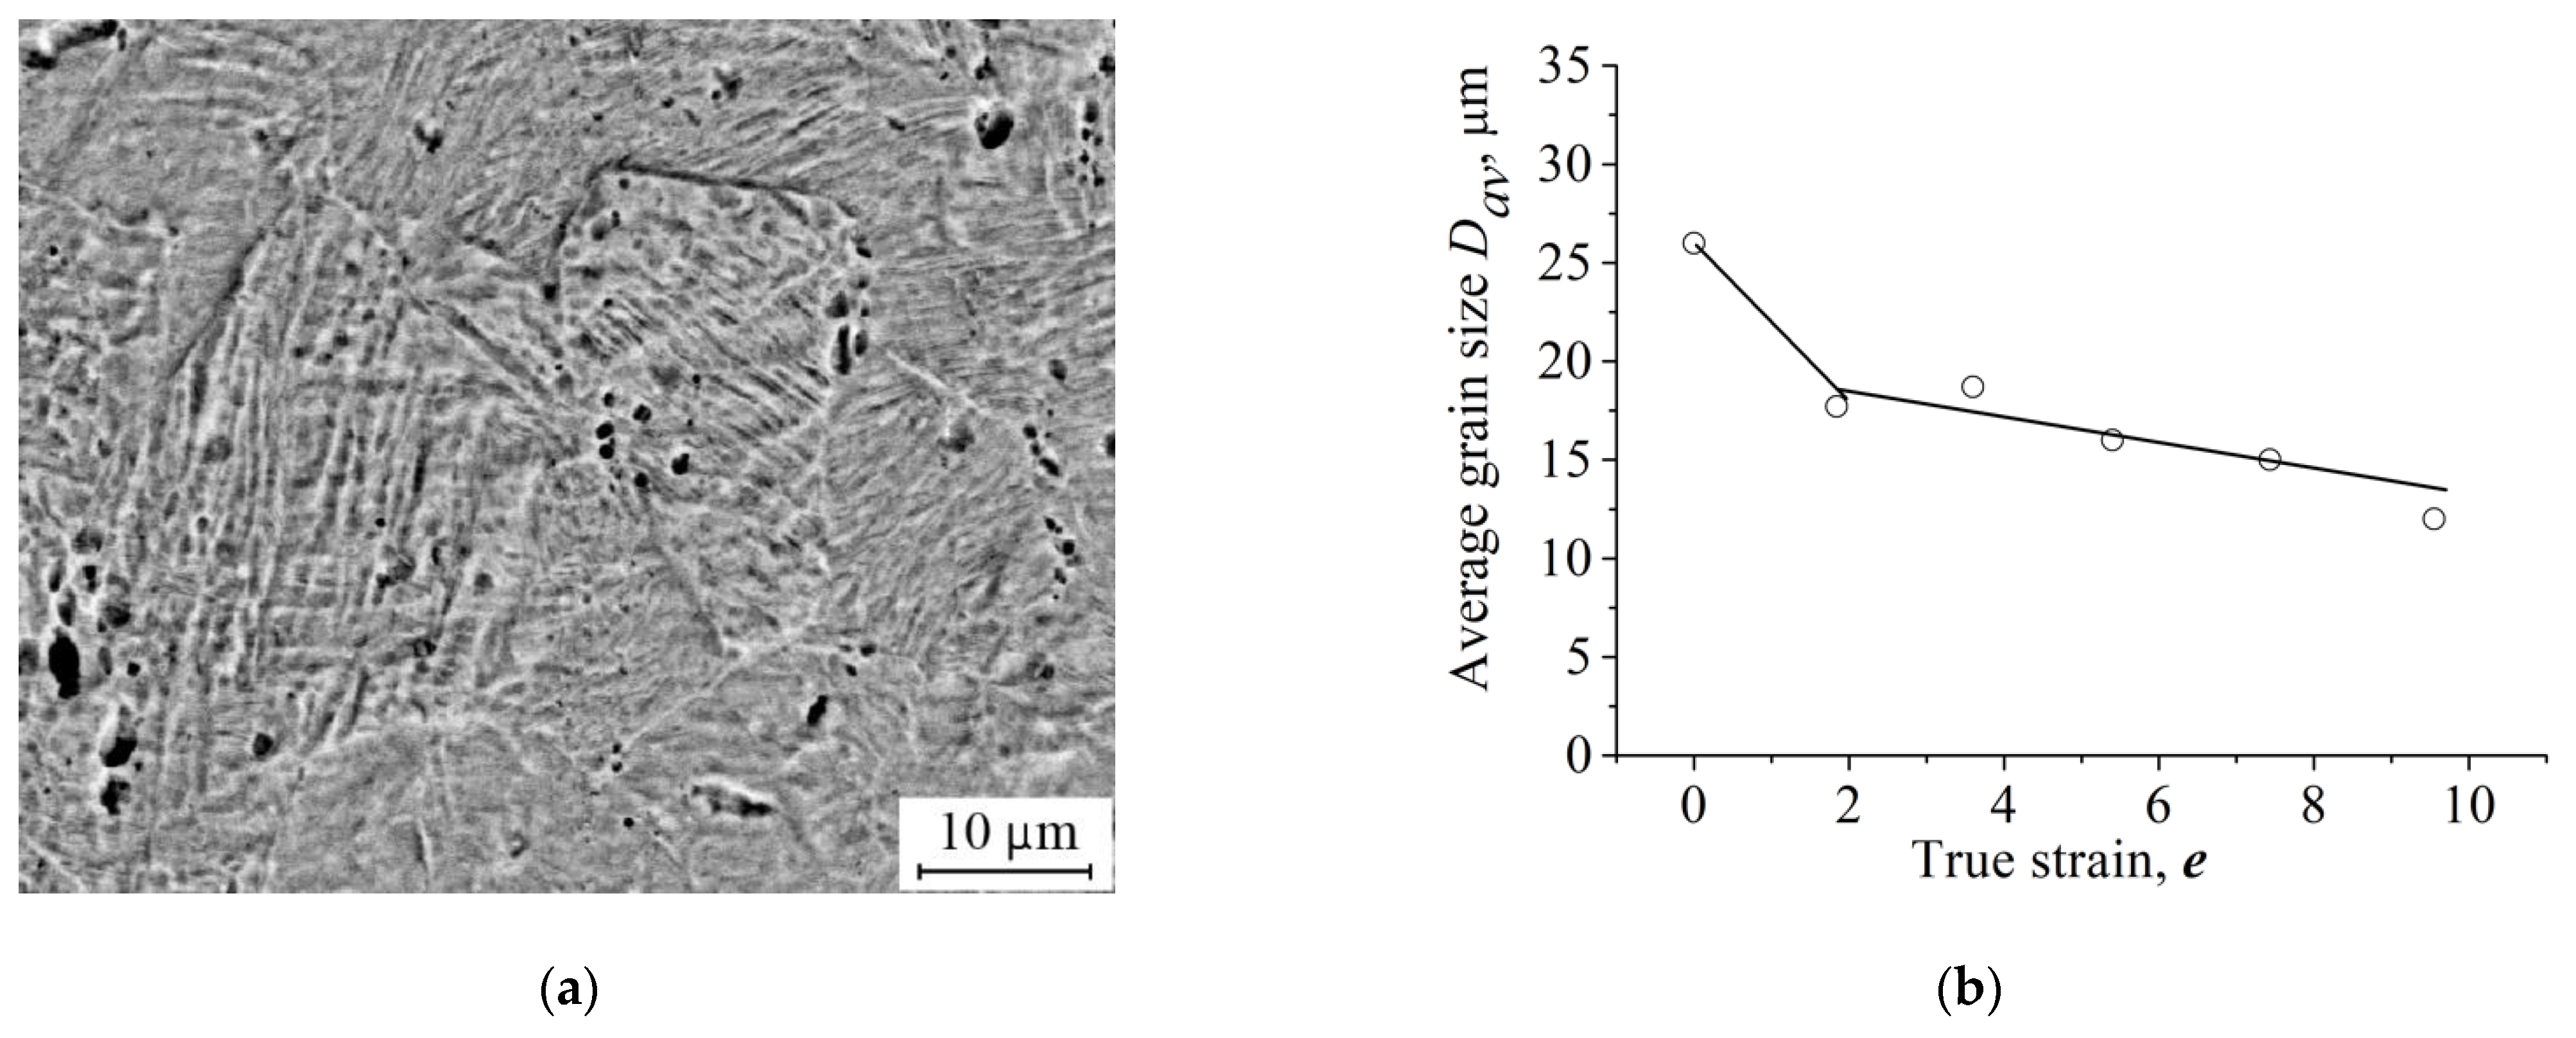
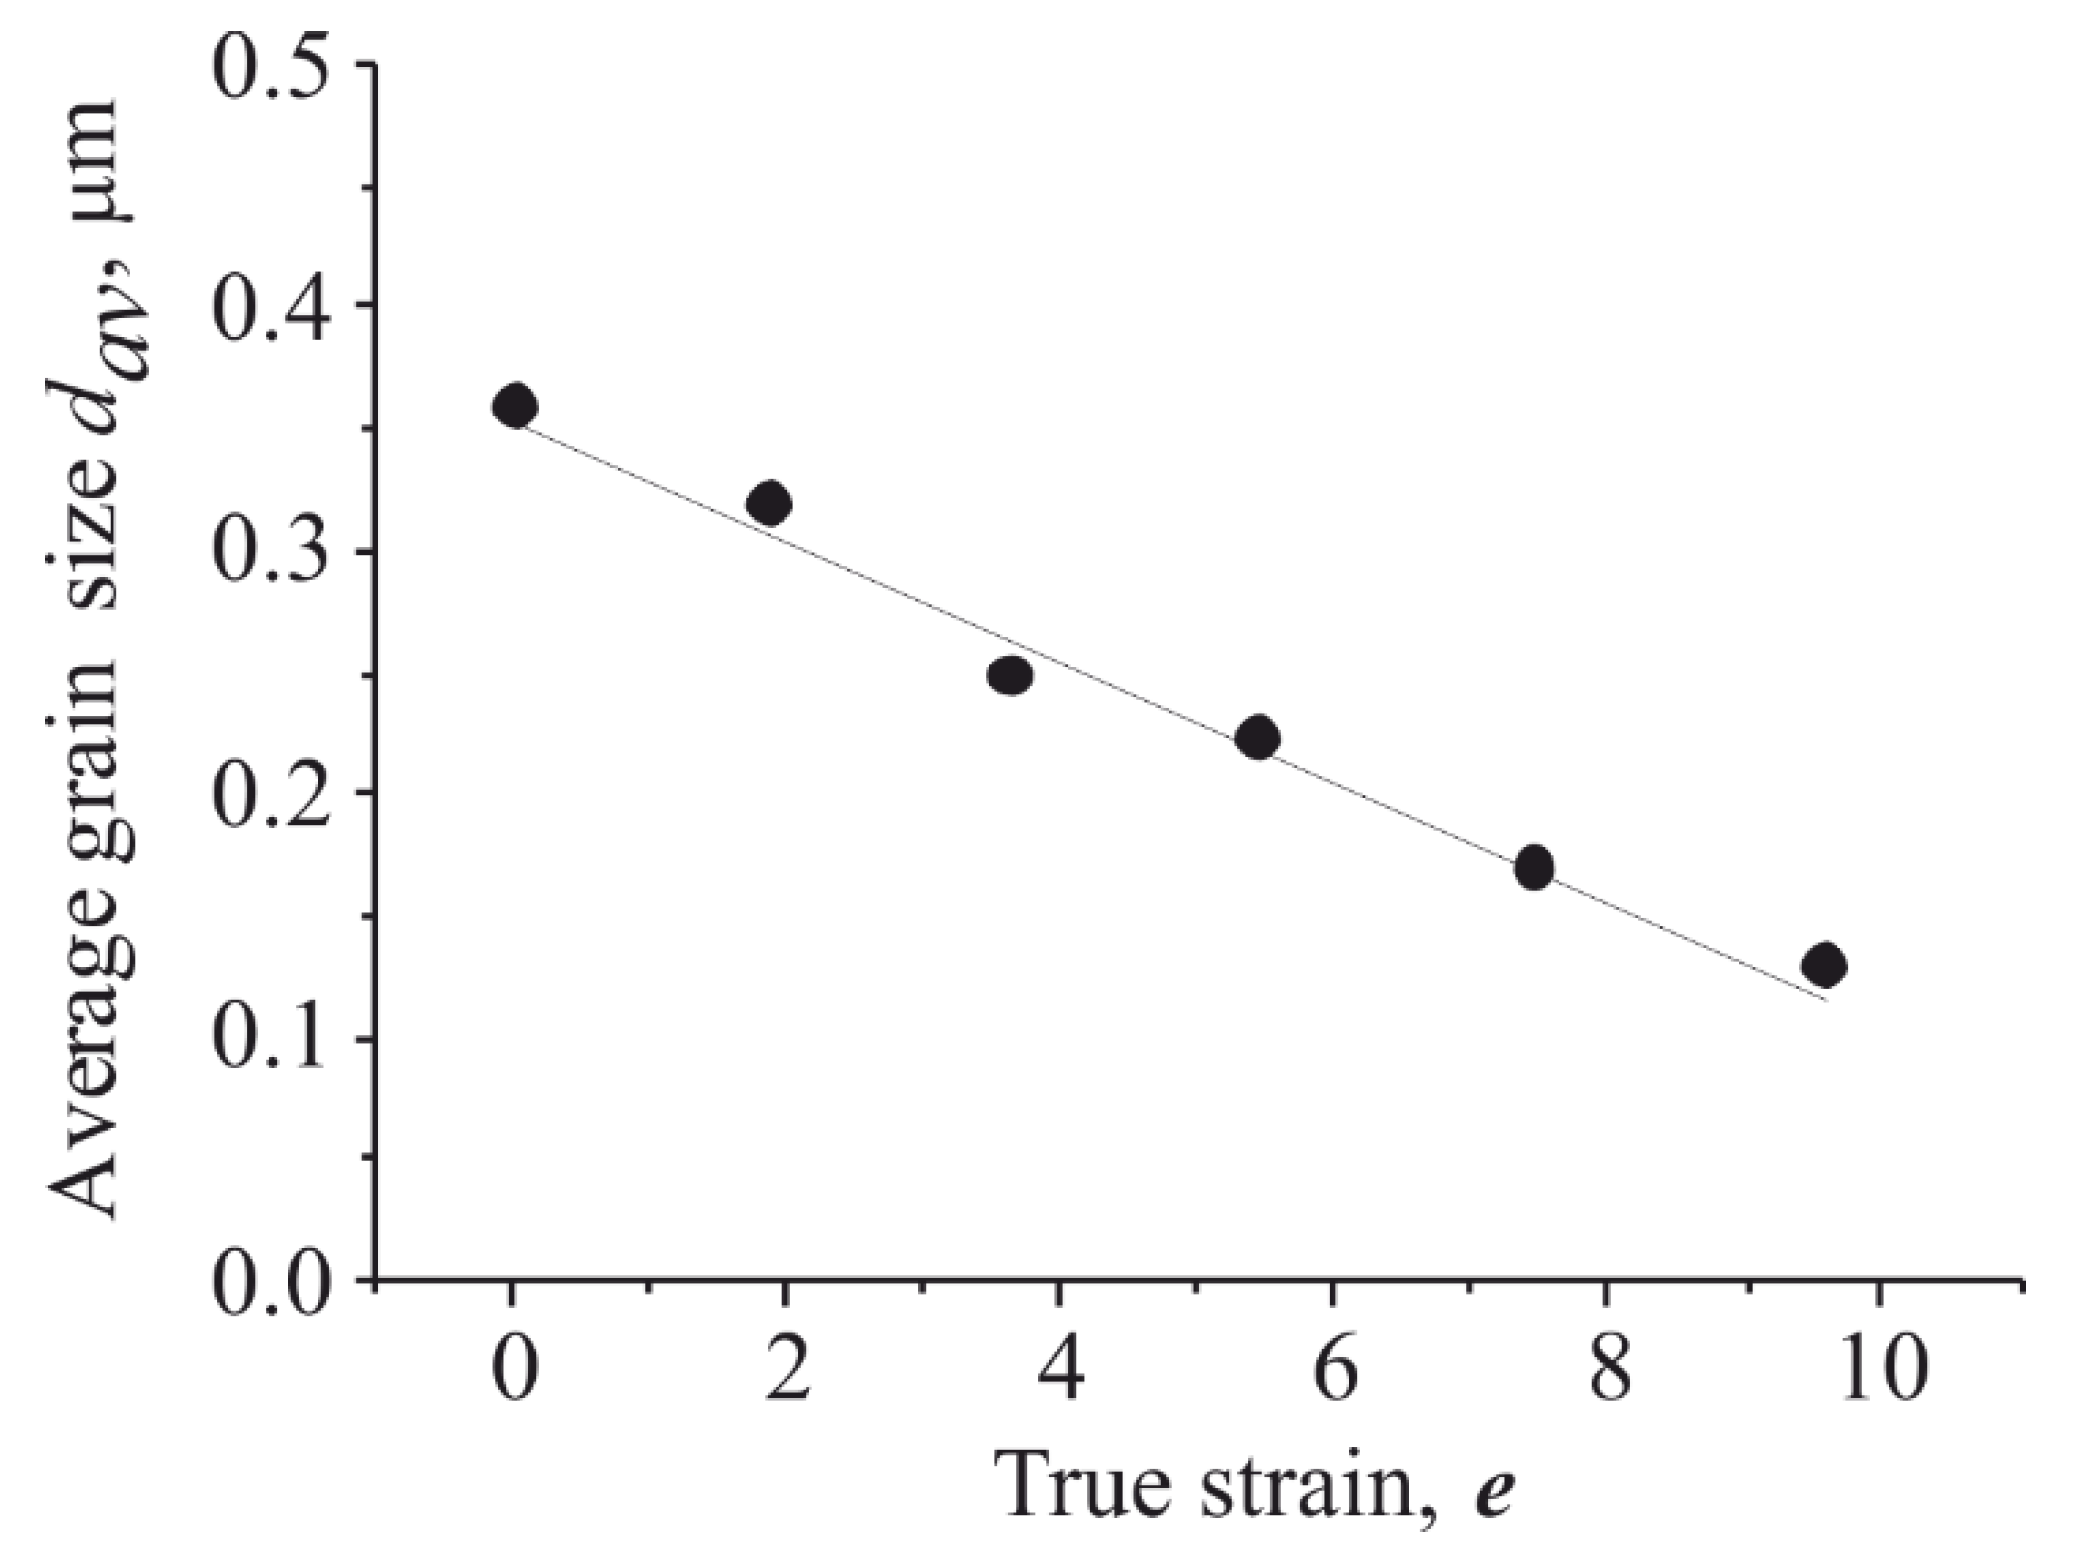
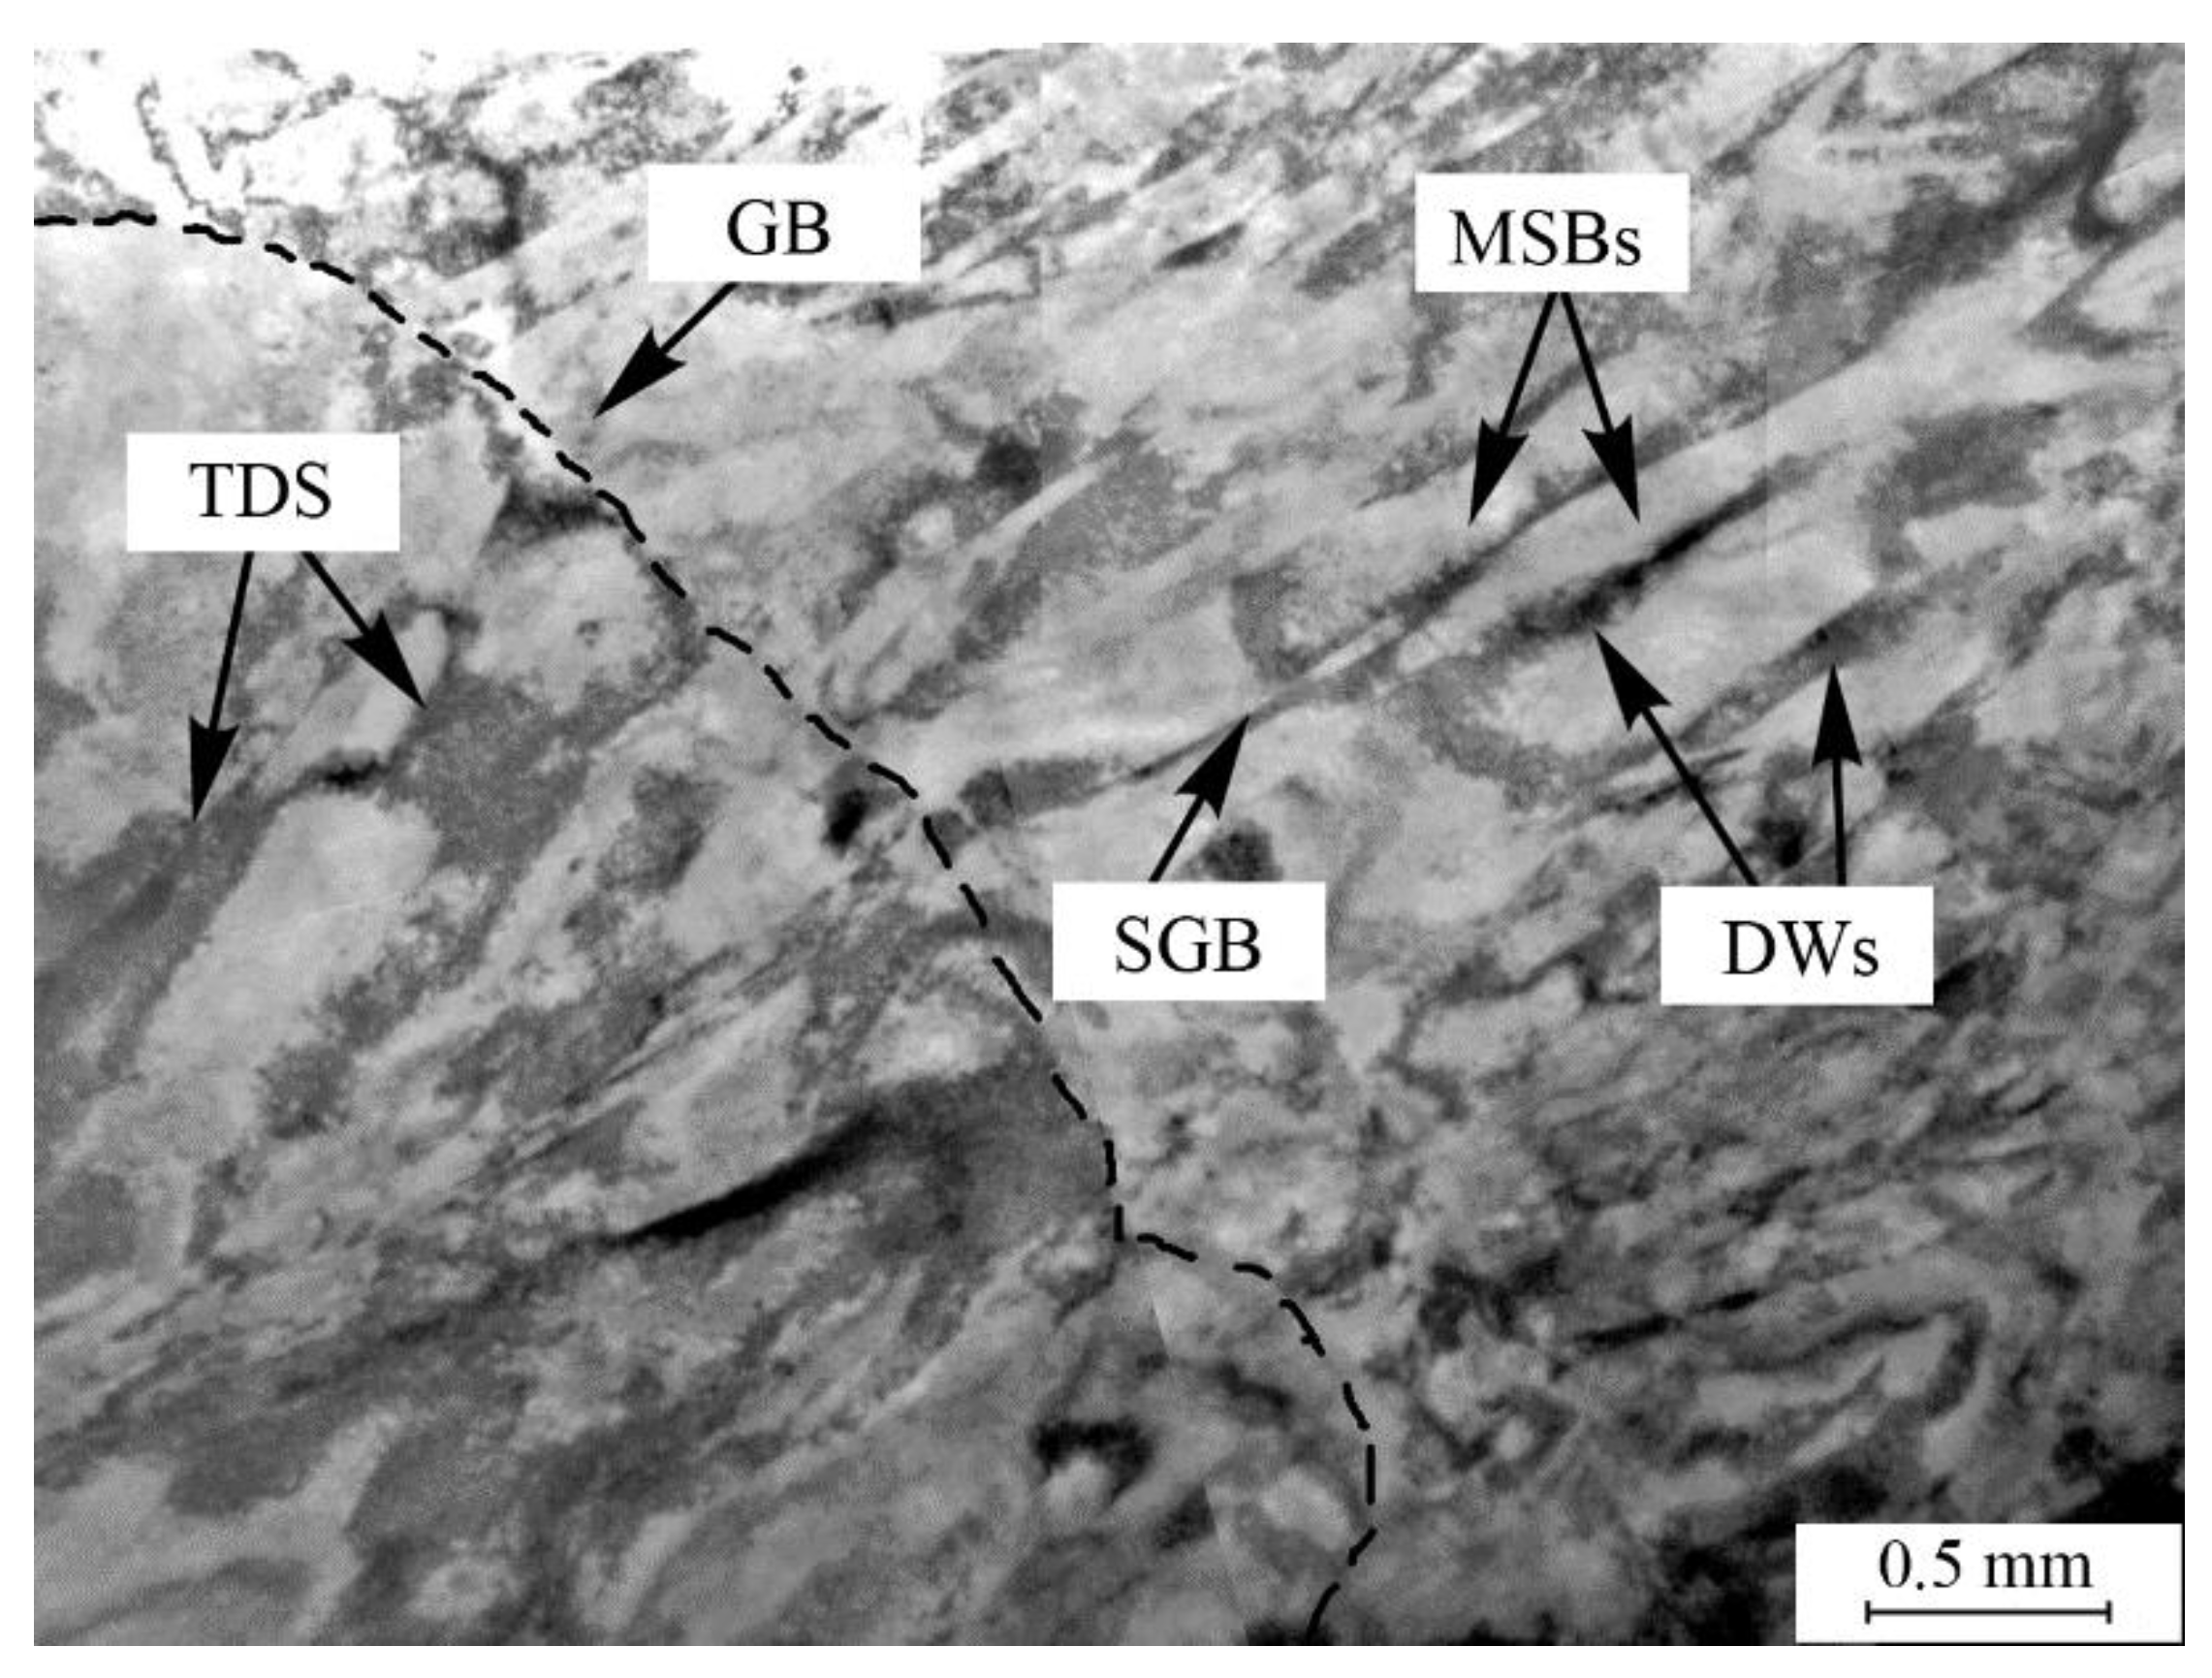
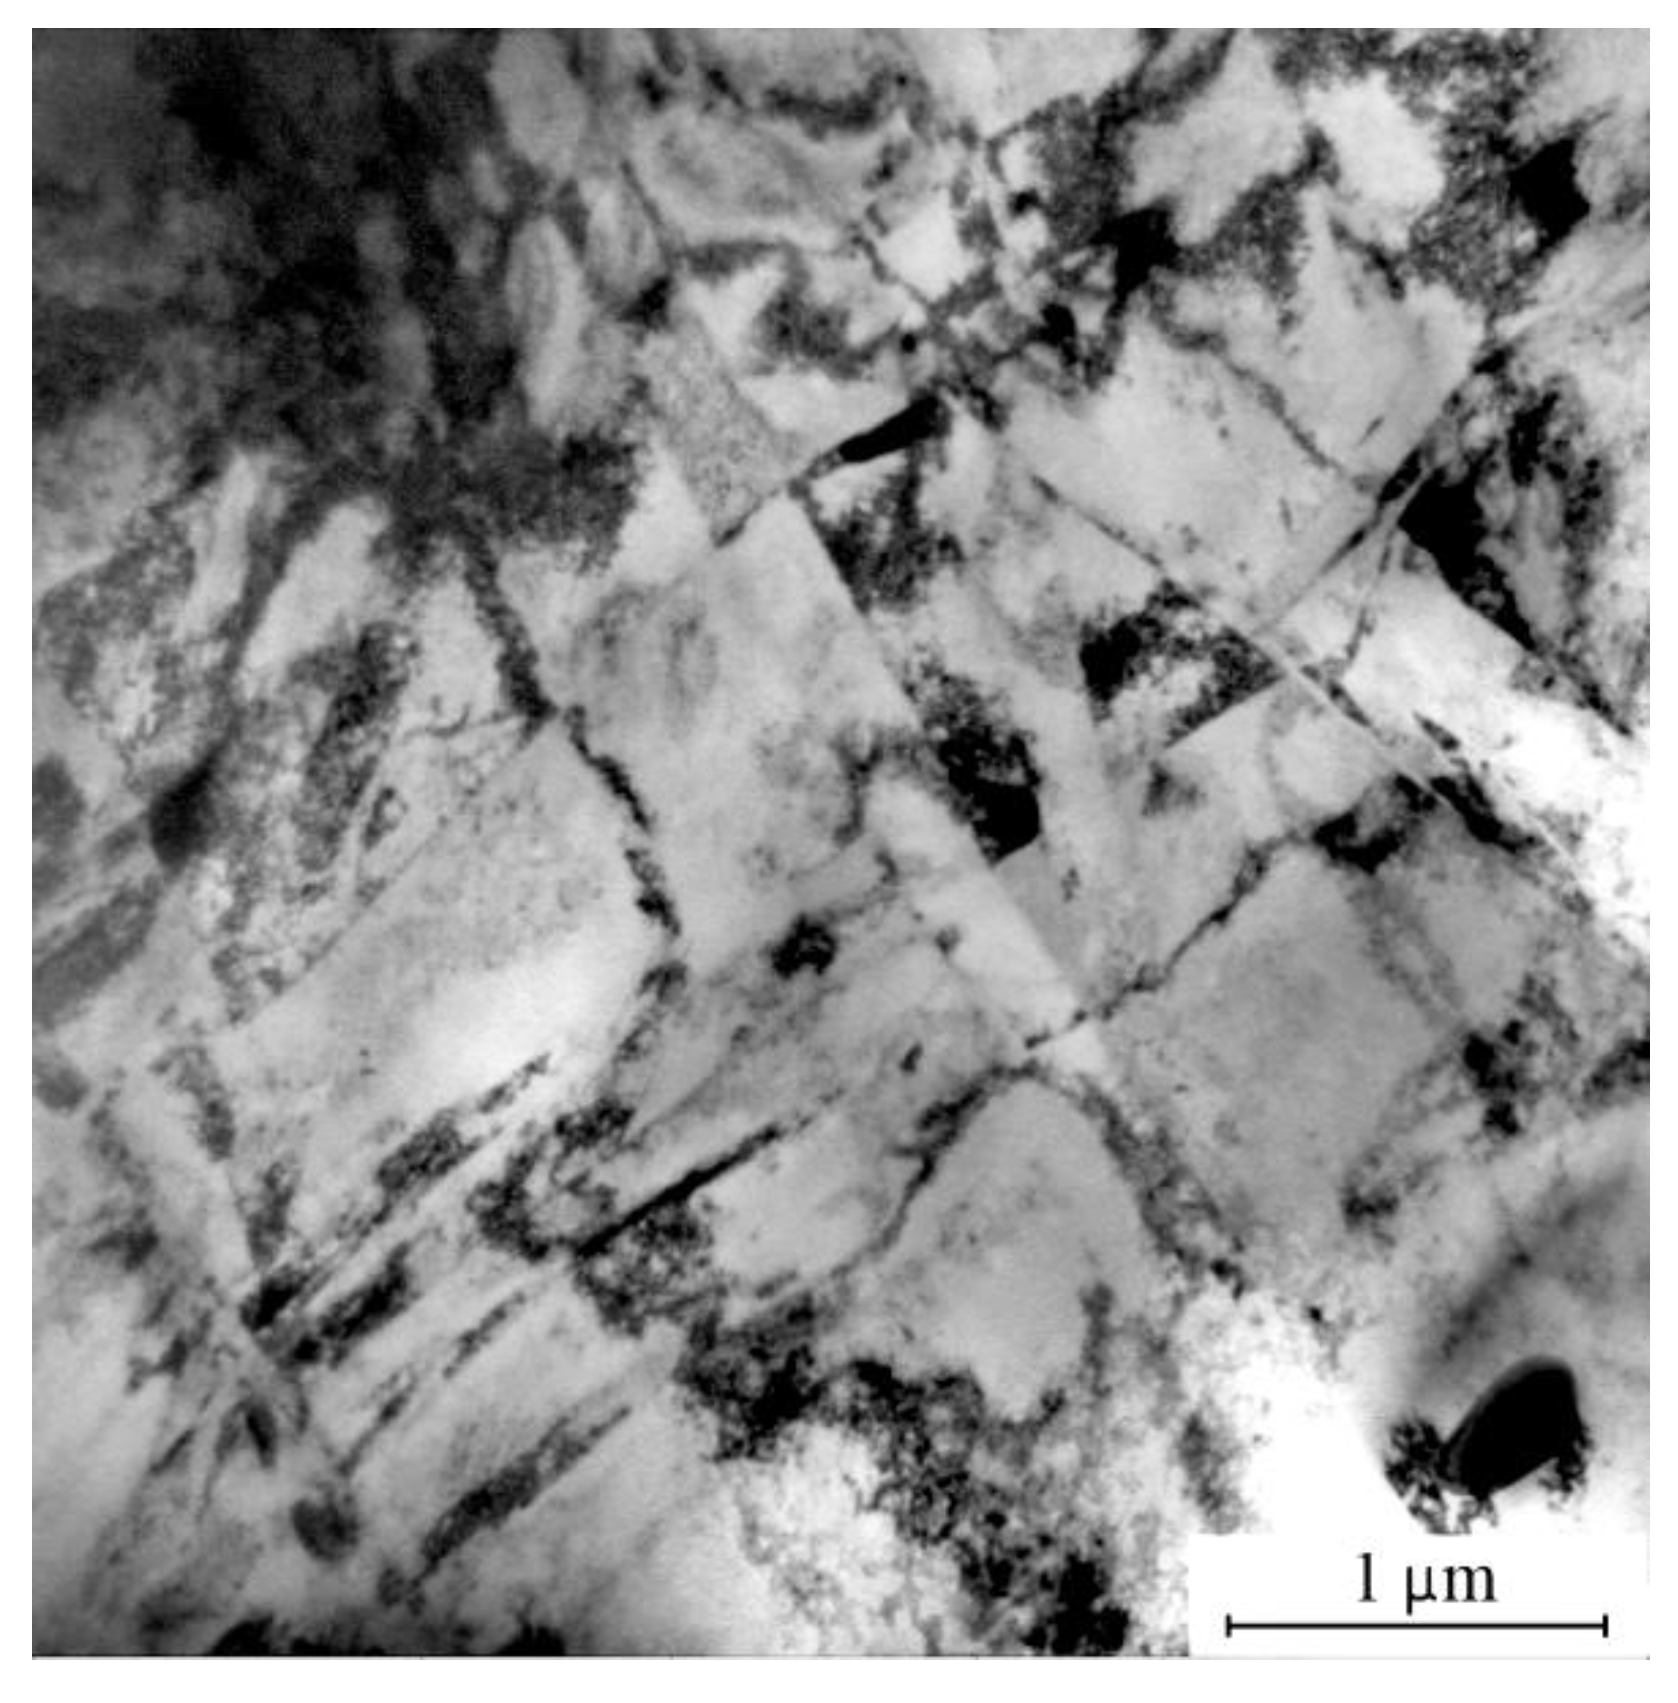
3.3. Microstructure
4. Discussion
5. Conclusions
- As the true strain e increased, the grain–subgrain structure of Ti49.8Ni50.2 was refined on different scales at a time: through decreasing the average size of parent grains on the macroscale and the size of grains–subgrains in the volume of parent grains on the microscale;
- The average grain–subgrain size attained after abc pressing to e = 9.55 at 573 K was approximately 130 nm;
- The alloy abc pressed at 573 K revealed a decrease in all martensite transformation temperatures, a change in the lattice parameters, R phase formation, and angular shifts of diffraction peaks and their broadening because the number of structural defects became larger;
- The largest change in the microstructure of Ti49.8Ni50.2 on all scales was provided by abc pressing to e = 1.84. Increasing the true strain to e = 9.55 gave a much smaller effect, suggesting that the alloy obtained a high density of structural defects even at e = 1.84;
- Likely, the grain–subgrain structure of Ti49.8Ni50.2 during abc pressing was refined by two parallel mechanisms: through the formation of a cellular dislocation substructure with its further transformation into a grain–subgrain structure and through the formation of intersecting microshear bands in the volume of grains.
Author Contributions
Funding
Data Availability Statement
Conflicts of Interest
References
- Estrin, Y.; Vinogradov, A. Extreme grain refinement by severe plastic deformation: A wealth of challenging science. Acta Mater. 2013, 61, 782–817. [Google Scholar] [CrossRef]
- Meyers, M.A.; Mishra, A.; Benson, D.J. Mechanical properties of nanocrystalline materials. Prog. Mater. Sci. 2006, 51, 427–556. [Google Scholar] [CrossRef]
- Valiyev, R.Z.; Aleksandrov, I.A. Bulk Nanostructure Metal Materials: Obtaining, Structure and Properties; Akademkniga: Moscow, Russian, 2007; p. 398. [Google Scholar]
- Pippan, R.; Scheriau, S.; Taylor, A.; Hafok, M.; Hohenwarter, A.; Bachmaier, A. Saturation of Fragmentation during Severe Plastic Deformation. Annu. Rev. Mater. Res. 2010, 40, 319–343. [Google Scholar] [CrossRef]
- Sakai, T.; Belyakov, A.; Kaibyshev, R.; Miura, H.; Jonas, J.J. Dynamic and post-dynamic recrystallization under hot, cold and severe plastic deformation conditions. Prog. Mater. Sci. 2014, 60, 130–207. [Google Scholar] [CrossRef]
- Valiev, R.; Estrin, Y.; Horita, Z.; Langdon, T.; Zehetbauer, M.; Zhu, Y. Fundamentals of superior properties in bulk nanoSPD materials. Mater. Res. Lett. 2016, 4, 1–21. [Google Scholar] [CrossRef]
- Valiev, R.Z.; Estrin, Y.; Horita, Z.; Langdon, T.G.; Zehetbauer, M.J.; Zhu, Y. Producing bulk ultrafine-grained materials by severe plastic deformation: Ten years later. JOM 2016, 68, 1216–1226. [Google Scholar] [CrossRef]
- Bagherpour, E.; Pardis, N.; Reihanian, M.; Ebrahimi, R. An overview on severe plastic deformation: Research status, techniques classification, microstructure evolution, and applications. Int. J. Adv. Manuf. Technol. 2019, 100, 1647–1694. [Google Scholar] [CrossRef]
- Lopatin, Y.G.; Chuvildeev, V.N.; Nokhrin, A.V.; Kopylov, V.I.; Pirozhnikova, O.E.; Sakharov, N.V.; Piskunov, A.V.; Melyokhin, N.V. The effect of temperature in severe plastic deformation on grain refinement limit in metals and alloys. Vestn. Lobachevsky State Univ. Nizhni Novgorod 2010, 5, 132–137. [Google Scholar]
- Prokofyev, E.A. Structure and properties of ultra-low grain TiNi alloy obtained by intensive plastic deformation. Vestn. UGATU 2006, 8, 169–174. [Google Scholar]
- Yurchenko, L.I.; Dyupin, A.P.; Gunderov, D.V.; Valiev, R.Z.; Kuranova, N.N.; Pushin, V.G.; Uksusnikov, A.N. Mechanical Properties and Structure of High-Strength Nanostructured Nickel-Titanium Alloys Subjected to ECAP and Rolling. Faz. Perekh. Uporyad. Sost. Novye Mater. 2006. Available online: http://www.ptosnm.ru (accessed on 4 October 2006).
- Khmelevskaya, I.Y.; Prokoshkin, S.D.; Trubitsyna, I.B.; Belousov, M.N.; Dobatkin, S.V.; Tatyanin, E.V.; Korotitskiy, A.V.; Brailovski, V.; Stolyarov, V.V.; Prokofiev, E.A. Structure and properties of Ti–Ni-based alloys after equal-channel angular pressing and high-pressure torsion. Mater. Sci. Eng. A 2008, 481–482, 119–122. [Google Scholar] [CrossRef]
- Kreitcberg, A.; Brailovski, V.; Prokoshkin, S.; Gunderov, D.; Khomutov, M.; Inaekyan, K. Effect of the grain/subgrain size on the strain-rate sensitivity and deformability of Ti–50 at%Ni alloy. Mater. Sci. Eng. A 2015, 622, 21–29. [Google Scholar] [CrossRef]
- Shahmir, H.; Nili-Ahmadabadi, M.; Mansouri-Arani, M.; Langdon, T.G. The processing of NiTi shape memory alloys by equal-channel angular pressing at room temperature. Mater. Sci. Eng. A 2013, 576, 178–184. [Google Scholar] [CrossRef]
- Lotkov, A.I.; Grishkov, V.N.; Kashin, O.A.; Baturin, A.A.; Zhapova, D.Y.; Timkin, V.N. Mechanisms of microstructure evolution in TiNi-based alloys under warm deformation and its effect on martensite transformations. In Shape Memory Alloys: Properties, Technologies, Opportunities; Resnina, N., Rubanic, V., Eds.; Materials Science Foundations; Trans. Tech. Publ. Ltd.: Pfäffikon, Switzerland, 2015; Volume 81–82, pp. 245–259. [Google Scholar] [CrossRef]
- Lotkov, A.I.; Grishkov, V.N.; Dudarev, E.F.; Koval, Y.N.; Girsova, N.V.; Kashin, O.A.; Tabachenko, A.N.; Firstov, G.S.; Timkin, V.N.; Zhapova, D.Y. Ultrafine Structure and Martensitic Transformation in Titanium Nickelide after Warm abc Pressing. Inorg. Mater. Appl. Res. 2011, 2, 548–555. [Google Scholar] [CrossRef]
- Lotkov, A.I.; Grishkov, V.N.; Baturin, A.A.; Dudarev, E.F.; Zhapova, D.Y.; Timkin, V.N. The effect of warm deformation by abc-pressing method on mechanical properties of titanium nickelide. Lett. Mater. 2015, 5, 170–174. [Google Scholar] [CrossRef]
- Lotkov, A.I.; Grishkov, V.N.; Dudarev, Y.F.; Girsova, N.V.; Tabachenko, A.N. Formation of ultrafine grain structure, martensitic transformations and unelastic properties of titanium nickelide after abc-pressing. Vopr. Materialoved. 2008, 1, 161–165. [Google Scholar]
- Lotkov, A.; Grishkov, V.; Zhapova, D.; Timkin, V.; Baturin, A.; Kashin, O. Superelasticity and shape memory effect after warm abc-pressing of TiNi-based alloy. Mater. Today Proc. 2017, 4, 4814–4818. [Google Scholar] [CrossRef]
- Lotkov, A.I.; Kashin, O.A.; Grishkov, V.N.; Krukovskii, K.V. The influence of degree of deformation under isothermal abc pressing on evolution of structure and temperature of phase transformations of alloy based on titanium nickelide. Inorg. Mater. Appl. Res. 2015, 6, 96–104. [Google Scholar] [CrossRef]
- Zhapova, D.Y.; Lotkov, A.I.; Grishkov, V.N.; Timkin, V.N.; Rodionov, I.S.; Kolevatov, A.S.; Belosludtseva, A.A. Inelastic properties of titanium nickelide after warm abc-pressing. Izv. Vyssh. Uchebn. Zaved. Fiz. 2016, 59, 60–63. [Google Scholar]
- Kashin, O.; Krukovskii, K.; Lotkov, A.; Grishkov, V. Effect of True Strains in Isothermal abc Pressing on Mechanical Properties of Ti49.8Ni50.2 Alloy. Metals 2020, 10, 1313. [Google Scholar] [CrossRef]
- Gunderov, D.; Lukyanov, A.; Prokofiev, E.; Kilmametov, A.; Pushin, V.; Valiev, R. Mechanical properties and martensitic transformations in nanocrystalline Ti49.4Ni50.6 alloy produced by high-pressure torsion. Mater. Sci. Eng. A 2009, 503, 75–77. [Google Scholar] [CrossRef]
- Gunderov, D.; Lukyanov, A.; Prokofiev, E.; Pushin, V.G. Mechanical properties of the nanocrystalline Ti49.4Ni50.6 alloy produced by High Pressure Torsion. Eur. Phys. J. Spec. Top. 2008, 158, 53–58. [Google Scholar] [CrossRef]
- Kockar, B.; Karaman, I.; Kulkarni, A.; Chumlyakov, Y.; Kireeva, I.V. Effect of severe ausforming via equal channel angular extrusion on the shape memory response of a NiTi alloy. J. Nucl. Mater. 2007, 361, 298–305. [Google Scholar] [CrossRef]
- Potapova, A.A.; Stolyarov, V.V. Deformability and structural features of shape memory TiNi alloys processed by rolling with current. Mater. Sci. Eng. A 2013, 579, 114–117. [Google Scholar] [CrossRef]
- Shahmir, H.; Nili-Ahmadabadi, M.; Huang, Y.; Jung, J.M.; Kim, H.S.; Langdon, T.G. Shape memory characteristics of a nanocrystalline TiNi alloy processed by HPT followed by post-deformation annealing. Mater. Sci. Eng. A 2018, 734, 445–452. [Google Scholar] [CrossRef]
- Shahmir, H.; Nili-Ahmadabadi, M.; Huang, Y.; Jung, J.M.; Kim, H.S.; Langdon, T.G. Shape memory effect in nanocrystalline NiTi alloy processed by high-pressure torsion. Mater. Sci. Eng. A 2015, 626, 203–206. [Google Scholar] [CrossRef]
- Shamsolhodaei, A.; Zarei-Hanzaki, A.; Moghaddam, M. Structural and functional properties of a semi equiatomic NiTi shape memory alloy processed by multi-axial forging. Mater. Sci. Eng. A 2017, 700, 1–9. [Google Scholar] [CrossRef]
- Shri, D.N.A.; Tsuchiya, K.; Yamamoto, A. Surface characterization of TiNi deformed by high-pressure torsion. Appl. Surf. Sci. 2014, 289, 338–344. [Google Scholar] [CrossRef]
- Tong, Y.X.; Chen, F.; Guo, B.; Tian, B.; Li, L.; Zheng, Y.F.; Gunderov, D.V.; Valiev, R.Z. Superelasticity and its stability of an ultrafine-grained Ti49.2Ni50.8 shape memory alloy processed by equal channel angular pressing. Mater. Sci. Eng. A 2013, 587, 61–64. [Google Scholar] [CrossRef]
- Tong, Y.X.; Hu, K.P.; Chen, F.; Tian, B.; Li, L.; Zheng, Y.F. Multiple-stage transformation behavior of Ti49.2Ni50.8 alloy with different initial microstructure processed by equal channel angular pressing. Intermetallics 2017, 85, 163–169. [Google Scholar] [CrossRef]
- Valiev, R.; Gunderov, D.; Prokofiev, E.; Pushin, V.; Zhu, Y. Nanostructuring of TiNi alloy by SPD processing for advanced properties. Mater. Trans. 2008, 49, 97–101. [Google Scholar] [CrossRef]
- Zhang, X.; Song, J.; Huang, C.; Xia, B.; Chen, B.; Sun, X.; Xie, C. Microstructures evolution and phase transformation behaviors of Ni-rich TiNi shape memory alloys after equal channel angular extrusion. J. Alloys Compd. 2011, 509, 3006–3012. [Google Scholar] [CrossRef]
- Gunderov, D.V.; Pushin, V.G.; Valiev, R.Z.; Prokofiev, E.A. Investigation of the nature of the high strength and ductility of the ultrafine-grained TiNi alloy obtained by equal-channel angular compression. Deform. Fract. Mater. 2007, 10, 13–21. [Google Scholar]
- Kuranova, N.N.; Gunderov, D.V.; Ukusnikov, A.N.; Luk’yanov, A.V.; Yurchenko, L.I.; Prokof’ev, E.A.; Pushin, V.G.; Valiev, R.Z. Effect of heat treatment on the structural and phase transformations and mechanical properties of TiNi alloys subjected to severe plastic deformation. Phys. Met. Metallogr. 2009, 108, 556–568. [Google Scholar] [CrossRef]
- Prokoshkin, S.D.; Khmelevskaya, I.Y.; Dobatkin, S.V.; Trubitsyna, I.B.; Tat’yanin, E.V.; Stolyarov, V.V.; Prokof’ev, E.A. Structure evolution under severe plastic deformation of shape memory alloys based on titanium nickelide. Phys. Met. Metallogr. 2004, 97, 619–625. [Google Scholar]
- Stolyarov, V.V.; Prokofiev, E.A.; Prokoshkin, S.D.; Dobatkin, S.V.; Trubitsyna, I.B.; Khmelevskaya, I.Y.; Pushin, V.G.; Valiev, R.Z. Structure, mechanical properties, and shape memory effect in TiNi alloys exposed to equal channel angular pressing. Phys. Met. Metallogr. 2005, 100, 91–102. [Google Scholar]
- Churakova, A.A.; Gunderov, D.V.; Lukyanov, A.V.; Lebedev, Y.A. Effect of thermal cycling in the range of phase transformation B2–B19′ on the microstructure and mechanical properties of UFG alloy Ti49.8Ni50.2. Lett. Mater. 2013, 3, 166–168. [Google Scholar] [CrossRef][Green Version]
- Kudoh, Y.; Tokonami, M.; Miyazaki, S.; Otsuka, K. Cristal structure of the martensite in Ti+49.2 at. % Ni alloy analyzed by the single crystal X-ray diffraction method. Acta Metall. 1985, 33, 2049–2056. [Google Scholar] [CrossRef]
- Sitepu, H. Use of synchrotron diffraction data for describing crystal structures and crystallographic phase analysis of R-phase NiTi shape memory alloy. Textures Micrjstruct. 2003, 35, 185–195. [Google Scholar] [CrossRef]
- Huang, J.Y.; Zhu, Y.T.; Jiang, H.; Lowe, T.C. Microstructures and dislocation configurations in nanostructured Cu processed by repetitive corrugation and straightening. Acta Mater. 2001, 49, 1497–1505. [Google Scholar] [CrossRef]
- Panin, V.E.; Likhachev, V.A.; Grinyaev, Y.V. Structural Levels of Deformation in Solids; Nauka: Novosibirsk, Russia, 1985; p. 255. (In Russian) [Google Scholar]


Publisher’s Note: MDPI stays neutral with regard to jurisdictional claims in published maps and institutional affiliations. |
© 2021 by the authors. Licensee MDPI, Basel, Switzerland. This article is an open access article distributed under the terms and conditions of the Creative Commons Attribution (CC BY) license (https://creativecommons.org/licenses/by/4.0/).
Share and Cite
Kashin, O.; Lotkov, A.I.; Grishkov, V.; Krukovskii, K.; Zhapova, D.; Mironov, Y.; Girsova, N.; Kashina, O.; Barmina, E. Effect of abc Pressing at 573 K on the Microstructure and Martensite Transformation Temperatures in Ti49.8Ni50.2 (at%). Metals 2021, 11, 1145. https://doi.org/10.3390/met11071145
Kashin O, Lotkov AI, Grishkov V, Krukovskii K, Zhapova D, Mironov Y, Girsova N, Kashina O, Barmina E. Effect of abc Pressing at 573 K on the Microstructure and Martensite Transformation Temperatures in Ti49.8Ni50.2 (at%). Metals. 2021; 11(7):1145. https://doi.org/10.3390/met11071145
Chicago/Turabian StyleKashin, Oleg, Aleksandr Ivanovich Lotkov, Victor Grishkov, Konstantin Krukovskii, Dorzhima Zhapova, Yuri Mironov, Natalia Girsova, Olga Kashina, and Elena Barmina. 2021. "Effect of abc Pressing at 573 K on the Microstructure and Martensite Transformation Temperatures in Ti49.8Ni50.2 (at%)" Metals 11, no. 7: 1145. https://doi.org/10.3390/met11071145
APA StyleKashin, O., Lotkov, A. I., Grishkov, V., Krukovskii, K., Zhapova, D., Mironov, Y., Girsova, N., Kashina, O., & Barmina, E. (2021). Effect of abc Pressing at 573 K on the Microstructure and Martensite Transformation Temperatures in Ti49.8Ni50.2 (at%). Metals, 11(7), 1145. https://doi.org/10.3390/met11071145