Article

Research on Parameters of Wire-Filling Laser Welding and Quenching Process for Joints Microstructure and Mechanical Property of BR1500HS Steel

1
School of Materials Science and Engineering, Wuhan University of Technology, Wuhan 430070, China
2
Hubei Center for Quality Inspection of Special Purpose Vehicles, Suizhou 441300, China
3
Suizhou-WUT Industry Research Institute, Suizhou 441300, China
*
Author to whom correspondence should be addressed.
Metals 2021, 11(7), 1047; https://doi.org/10.3390/met11071047
Submission received: 30 May 2021 / Revised: 20 June 2021 / Accepted: 23 June 2021 / Published: 30 June 2021
(This article belongs to the Section Metal Casting, Forming and Heat Treatment)

Abstract

:
With the aim to investigate the effect of parameters and the quenching process on the joint microstructure and mechanical properties of hot stamping steel by laser welding, BR1500HS boron steel was welded by wire-filling laser welding with ER70-G welding wire under different parameters. The welded specimens were heated to 900 °C and held for 5 min before water quenching. A universal material test machine, optical microscope, Vickers hardness tester, scanning electron microscope, and electron backscatter diffraction (EBSD) were used to characterize. The results show that the heat input should be greater than 1040 J/cm and the optimal wire-feeding speed is between 160 cm/min and 180 cm/min. The tensile strength of the quenched joint can reach greater than 1601.9 MPa at compatible parameters. More retained austenite distributes in the fusion zone (FZ) and fine grain zone (FGZ) than the coarse grain zone (CGZ) before quenching. However, the retained austenite in FZ and heat-affected zone (HAZ) decreases clearly and distributes uniformly after quenching. The grain diameter in FZ before quenching is not uniform and there are some coarse grains with the diameter greater than 40 μm. After quenching, the grains are refined and grain diameter is more uniform in the joint. With the increase in heat input, the microhardness of FZ and HAZ before quenching decreases from 500 HV to 450 HV. However, if the wire-feeding speed increases, the microhardness of FZ and HAZ before quenching increases from 450 HV to 500 HV. After quenching, the joint microhardness of all samples is between 450 HV and 550 HV. The fracture morphology of the joint before quenching consists of a large number of dimples and little river patterns. After quenching, the fracture morphology consists of a large amount of river patterns and cleavage facets due to the generation of martensite.

1. Introduction

The tendency of current lightweight automotive parts is the application of more and more high strength steel to reduce weight [1]. However, automobile parts inevitably need to be connected by welding technology and the heat affected zone is easily softened due to the effect of thermal circulation in the welding process for high-strength steel, which dramatically decreases the strength of the joint. In order to meet the welding demand of high-strength steel and reduce the defects in the welding process, laser welding technology has recently been applied more widely [2]. With many advantages such as high heat input, concentrated energy, fast cooling rate, narrow heat affected zone, and excellent joint properties, etc, laser welding is applied more frequently in the connection of high strength steel [3,4]. Whether conducted with filler wire material or not, laser welding can be divided into autogenous laser welding and wire-filling laser welding [5]. For autogenous laser welding, the assembly precision of the workpiece is very high and no gap is allowed in the joint. Otherwise, the slim laser beam will pass through the gap of the joint so that the base material cannot be melted fully to form a qualified joint. For wire-filling laser welding, the laser beam fuses the wire material to fill the gap to obtain the welding joint [6]. Therefore, wire-filling laser welding can allow a small gap in the joint, solving the problem of autogenous laser welding requiring a high-precision assembly of the joint [7]. Moreover, filling materials can also adjust the chemical composition of the welding joint, realize metallurgical treatment, and obtain better mechanical properties [8,9,10]. Therefore, it is meaningful to carry out an experiment to investigate the process parameters, microstructure, and mechanical properties of wire-filling laser welding for high-strength steel.
A number of researchers have conducted experiments and investigations of wire-filling laser welding for high-strength steel. Himani Siva Prasad et al. [3] investigated the stability of laser welding with respect to the parameters of gap width, welding speed, and power. Mei Yang et al. [11] studied the effect of welding speed on 2195 aluminium–lithium (Al–Li) alloy joints welded by laser and metal inert gas (laser-MIG) hybrid welding using Al–Si welding wire. Ho Won Lee et al. [12] investigated the effect of post-welding heat treatment (PWHT) of quenching and tempering (QT) on the microstructure and mechanical properties of welded boron steel joints processed using laser-arc hybrid welding on two commercial filler materials, SM80 (Type-I) and ZH120 (Type-II). Muyu Li et al. [13] researched the effects of welding speed and post quenching on the joint microstructure, microhardness, and high-temperature tensile properties.
Hot stamping steel is an advanced ultra-high-strength steel containing a few boron elements which inhibit the precipitation of ferrite during cooling, making it easier to obtain martensite with very high strength. At present, hot stamping steel has been widely used in the automobile B pillar, the anti-collision beam, and other structures [14]. However, hot stamping steel possesses a poor welding performance due to the phenomenon of the heat-affected zone (HAZ) softening after the quenching process [15,16]. Therefore, it is essential to investigate the welding process before the quenching state of hot stamping steel and the effect of the quenching process on the microstructure and mechanical properties of the joint. Furthermore, the welding process of hot stamping steel concentrates more on the autogenous laser welding method and less on the wire-feeding laser welding method. Therefore, the investigation of wire-filling laser welding for hot stamping steel requires further study.
In this paper, hot stamping steel of BR1500HS and ER70-G welding wire were used to investigate wire-filling laser welding under different parameters before specimen quenching. Then, the welded specimens were heated and quenched by water to research the effect on the laser welding parameters and quenching process for macro morphology, microstructure, microhardness, tensile strength, and fracture morphology of the welded joint.

2. Materials and Methods

2.1. Materials

The hot-rolled boron steel, BR1500HS, in 3.5 mm thickness was used as the experimental sample material, which was provided by Baosteel (Shanghai, China). The wire used for the welding process was ER70-G, with a diameter of 1.2 mm and ultimate tensile strength of 690 MPa before quenching. The chemical composition of BR1500HS and ER70-G is shown in Table 1. The ultimate tensile strength of BR1500HS before quenching is about 630 MPa with an elongation of 15%. The ultimate tensile strength of BR1500HS after quenching is between 1500 and 1800 MPa, with an elongation of 6%. The microstructure of BR1500HS before quenching consists of ferrite and pearlite. Measured by graphic analysis software at 20 times, the average area fraction of pearlite is (25.94 ± 5.06)%.

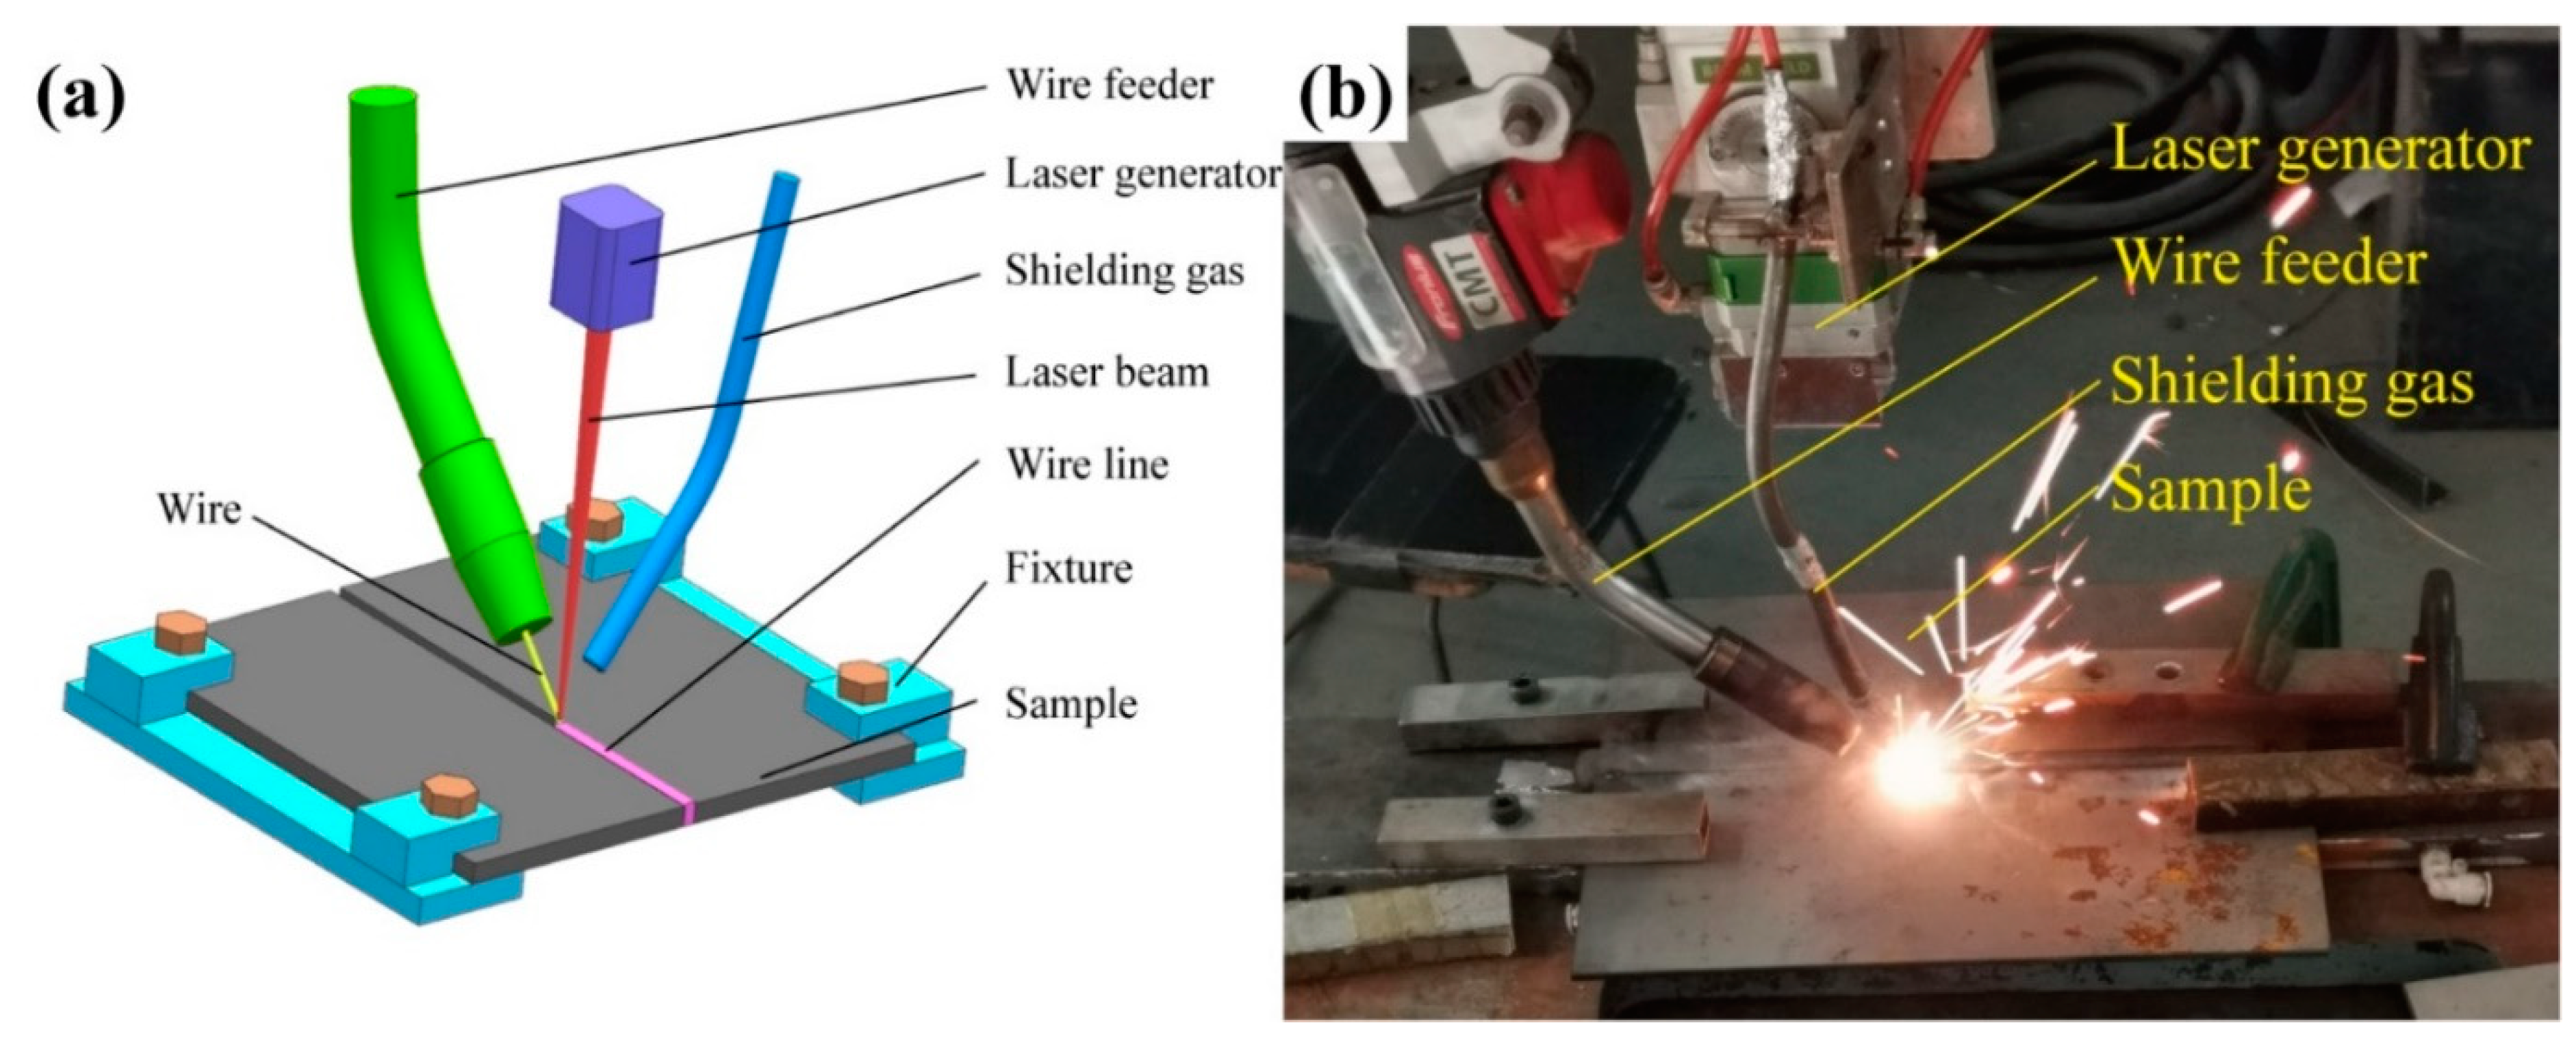
2.2. Laser Welding and Quenching

The equipment used for laser welding was RFL-C4000 fiber laser system (Raycuslaser Co., Ltd., Wuhan, China), which had a maximum power of 4000 W and wavelength of 1080 ± 5 nm. The welding process was performed by industrial robot MOTOMAN-GP50 (Yaskawa Electric (China) Co., Ltd., Shanghai, China). The sheet was processed into samples with dimensions of 240 mm × 120 mm. The samples were polished with sandpaper to remove rust and oil prior to welding. Pure argon was used as the shielding gas, with a flow of 15 L/min. For the first group of samples, the laser power was 1800 W, 2200 W, 2600 W, 3000 W, and 3400 W, while the wire-feeding speed and welding speed were fixed at 180 cm/min and 150 cm/min, respectively. For the second group of samples, the wire-feeding speed was 140 cm/min, 160 cm/min, 180 cm/min, 200 cm/min, and 220 cm/min, respectively; laser power was 2600 W; and the welding speed was 150 cm/min. The schematic of the wire-filling laser welding and the field experiment image are shown in Figure 1. When the welding process was complete, the samples were processed into tensile test specimens by wire-electrode cutting. As shown in Figure 2, the dimension of tensile test specimens was based on the standard ISO 6892-1:2019. For the quenching process, the temperature was kept at 900 °C and the samples were put into the furnace and held for 5 min before quenching in water.

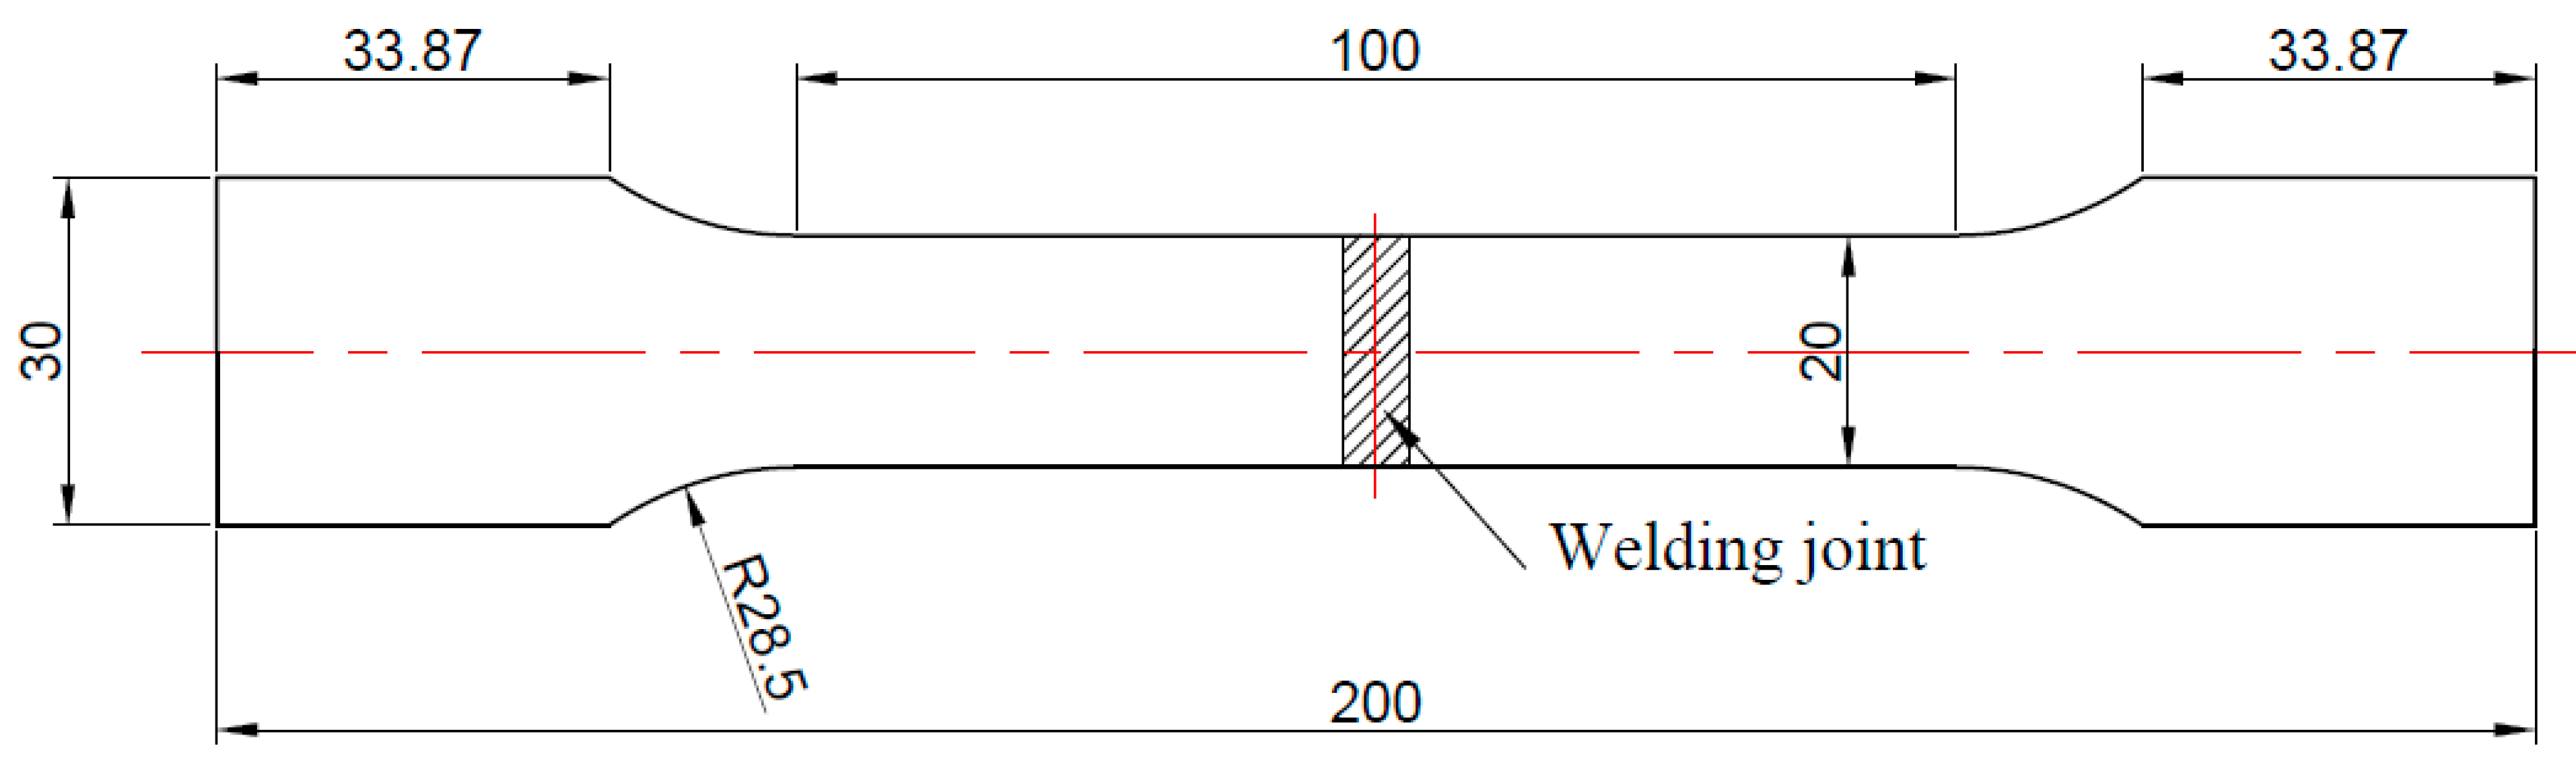
2.3. Characterization

The tensile test of samples was tested on a SHT4106 universal material test machine (MTS System, Eden Prairie, MN, USA). The tensile test was repeated 4 times for every parameter condition sample and the loading speed was 1 mm/min. Metallographic specimens were polished with 240, 400, 800, 1200, and 1500 mesh sandpaper and mechanically polished with 1 μm of diamond polishing fluid. Then, specimens were corroded with 4% nitric acid alcohol for 10 s to 20 s and then washed by anhydrous alcohol. The Axio Scope A1 (ZEISS, Jena, Germany) optical microscope (OM) was used to observe the macrostructure of the joint and microstructure of the heat-affected zone. The macrostructure and microstructure were observed at 25 times and 500 times, respectively. The electron backscatter diffraction (EBSD) specimens were first burnished with sandpaper. The specimens were then polished with 9 μm, 3 μm, and 1 μm diamond polishes, and then finally polished with OPS. The EBSD test was performed using Quanta FEG 450 scanning electron microscopes (SEM) with EBSD detector (EDAX, LLC., Mahwah, NJ, USA) to obtain the grain diameter, grain orientation, and fraction of retained austenite. The microhardness of the weld joint was tested by HV-1000A (Laizhou Huayin, Laizhou, China) Vickers hardness tester, with loading force of 500 g (4.9 N) and pressure holding time of 10 s. The position of the microhardness test of the joint is shown in Figure 3. The distance between the two microhardness test points was 0.1 mm. The microhardness test was repeated 3 times for each series of samples and the average value was calculated as the final result. The fracture morphology of tensile specimens was observed by Hitachi SU8010 (Hitachi, Ltd., Tokyo, Japan) high-resolution field emission scanning electron microscope (SEM) at 3000 times.

3. Results and Discussion

3.1. Tensile Test Results

The tensile strength and fracture position of the samples before and after quenching are shown in Table 2. Before quenching, the tensile strength of samples No.1#, No.2#, and No.6# were 398.5 ± 17.4 MPa, 557 ± 28.1 MPa, and 588.9 ± 9.8 MPa, respectively, and their fracture position was on the joint. The fraction position of all other samples before quenching was on the base material (BM). The tensile strength of BR1500HS after quenching can reach 1800 MPa at maximum, which is difficult for the welded joint to exceed. It can be seen on Table 2 that fracture positions of all samples after quenching are on the welded joint.

3.2. Macrostructure and Tensile Strength

The macrostructure has a significant influence on the surface quality and strength of the joint. For welded joints, defects such as underfill, crack, and weld porosity have serious effects on the weld appearance and joint mechanical properties. Therefore, the weld joint should not contain underfill defects, cracks, and weld porosities [17,18,19]. Furthermore, the shape of the joint cross-section requires a flat or convex face. Heat input and wire-feeding speed of wire-filling laser welding have remarkable influences on the macrostructure and strength of the joint. If the heat input is incompatible with the wire-feeding speed, some defects may occur in the welded joint and induce poor mechanical properties.

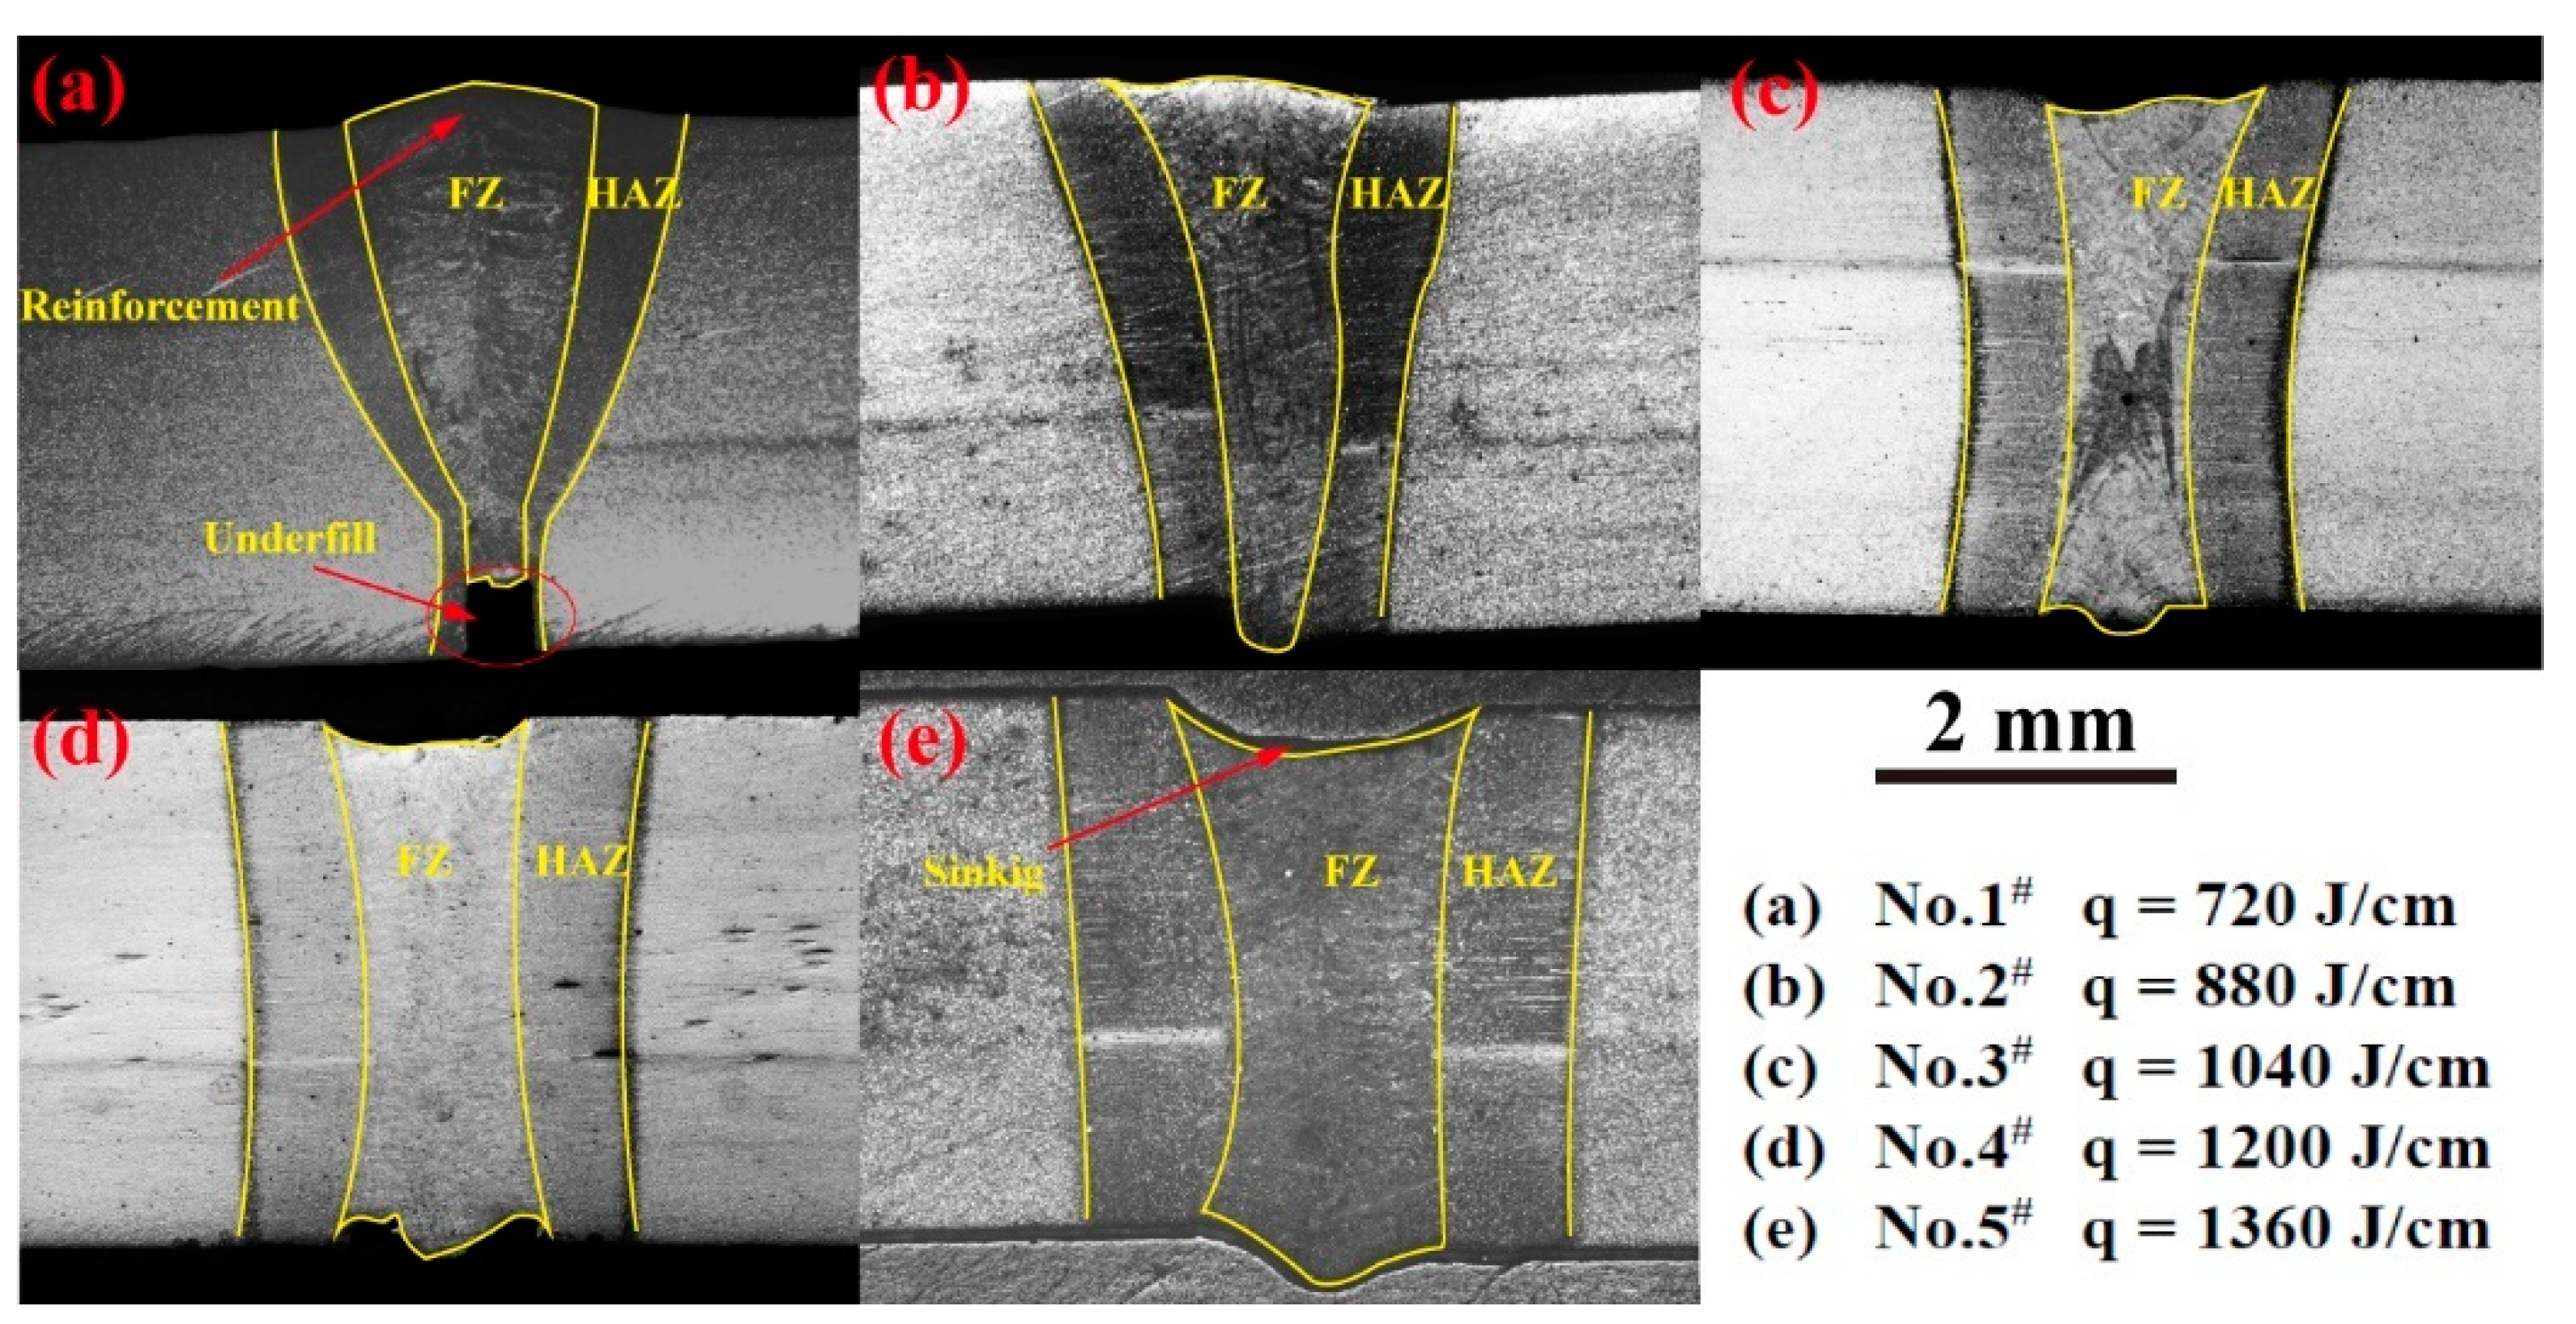
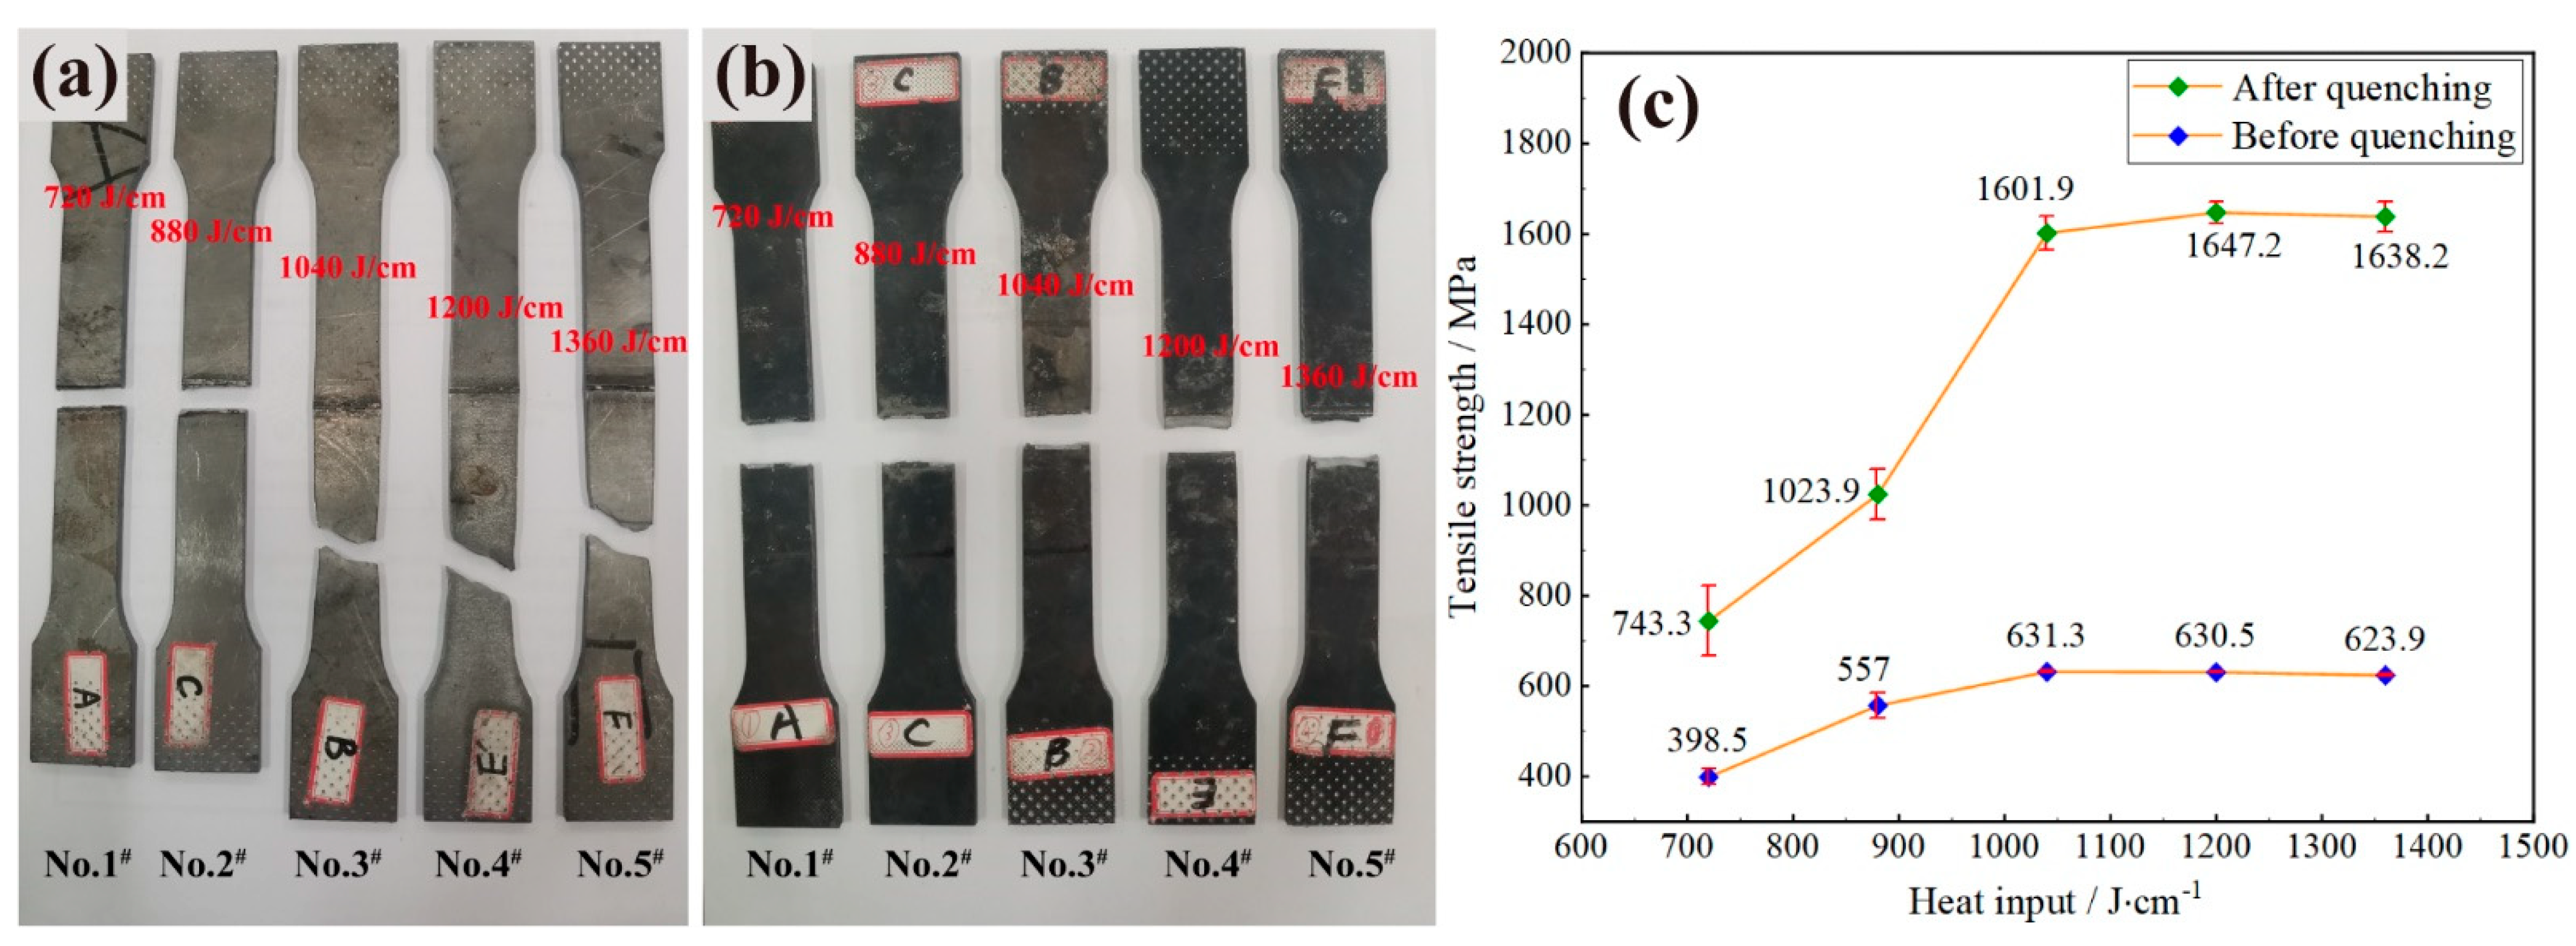
3.2.1. The Influence of Heat Input on Macrostructure and Tensile Strength

The macrostructures of the samples No.1# to No.5# are shown in Figure 4. The wire-feeding speed of samples No.1# to No.5# was fixed at 180 cm/min to investigate the influence of heat input on the macrostructure and tensile strength. When the heat input was 720 J/cm, it was observed that an obvious reinforcement exists in the top surface of the joint, but the bottom surface has a distinct underfill defect, as shown in Figure 4a. The underfill defect in the joint is the reason that the heat input is low and the droplets cool rapidly when they touch the top surface of the gap. Wire metal solidified on the top surface hinders the gap filling of the bottom surface. Finally, the droplets accumulate on the top surface, forming a reinforcement; however, an underfill defect still exists on the bottom surface. Therefore, an increase in the heat input is required to penetrate the joint in order to correct the defect.
Therefore, when the heat input increases to 880 J/cm, the underfill defect is removed from the bottom surface and the reinforcement is not as obvious as seen in Figure 4b. However, samples No.1# and No.2# have a funnel-shaped heat-affected zone (HAZ) due to the low heat input. The funnel shape is not an optimal shape for the joint and HAZ [18]. Therefore, the heat input of 880 J/cm is still low and needs to be increased to improve the shape of the HAZ. The macrostructure of the sample welded at a heat input of 1040 J/cm is shown in Figure 4c. The heat input of 1040 J/cm is enough to penetrate both the top and bottom surfaces of the joint. There are no underfill defects in the weld root and the HAZ shows a hyperbolic curve shape, which is an optimal shape for the HAZ.
If the heat input is greater than 1200 J/cm, the width of the HAZ becomes larger but the HAZ still shows a hyperbolic curve shape. However, the sinking of the top surface is shown in Figure 4d and becomes more apparent in Figure 4e. The sinking of the top surface makes the cross-sectional shape of the joint appear like a concave face, which is a poor macrostructure affecting the joint tensile strength. Therefore, the heat input should not be greater than 1200 J/cm when the wire-feeding speed is 180 cm/min. According to the analysis for the heat input and macrostructure above, the optimal heat input is between 1040 J/cm and 1200 J/cm when the wire-feeding speed is 180 cm/min. In such conditions, a flat joint cross-section and a hyperbolic curve shape of the HAZ can be obtained.
The sample images and tensile strength of No.1# to No.5# are shown in Figure 5. When the heat input is 720 J/cm, the obvious underfill defect increases the stress of the joint zone and decreases the resistance to tension. The cross-sectional area of the joint of tensile specimens is smaller than that of the BM and the concentration of stress leads to fracture in the joint. When the heat input is 880 J/cm, the fracture position is on the joint before quenching and the tensile strength is 557 ± 28.1 MPa. After quenching, the tensile strength is 1023.9 ± 55.8 MPa. Although no underfill defect exists in sample No.2#, the low tensile strength is possibly caused by the incomplete fusion between the fusion zone and base material due to the low heat input [20]. If the heat input is greater than 1040 J/cm, the tensile strength of the quenched samples exceeds 1601.9 MPa due to the compatible heat input. Furthermore, the tensile strength before quenching is greater than that of the base material. Compared with sample No.2#, this is a huge improvement in the tensile strength.
If the heat input increases to 1200 J/cm and even 1360 J/cm, the tensile strength of the quenched samples fluctuates around 1629.1 MPa. Therefore, the influence of heat input on the joint tensile strength is more obvious when the heat input is very low, but when the heat input is greater than 1040 J/cm, its influence is not apparent. If the heat input is greater than 1040 J/cm, the tensile strength of the joint after quenching is higher than 1601.9 MPa.

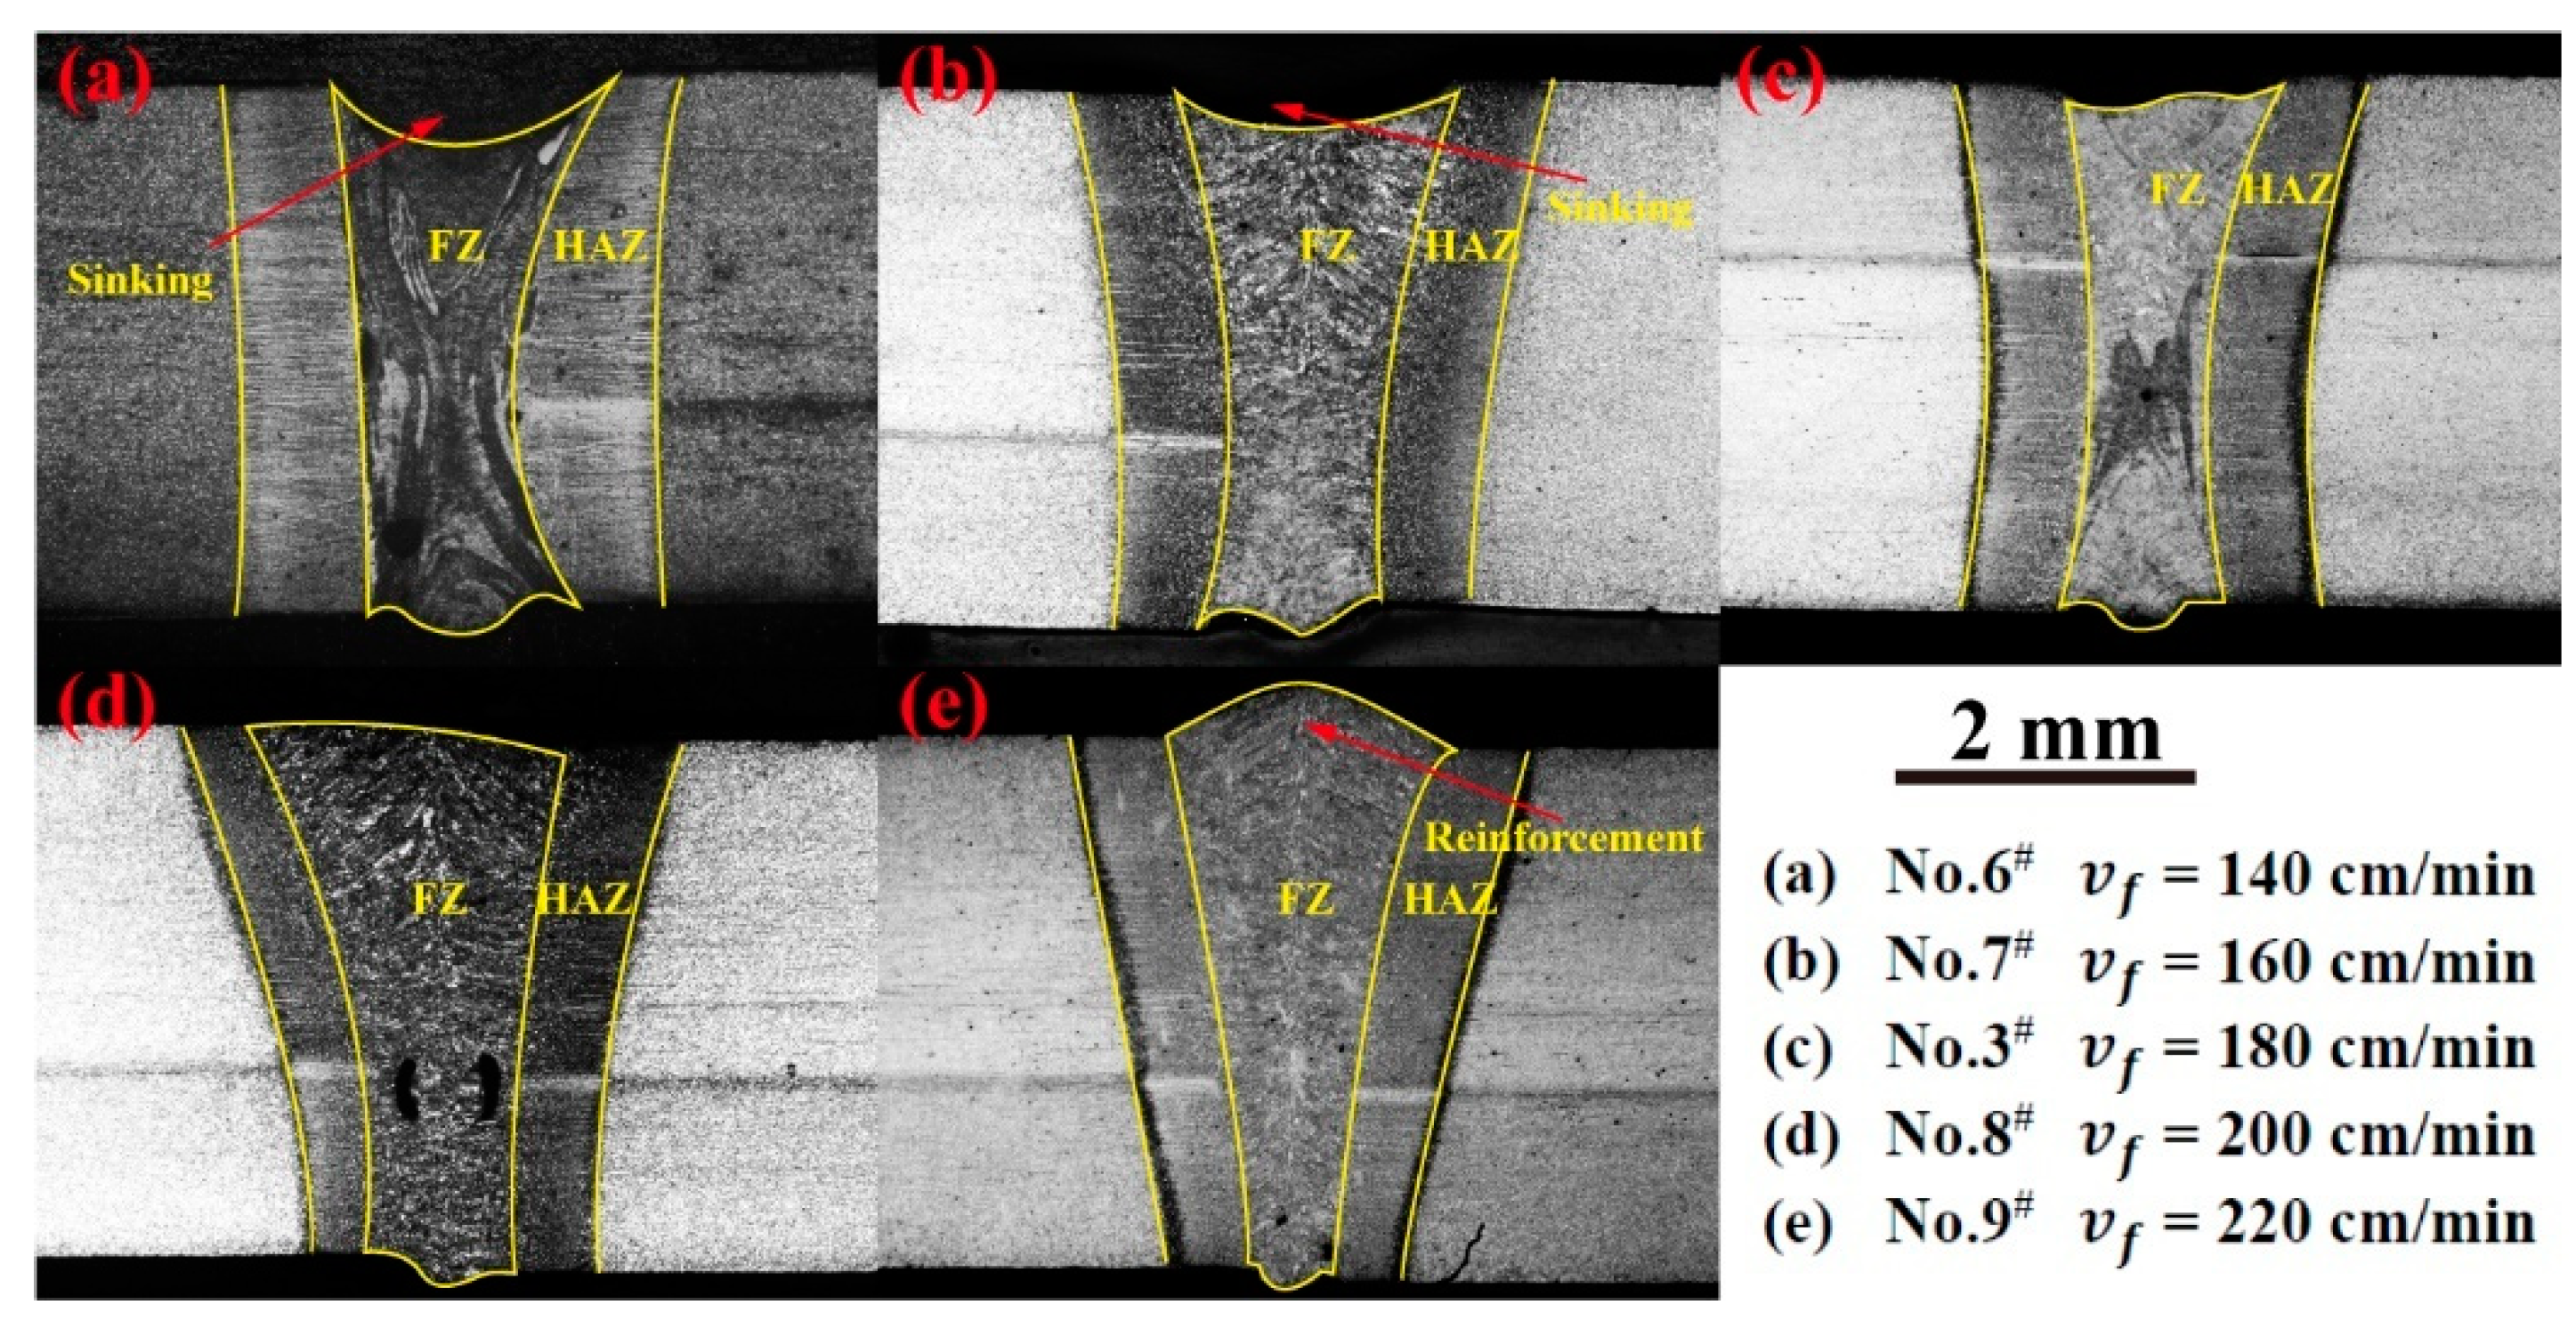
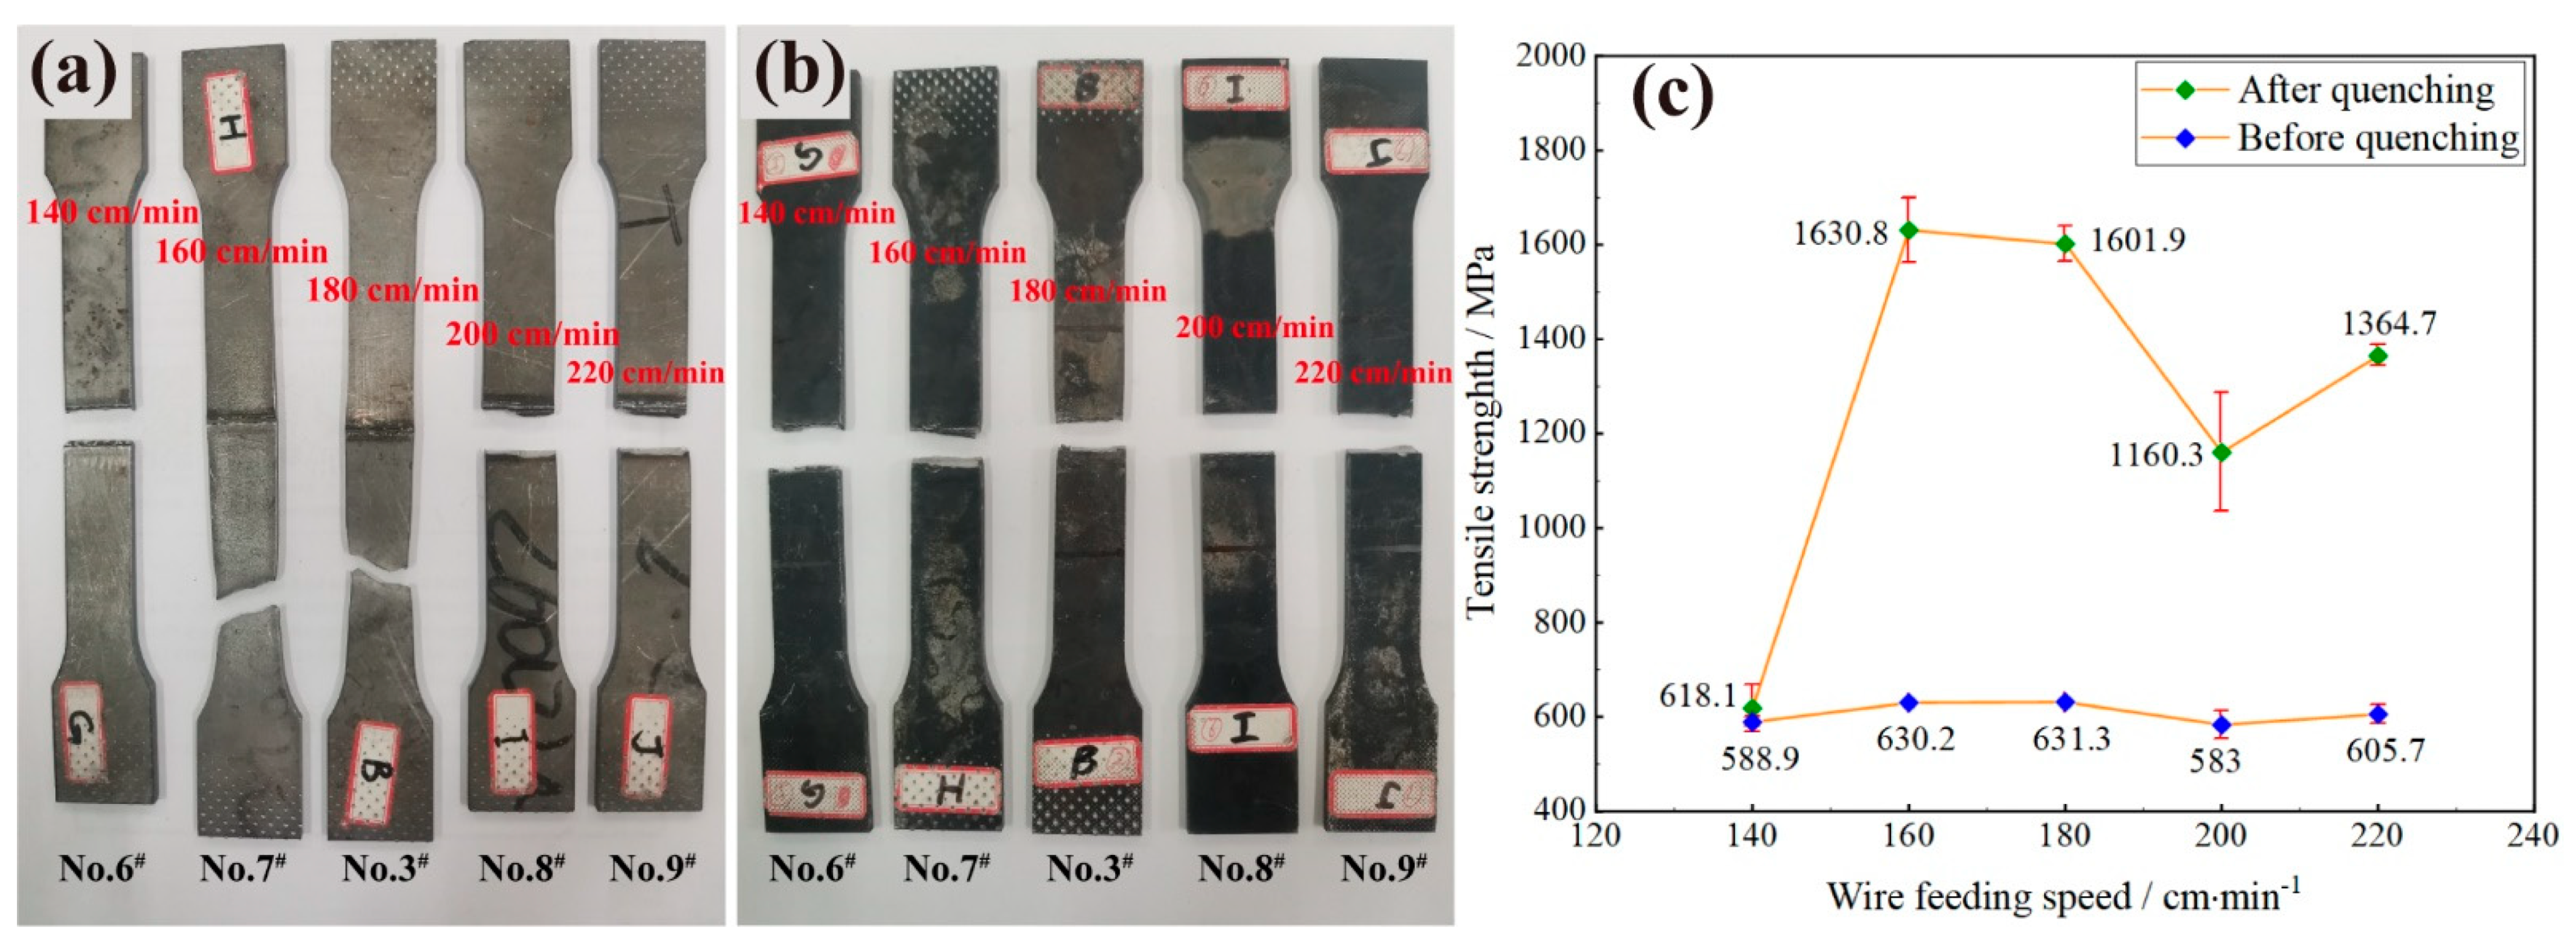
3.2.2. Influence of Wire-Feeding Speed on Macrostructure and Tensile Strength

The macrostructures of samples No.6# to No.9# and No.3# are shown in Figure 6. The heat input of samples No.6# to No.9# and No.3# is fixed at 1040 J/cm to investigate the influence of wire-feeding speed on the macrostructure and tensile strength. In Figure 6a, at wire-feeding speed of 140 cm/min, the top surface of the joint is sinking distinctly because the volume of filling metal is small and the heat input is relatively high. A large amount of BM is melted and the temperature of the weld pool is high, leading to a slow solidification rate. Therefore, the pit on the top surface is formed under the action of gravity and the force of the laser beam on the liquid metal [20]. The joint cross-section of Figure 6a is similar to a concave face which is not an optimal macrostructure. Therefore, the wire- feeding speed should be increased to decrease the sinking defects on the top surface.
When the wire-feeding speed is increased to 160 cm/min, there is only slight sinking on the top surface, with the volume of the wire-filling metal increased as shown in Figure 6b. When the wire-feeding speed is 180 cm/min, there is no sinking on the top surface and no obvious reinforcement on the bottom surface. The joint shows a flat face, which is a good macrostructure as shown in Figure 6c.
However, if the wire-feeding speed increases continually, an evident reinforcement appears on the top surface and the HAZ shows a funnel shape at wire-feeding speed of 200 cm/min and 220 cm/min. At this moment, the heat input is incompatible with the wire-feeding speed and the heat input is on the low side relative to the increasing wire-feeding speed. As shown in Figure 6d,e, weld porosities and cracks were seen in the weld zone and the HAZ. This is because the low heat input increases the solidification velocity of the molten metal in the molten pool. Finally, the bubbles cannot escape from the molten pool, forming a porosity defect in the weld [20]. Some research points out that the increase in heat input can reduce porosity defects [20,21]. Defects such as weld porosities and cracks will lead to a concentration of stress and crack growth, decreasing the tensile strength of the joint. Generally speaking, if the wire-feeding speed increases, the heat input should be increased to obtain better compatibility. By investigating the influence of wire-feeding speed on the macrostructure, we can conclude that the most compatible wire-feeding speed is between 160 cm/min and 180 cm/min when the heat input is 1040 J/cm.
The sample images and tensile strength of samples No.6# to No.9# and No.3# are shown in Figure 7. When the wire-feeding speed is 140 cm/min, the joint has a low ability of resisting the tension due to the incomplete filling and concave faces of the joint cross-section. This indicates that the wire-feeding speed of 140 cm/min is too slow for such conditions. Furthermore, an incomplete fusion is shown in Figure 6a, which has obvious influence on the tensile strength of the joint.
If the wire-feeding increases to 160 cm/min and 180 cm/min, there are no obvious defects such as sinking, incomplete fusion, and weld porosity in the joint. Moreover, the HAZ shows a hyperbolic curve shape, which is a good morphology for the joint. Therefore, the tensile strengths of the samples after quenching of No.7# and No.3# are 1630.8 ± 68.3 MPa and 1601.9 ± 37.9 MPa, respectively, which accounts for greater than 89% of the strength of the BM after quenching. However, if the wire-feeding speed is faster than 180 cm/min, the tensile strength decreases as shown in Figure 7c. The tensile strengths of the quenched samples No.8# and No.9# are 1160.3 ± 126.3 MPa and 1364.7 ± 21.8 MPa, respectively. One reason is that the heat used to melt the wire increases and the energy used to melt the BM decreases due to the high wire-feeding speed, leading to a poor fusion condition between the BM and filling metal [21]. Furthermore, as shown in Figure 6d,e, some cracks and weld porosities are observed in the joint. The presence of porosities and cracks can reduce the load area of the weld and cause a concentration of stress, making the joint fracture at a low tensile force [22]. Therefore, it can be concluded that when the heat input is 1040 J/cm, the compatible wire-feeding speed is between 160 cm/min and 180 cm/min, and in such conditions, the tensile strength can reach greater than 1601.9 MPa.

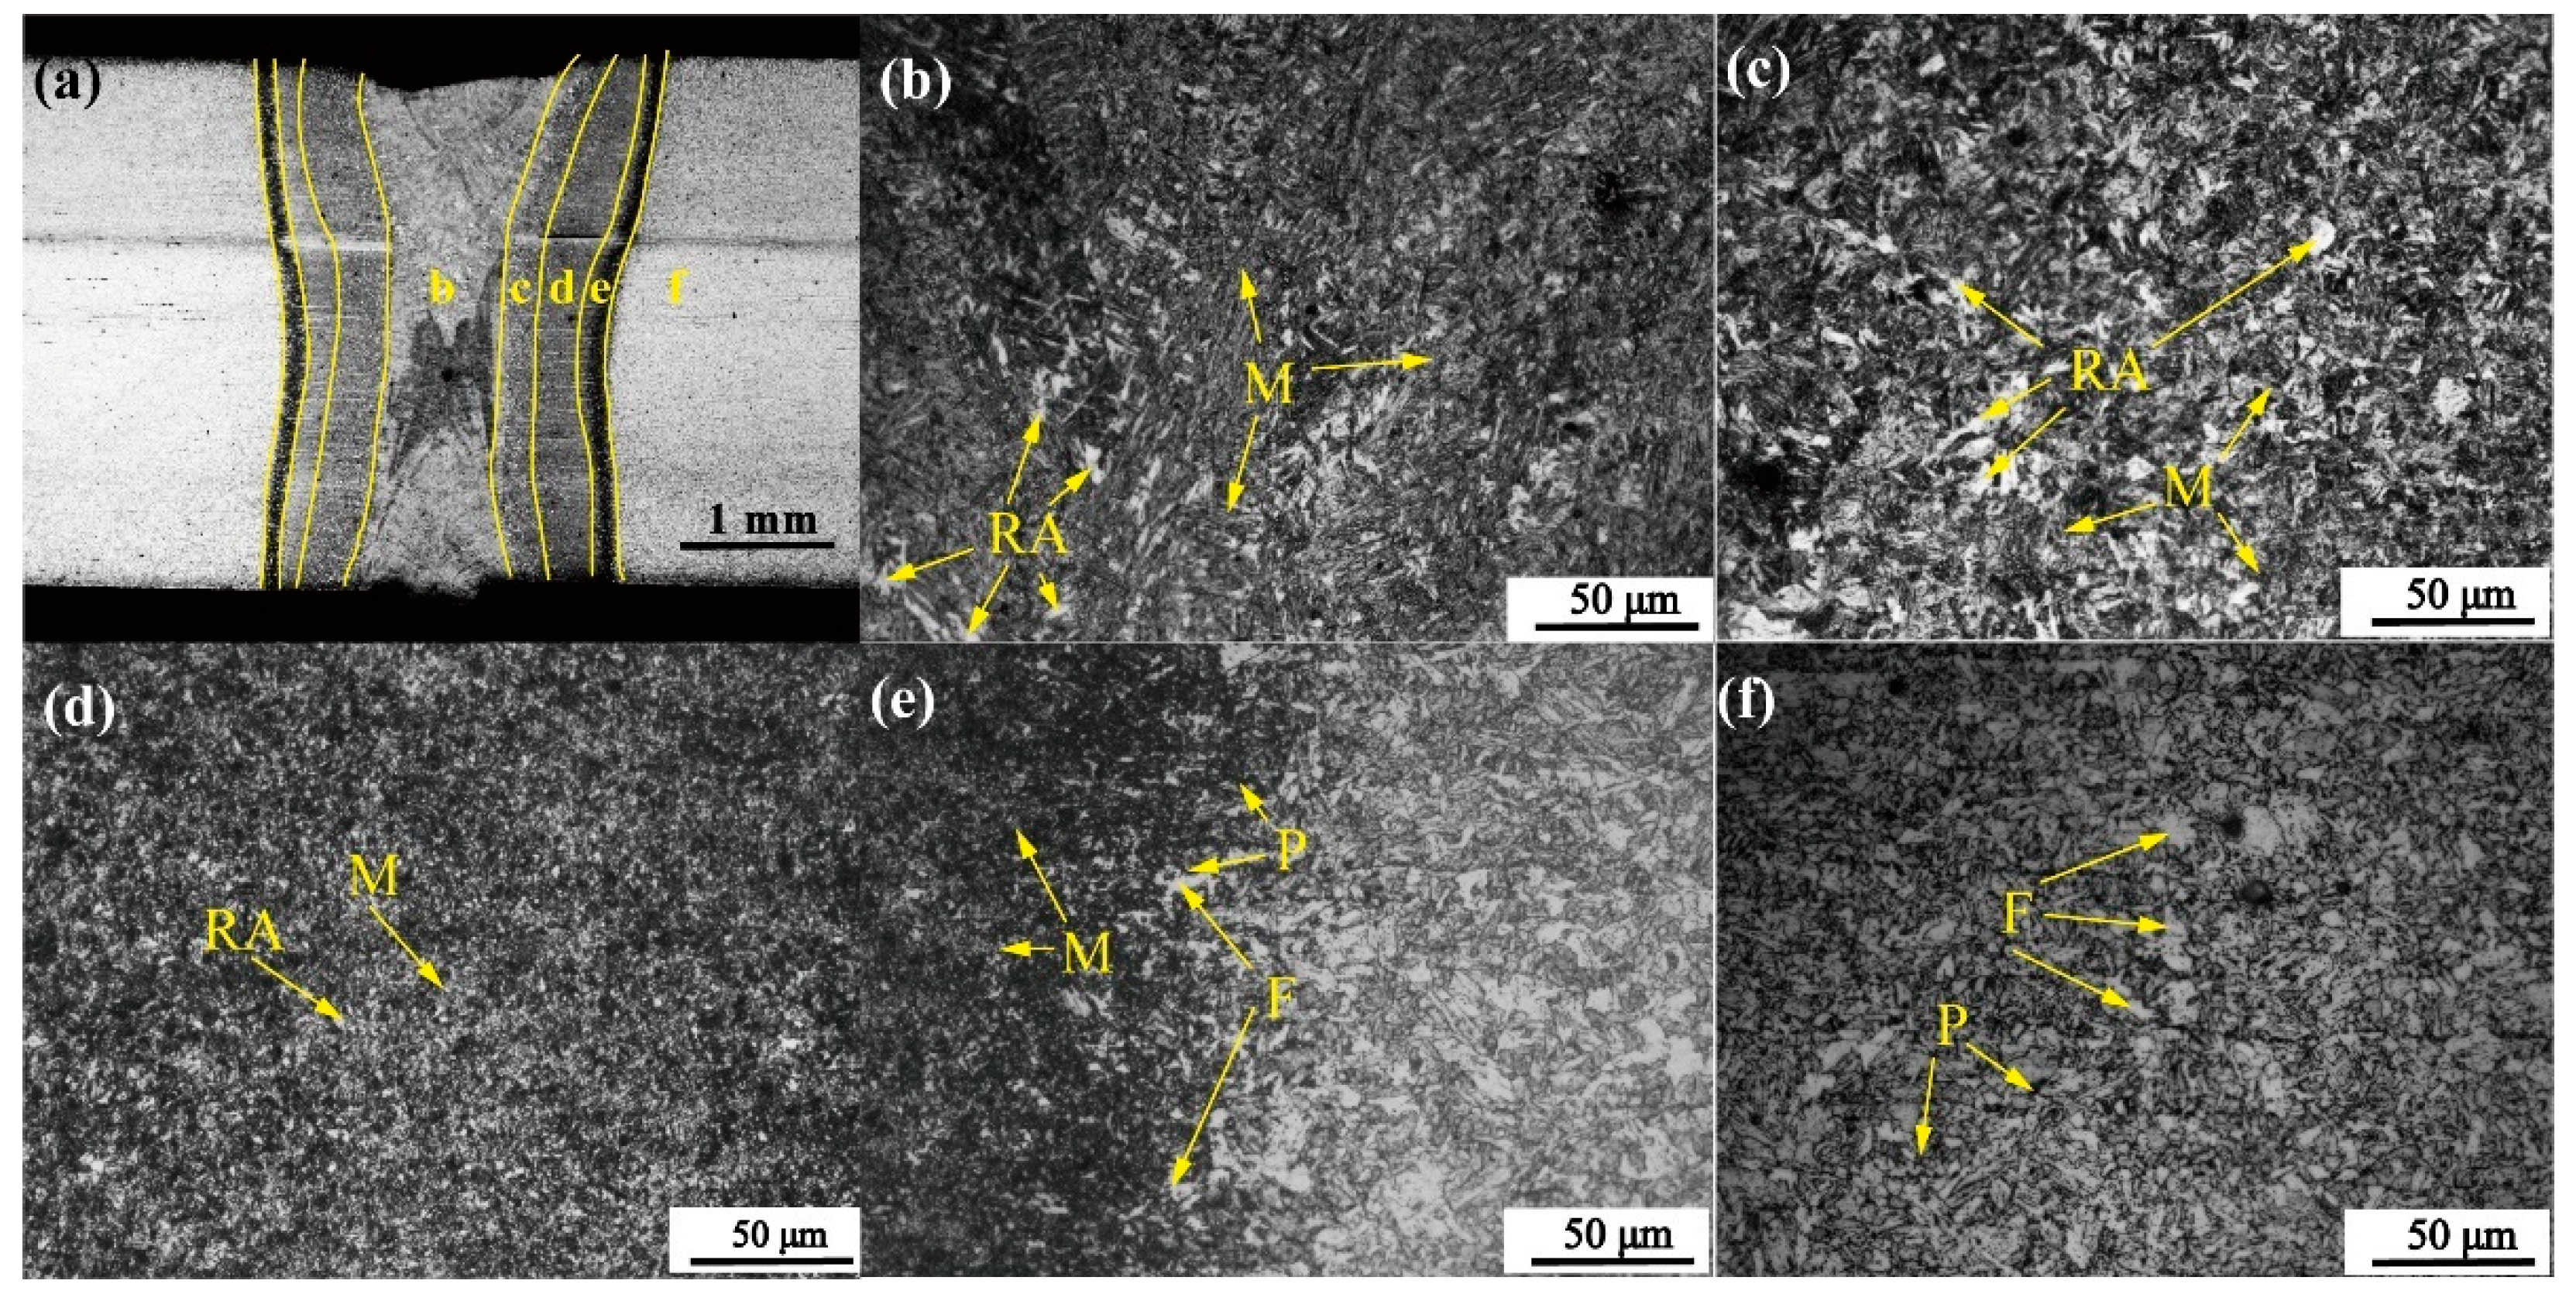
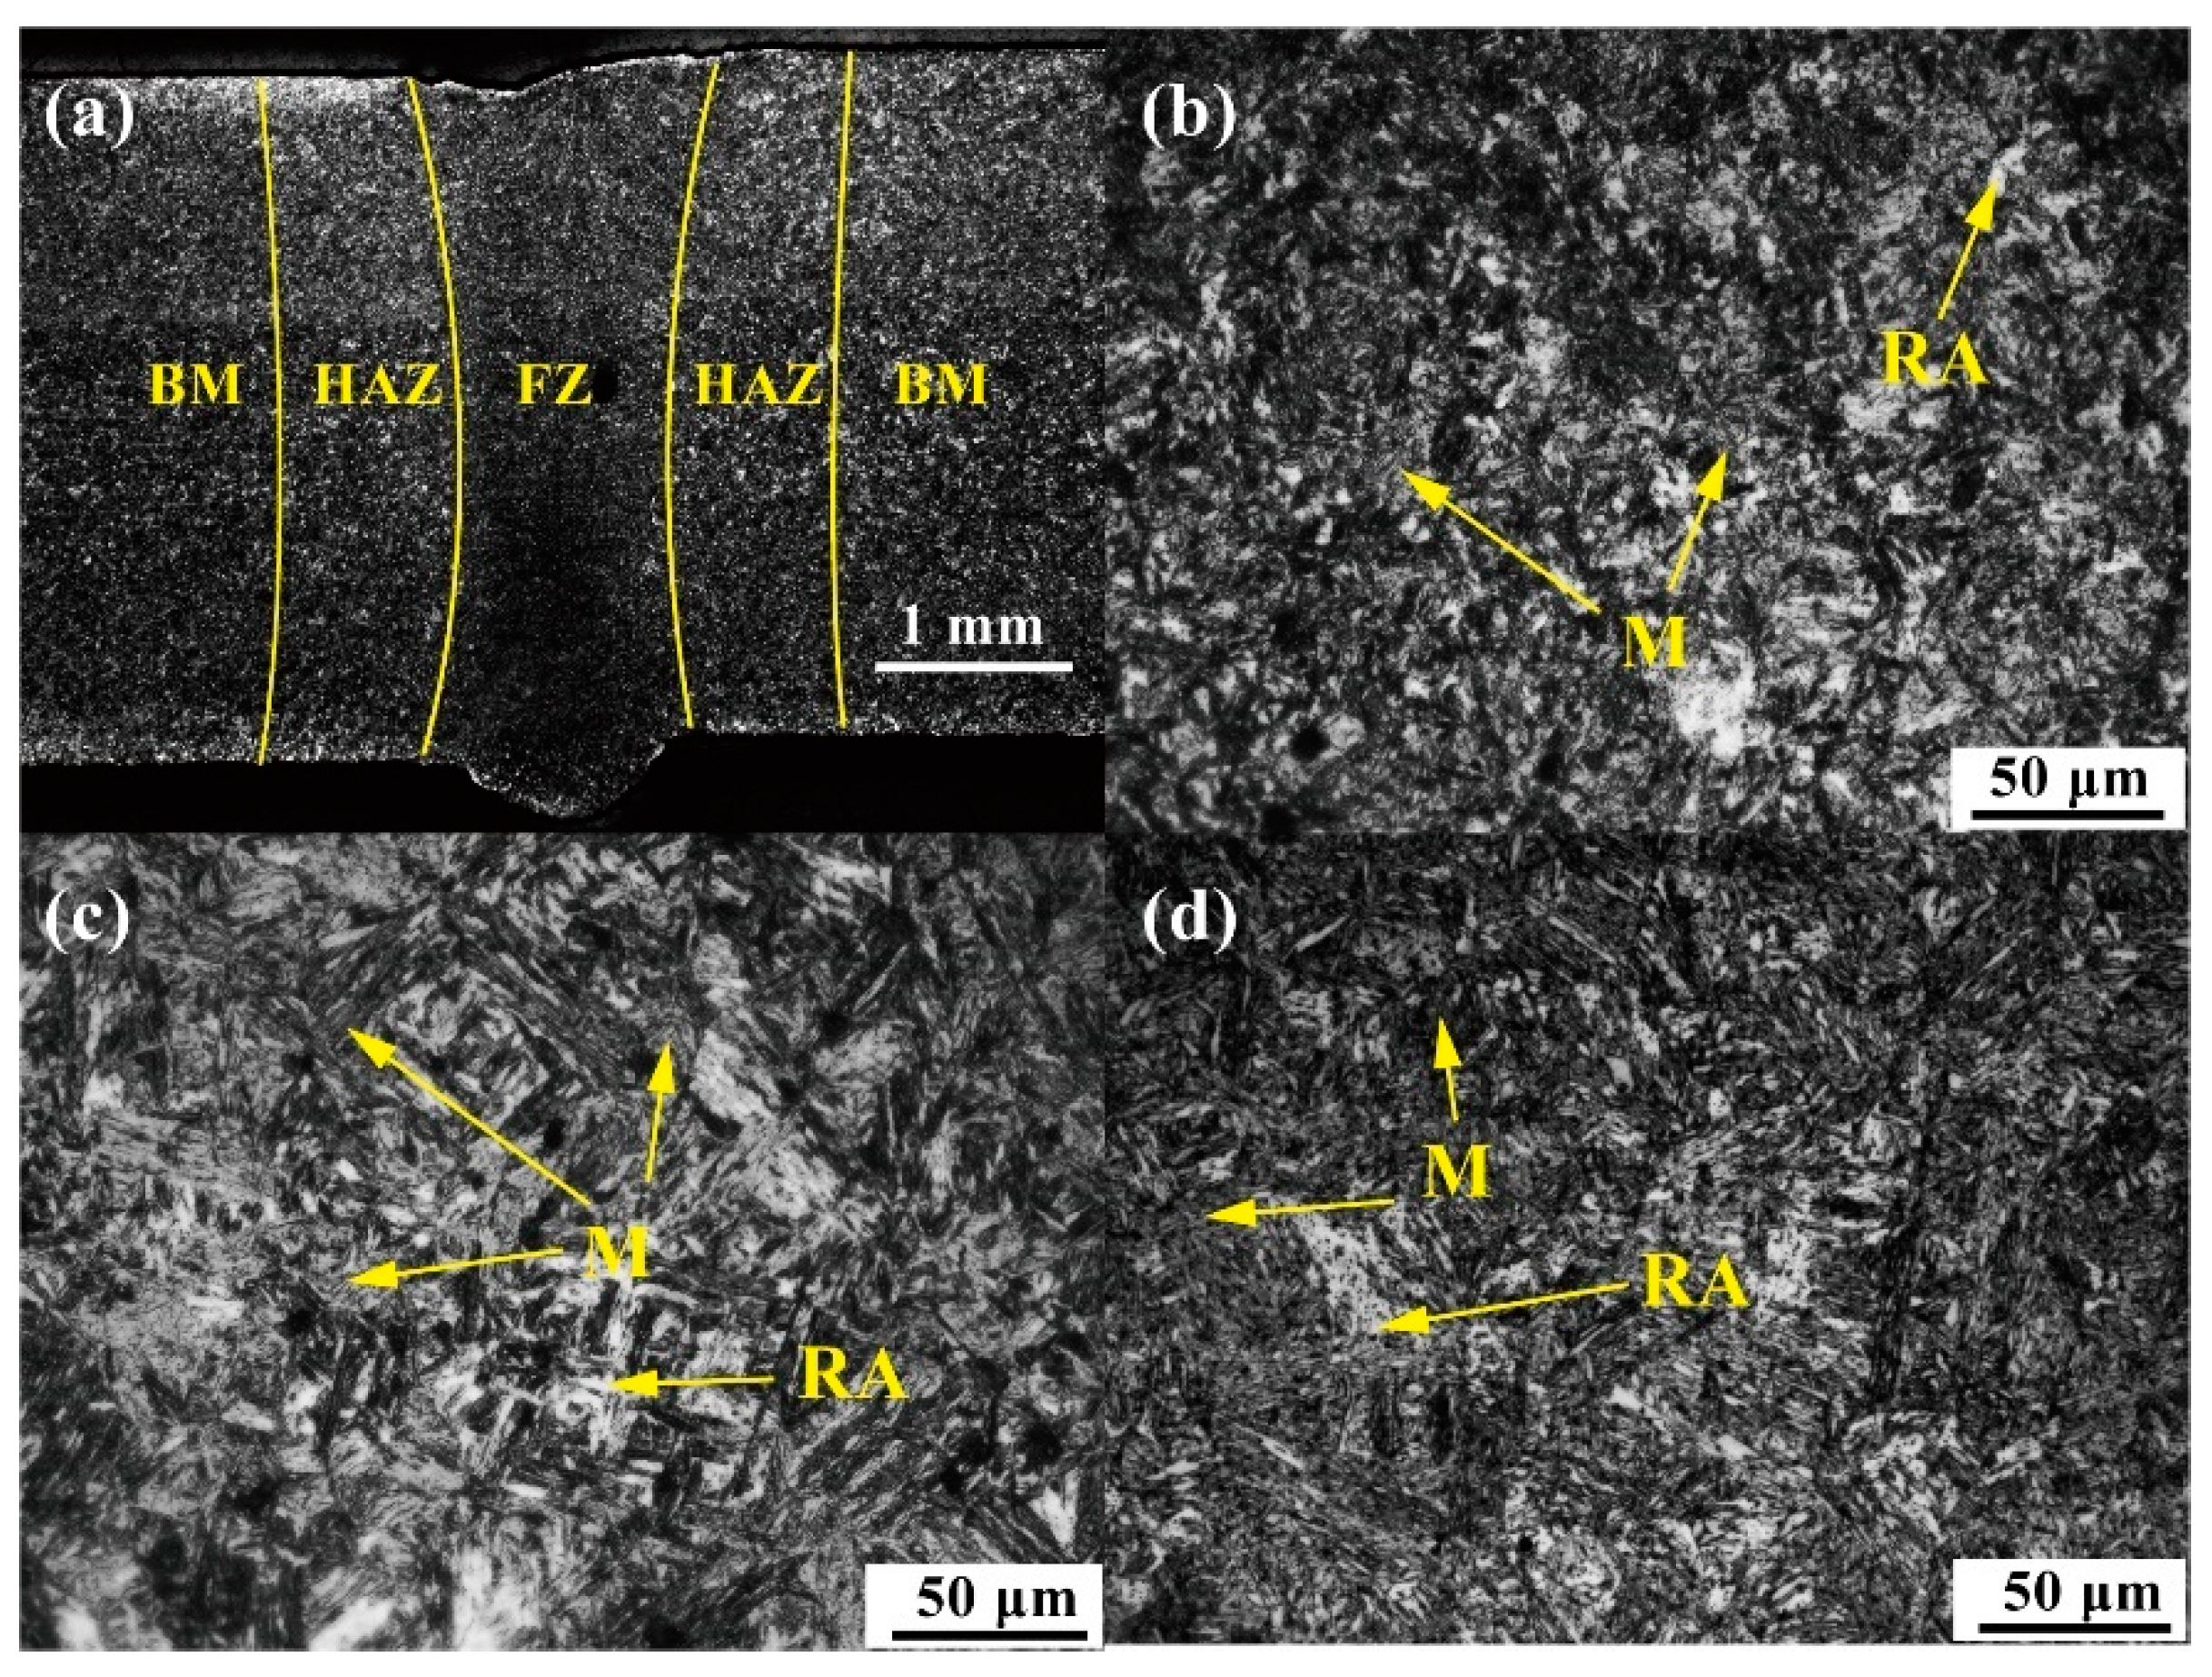
3.3. Microstructure of Joints before and after Quenching

3.3.1. Microstructure before Quenching

Due to the fact that the microstructure of all the samples is similar, the microstructure of sample No.3# is studied as an example. The microstructure of sample No.3# before quenching is shown in Figure 8. Observing the macroscopic morphology in Figure 8a, the joint can be divided into fusion zone (FZ), heat-affected zone (HAZ), and base material (BM). The microstructure of the FZ is shown in Figure 8b; martensite (M) is the main microstructure in this zone due to the rapid cooling after laser welding [13]. The HAZ can be divided into the coarse-grain zone (CGZ), fine-grain zone (FGZ), and incomplete recrystallization zone (IRZ), according to the degree of transformation [13]. The temperature of the CGZ and the FGZ exceeded the Ac3 line by the function of thermal cycle. The CGZ is close to the FZ and the temperature is between the melting point and the superheat temperature. Thus, the austenite grain grows significantly and transforms into coarse martensite and retained austenite (RA) as shown in Figure 8c. The temperature in the FGZ ranges from superheat temperature to Ac3 line, so the high temperature residence time is short and the grain has no obvious growth compared with the CGZ. The martensite in the FGZ is finer than that in both the FZ and the CGZ, as shown in Figure 8d. For the IRZ, the temperature in this region is between Ac3 and Ac1, with part of the pearlite austenitized and transformed into martensite. The rest of the ferrite (F) and pearlite (P) remain in their original state as shown in Figure 8e. Figure 8f shows the microstructure of the BM, which is not affected by the thermal cycle and does not have a microstructure transformation.

3.3.2. Microstructure after Quenching
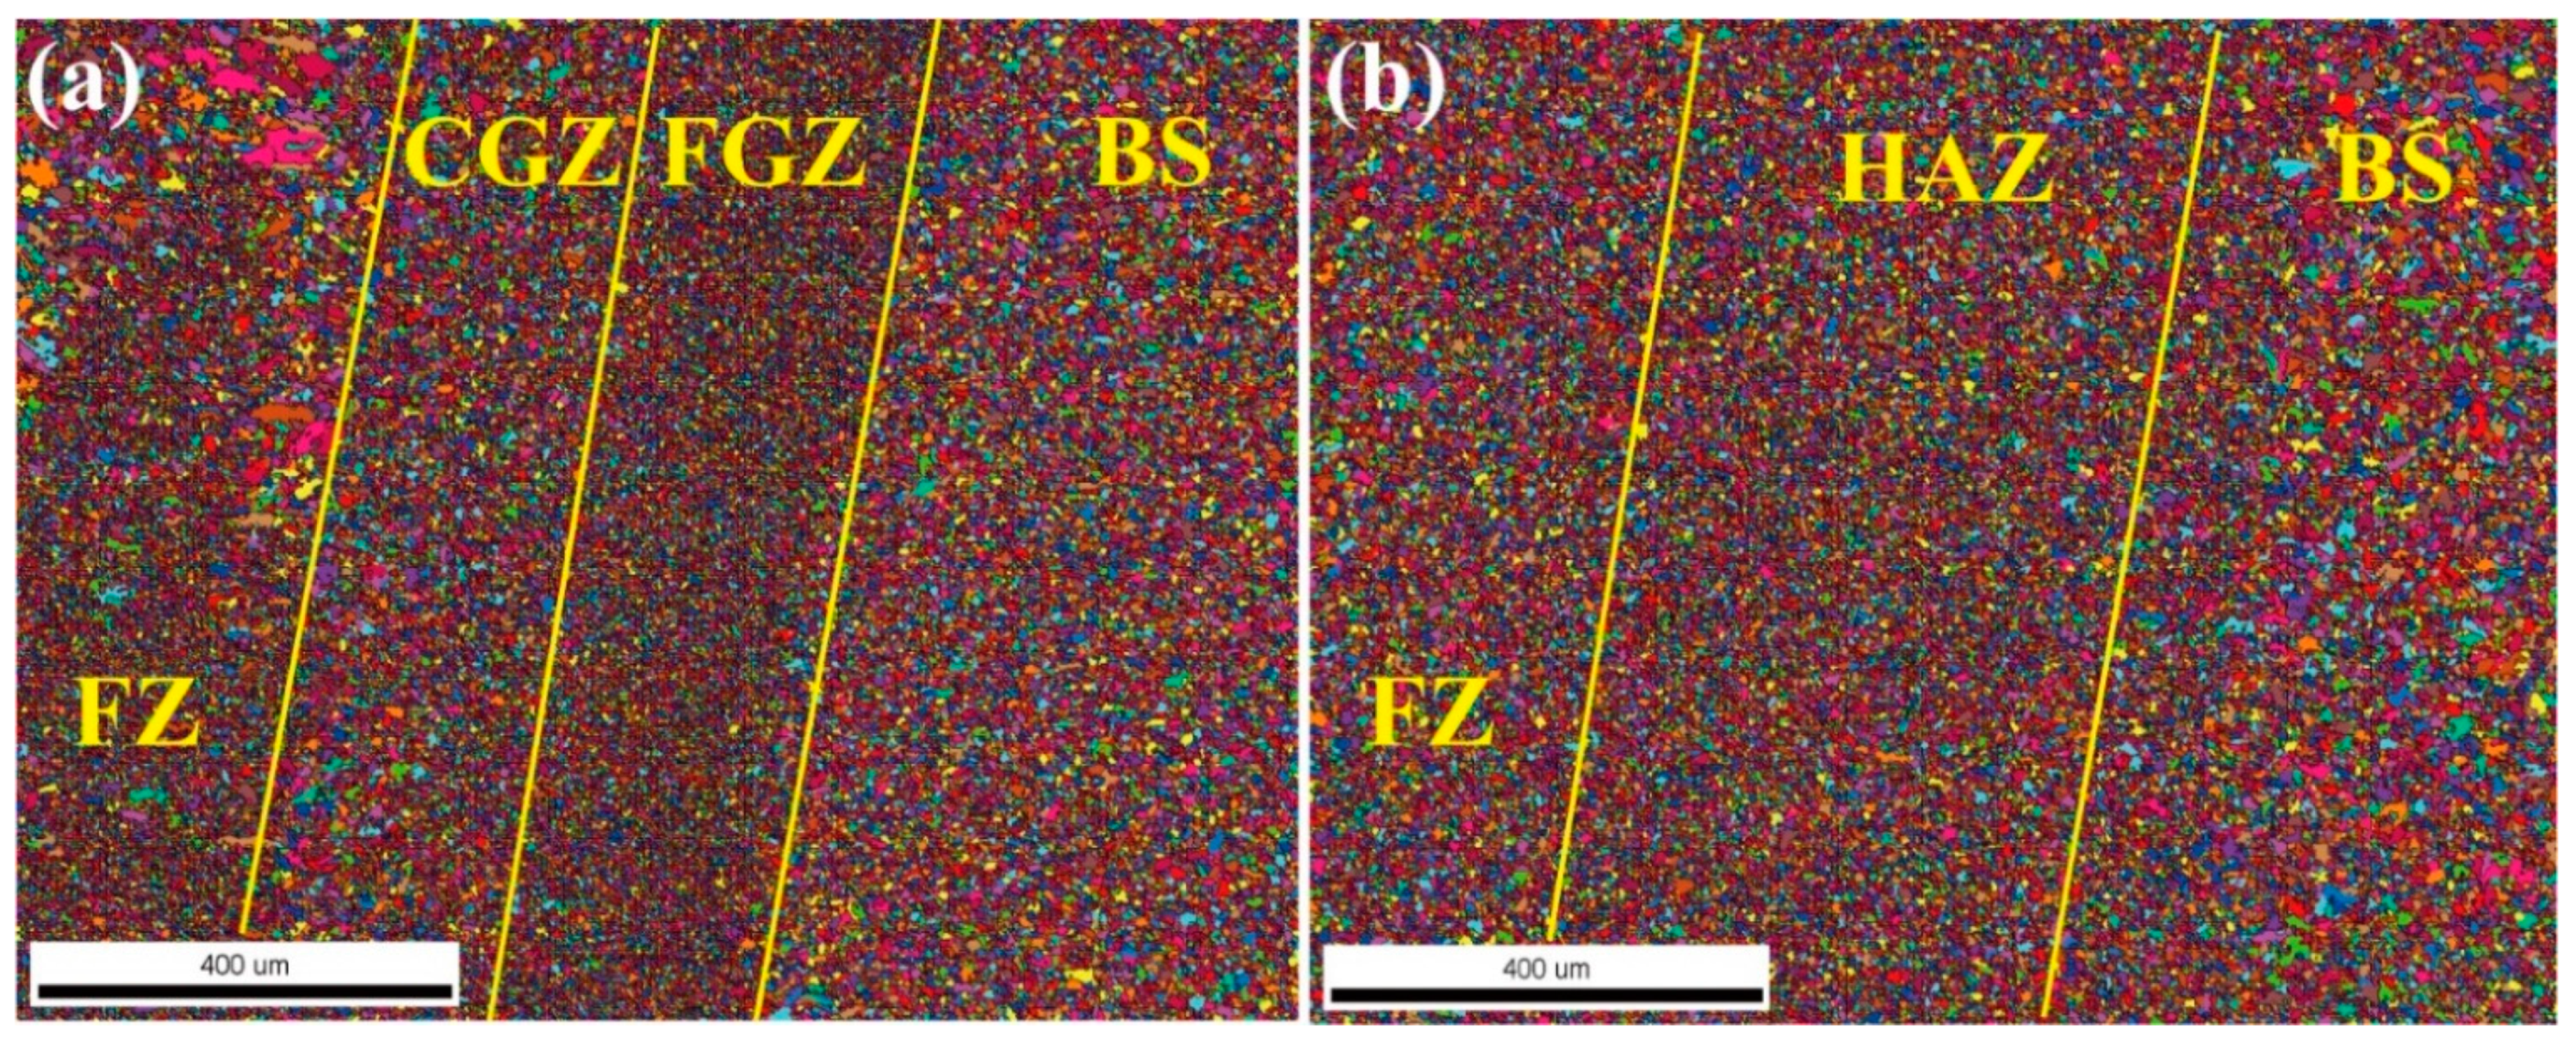
The microstructure of sample No.3# after quenching is shown in Figure 9. It is difficult to distinguish the boundary of the FZ, HAZ, and BM after quenching from the macroscopic macro morphology shown in Figure 9a. After quenching, the FZ, HAZ, and BM transformed into lath martensite and RA, as shown in Figure 9b–d. Due to the high heating temperature and fast cooling rate in the quenching process, the martensite fraction after quenching is very high, with a few fine RA distributed around the martensite compared with the microstructure before quenching. The main cause of the high joint strength of hot stamping steel is the generation of martensite through the quenching process. Therefore, for hot stamping steel, welding before quenching can avoid the HAZ softening and obtain an ultra-high-strength joint of greater than 1600 MPa after quenching.

3.4. EBSD Test

In order to investigate the influence of the quenching process on the joint grain diameter, grain orientation and phase, sample No.3# was analyzed by EBSD test before and after quenching.

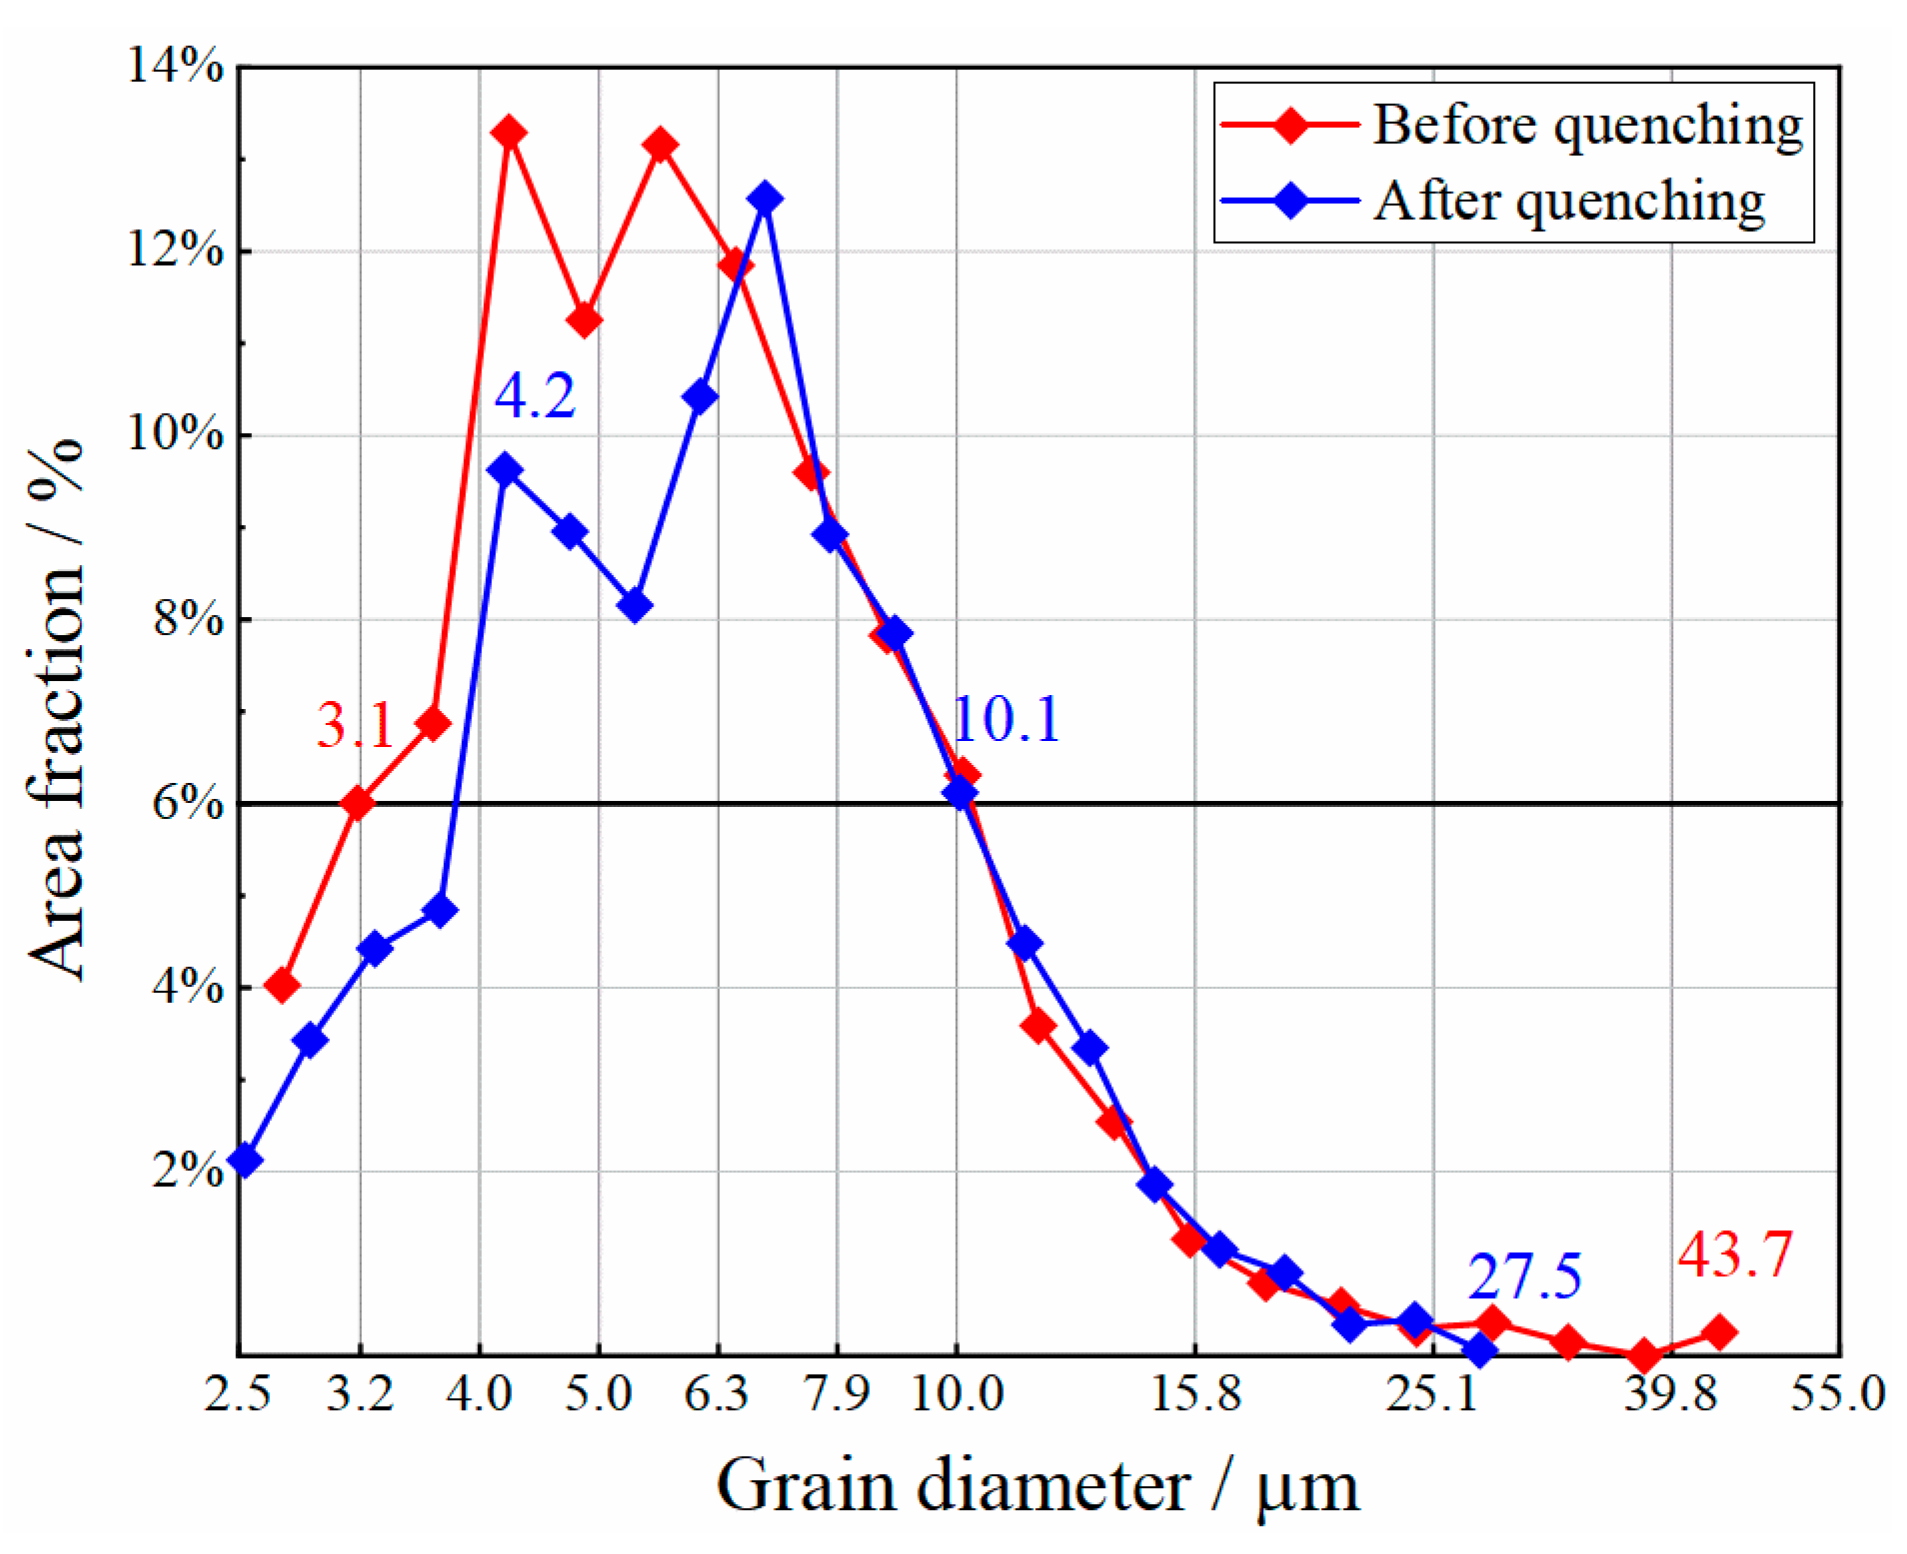
3.4.1. Grain Size before and after Quenching

The colored grains of sample No.3#, before and after quenching, are shown in Figure 10. The most apparent feature of the FZ is that the grain diameter is obviously nonuniform from Figure 10a. There are coarse grains in the FZ with a large diameter, which is consistent with the coarse martensite observed in the microstructure of Figure 8b. Therefore, this indicates that the overheating the FZ leads to distinct grain growth. The grain diameter of the CGZ and FGZ are relatively uniform, but the grain of the CGZ is coarser than that of the FGZ. It can be clearly observed that the grain diameter of the FGZ is the smallest among all zones. As shown in Figure 10b, after quenching, the original coarse grains in the FZ have been completely refined and the grain diameter among all joints is much more uniform than before quenching. Furthermore, the grain diameter of the CGZ and FGZ is the same after quenching, which cannot be clearly distinguished in Figure 10b. However, the grain of the BM grows after quenching, which is coarser than that of the FZ and HAZ.
Figure 11 shows the statistical result of the grain diameter before and after quenching. Very few joints showed a grain diameter greater than 15.8 μm before and after quenching. The largest grain diameter is between 3.1 μm and 10.1 μm, accounting for 86.2% before quenching. After quenching, most grain diameters are between 4.2 μm and 10.1 μm, accounting for 81.9%. However, the difference is that the FZ has some coarse grains of diameter greater than 40 μm before quenching, increasing the nonuniformity of the grain diameter. The coarse grains are refined by the quenching process; therefore, the maximum grain diameter is less than 27.5 μm after quenching. The analysis of grain diameters indicates that the quenching process has distinct effects on refining grains and enhancing the strength and toughness of joints.

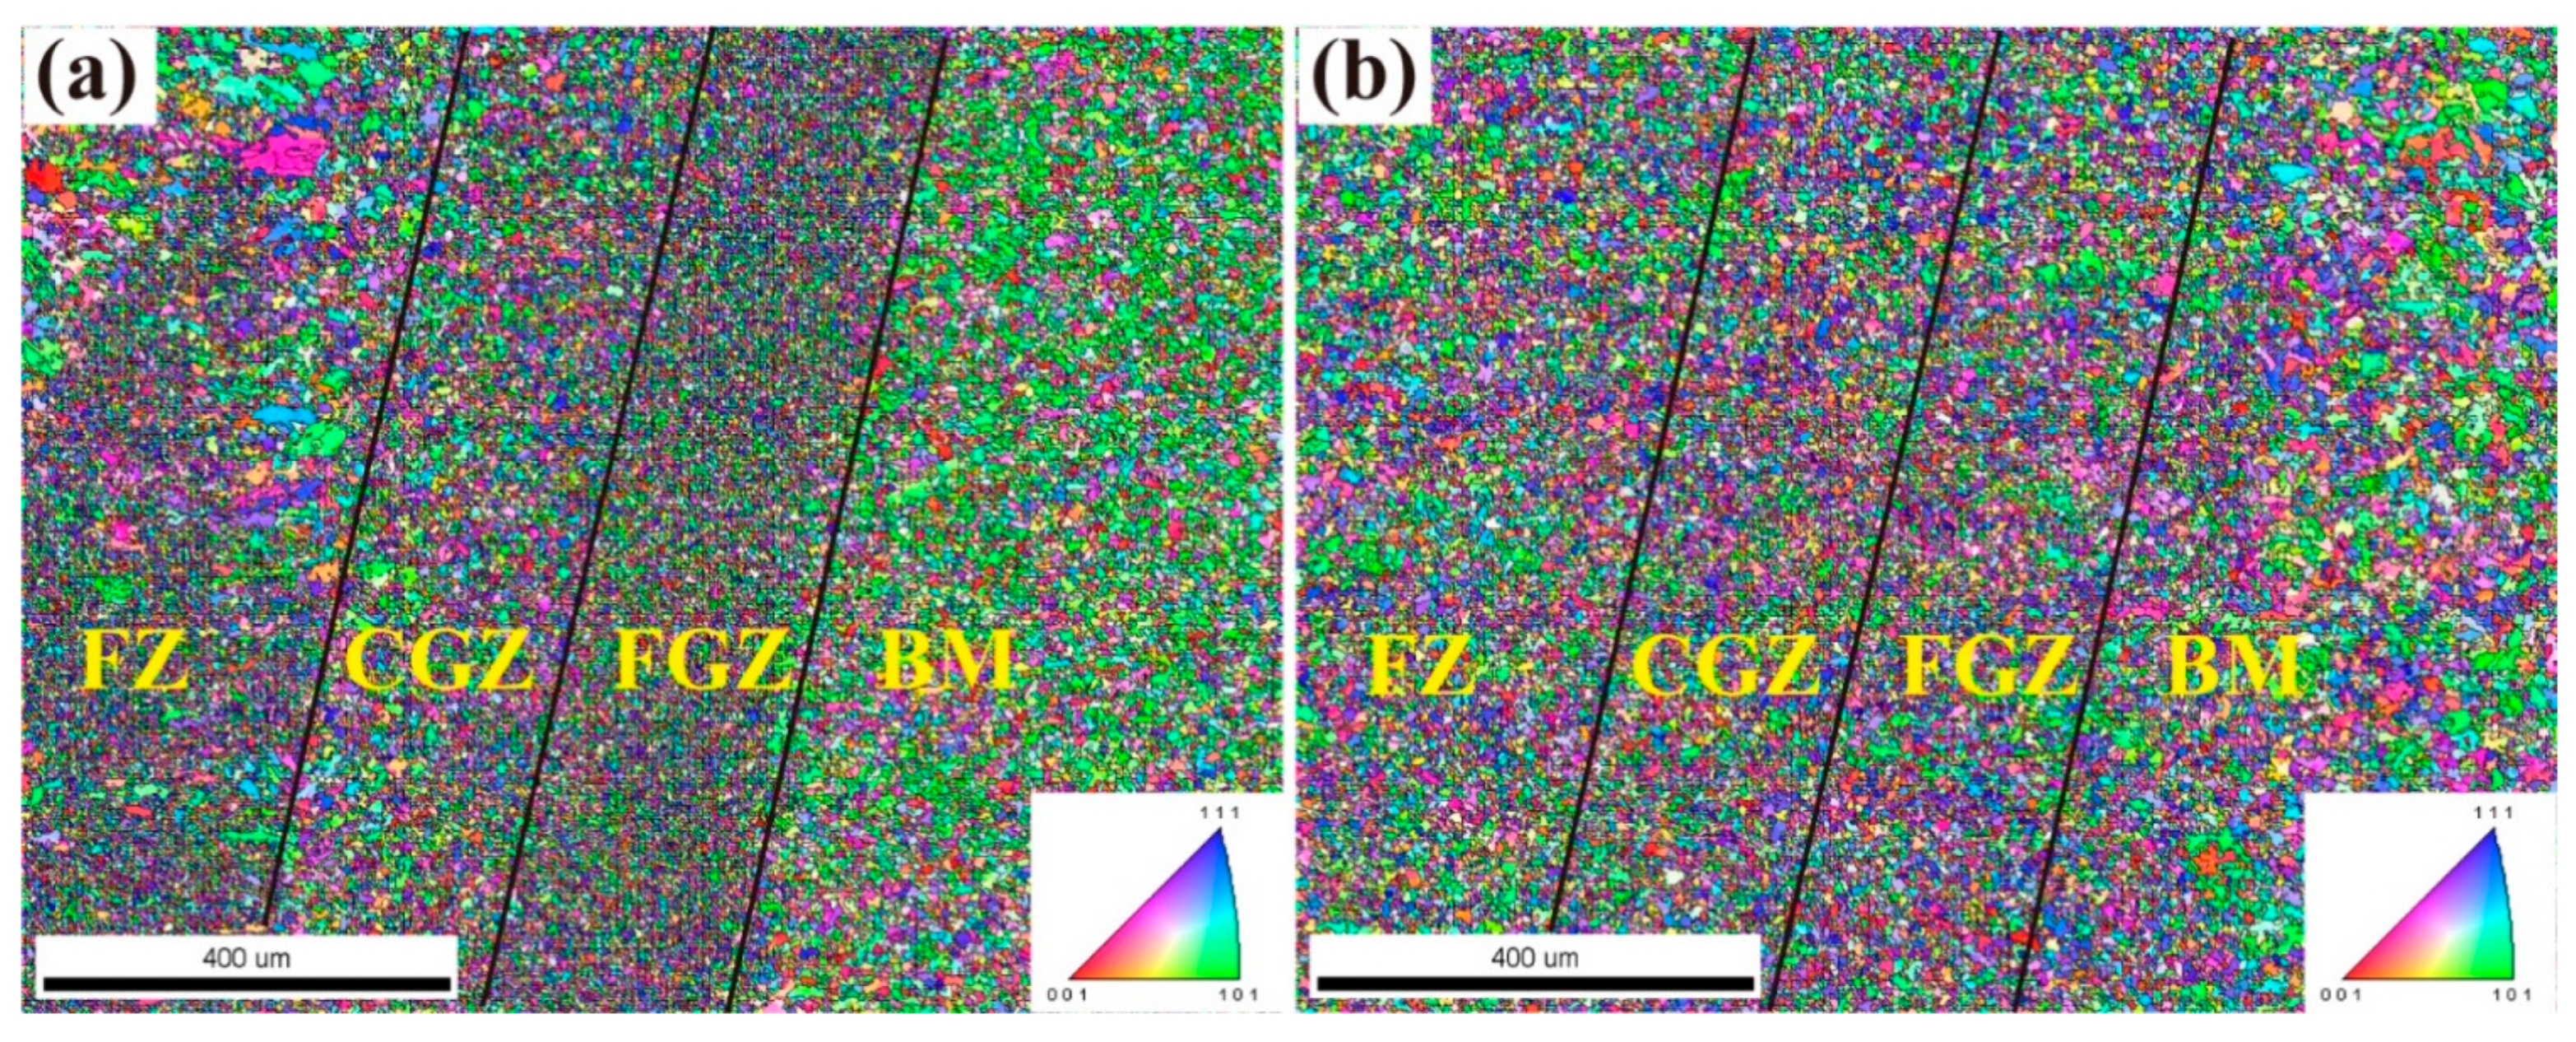
3.4.2. Grain Orientation before and after Quenching

Figure 12 shows the grain orientation distribution of sample No.3# before and after quenching. As depicted in Figure 12a, the BM has obvious orientation towards green {101} before quenching due to the rolling process. The metal in the FZ cools fast from the melting state, so the grain in FZ shows a random orientation. The HAZ experienced recovery and recrystallization and the grain grew by the effect of the thermal cycle, showing no obvious preferred orientation compared with the BM [17]. Figure 12b shows the grain orientation of different regions of the joint after quenching. It can be found that the BM has more orientations of blue {111} and red {001} generated by the quenching process. The whole joint is identified in random orientation after quenching [19,20].

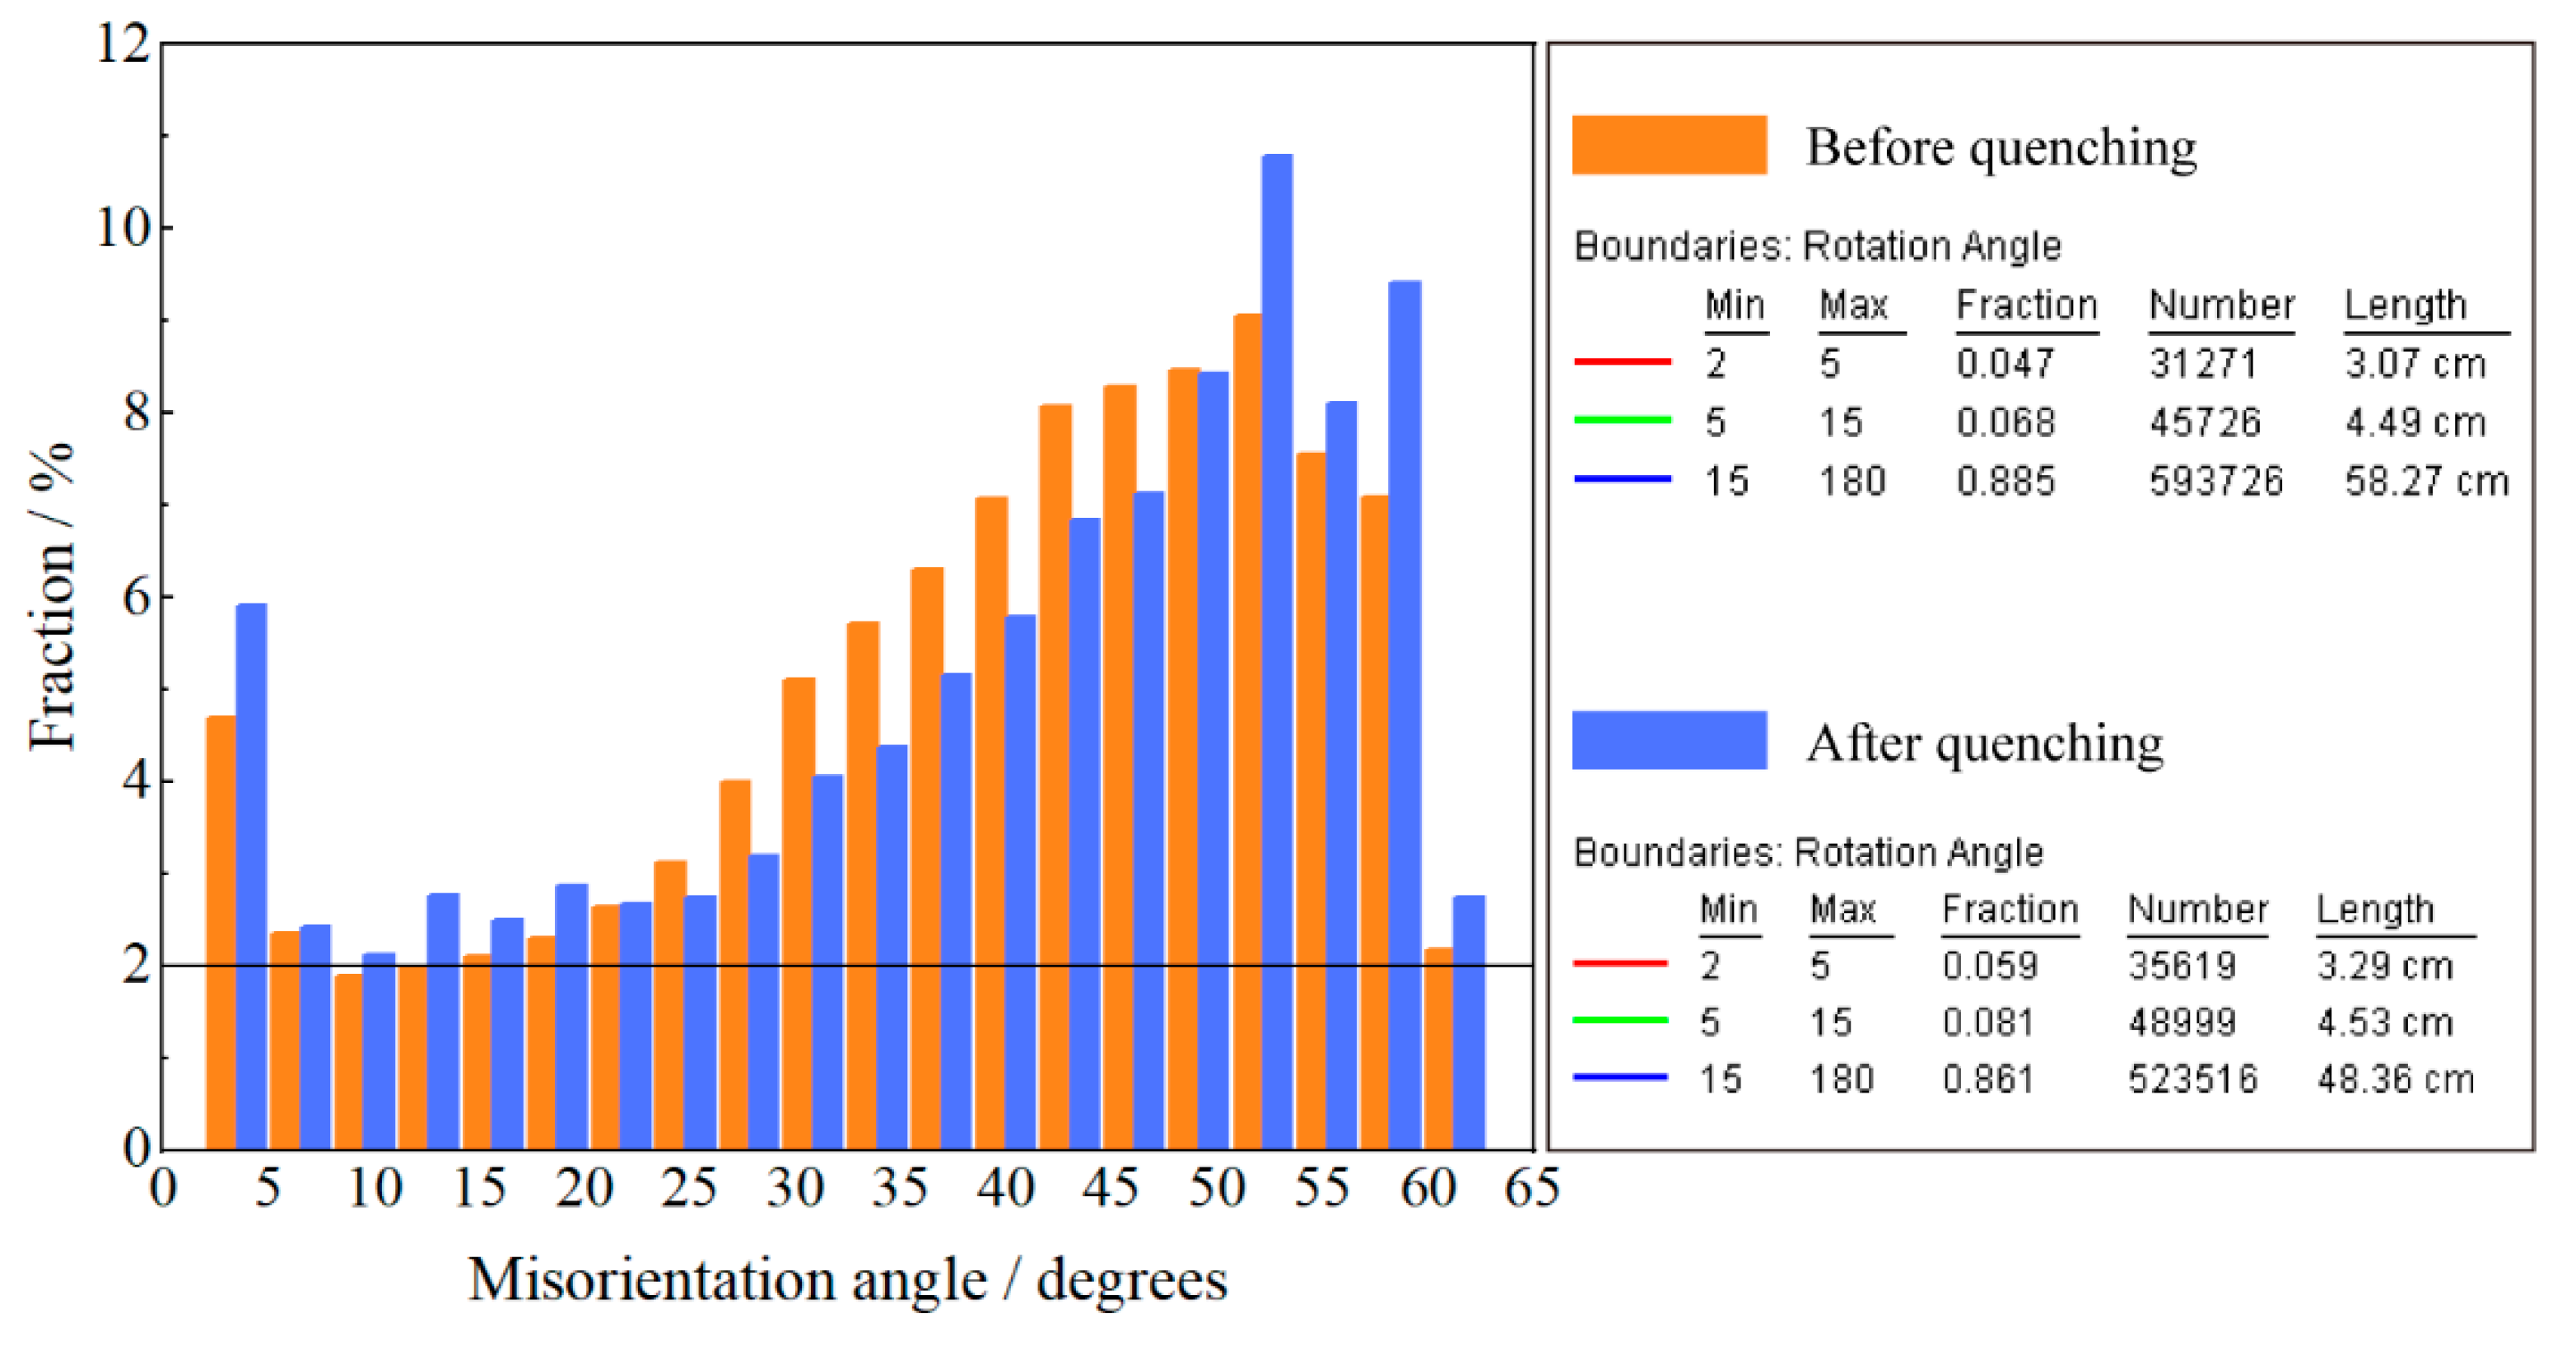
3.4.3. Grain Boundary before and after Quenching

The grain boundary misorientation and statistical result of sample No.3# before and after quenching are shown in Figure 13 and Figure 14. Before the quenching process, the proportion of high-angle misorientation boundary (15°–180°) is 88.5%, while the middle-angle misorientation (5°–15°) and low-angle misorientation (0°–5°) is 6.8% and 4.7%, respectively. Furthermore, the statistical result shows that more grain boundary misorientation occurs between 0° to 5° and 25° to 60° in the joint. The grain diameter of the FZ is not uniform and there are a large number of red boundaries (2°–5°) inside the coarse martensite, while more blue boundaries (15°–180°) are visible in the FGZ [2]. Compared with the FZ and HAZ, the BM has more green boundaries (5°–15°) as shown in Figure 13a [23]. From Figure 13b, more 50°–60° boundaries generate after the quenching process but the boundaries of 25°–60° decrease greatly. Therefore, overall, the high-angle misorientation boundary decreases to 86.1% after quenching. However, the middle-angle misorientation and low-angle misorientation increases to 8.1% and 5.9%, respectively. With the grain refinement and homogenization in the FZ and HAZ, the high-angle misorientation boundaries in the FZ and FGZ are reduced. More middle-angle misorientations generate in the FZ and FGZ while more low-angle misorientations generate in the BM.

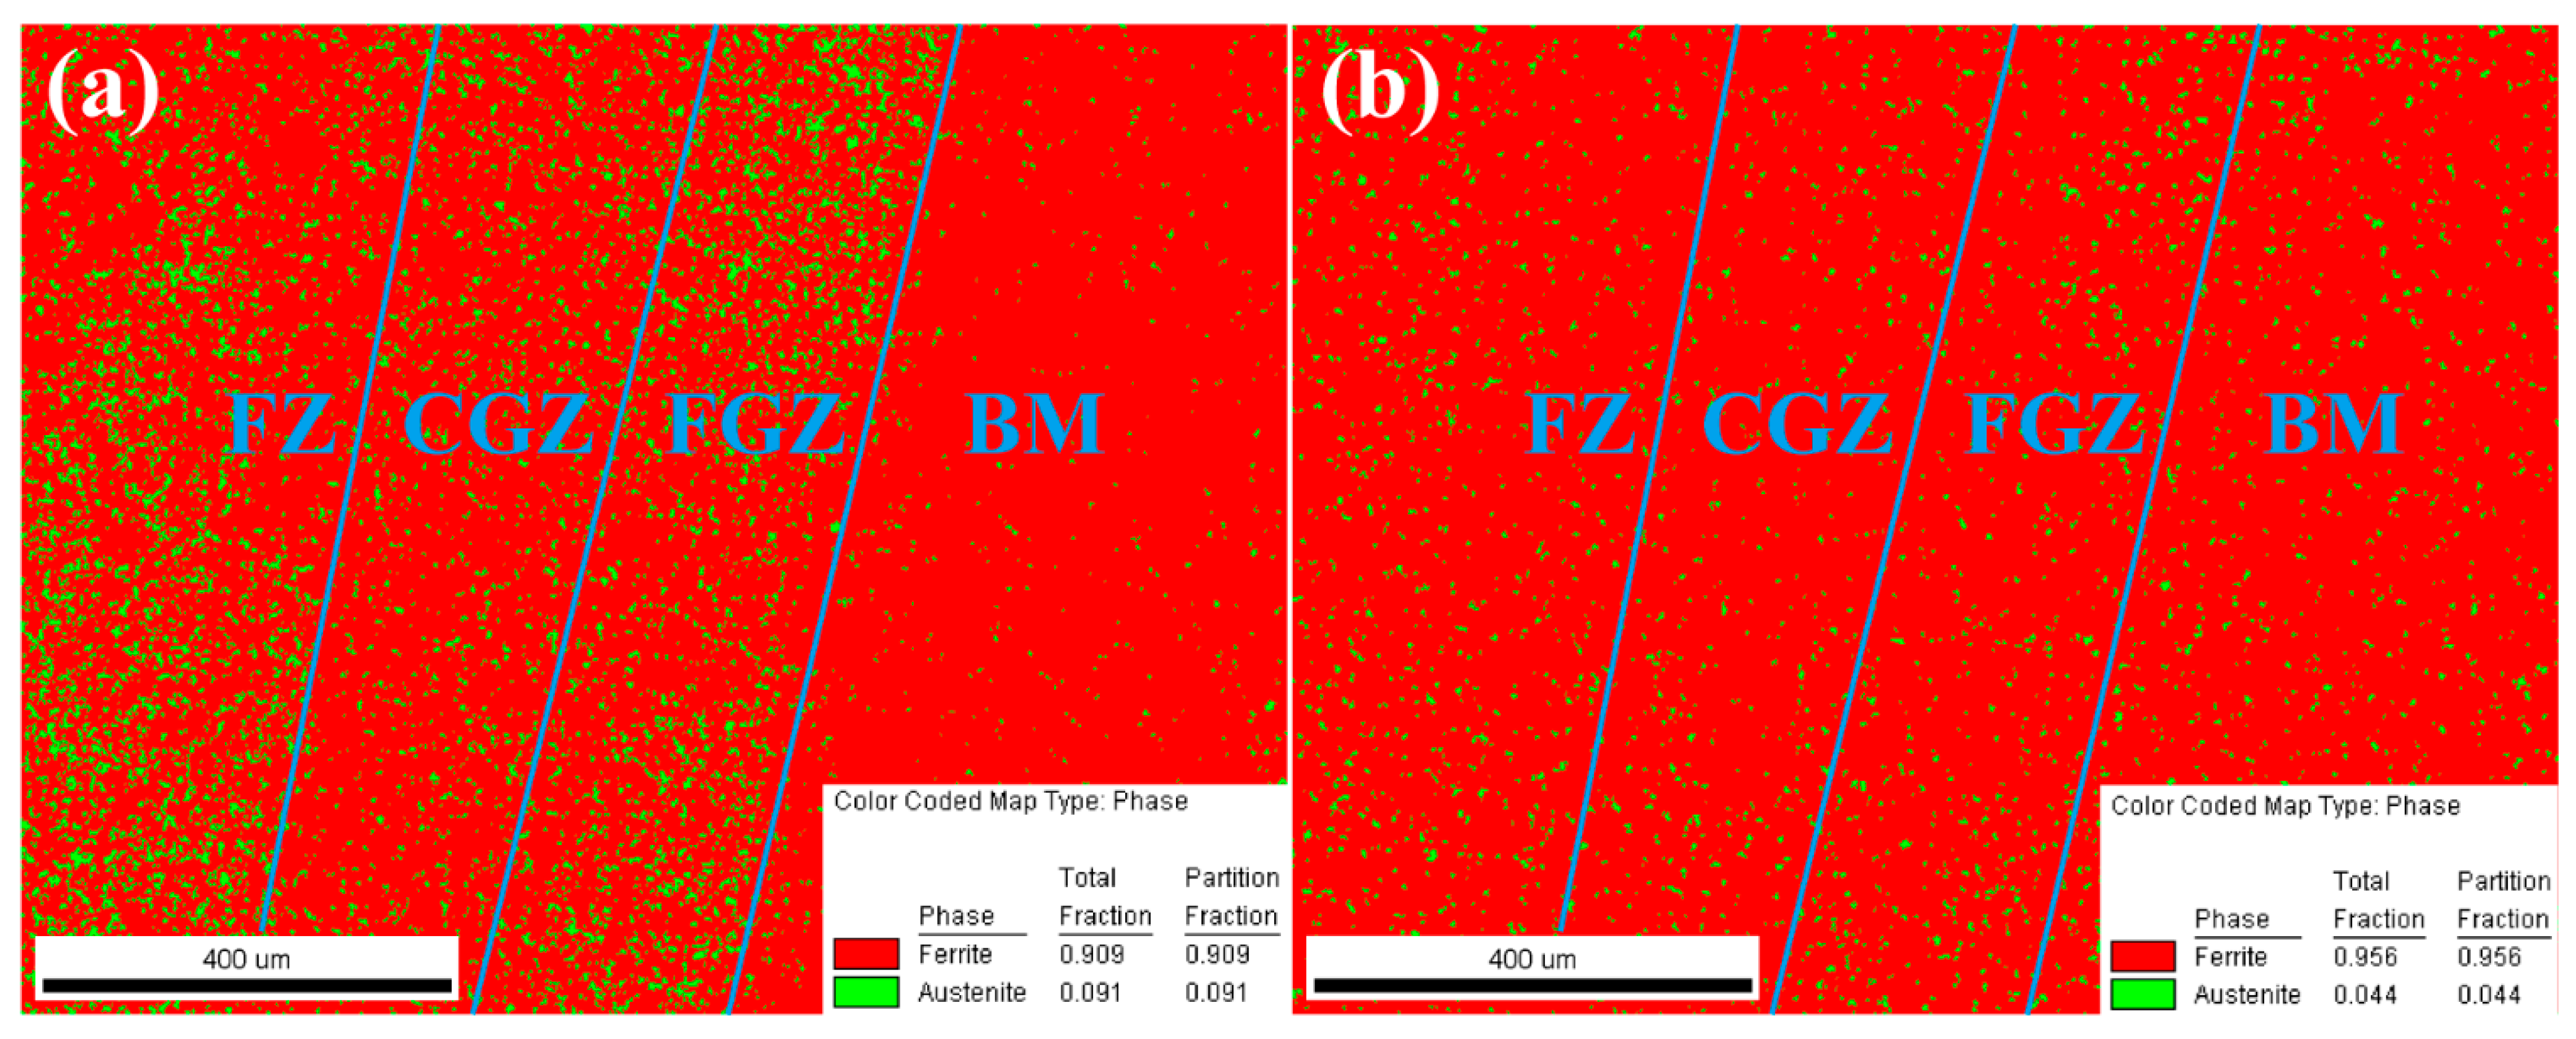
3.4.4. Retained Austenite before and after Quenching
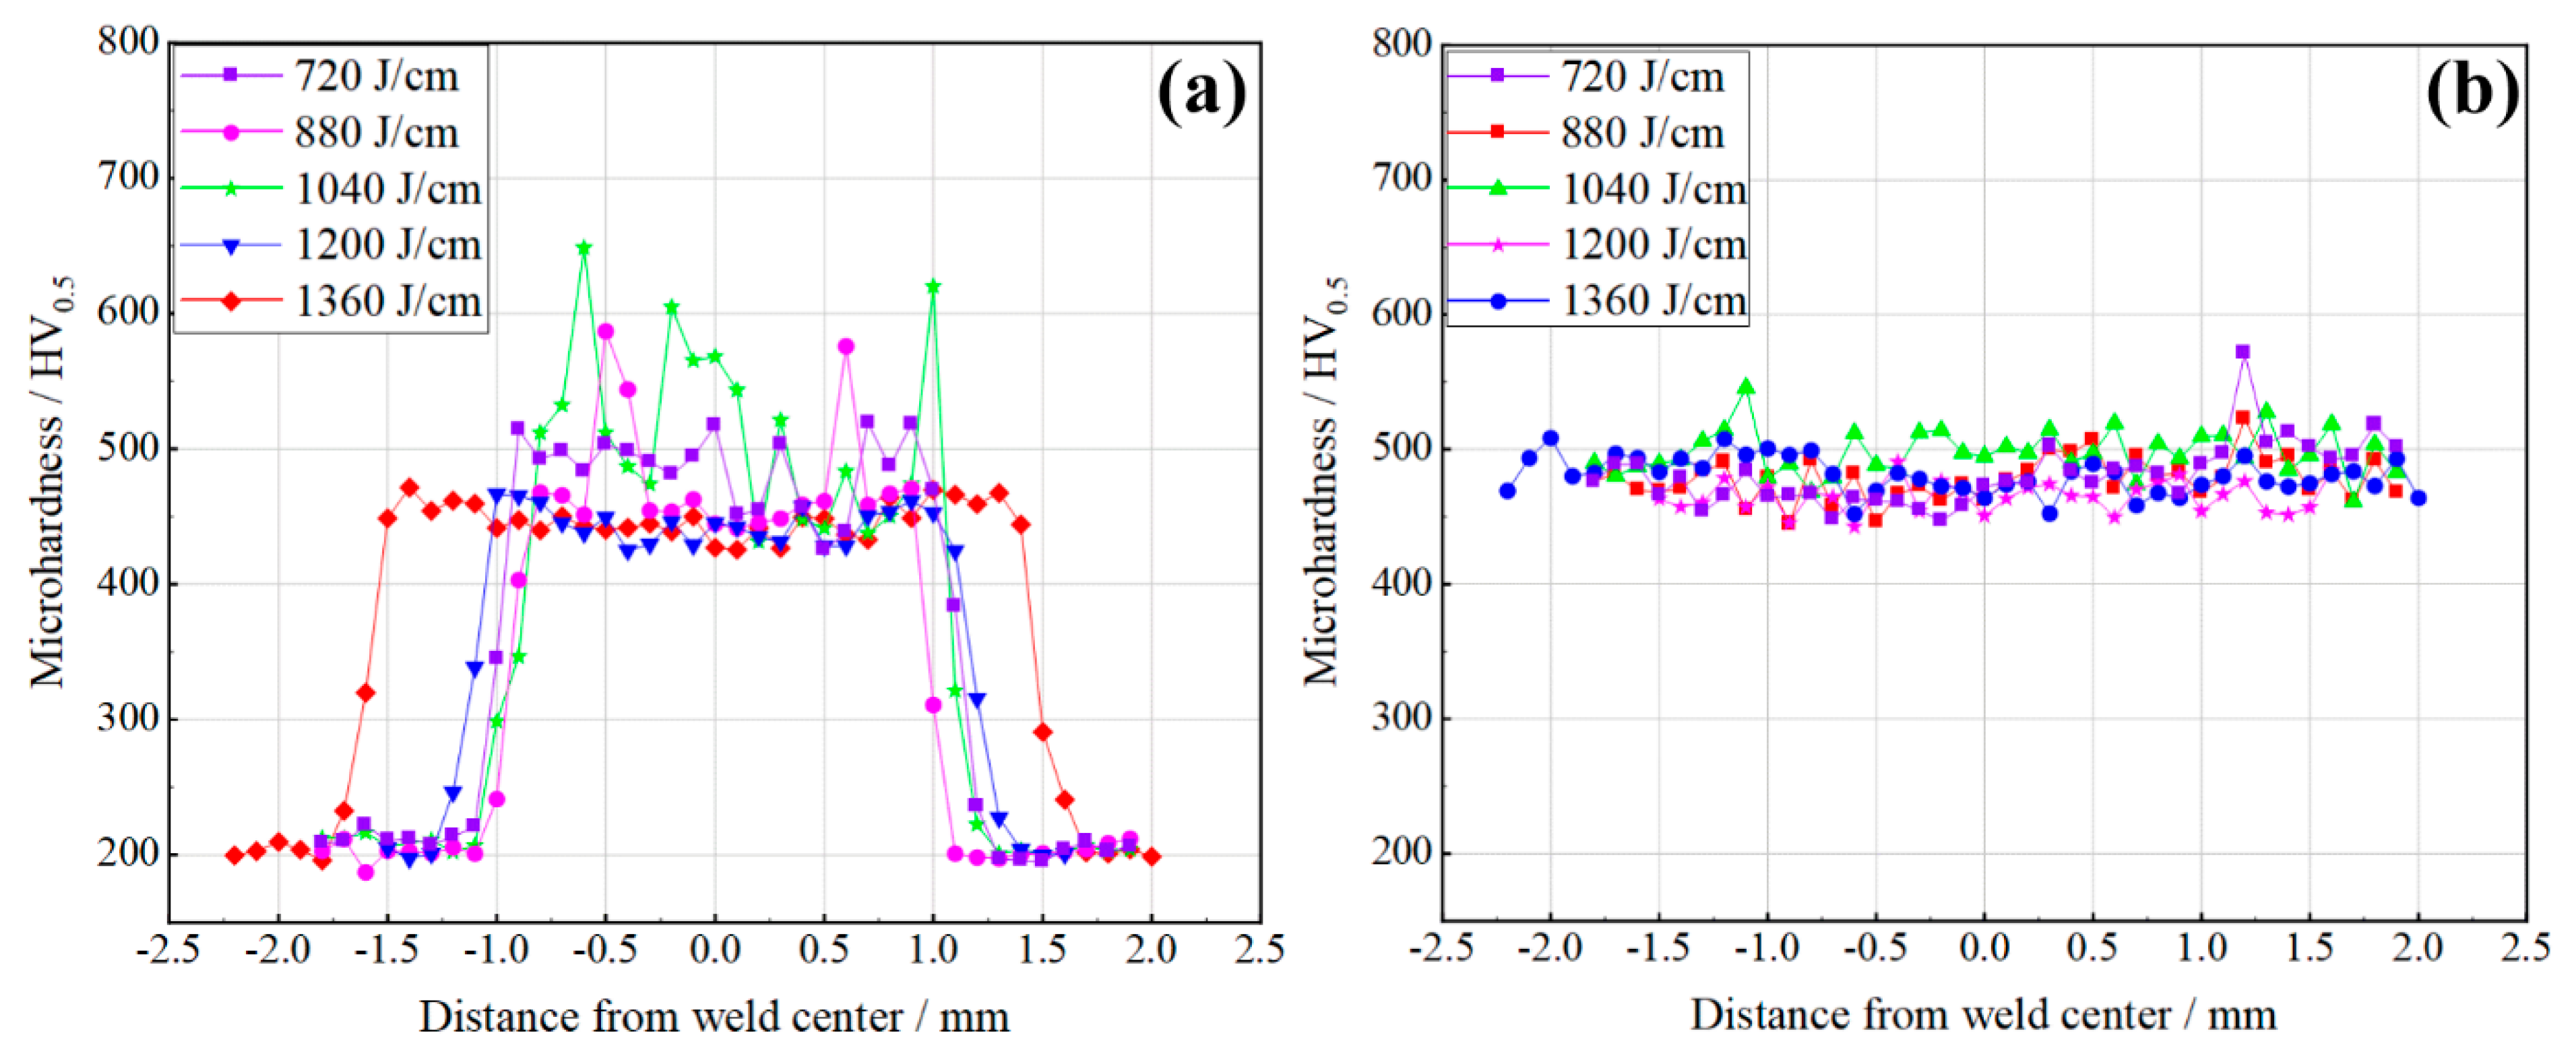
The retained austenite in the joint of sample No.3# was analyzed by EBSD and its distribution is presented in Figure 15. From Figure 15a, the fraction of retained austenite in the FZ and FGZ is very high before quenching and its distribution is very nonuniform, which has great influence on its microhardness. However, the fraction of retained austenite in the CGZ is clearly less than that in the FZ and FGZ. Figure 16b shows the distribution of retained austenite in the joint after quenching. With the fraction of 9.1% decreased to 4.4%, less retained austenite exists in the FZ, CGZ, and FGZ, and it distributes uniformly after quenching. However, the fraction of retained austenite in the BM increases significantly after the quenching process due to the fast cooling. Therefore, the quenching process distinctly decreases the retained austenite in the FZ and HAZ but increases it in the BM.

3.5. Microhardness

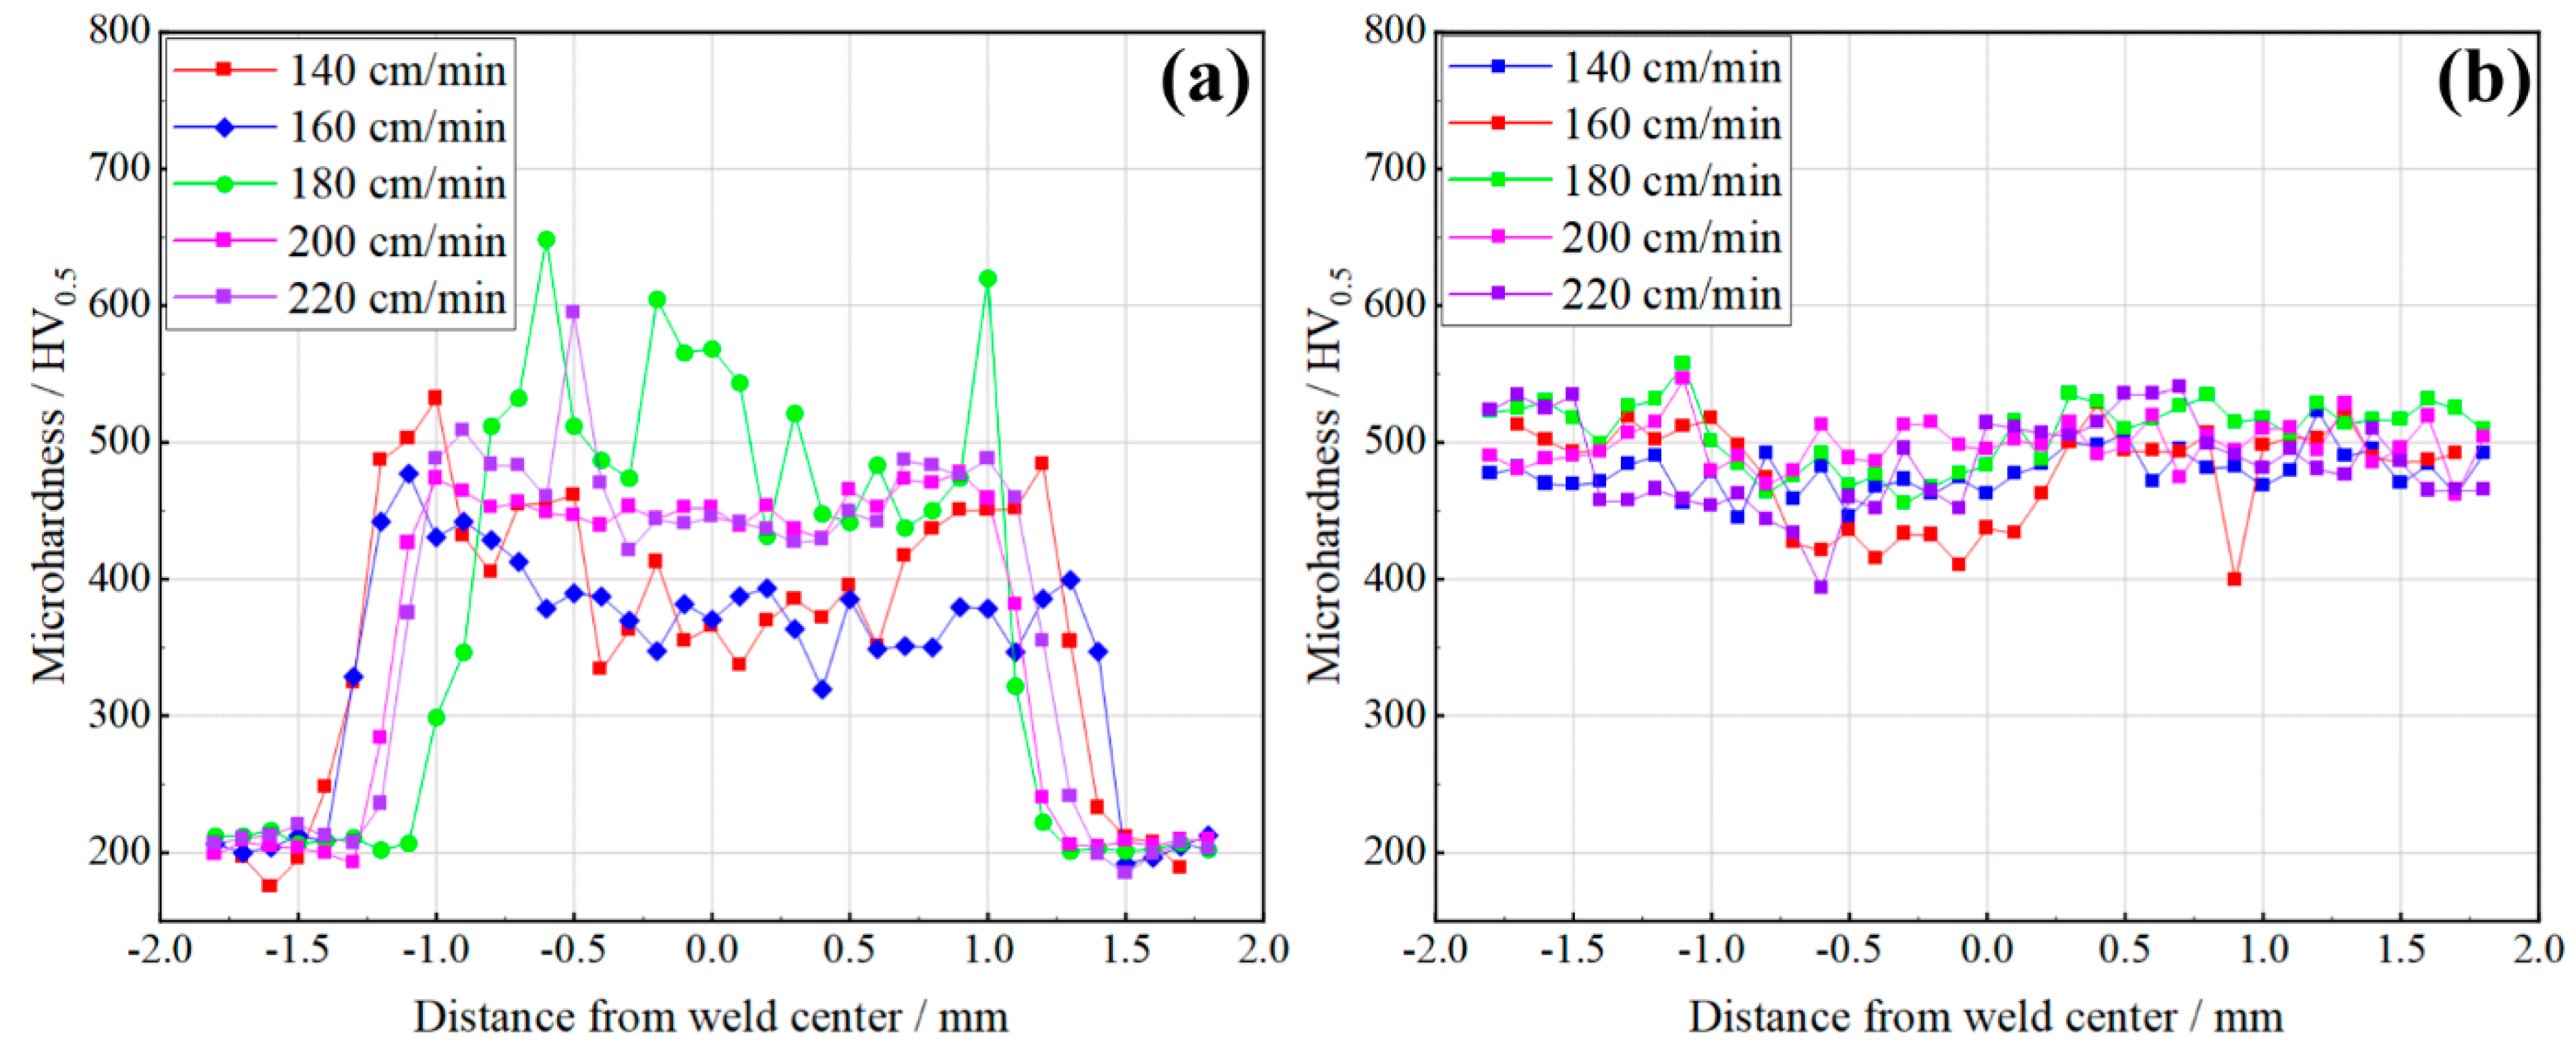
3.5.1. The Influence of Heat Input on Microhardness

Heat input and the quenching process have considerable influences on the microhardness of joints. Figure 16 shows the joint microhardness of samples No.1# to No.5# before and after quenching. From Figure 16a, the microhardness is higher than that of the BM and IRZ before quenching due to the FZ, CGZ, and FGZ containing a lot of martensite. The microhardness of the FZ, CGZ, and FGZ is greater than 450 HV but the BM is only about 206.06 ± 8.15 HV. This is the reason why the strength of the joint before quenching is higher than that of the BM. It can also be seen from Figure 16a that the width of the FZ and HAZ increases gradually with the increase in heat input. Furthermore, the grain growth is obvious as the heat input increases, resulting in a decrease in the microhardness. When the heat input is 720 J/cm, 880 J/cm, and even 1040 J/cm, the microhardness of the FZ, CGZ, and FGZ is greater than 500 HV, which is higher than that microhardness of 1200 J/cm and 1360 J/cm.
Figure 16b shows the microhardness of the quenched joint at different heat inputs. The microstructure of the FZ, HAZ, and BM transforms into martensite and a few retained austenite with a uniform grain after quenching. Thus, the microhardness becomes more uniform and is between 450 HV and 550 HV for all joint regions. The microhardness of the BM increases enormously from about 200 HV to 500 HV after quenching, while that of the FZ, CGZ, and FGZ only increases slightly. For the samples of heat input of 880 J/cm and 1020 J/cm, the microhardness decreases clearly but it distributes more uniformly on the whole joint. For the heat input of 1200 J/cm and 1360 J/cm, the high heat input and grain growth leads to low microhardness before quenching, but the microhardness increases slightly due to the grain refinement and the generation of more martensite after quenching. However, according to the analysis of the joint microhardness before and after quenching, it can be concluded that the quenching process can significantly improve the microhardness of the BM and IRZ, while homogenizing the microhardness and the microstructure of the CGZ, FGZ, and FZ.

3.5.2. The Influence of Wire-Feeding Speed on Microhardness

The joint microhardness of samples No.6# to No.9# and No.3# is shown in Figure 17. Figure 17a,b shows the microhardness of samples before and after quenching when the wire-feeding speed increases from 140 cm/min to 220 cm/min at heat input of 1040 J/cm. It can be clearly observed from Figure 17a that the microhardness of the FZ is about 375 HV at a wire-feeding speed of 140 cm/min and 160 cm/min before quenching. This may be because the low wire-feeding speed and the high-heat input leads to a high temperature and grain growth in the FZ. Therefore, when the wire-feeding speed increases to 180 cm/min, the microhardness of the FZ increases suddenly due to an increase in the volume of the wire metal. Then, if the wire-feeding speed is 200 cm/min or 220 cm/min, the microhardness of the FZ and HAZ remains between 450 HV and 500 HV. Therefore, it can be concluded that an increase in wire-feeding speed results in an increase in wire metal volume, which increases the microhardness of the FZ to some extent.
Figure 17b shows the microhardness of the joint at different wire-feeding speeds after quenching. The whole joint microhardness is between 450 HV and 550 HV and distributes uniformly after quenching, which is similar to Figure 16b. In analyzing the microhardness, it is determined that the heat input and wire-feeding speed only affect the microhardness before quenching of the joint and have less effect on the joint microhardness after quenching.

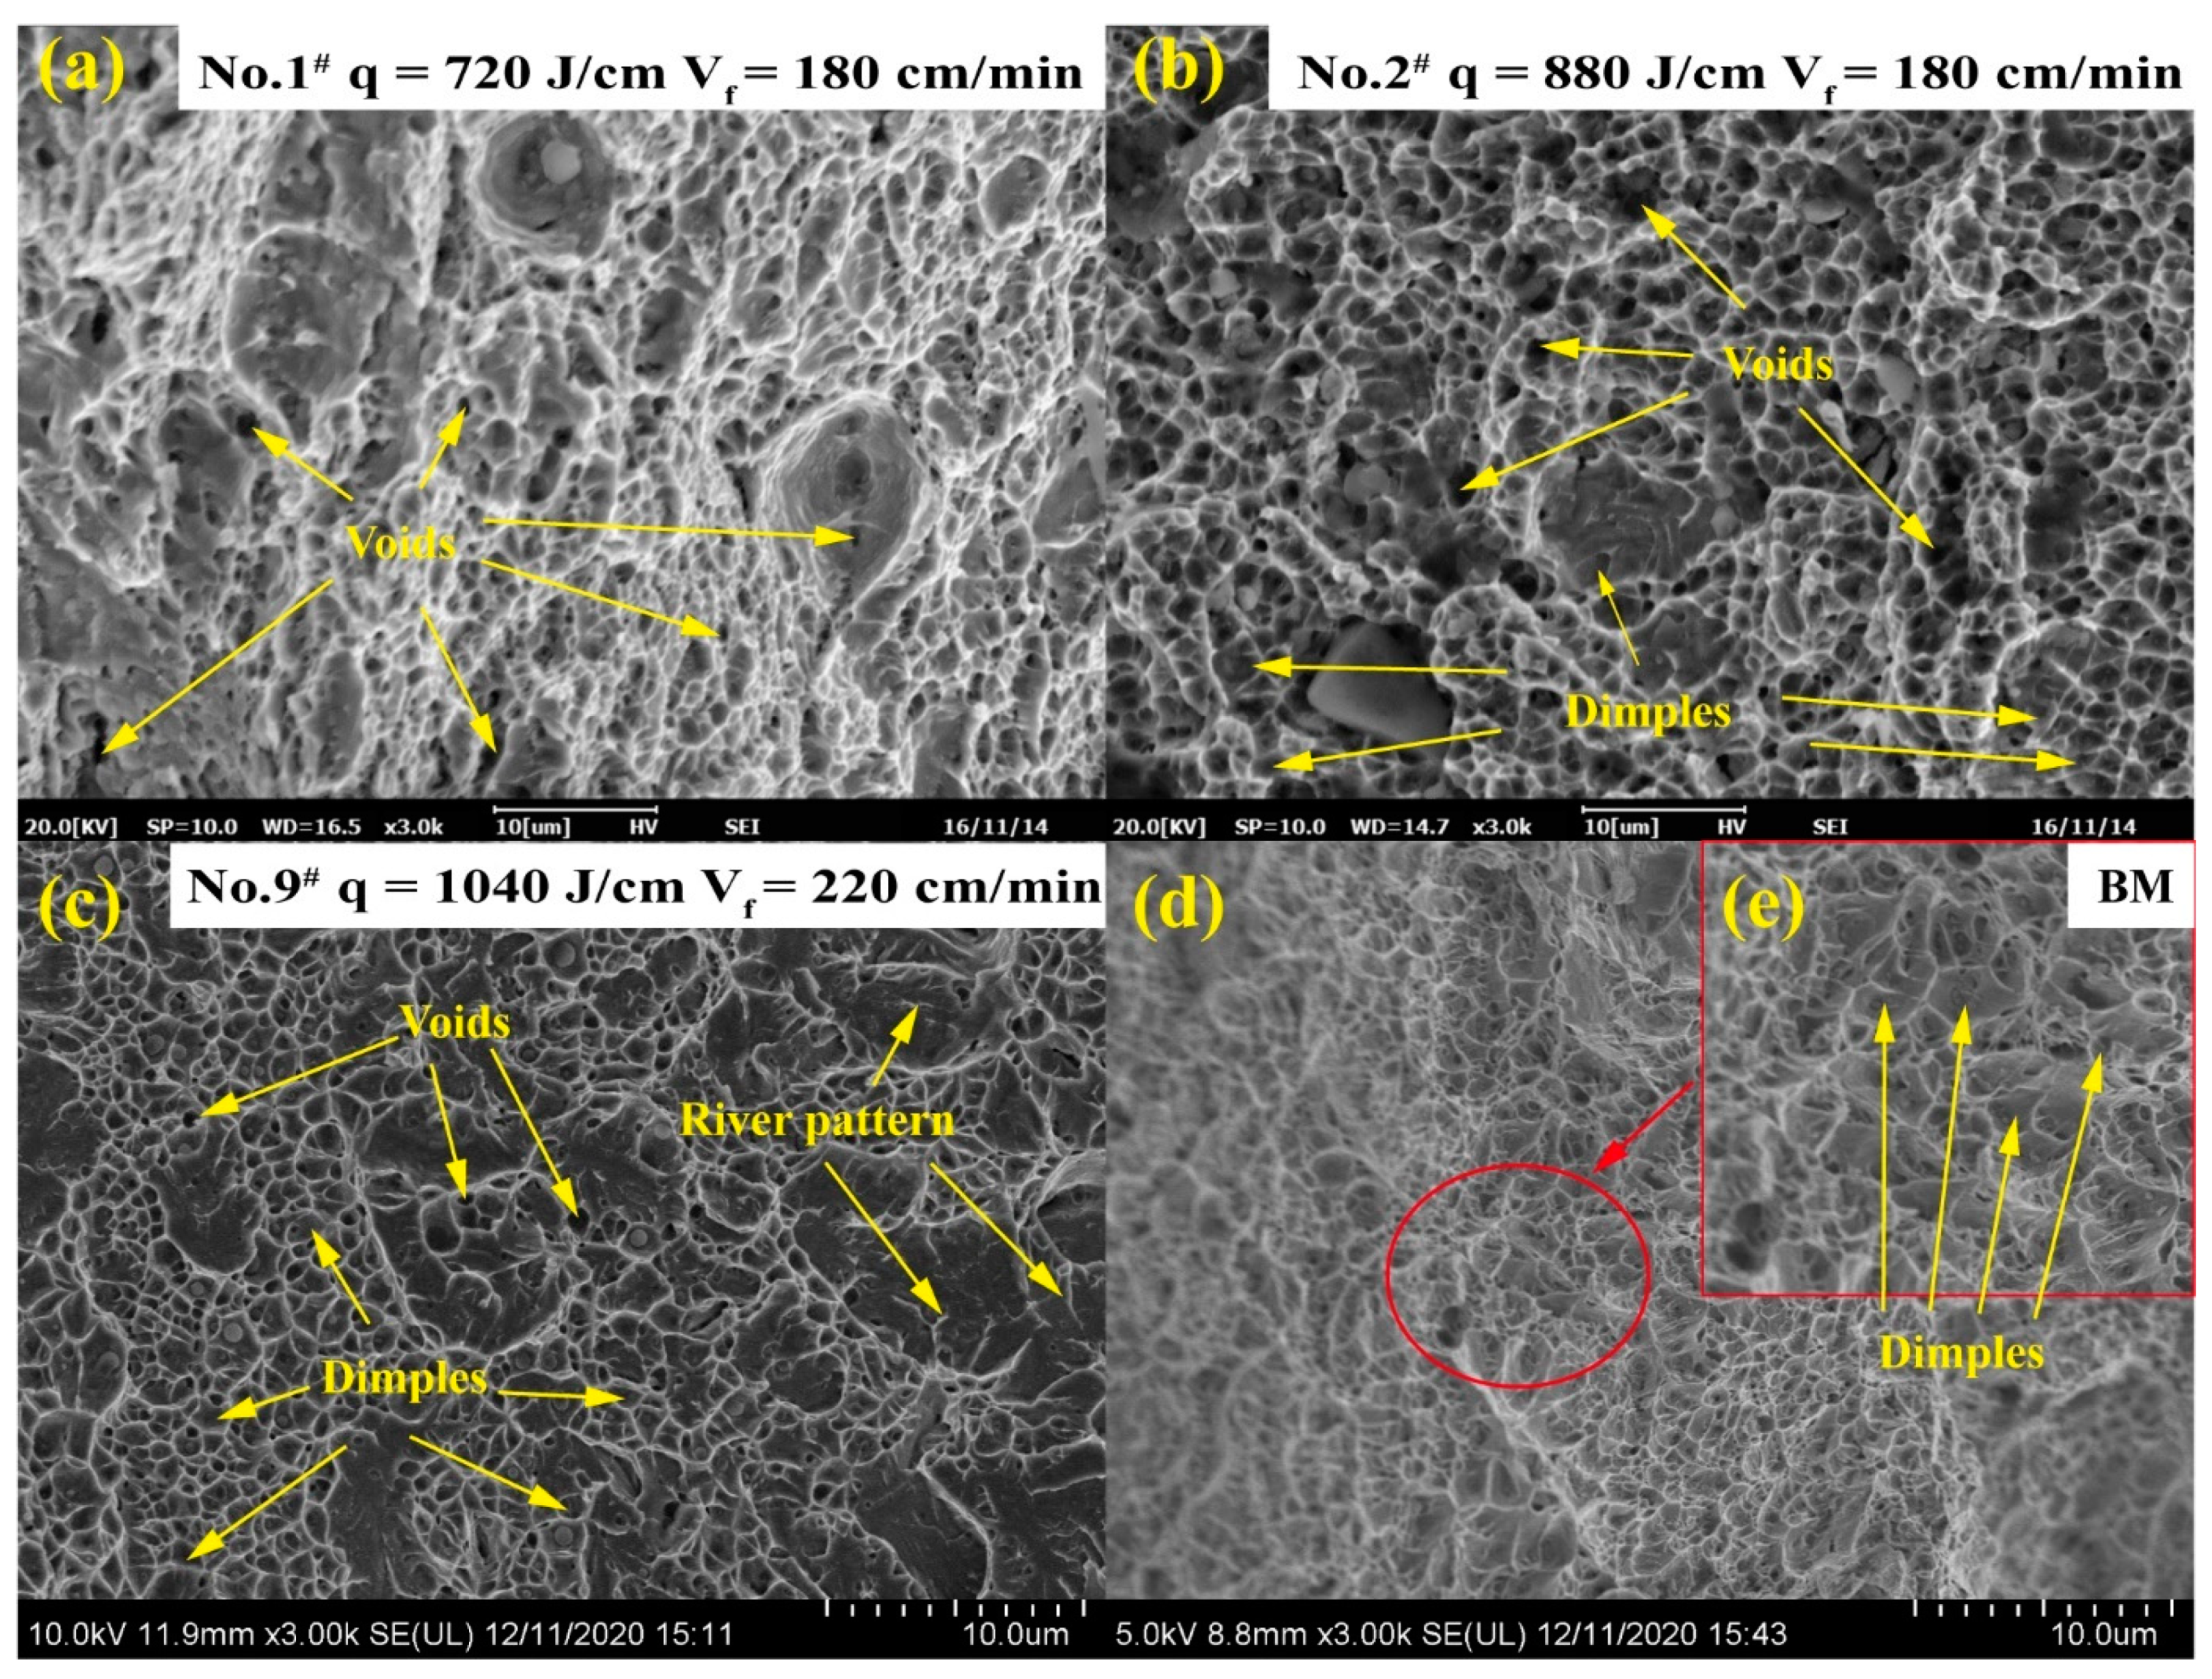
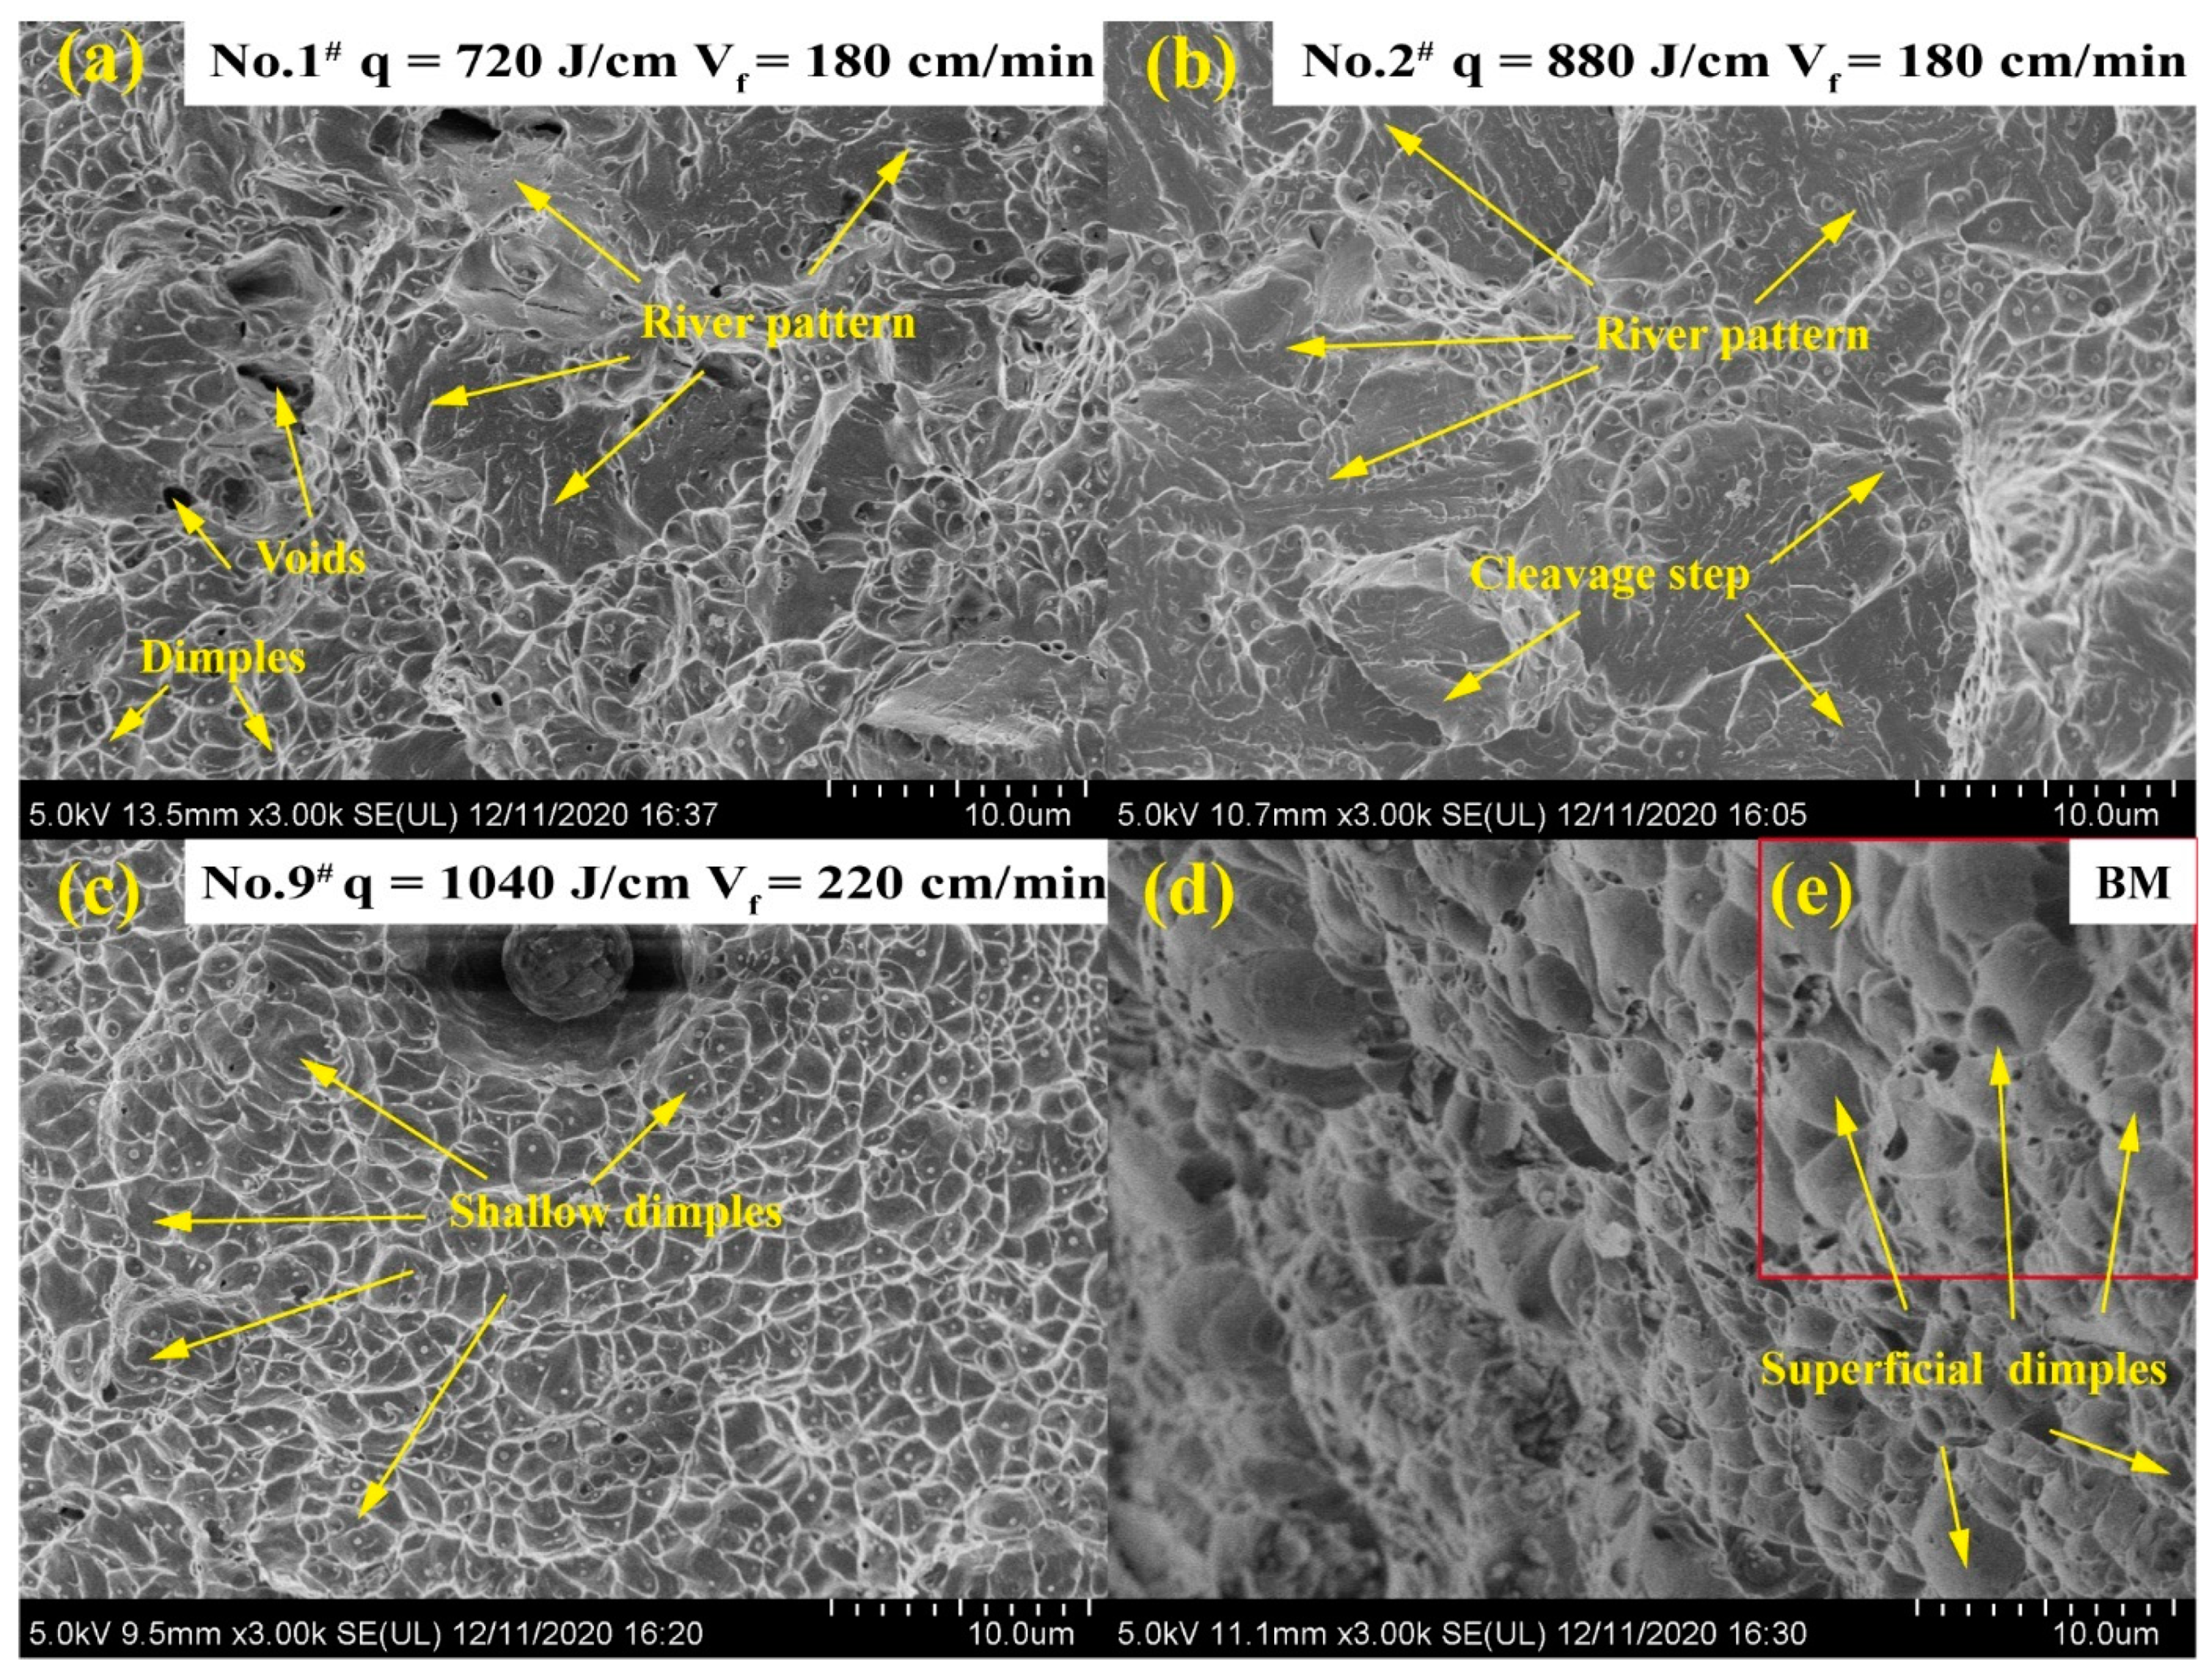
3.6. Fracture Morphology

Figure 18 shows the fracture morphology of the joint and the BM before quenching. A large number of dimples and some river patterns can be observed on the fracture morphology. The ductile fracture indicates that the joint before quenching has a good plasticity [19]. However, some river patterns and many voids are also observed in the dimples. This is mainly caused by the generation of high strength and poor ductility martensite after quenching and the large number of secondary cracks and dissociation platforms which occur during the tensile process [24]. The dimples in Figure 18b are cup-shaped dimples with large depth mixed with a large number of voids. The dimples in Figure 18c are axial dimples with small depth and nearly round shape. Furthermore, a large number of second-phase particles are observed at the bottom of the dimples. Figure 18d shows the tensile fracture of the BM before quenching. The dimples of the BM are denser and smaller with less secondary cracks distributed on the fracture surface. The surface of the fracture is more uneven, resulting in greater plastic deformation during the tensile test.
Figure 19 shows the fracture morphology of the joint and the BM after quenching. The microstructure of the joint combine with the high strength and brittleness of the martensite. The cleavage facets, dissociation river patterns, and a small number of shallow dimples were observed in the fracture morphology after quenching. Furthermore, the fracture morphology is flat with smaller plastic deformations before the fracture, indicating a brittle fracture of the joint after quenching. As particularly evident in Figure 19a,b, the fracture almost constitutes a cleavage step and river pattern. Figure 19d shows the fracture morphology of the BM after quenching. The fracture morphology of the BM fracture is flat and consists of a large number of shallow dimples. Compared with the BM before quenching, the BM has less plasticity after the quenching process with an elongation of about 6%.

4. Conclusions

BR1500HS hot stamping boron steel, in 3.5 mm thickness, was welded by fiber wire-filling laser welding with a gap of 0.5 mm at different heat inputs and wire-feeding speeds. The experiment result analysis led to the following conclusions.
The tensile strength of the joint after quenching is greater than 1601.9 MPa when the heat input is greater than 1040 J/cm and the wire-feeding speed is between 160 cm/min and 180 cm/min.
Before quenching, the microstructure of the FZ, CGZ, and FGZ consists of martensite and retained austenite. The FZ and FGZ distribute more retained austenite than the CGZ. After quenching, the retained austenite in the FZ and HAZ decreases clearly and distributes uniformly, while the retained austenite in the BM has increased due to the quenching process.
Before quenching, the FZ has a uniform grain diameter with some grain diameters greater than 40 μm. The grain diameter of the FGZ is the smallest in the whole zone and the CGZ has a similar grain diameter as the BM. After quenching, the grain diameter of the FZ, HAZ, and BM is more uniform and some coarse grains in the FZ have been refined. Furthermore, the phenomenon of grain growth in the BM was observed. The grain diameter is between 3.1 and 10.1 μm at the main part in the joint, accounting for more than 86.2% and 81.9% before and after quenching, respectively.
With the increase in heat input, the microhardness of the FZ and HAZ before quenching decreases from 500 HV to 450 HV. However, its microhardness increases from 450 HV to 500 HV as the wire-feeding speed increases. After quenching, the microhardness of all samples remains at 450 HV~550 HV and the microhardness in the FZ, HAZ, and BM remains unchanged.
A large number of dimples and little river patterns in the fracture morphology of the joint before quenching indicate a good plasticity. But after quenching, a large amount of the river patterns and cleavage facets are observed in fracture morphology due to the high strength and brittleness that martensite generates in the joint.

Author Contributions

Conceptualization, C.Z. and L.Z.; methodology, C.Z. and L.Z.; software, L.Z.; validation, Z.W. and R.M.; formal analysis, L.Z. and R.M.; investigation, R.M.; resources, L.Z.; data curation, R.M.; writing—original draft preparation, L.Z.; writing—review and editing, Z.W.; visualization, L.Z.; supervision, C.Z.; project administration, C.Z.; funding acquisition, C.Z. All authors have read and agreed to the published version of the manuscript.

Funding

This research and the APC was funded by Suizhou-WUT Industry Research Institute, grant number suikefa [2019]9.

Data Availability Statement

The data presented in this study are available in this article.

Conflicts of Interest

The authors declare no conflict of interest.

References

  1. Gu, X.; Zhu, K.; Wu, S.; Duan, Z.; Zhu, L. Effect of welding parameters on weld formation quality and tensile-shear property of laser welded SUS301L stainless steel lap filet weld. J. Mater. Res. Technol. 2020, 9, 4840–4854. [Google Scholar] [CrossRef]
  2. Mao, G.; Cayron, C.; Cao, R.; Logé, R.; Chen, J. The relationship between low-temperature toughness and secondary crack in low-carbon bainitic weld metals. Mater. Charact. 2018, 145, 516–526. [Google Scholar] [CrossRef]
  3. Prasad, H.S.; Frostevarg, J.; Kaplan, A.F.H. The stability of laser welding with an off-axis wire feed. J. Mater. Process. Technol. 2019, 264, 84–90. [Google Scholar] [CrossRef]
  4. Bunaziv, I.; Wenner, S.; Ren, X.; Frostevarg, J.; Kaplan, A.F.; Akselsen, O.M. Filler metal distribution and processing stability in laser-arc hybrid welding of thick HSLA steel. J. Manuf. Process. 2020, 54, 228–239. [Google Scholar] [CrossRef]
  5. Zhang, S.; Sun, J.; Zhu, M.; Zhang, L.; Nie, P.; Li, Z. Fiber laser welding of HSLA steel by autogenous laser welding and autogenous laser welding with cold wire methods. J. Mater. Process. Technol. 2020, 275, 116353. [Google Scholar] [CrossRef]
  6. Wang, H.; Wang, Y.; Li, X.; Wang, W.; Yang, X. Influence of Assembly Gap Size on the Structure and Properties of SUS301L Stainless Steel Laser Welded Lap Joint. Materials 2021, 14, 996. [Google Scholar] [CrossRef] [PubMed]
  7. Acherjee, B. Hybrid laser arc welding: State-of-art review. Opt. Laser Technol. 2018, 99, 60–71. [Google Scholar] [CrossRef]
  8. Ribeiro, H.V.; Baptista, C.; Lima, M.; Torres, M.; Marcomini, J. Effect of Laser welding heat input on fatigue crack growth and CTOD fracture toughness of HSLA steel joints. J. Mater. Res. Technol. 2021, 11, 801–810. [Google Scholar] [CrossRef]
  9. Zhao, Y.; Ma, S.; Huang, J.; Wu, Y. Narrow-gap laser welding using filler wire of thick steel plates. Int. J. Adv. Manuf. Technol. 2017, 93, 2955–2962. [Google Scholar] [CrossRef]
  10. Ahn, J.; Chen, L.; He, E.; Davies, C.; Dear, J. Effect of filler metal feed rate and composition on microstructure and mechanical properties of fibre laser welded AA 2024-T3. J. Manuf. Process. 2017, 25, 26–36. [Google Scholar] [CrossRef]
  11. Yang, M.; Lu, J.; Chen, J.; Li, Y.; Yang, H.; Liu, Y. Effect of welding speed on microstructure and corrosion resistance of Al–Li alloy weld joint. Mater. Corros. 2020, 71, 300–308. [Google Scholar] [CrossRef]
  12. Lee, H.W.; Yoo, K.J.; Tran, M.T.; Moon, I.Y.; Oh, Y.S.; Kang, S.H.; Kim, D.K. Effect of Quenching Tempering-Post Weld Heat Treatment on the Microstructure and Mechanical Properties of Laser-Arc Hybrid-Welded Boron Steel. Materials 2019, 12, 2862. [Google Scholar] [CrossRef] [Green Version]
  13. Li, M.; Yao, D.; Guan, Y.; Duan, Y.; Yang, L. Effect of Welding Speed and Post Quenching on the Microstructure and Mechanical Properties of Laser-Welded B1500HS Joints. Materials 2020, 13, 4645. [Google Scholar] [CrossRef]
  14. Das, C.R.; Albert, S.K.; Bhaduri, A.K.; Murty, B.S. Effect of boron addition and initial heat-treatment temperature on microstructure and mechanical properties of modified 9Cr-1Mo steels under different heat-treatment conditions. Metall. Mater. Trans. A 2013, 44, 2171–2186. [Google Scholar] [CrossRef]
  15. Lin, W.; Li, F.; Hua, X.; Wu, N. Effect of filler wire on laser welded blanks of Al-Si-coated 22MnB5 steel. J. Mater. Process. Technol. 2018, 259, 195–205. [Google Scholar] [CrossRef]
  16. Saha, D.C.; Biro, E.; Gerlich, A.P.; Zhou, Y.N. Fiber laser welding of AlSi coated press hardened steel. Weld J. 2016, 95, 147–156. [Google Scholar]
  17. Zhao, H.; Huang, R.; Sun, Y.; Tan, C.; Wu, L.; Chen, B.; Song, X.; Li, G. Microstructure and mechanical properties of fiber laser welded QP980/press-hardened 22MnB5 steel joint. J. Mater. Res. Technol. 2020, 9, 10079–10090. [Google Scholar] [CrossRef]
  18. Chen, L.; Nie, P.; Qu, Z.; Ojo, O.; Xia, L.; Li, Z.; Huang, J. Influence of heat input on the changes in the microstructure and fracture behavior of laser welded 800MPa grade high-strength low-alloy steel. J. Manuf. Process. 2020, 50, 132–141. [Google Scholar] [CrossRef]
  19. Fang, N.; Guo, E.; Huang, R.; Yin, L.; Chen, Y.; Zeng, C.; Cao, K.; Zou, J.; Xu, K. Effect of welding heat input on microstructure and properties of TC4 titanium alloy ultra-narrow gap welded joint by laser welding with filler wire. Mater. Res. Express 2021, 8, 016511. [Google Scholar] [CrossRef]
  20. Cai, D.; Luo, Z.; Han, L.; Han, S.; Yi, Y. Porosity and joint property of laser-MIG hybrid welding joints for 304 stainless steel. J. Laser Appl. 2020, 32, 022056. [Google Scholar] [CrossRef]
  21. Pu, J.; Zhao, Y.; Jiang, Y.; Zou, J.; Song, S. Influence of wire feeding speed on the melting behavior and formation of narrow-gap joint by laser welding with filler wire. J. Laser Appl. 2020, 32, 032007. [Google Scholar] [CrossRef]
  22. He, E.; Liu, J.; Lee, J.; Wang, K.; Politis, D.J.; Chen, L.; Wang, L. Effect of porosities on tensile properties of laser-welded Al-Li alloy: An experimental and modelling study. Int. J. Adv. Manuf. Technol. 2018, 95, 659–671. [Google Scholar] [CrossRef] [Green Version]
  23. Gu, X.; Cui, Z.; Gu, X.; Shao, J. Wire-Feeding Laser Welding of Copper/Stainless Steel Using Different Filler Metals. Materials 2021, 14, 2122. [Google Scholar] [CrossRef] [PubMed]
  24. Mihaliková, M.; Zgodavová, K.; Bober, P.; Špegárová, A. The Performance of CR180IF and DP600 Laser Welded Steel Sheets under Different Strain Rates. Materials 2021, 14, 1553. [Google Scholar] [CrossRef] [PubMed]
Figure 1. The description of wire-filling laser welding of (a) schematic diagram; (b) field experiment.
Metals 11 01047 g001
Figure 2. The dimension of the tensile test specimen (Unit: mm).
Metals 11 01047 g002
Figure 3. The position of microhardness test of (a) schematic diagram; (b) test diagram.
Metals 11 01047 g003
Figure 4. Macrostructure of joints of (a) No.1# q = 720 J/cm; (b) No.2# q = 880 J/cm; (c) No.3# q = 1040 J/cm; (d) No.4 # q = 1200 J/cm; (e) No.5# q = 1360 J/cm.
Metals 11 01047 g004
Figure 5. The samples and tensile strength at different heat inputs: (a) samples before quenching; (b) samples after quenching; (c) tensile strength of samples No.1# to No.5#.
Metals 11 01047 g005
Figure 6. Macrostructure of joints of (a) No.6#  v f = 140   cm / min ; (b) No.7#  v f = 160   cm / min ; (c) No.3#  v f = 180   cm / min ; (d) No.8 #  v f = 200   cm / min ; (e) No.8#  v f = 220   cm / min .
Metals 11 01047 g006
Figure 7. The samples and tensile strength at different wire-feeding speeds: (a) samples before quenching; (b) samples after quenching; (c) tensile strength of samples No.3# and No.6# to No.9#.
Metals 11 01047 g007
Figure 8. The microstructure of sample No.3# before quenching: (a) macro morphology; (b) FZ; (c) CGZ; (d) FGZ; (e) IRZ; (f) BM.
Metals 11 01047 g008
Figure 9. The microstructure of sample No.3# after quenching: (a) macro morphology; (b) FZ; (c) original HAZ; (d) BM.
Metals 11 01047 g009
Figure 10. Grain diameter of sample No.3# (a) before quenching; (b) after quenching.
Metals 11 01047 g010
Figure 11. The statistical result of the grain diameter of sample No.3 before and after quenching.
Metals 11 01047 g011
Figure 12. Grain orientation distribution of sample No.3# of (a) before quenching; (b) after quenching.
Metals 11 01047 g012
Figure 13. Angle misorientation of joint grain boundary of sample No.3#: (a) before quenching; (b) after quenching.
Metals 11 01047 g013
Figure 14. The statistical result of the misorientation angle before and after quenching.
Metals 11 01047 g014
Figure 15. Retained austenite distribution of sample No.3# of (a) before quenching; (b) after quenching.
Metals 11 01047 g015
Figure 16. Microhardness of the joint at different heat inputs: (a) before quenching; (b) after quenching.
Metals 11 01047 g016
Figure 17. Microhardness of joint at different wire-feeding speeds: (a) before quenching; (b) after quenching.
Metals 11 01047 g017
Figure 18. Tensile fracture morphology of the samples before quenching: (a) sample No.1#; (b) sample No.2#; (c) sample No.9#; (d) base materials (BM); (e) partial enlargement of base materials.
Metals 11 01047 g018
Figure 19. Tensile fracture morphology of samples after quenching: (a) sample No.1#; (b) sample No.2#; (c) sample No.9#; (d) base materials (BM); (e) partial enlargement of base materials.
Metals 11 01047 g019
Table 1. The chemical composition of BR1500HS and ER70-G wire.
ElementsCSiMnCrNiMoBAlTiCuVSP
BR1500HS0.230.251.350.190.0280.040.0030.040.030.0160.0040.0060.015
ER70-G0.10.61.6-0.70.4--0.20.5-0.0250.025
Table 2. Tensile strength and fracture position of samples No.1# to No.9# before and after quenching.
No.Power (P)Wire-Feeding Speed (vf)Welding Speed (v)Heat Input (q)Before QuenchingAfter Quenching
Tensile StrengthFracture PositionTensile StrengthFracture Position
Wcm/mincm/minJ/cmMPa-MPa-
1#1800180150720398.5 ± 17.4Joint743.3 ± 77.9Joint
2#2200180150880557 ± 28.1Joint1023.9 ± 55.8Joint
3#26001801501040631.3 ± 2.84BM1601.9 ± 37.3Joint
4#30001801501200630.5 ± 2.2BM1647.2 ± 23.8Joint
5#34001801501360623.9 ± 3.2BM1638.2 ± 33.3Joint
6#26001401501040588.9 ± 9.8Joint618.1 ± 50.1Joint
7#26001601501040630.2 ± 1.5BM1630.8 ± 68.3Joint
8#26002001501040583 ± 30.4BM1160.3 ± 126.3Joint
9#26002201501040605.7 ± 20.3BM1364.7 ± 21.8Joint
Publisher’s Note: MDPI stays neutral with regard to jurisdictional claims in published maps and institutional affiliations.

