Article

Numerical Investigation of Thermo-Mechanical Field during Selective Laser Melting Process with Experimental Validation

Department of Mechanical & Aerospace Engineering, Missouri University of Science and Technology, Rolla, MO 65409, USA
*
Author to whom correspondence should be addressed.
Metals 2021, 11(7), 1003; https://doi.org/10.3390/met11071003
Submission received: 16 May 2021 / Revised: 13 June 2021 / Accepted: 18 June 2021 / Published: 23 June 2021
(This article belongs to the Special Issue Advances in Additive Manufacturing of Metals)

Abstract

:
In this study, thermo-mechanical simulation was conducted to predict thermal and stress behavior in Selective Laser Melting (SLM). Temperature-dependent material properties for processed material 304L stainless steel were incorporated into the model in order to capture the change from powder to fully dense solid stainless steel. Temperature and thermal stress history were tracked under conditions of different parameter sets which were designed to reduce defect formation. The thermal model predicted the temperature history for multi-track scans under different process parameters, such as laser power, effective scanning speed and hatch spacing. Subsequently, the corresponding melt-pool size, solidification rate and temperature gradients could be calculated from simulated temperature data. These three parameters from the simulation were compared with experimental melt pool size, grain structure and cell spacing data obtained from a Renishaw AM250. The experimental data were also used to determine unknown simulation parameters required by the continuum model, e.g., the optical penetration depth and thermal conductivity multiplier for the molten region. This allowed the simulation model to accurately predict melt pool size and solidification structure of SLM 304L stainless steel. Simulated stress showed that the subsequent thermal cyclic melting in successive scanned tracks resulted in alternating compressive and tensile thermal stresses. This work will provide insight for studying microstructure morphology, residual stress and deformations in the SLM process of 304L stainless steel.

1. Introduction

Selective Laser Melting (SLM) is a powder bed-based Additive Manufacturing (AM) technology. It is widely used in freeform fabrication of complex three-dimensional metal parts directly from CAD models by adding material layer by layer [1]. SLM introduces the opportunity to build parts with engineered mechanical properties. These properties are determined by the microstructure morphology, which is controlled by part thermal processing history. Therefore, in order to produce parts with engineered properties, it is critical to understand SLM process parameters affecting thermal behavior and microstructure, such as laser spot size, power, scanning speed and scanning strategy. However, it is time-consuming and costly to analyze through experiments the effects of different process parameters on the temperature distribution, solidification behavior and mechanical properties of parts. This problem can be solved with recourse to numerical models, which have shown advantages for understanding the relationship of process parameters to thermal history and ultimate mechanical properties.
In the SLM process, laser input is highly localized in a micron-sized region. Thus, inside the melt pool, melting and solidification are very fast, resulting in the unique microstructure of the fabricated parts [2,3,4,5]. Recently, numerical models have been developed and used in previous studies analyzing SLM thermal history. Most of these models focused on the investigation of melt pool geometry as a function of process parameters such as laser power, scanning speed, beam size and scan strategy. For instance, researchers [6,7,8,9] simulated temperature distribution during SLM processing of 316L stainless steel. Results showed that process parameters, including scan speed, powder layer thickness and thermal properties of the materials, could highly affect the SLM process. Loh et al. [10] investigated the effect of laser beam distributions on melt pool geometry in SLM of aluminum alloy 6061 (AA6061). Uniform and Gaussian laser beam models were compared in their research. Results revealed that melt depth was similar for both distributions. However, melt width under the uniform laser beam was smaller than the uniform beam diameter itself, while melt width under the Gaussian laser was larger than the beam diameter. Kolossov et al. [11] developed a 3D finite element model to predict thermal behavior on the upper surface of a titanium powder bed during the SLM process. Their results showed that thermal conductivity highly affected the thermal process. Thijs et al. [12,13,14] presented an experimental study on specific microstructures in AlSi10Mg and Ti6Al4V parts after SLM processing. They reported that strong crystallographic textures had a significant influence on the mechanical properties, due to the high temperature gradients. Mechanical properties of SLM parts depend primarily on their microstructure and solidification morphology.
Characteristic thermal parameters, including the cooling rate, thermal gradient and the solid-liquid interface velocity at the solidification front, affect the solidification structure of a component. These parameters may influence microstructural features such as phase change, grain size, and the transition from columnar to equiaxed growth, all of which have a significant effect on the resulting properties of the component. Therefore, microstructure development during SLM solidification needs to be understood as part of the effort to facilitate the industrial deployment of AM. Thermal condition can be controlled by SLM parameters to optimally design microstructure morphology. The lack of understanding of the thermal history and solidification parameters inside the melt pool drives the first objective of this work. The effects of scan strategy on the thermal gradient, cooling rate and solid–liquid interface velocity were calculated by the present model.
During the SLM process, the powder bed is exposed to a laser beam with high density flux, which generates high temperature gradients in the exposure area [15]. The nonuniform thermal expansions in the Heat Affected Zone (HAZ) result in residual stresses in the finished part, which may cause failure, including distortion, crack formation and low fatigue performance during manufacture [16]. These process defects remain unsolved and are detrimental for operational performance [17]. In order to better understand the parameters influencing the buildup of residual stress, thermo-mechanical models for simulating the SLM process have been developed. In these studies [18,19,20], numerical models have been developed to analyze the relations between process parameters and mechanical performances. Antony et al. [21] conducted numerical and experimental work on the SLM process performed with 316L stainless steel. They analyzed the effect of process parameters such as laser power, scanning speed and laser beam size on melt pool sizes and ball formation. Conclusions included that scanning speed had no influence on track height and wetting angle, while laser power and scanning speed had obvious effects on track smoothness, distortion and irregularities. These simulation results were validated by experimental results. Parry et al. [22] developed a thermo-mechanical model to determine the thermal behavior and residual stress resulting from the SLM process. They found that scan strategies affected the stress distribution. Their results showed that longitudinal stress was the main contributor to residual stress due to larger thermal gradient in the laser scanning direction. In addition, it was also recognized that preheating temperature affected thermal stress and cracks significantly [23]. For example, Cao et al. [24] established a three-dimensional thermo-mechanical model to analyze the effect of preheating on stress and distortion in electron beam-based additive manufacturing; their results indicated that preheating could decrease the distortion and stress to final parts. Dai and Shaw [25,26,27] developed a 3D thermo-mechanical finite element model to investigate the thermal behavior, stresses behavior and warpage of a component fabricated by multiple layers with multiple materials. In their study, larger residual stresses and increased warpage were found to result from higher temperature gradients. Stainless steels have commonly been used in SLM process because of their excellent weldability, high strength and corrosion resistance relative to austenitic steels. From the discussion above, mechanical properties of SLM parts depend primarily on their microstructure (i.e., grain size and morphology) and are influenced by thermal history during manufacturing, i.e., cooling rates, thermal gradients, and reheating cycles. This lack of understanding is attributed to the complexity of the underlying physical transformations that occur during SLM, such as rapid melting, solidification and re-melting of the processed material. The focus of this paper is to investigate the microstructure and thermal stress history, which are controlled by the thermal history and solidification parameters, of stainless steel 304L in the SLM process.
In this paper, a finite element model for the SLM process with processed material of stainless steel 304L based on sequentially coupled thermo-mechanical analysis in commercial software ABAQUS (Version 2016, Abaqus Inc., Palo Alto, CA, USA) was developed for accurately predicting thermal history, melt pool microstructure and residual stress. The objective of this study was to experimentally validate the calculated thermal history, cooling rates, and describe the effects of thermal behavior on the morphological features of microstructure that developed during SLM process. The correlation between thermal history, microstructure, and properties of the deposited components was analyzed and reported in this article. The paper is structured as follows. Section 2 is dedicated to FE model setup and boundary conditions. Temperature dependent material properties were incorporated into the model, capturing the change from powder to fully dense solid stainless steel. Section 3 gathers all the experimental work and sample preparation for easy identification of melt pools to develop the validation. In Section 4, the temperature distribution, melt pool sizes, solidification morphology parameters and the effects of process parameters, such as laser power, scanning speed and hatch spacing are analyzed. Furthermore, experiments were conducted to study the melt pool sizes and microstructural features of SLM-produced parts using different laser processing parameters to verify the reliability of this model. Finally, conclusions are drawn about this approach.

2. Numerical Analysis of Selective Laser Melting 304L Stainless Steel
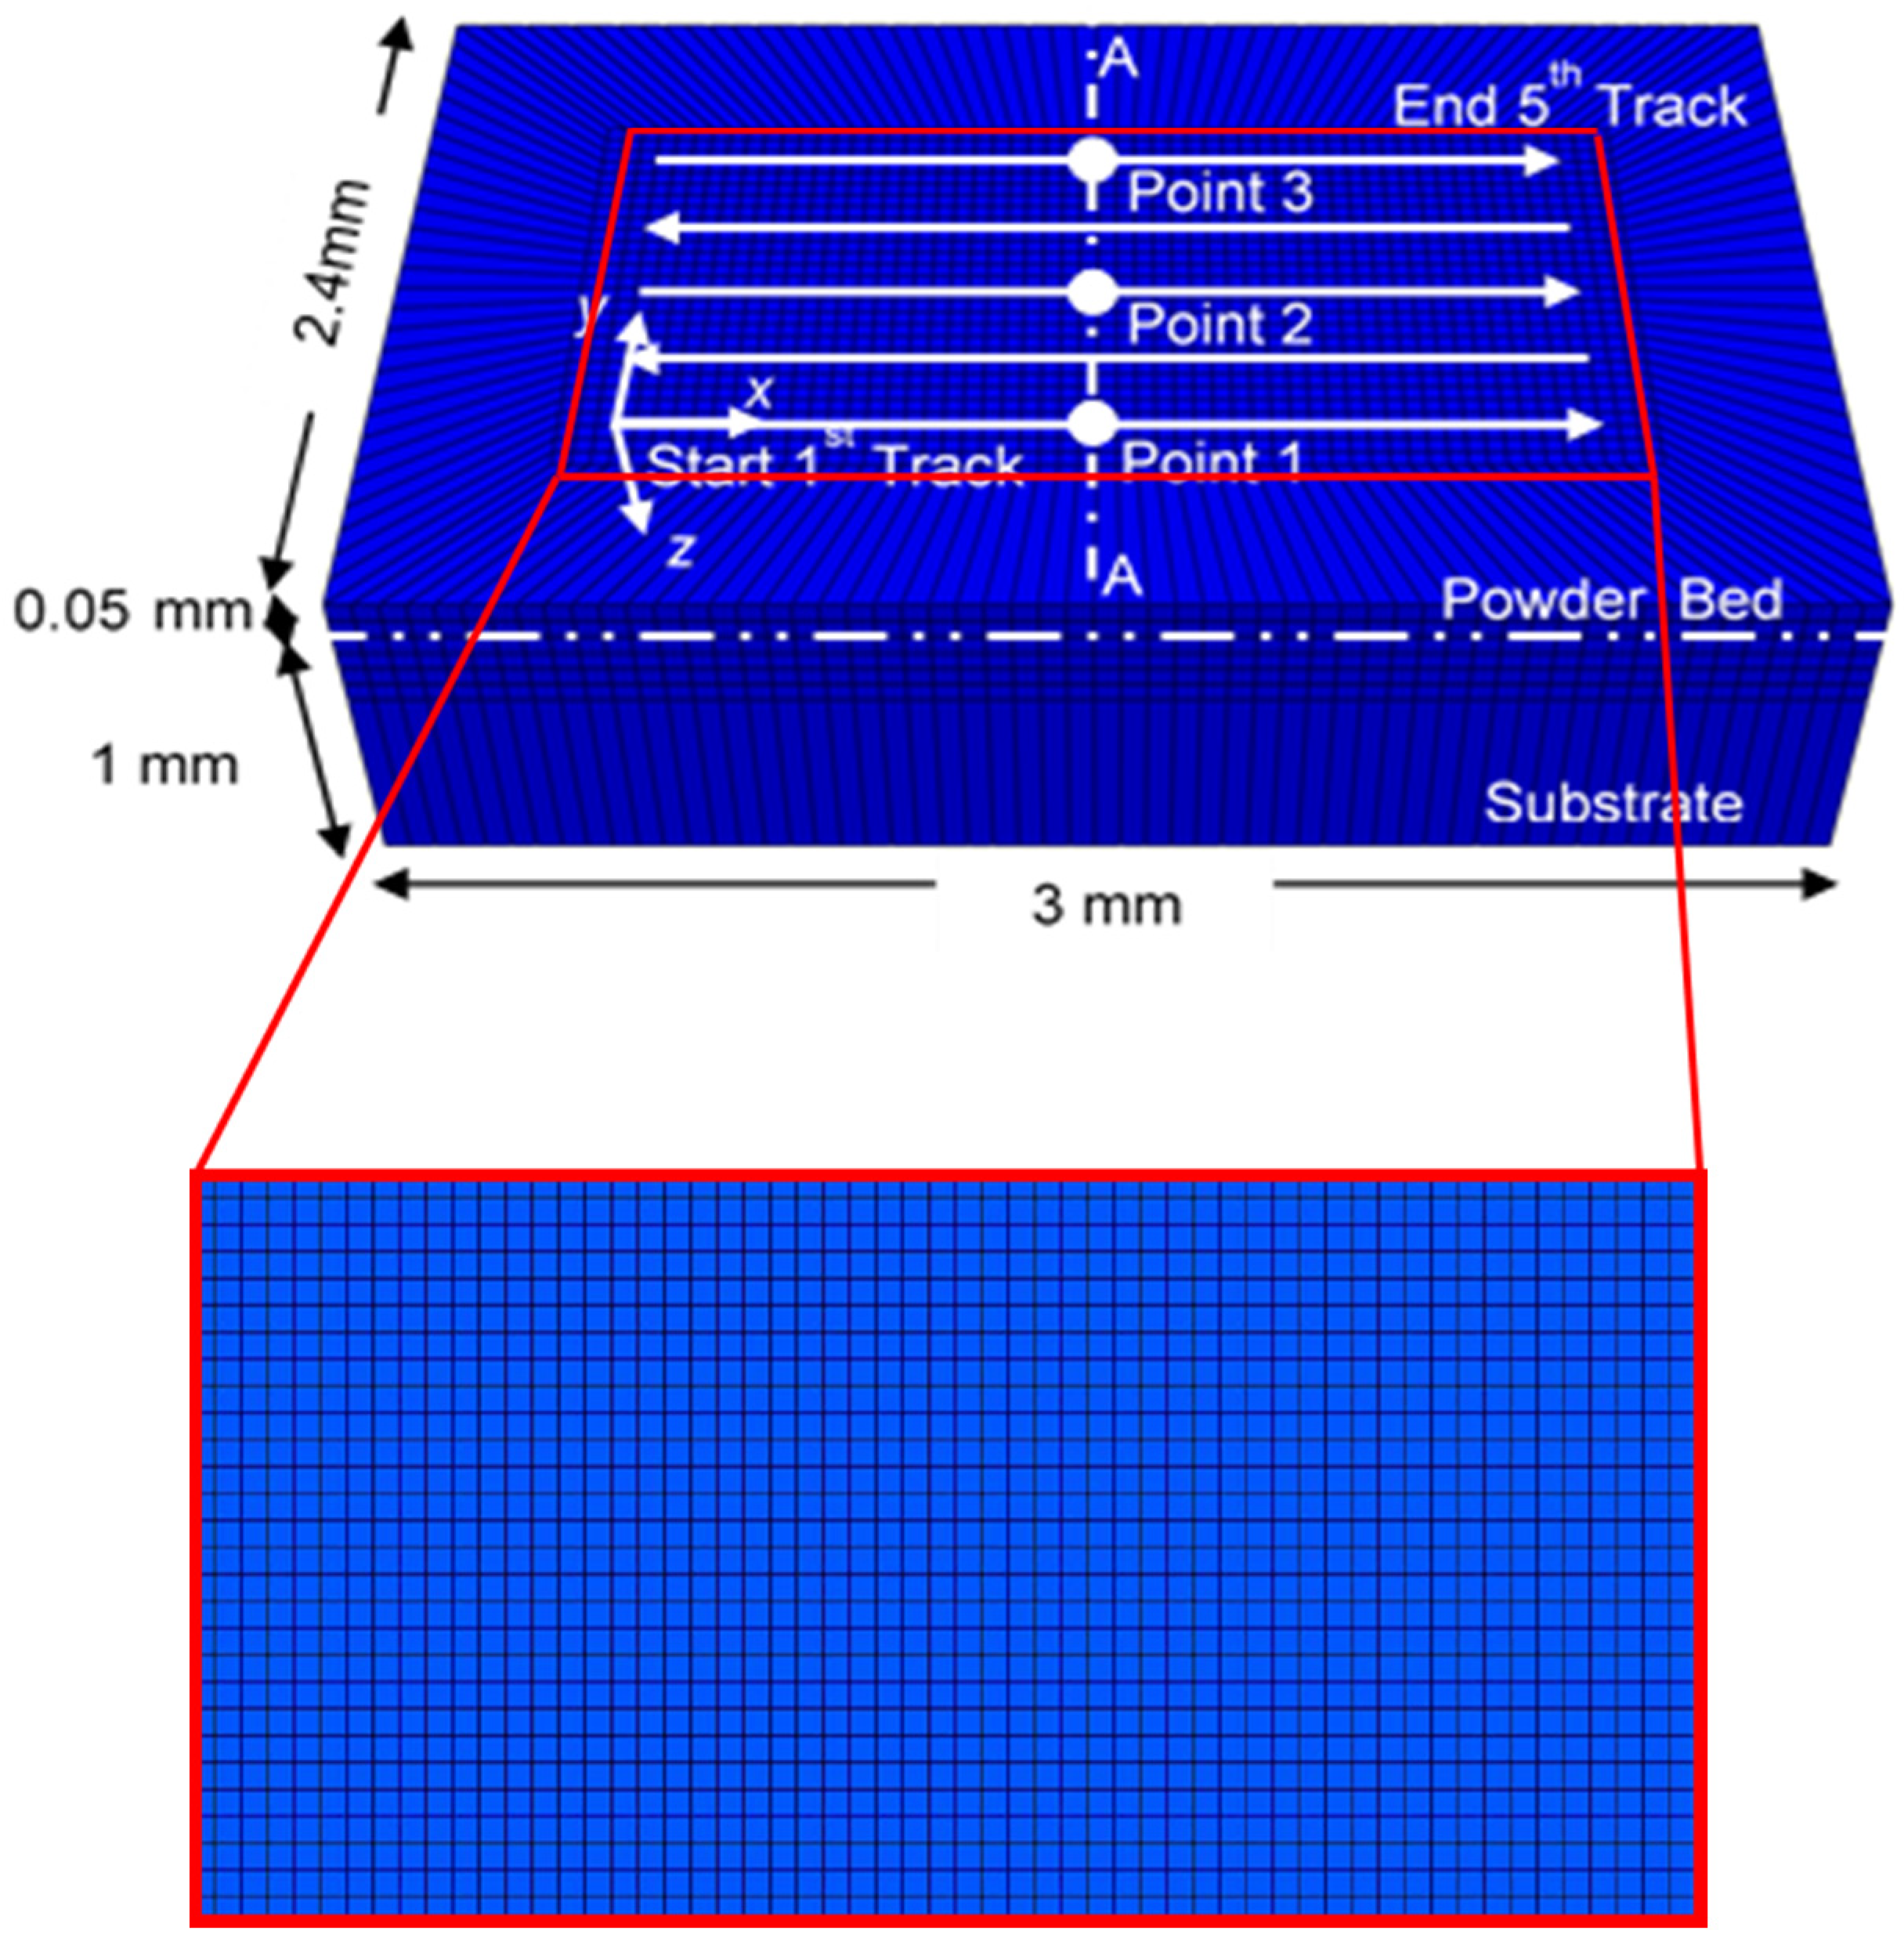
2.1. Model Setup

The three-dimensional numerical model was set up with one layer of 304L stainless steel powder bed with dimensions of 3 mm × 2.4 mm × 0.05 mm on a solid 304L substrate with dimensions of 3 mm × 2.4 mm × 1 mm (Figure 1). The 3D model was developed using Abaqus standard modeling software (Version 2016, Abaqus Inc., Palo Alto, CA, USA). To maintain high computational efficiency, the region interacting with the laser beam was finely meshed with hexahedral element size of 20 µm; a coarser mesh for the surrounding loose powder and substrate was employed. A mesh sensitivity analysis was carried out. According to the mesh convergence study and considering the computational capabilities available, the FE mesh of deposition layers consisted of four elements through the layer thickness, which was 12.5 µm, and seven elements through the laser diameter direction, which was 20 µm. The average mesh length served as the mesh size metric to evaluate mesh sensitivity. Hexahedral 8-noded brick elements (element type C3D8R in Abaqus) with element dimensions of 20 µm × 20 µm × 12.5 µm were chosen for the region interacting with the laser beam. The final model contained a total of 45,168 elements and 54,469 nodes. The default residual error in Abaqus for convergence was used, that is, 10−3. The total computational time required for this presented simulation was about 48 hours when using a workstation with an Intel Xeon CPU E5-2620 v2 @2.0 GHz, RAM 64 GB (Intel, Santa Clara, CA, USA). In order to make the complicated problem mathematically tractable, the whole powder bed was considered a homogeneous and continuous medium. However, the material’s thermal properties are updated with the consideration of particulate medium.

2.2. Governing Equations for Heat Transfer and Stress Analysis

The transient energy balance equation for the entire volume of material is given as in [28]:
ρ c p T t = x ( k T x ) + y ( k T y ) + z ( k T z ) + q ˙
where k is the thermal conductivity, ρ is the density, cp is the specific heat, both the thermal conductivity and thermal diffusivity are temperature dependent, T is the current temperature, q ˙ is the internal heat generation rate per unit volume, t is the time, and x, y and z are the coordinates of the reference system.
Sequentially-coupled thermomechanical analysis is implemented in two steps [29]. First, transient thermal analysis is conducted to obtain the temperature field. Then, mechanical analysis is performed to calculate thermal stress and deformation.
The mechanical equilibrium equation is written as in [30,31]:
σ = 0
where σ is the second-order stress tensor associated with the material behavior law, and signifies the divergence operator, = ( x ,   y ,   z ) .
Considering the elastoplastic behavior of the material, the stress–strain relation can be written as
σ = C ε e
where C is the fourth order material stiffness tensor and εe is the second-order elastic strain tensor.
Total strain ε, assuming small deformation and thermo-elasto-plasticity, is decomposed as in [32]:
ε = ε e + ε p + ε t h
where εe, εp, and εth are the elastic strain, plastic strain, and thermal strain, respectively. The isotropic Hooke’s law was used to model the elastic strain (εe) in Equation (3). The thermal expansion coefficient was adopted to calculate the thermal strain (εth) in the mechanical model. Elastic–plastic stress–strain behavior was described by a bilinear stress–strain curve, which was defined in Abaqus software.

2.3. Heat Source Model and Boundary Conditions

During the SLM process, the laser energy on the powder bed can be regarded as a volumetric energy density which obeys the Gaussian heat source distribution. The most common beam profile in the laser material processing is the Gaussian distribution with an exponential decaying of energy as a volumetric heat source given by [33]:
q ˙ = 2 ( 1 R ) P π r 0 2 d exp [ 2 r 2 r 0 2 ] exp [ z d ]
where P is the laser power, r0 is the laser radius, d is the optical penetration depth, which was set at 50 μm in this work, R represents the laser reflectance on material SS304L, which was set at 0.6 in this work. Equation (5) creates an exponentially decaying volumetric heat flux through a Gaussian distribution in the (x, y) plane and an additional decay term in the z direction.
The initial condition throughout the whole powder bed and substrate is considered a uniform temperature distribution before applying the heat source:
T ( x , y , z , t ) t = 0 = T 0
where T0 is the ambient temperature, set at 298 K.
In thermal analysis, the top surface and lateral surfaces use both radiation and the natural convection boundary condition since they are directly exposed to atmosphere. The equation for the boundary condition is expressed as:
q ¨ = k T z + h ( T T 0 ) + ε t σ t ( T 4 T 0 4 )
where T is temperature, h is the coefficient of natural convection which was set to 50 W/m2∙K, σt is the Stefan–Boltzmann constant of 5.67 × 10⁻⁸ W/m2∙K4 and εt is the powder bed emissivity of 0.4. Other model parameters are shown in Table 1.
In thermal analysis, the bottom surface is set as constant temperature boundary condition (equal to initial temperature T0) since it connects to a large clamp system which is at a constant temperature. In mechanical analysis, the bottom surface is rigidly constrained as no deformation occurs during the SLM process [34]. The top and lateral surface are set as free stress boundary condition.

2.4. Thermal and Mechanical Properties

The thermal and mechanical properties of solid-state 304L stainless steel are temperature dependent and identified in [35,36], as shown in Table 2. Since the temperature in certain regions is higher than the melting point, the melting state of powder in the melt pool was considered in this model by using a thermal conductivity multiplier. The value of the thermal conductivity multiplier was determined by fitting the numerical melt pool size with experimental results. This method was well established in other literature to simulate the increased heat transfer due to convection of the melt pool in conduction models [37]. The effective properties of a powder bed are much smaller than that of bulk material for powder material in this study, as expressed in [38]. Thus, we treated the yield stress and Young’s Modulus as very small values in the melting state. Different material states are defined by the user subroutine.
The thermal conductivity of the powder bed is defined by the following effective medium relationship:
k p = k s 2 φ ( k g - k s ) + k g + 2 k s k g + 2 k s + φ ( k s - k g )
where kp, ks and kg are the thermal conductivity of the powder bed, solid material and air, respectively [39]. φ is the porosity of the powder bed, which can be expressed as:
φ = ρ s ρ p ρ s
where ρs and ρp are the density of the solid and the powder bed, respectively [40]. The porosity was calculated as φ = 0.6 for the powder state by Equation (9). Specific heat and other mechanical properties in the powder state were the same as solid state SS304L.
Taking the melting and solidification during SLM into consideration, the latent heat of fusion should not be neglected. It can be calculated from the enthalpy (H) of the material, written as in [41]:
H ( T ) = { ρ c p d T , T < T s ρ c p d T + ρ T T s T l T s L , T s T T l ρ c p d T + ρ L , T > T l
where L = 261 kJ/kg is the latent heat of fusion, Tl = 1727 K and Ts = 1673 K are the liquidus and solidus temperature, respectively [35].

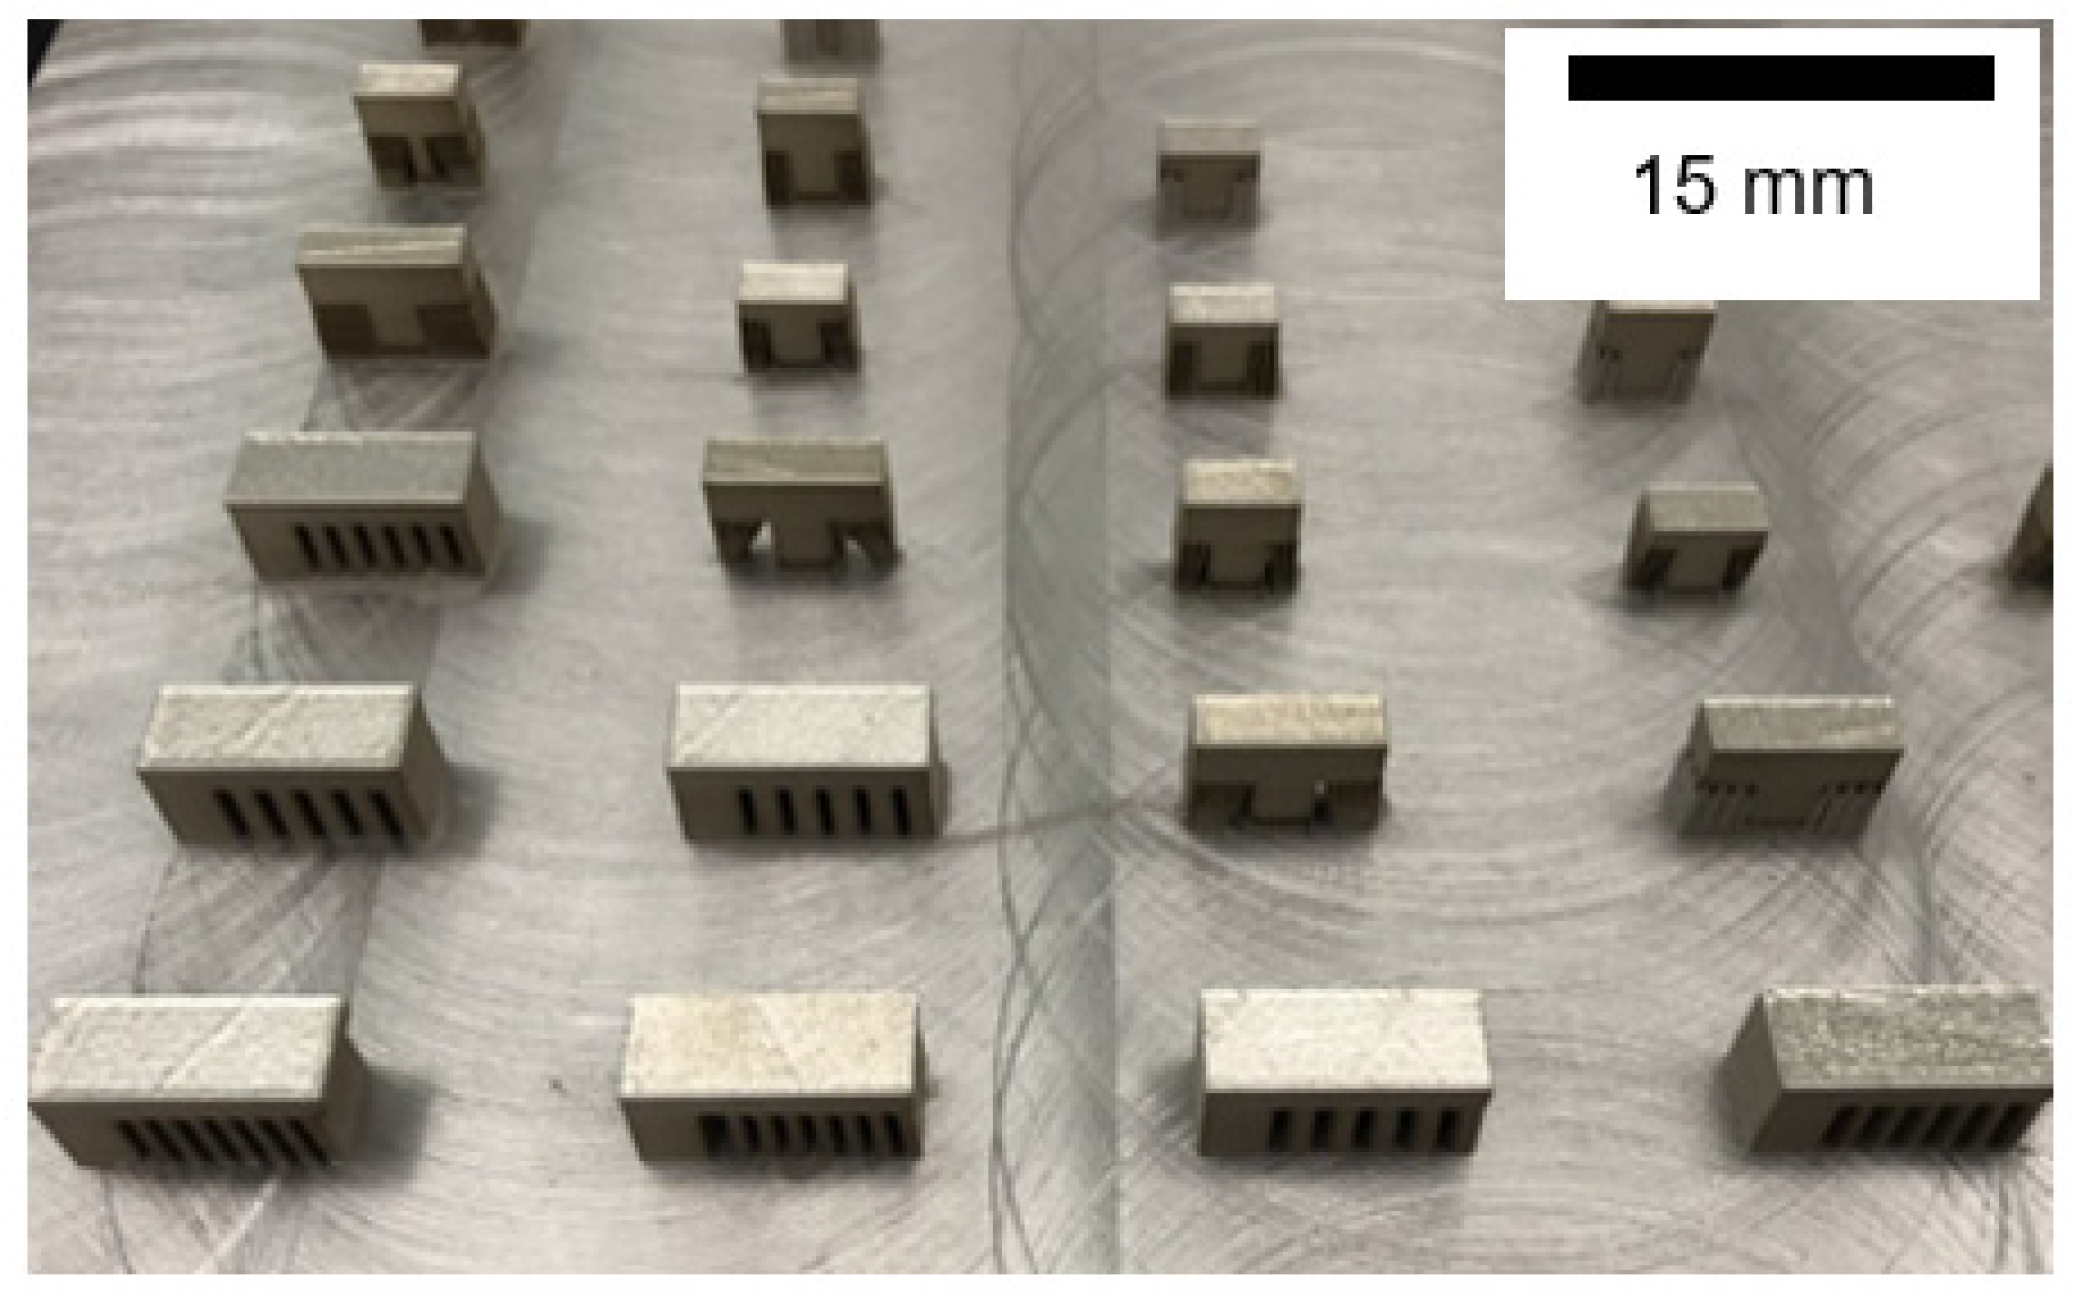
3. Experimental Procedure

The 304L stainless steel samples with different dimensions are displayed in Figure 2. Samples were built with varied process parameters using a Renishaw AM250 SLM platform. The AM250 has a 200 W maximum fiber laser (IPG Photonics, Oxford, MA, USA) and contains a 250 mm × 250 mm × 300 mm build volume. 304L stainless steel gas-atomized powder with particle diameter of ~45 μm, purchased from LPW Technology, USA, was used to prepare the powder beds. Powders were melted in the beds’ surface by a fiber laser with 200 W maximum laser power, focused to a beam diameter of 140 µm. The built chamber for the experiment was under an argon atmosphere. The oxygen level inside the chamber was monitored to be below 1000 ppm and a constant recirculating argon gas flow was maintained to remove the possible condensates and ejecta generated during the building process.
The used process parameters, such as laser power, hatch spacing and scan speeds, are listed in Table 3. The laser scan path between layers had no rotation. Samples were removed from the build plate using Hansvedt (Hansvedt Industries Inc., Rantoul, IL, USA) electrical discharge machining (EDM), mounted, polished and electrolytically etched using 60/40 Nitric Acid. Experimental measurements were made in the cross section of samples for easy identification of melt pools. Experimental analysis included melt pool size measurement with a Hirox KH-8700 (HIROX, Hackensack, NJ, USA) optical microscope and microstructure characterization of the solidification structure, grain size and cell spacing with a Hitachi S-4700 FESEM (Moov technology, San Francisco, CA, USA). Experimental measurements were conducted to validate the predictions of melt pool size, cooling rate and solidification structure from the numerical model [42].

4. Experimental and Simulation Results

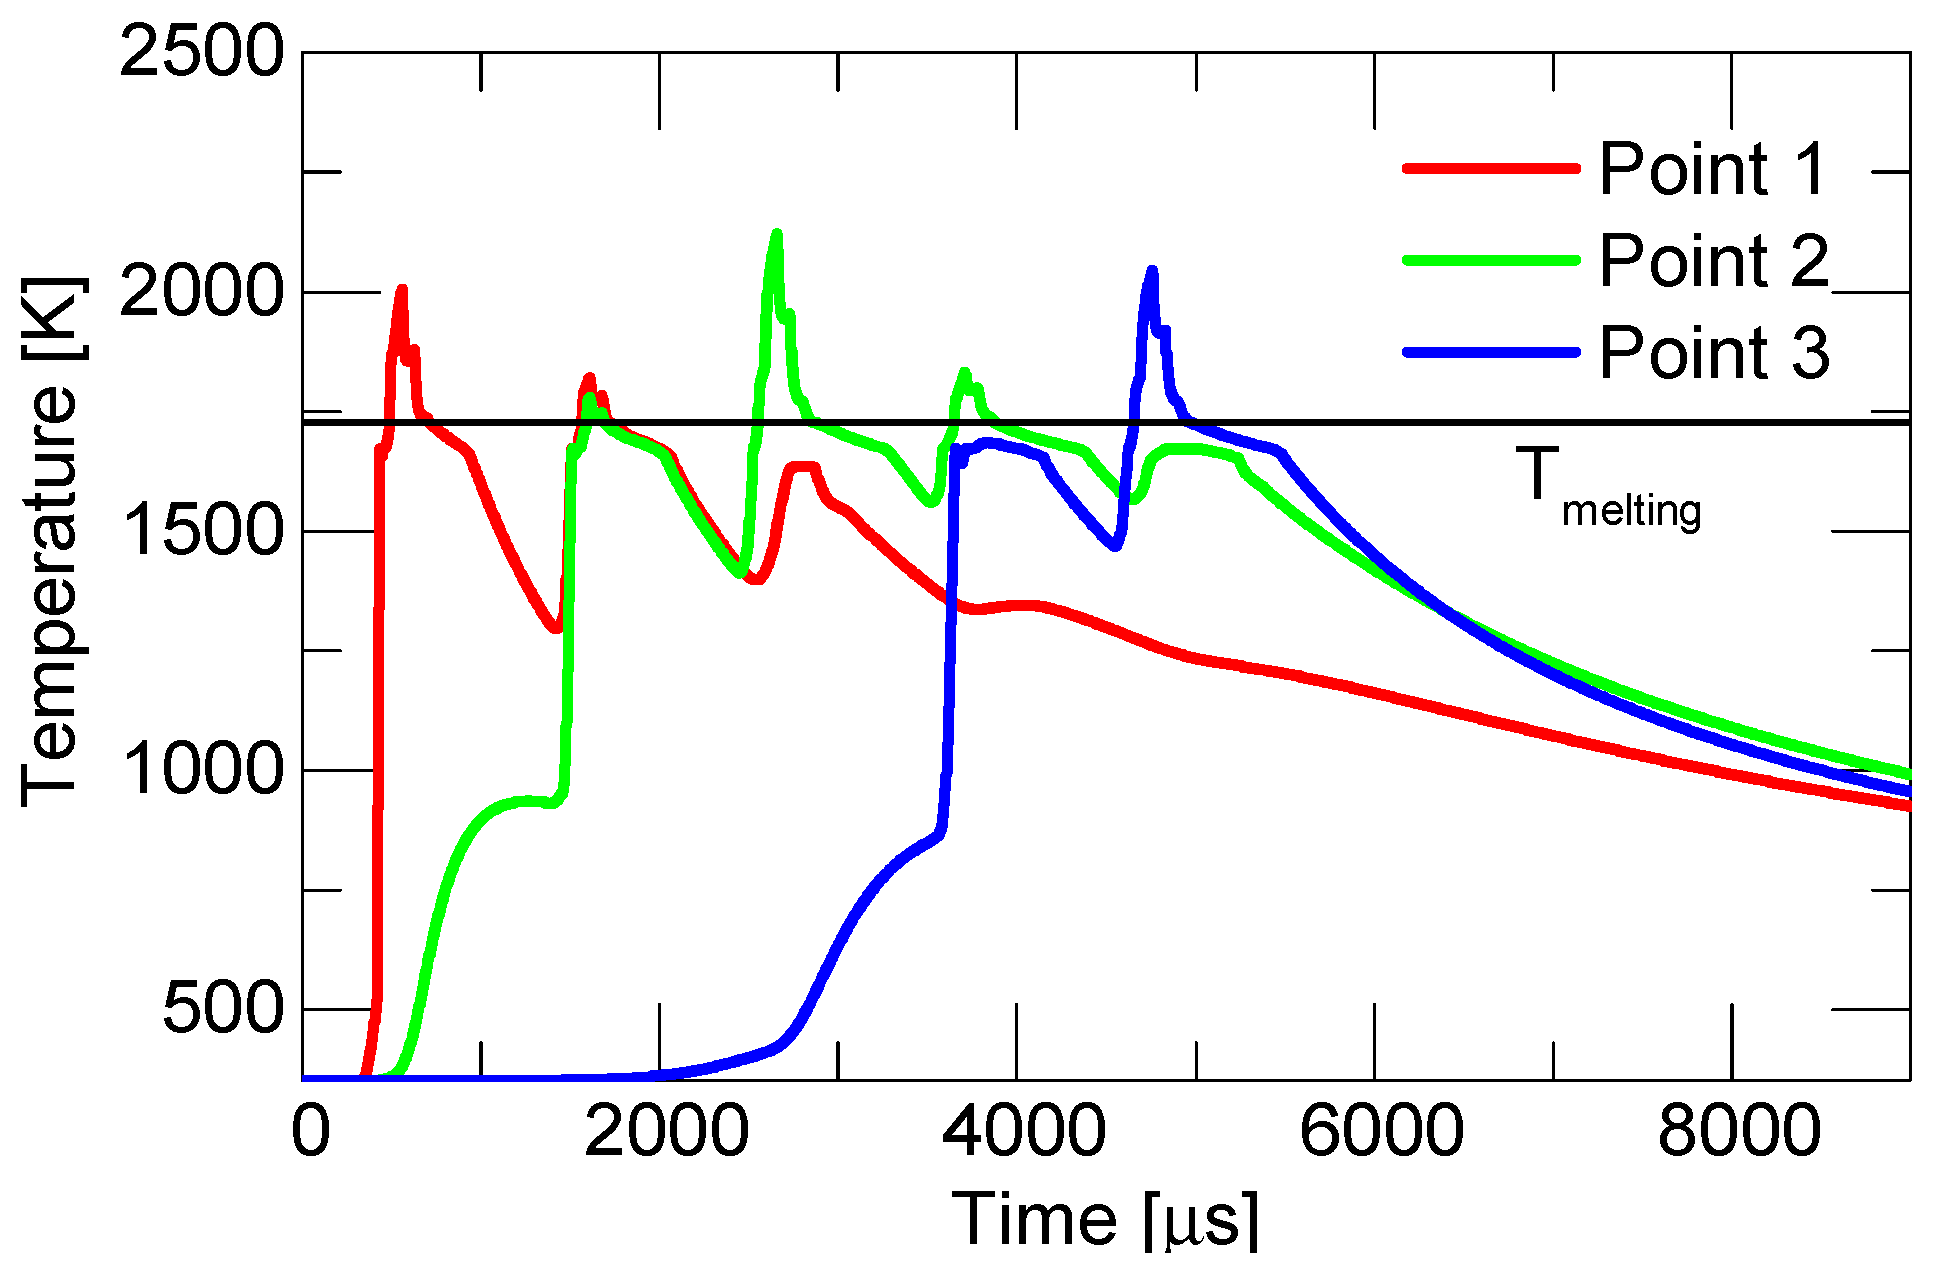
4.1. Simulated Thermal History

Figure 3 shows the temperature evolution at various monitoring locations, points 1, 2, and 3 (middle points of first, third and fifth tracks, as shown in Figure 1) at laser power of 120 W. During the heating process, the dramatic growth in temperature indicated that the heating rate was very large. During the cooling process, the similar curve slopes in liquidus and solidus states indicated that the cooling rate between the liquidus and solidus temperature was almost constant because of the release of the latent heat from fusion. Each monitoring point experienced several temperature peaks. The maximum temperature peak was caused by direct laser heating on the current track. The lower temperature peaks were induced by heat accumulation from previous or successive laser tracks. For example, there were three temperature peaks at monitoring point 1 and they were due to laser heating in the first, second and third tracks, respectively. It is also noted that the third peak temperature was lower than the melting temperature. This means that the temperature distribution in first track was affected by laser heating in the successive two tracks, but powder could only be re-melted by the second track.

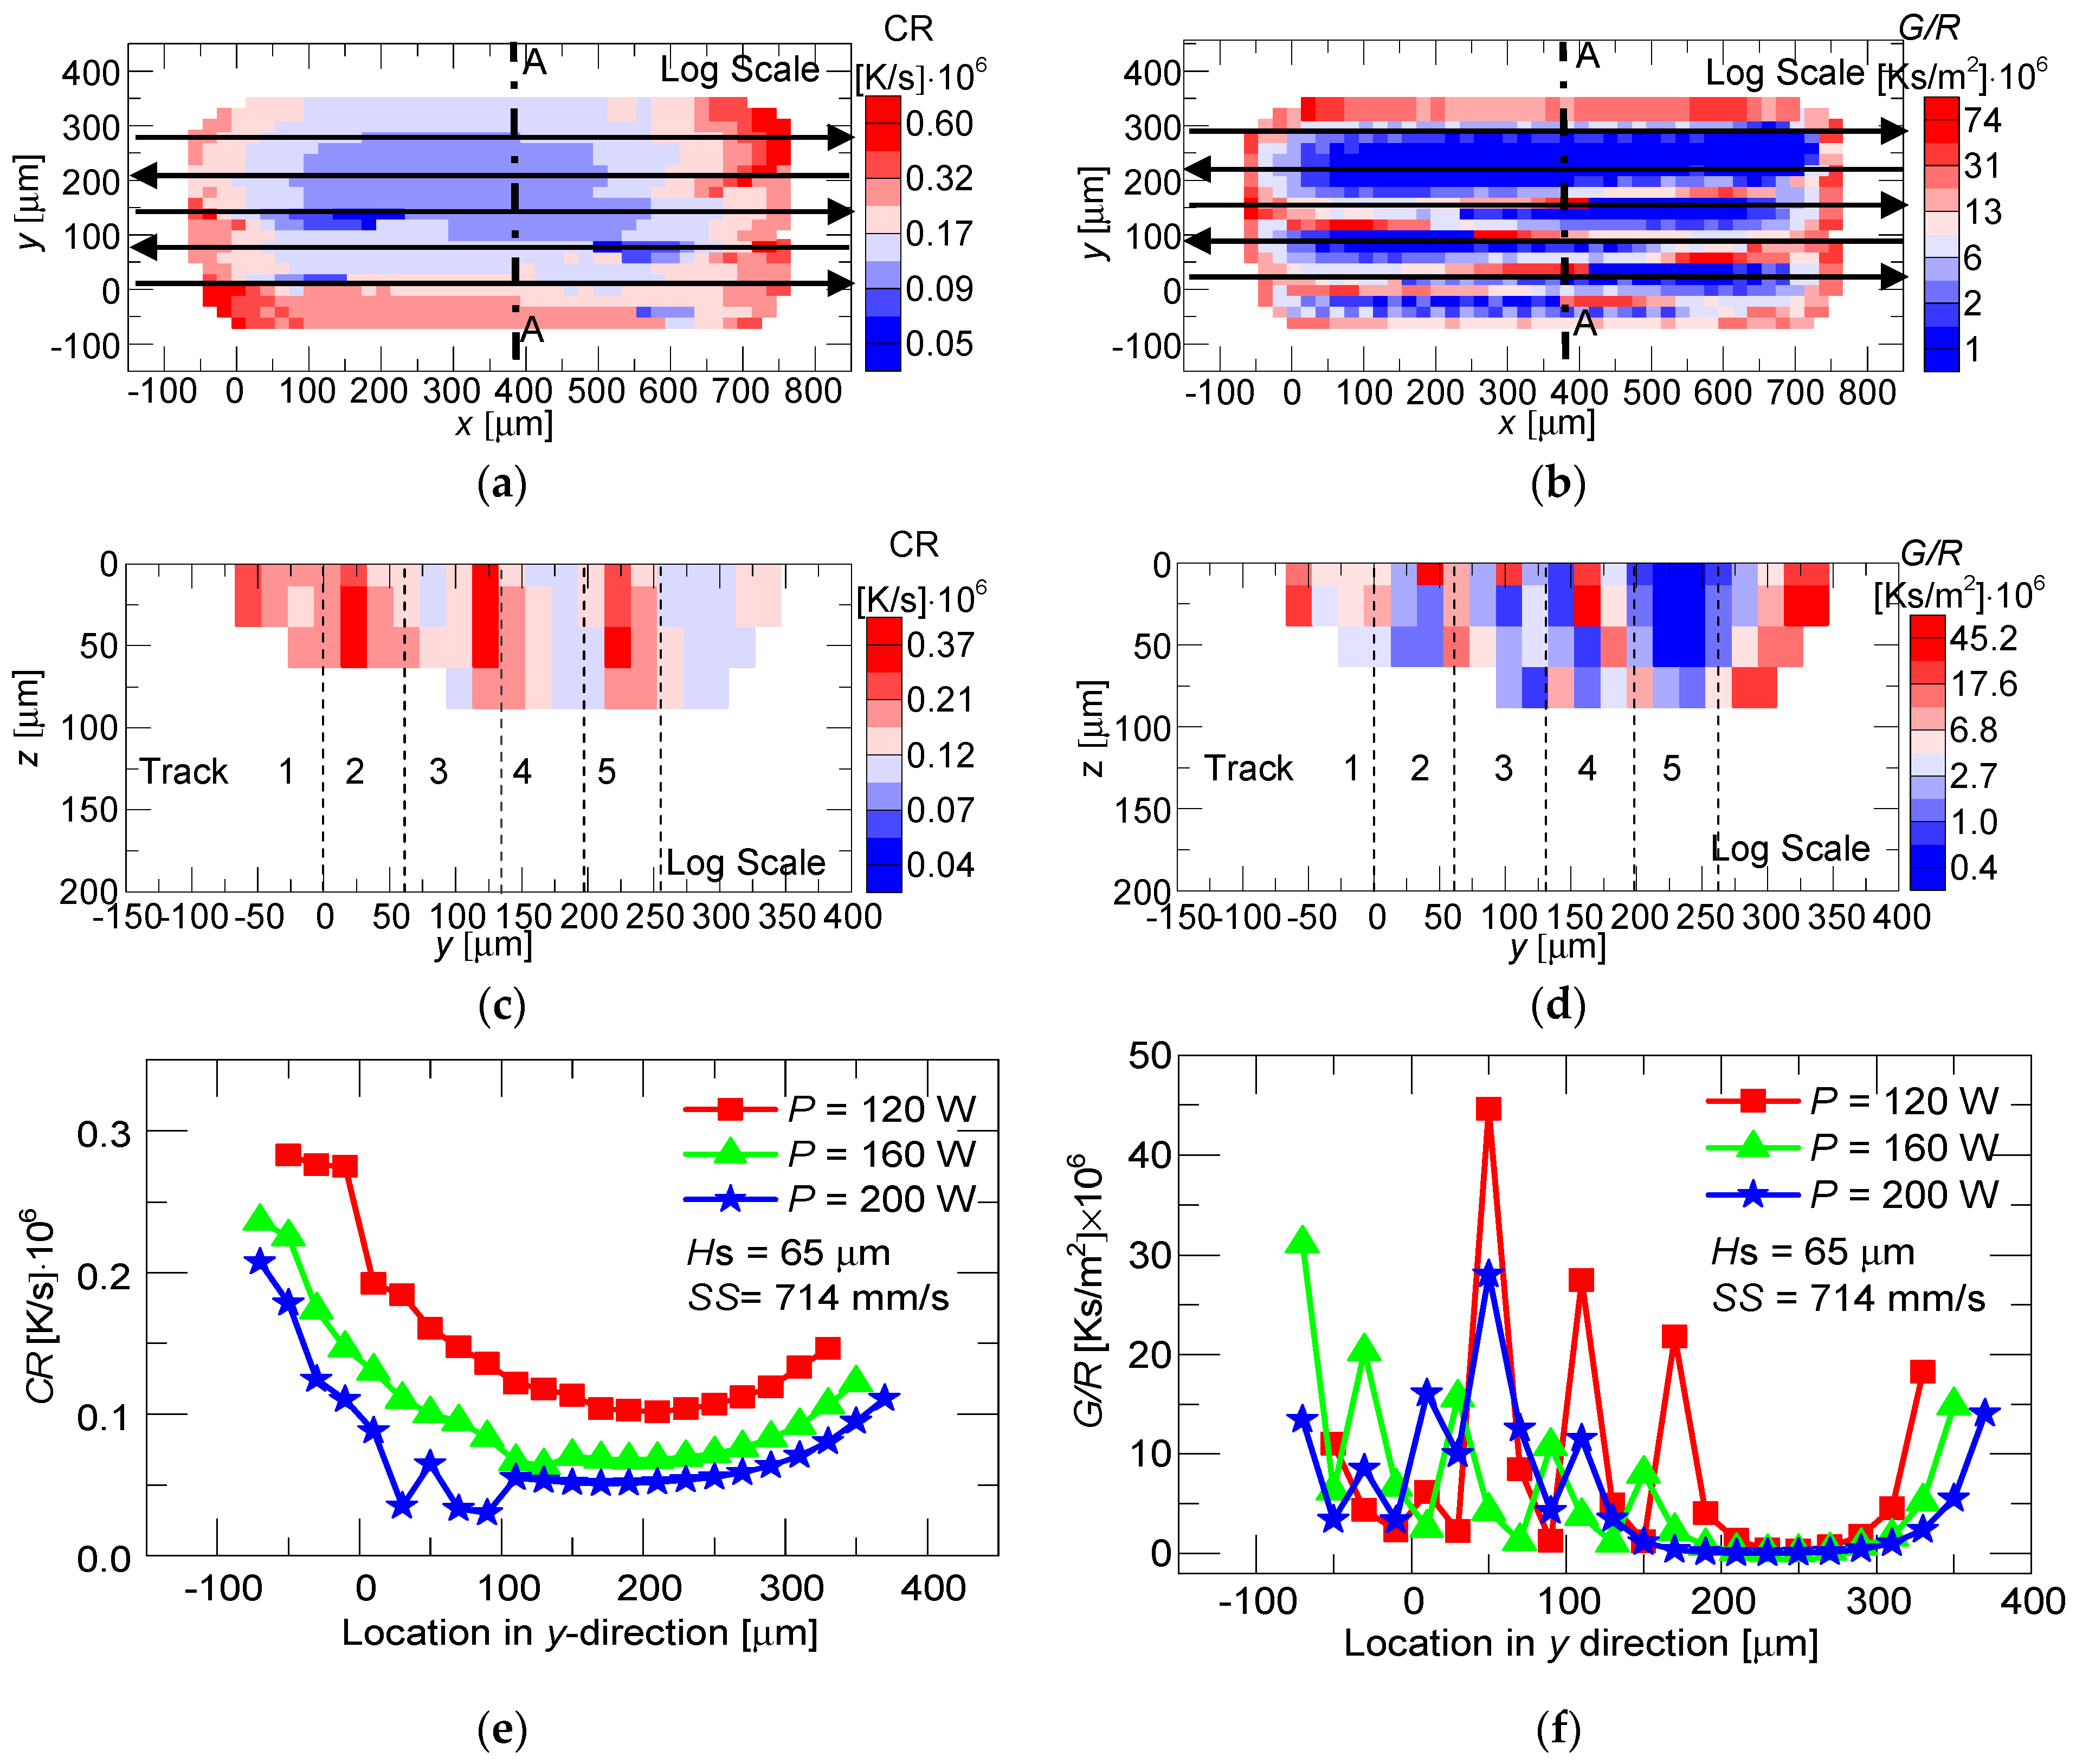
4.2. Predicted Solidification Behavior

The primary thermal characteristics that affect the solidification structure of a component are the cooling rate, thermal gradient and the solidification rate at the solid–liquid interface. These parameters may influence microstructural features such as phase selection, microstructural length scales, and the transition from columnar to equiaxed growth, all of which have a significant effect on the resulting properties of the component. To analyze the effect of thermal parameters, the spatial variations in the cooling rate, thermal gradient and solidification rate at the solid–liquid interface were calculated. The temperature gradient, G, and cooling rate, CR, can be calculated from the temperature field. Solidification rate, R, can be calculated by CR divided by G. Another combined form of G and R is the solidification morphology factor G/R. The cooling rate is directly related to the grain size in the fusion zone. The morphology parameter can be used to categorize the shape of solidification structures (G/R value from high to low), such as planar, cellular, columnar, dendritic and equiaxed dendritic [43,44]. The cooling rate we calculated here is for the solid–liquid interface of the melt pool. Cooling rate along the solid–liquid interface has an important influence on microstructure formation. Different cooling rates in materials cause different thermal stress distributions and ultimately different microstructures [43,44]. The calculation was performed by locally approximating the individual components of the thermal gradient and the cooling rate for each point at the time when it fell below the liquidus temperature of the respective alloy.
The cooling rate in this FEA model was calculated using [43,44,45,46]:
C R = d T d t | T = T m e l t i n g = | T l T s t l t s | = G × R
where TlTs is the difference between the liquidus and solidus temperatures, and tlts is the time interval between Tl and Ts.
The temperature gradient is evaluated at the liquidus temperature in the solid–liquid interface, which can be calculated by:
G = T = ( T x ) 2 + ( T y ) 2 + ( T z ) 2 | T = T l
The solidification rate can be calculated by the cooling rate divided by the temperature gradient:
R = C R G = ( d T / d t ) T = T m e l t i n g G
The CR map and G/R map at the top surface of the powder bed and cross-section (A-A in Figure 1) are shown in Figure 4a–d at P = 120 W, Hs = 65 µm, and SS = 715 mm/s. Laser power was continuously added to the next track during the multi-track laser melting process. The energy input to the powder bed changed the melt pool size and altered the temperature distribution. The color maps show that these solidification parameters were higher at the edge of the melt pool than in the center. This observation is most remarkable for the G/R distribution shown in Figure 4b. Meanwhile, the magnitudes of the CR and G/R near the maximum depth of the melt pool were much higher than those at the melt pool surface.
The dependence of the CR and G/R of the A-A cross line at the top surface (shown in Figure 1) at three different power levels is illustrated in Figure 4e,f. As expected, CR increased with decreasing laser power and increased from the laser center to the edge. Results in Figure 4e also show almost the same cooling rate across a certain number of laser tracks in the curve trough. It is expected that the constant cooling rate also would apply if more tracks were simulated. The constant cooling rate could also be validated in later experiments by the constant solidification structure across laser tracks. It should also be noted that G/R increased from laser center to edge and the maximum of G/R was predicted at the melt pool edge.
For single straight line laser melting, the cooling rate and thermal gradient were related to the location between the growth vector (normal to the solid–liquid interface surface) and the laser beam velocity. The cooling rate was lowest near the center of the melt pool where the growth vector was the same as the beam direction. Alternatively, the cooling rate and thermal gradient was highest at the outer edges of the melt pool. This could be explained in the majority of the cross-sections in Figure 4e,f, except for some high fluctuation scatters due to remelting by subsequent lines. The outer of the final line of each track approached the high velocity of the cooling, and the solid–liquid interface of the last area to solidify exceeded the beam velocity as the melt pool collapsed.
The effect of thermal gradient and solute on the solidification front change can be described by the concept of the constitutional super-cooling criterion, which is mathematically stated as:
G / R Δ T E / D L ,   f o r   p l a n e   f r o n t   s o l i d i f i c a t i o n G / R Δ T E / D L ,   f o r   c e l l u l a r   o r   d e n t r i t i c   s o l i d i f i c a t i o n
where ∆TE is the equilibrium solidification temperature range (TlTs) and DL is the solute diffusion coefficient [47]. The value of ∆TE for 304L stainless steel is 54 K and DL is the diffusion coefficient of chromium in liquid iron, 5 × 10⁻⁹ m2/s. Therefore, ∆TE/DL=54/(5 × 10−9)=1.04 × 10¹⁰ K∙s/m2, from the criterion. Solidification will be cellular or dendrite for values of G/R less than or equal to 1.04 × 10¹⁰ K∙s/m2. The maximum simulated value of G/R was 74 × 106 K∙s/m2. This means that the predicted value of G/R was much less than ∆TE/DL; therefore, the model predicted cellular/dendritic solidification in the entire melted domain.

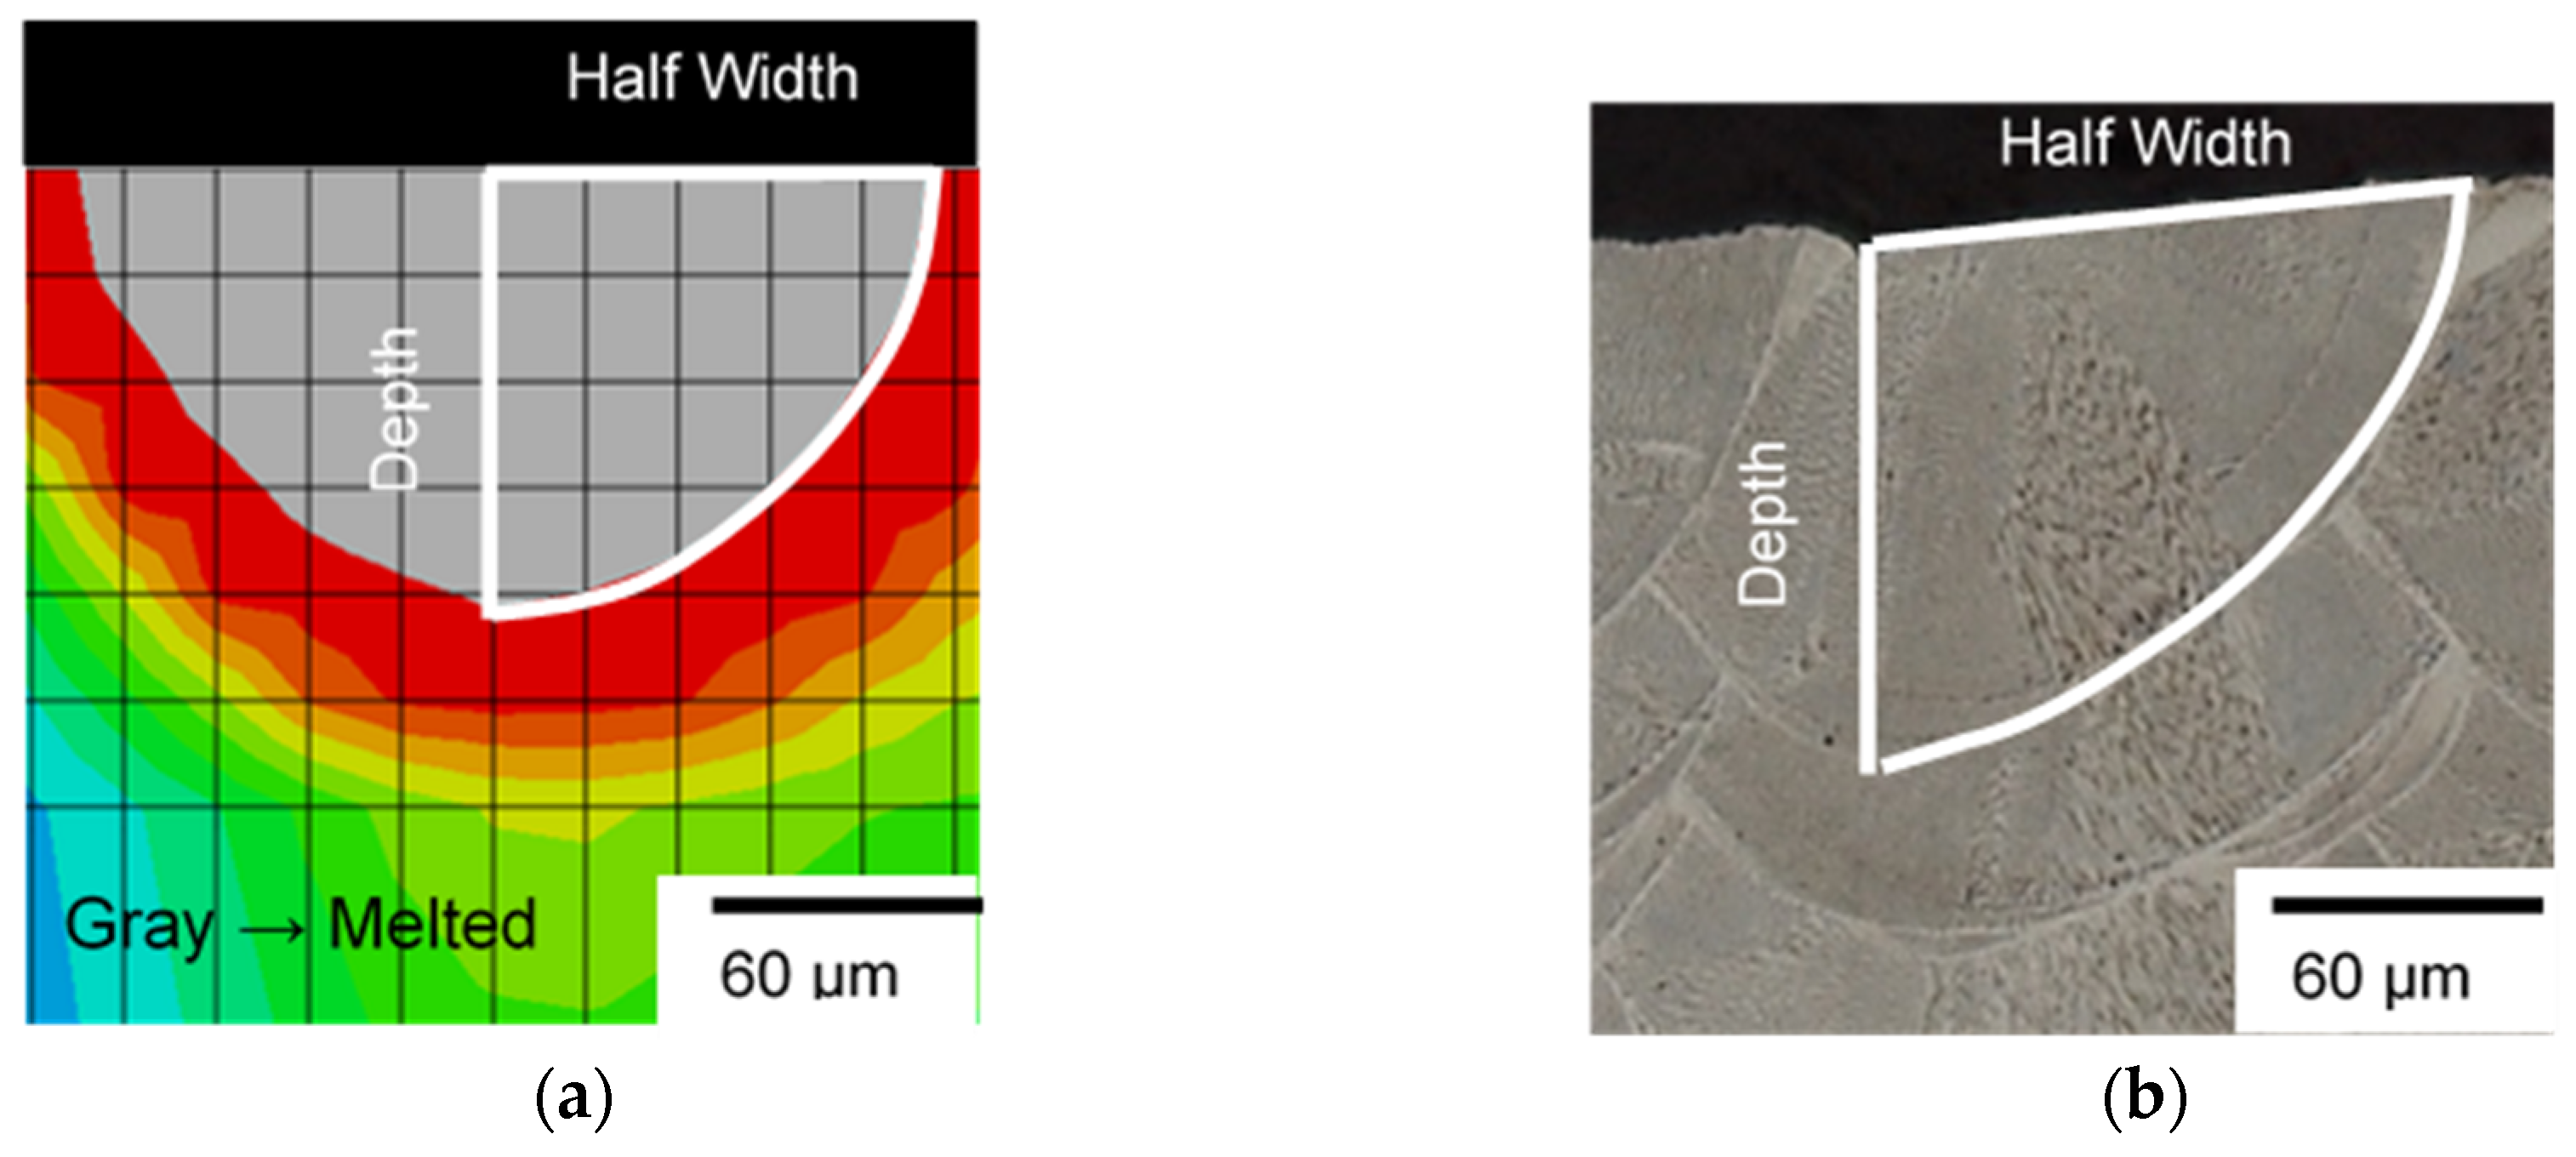
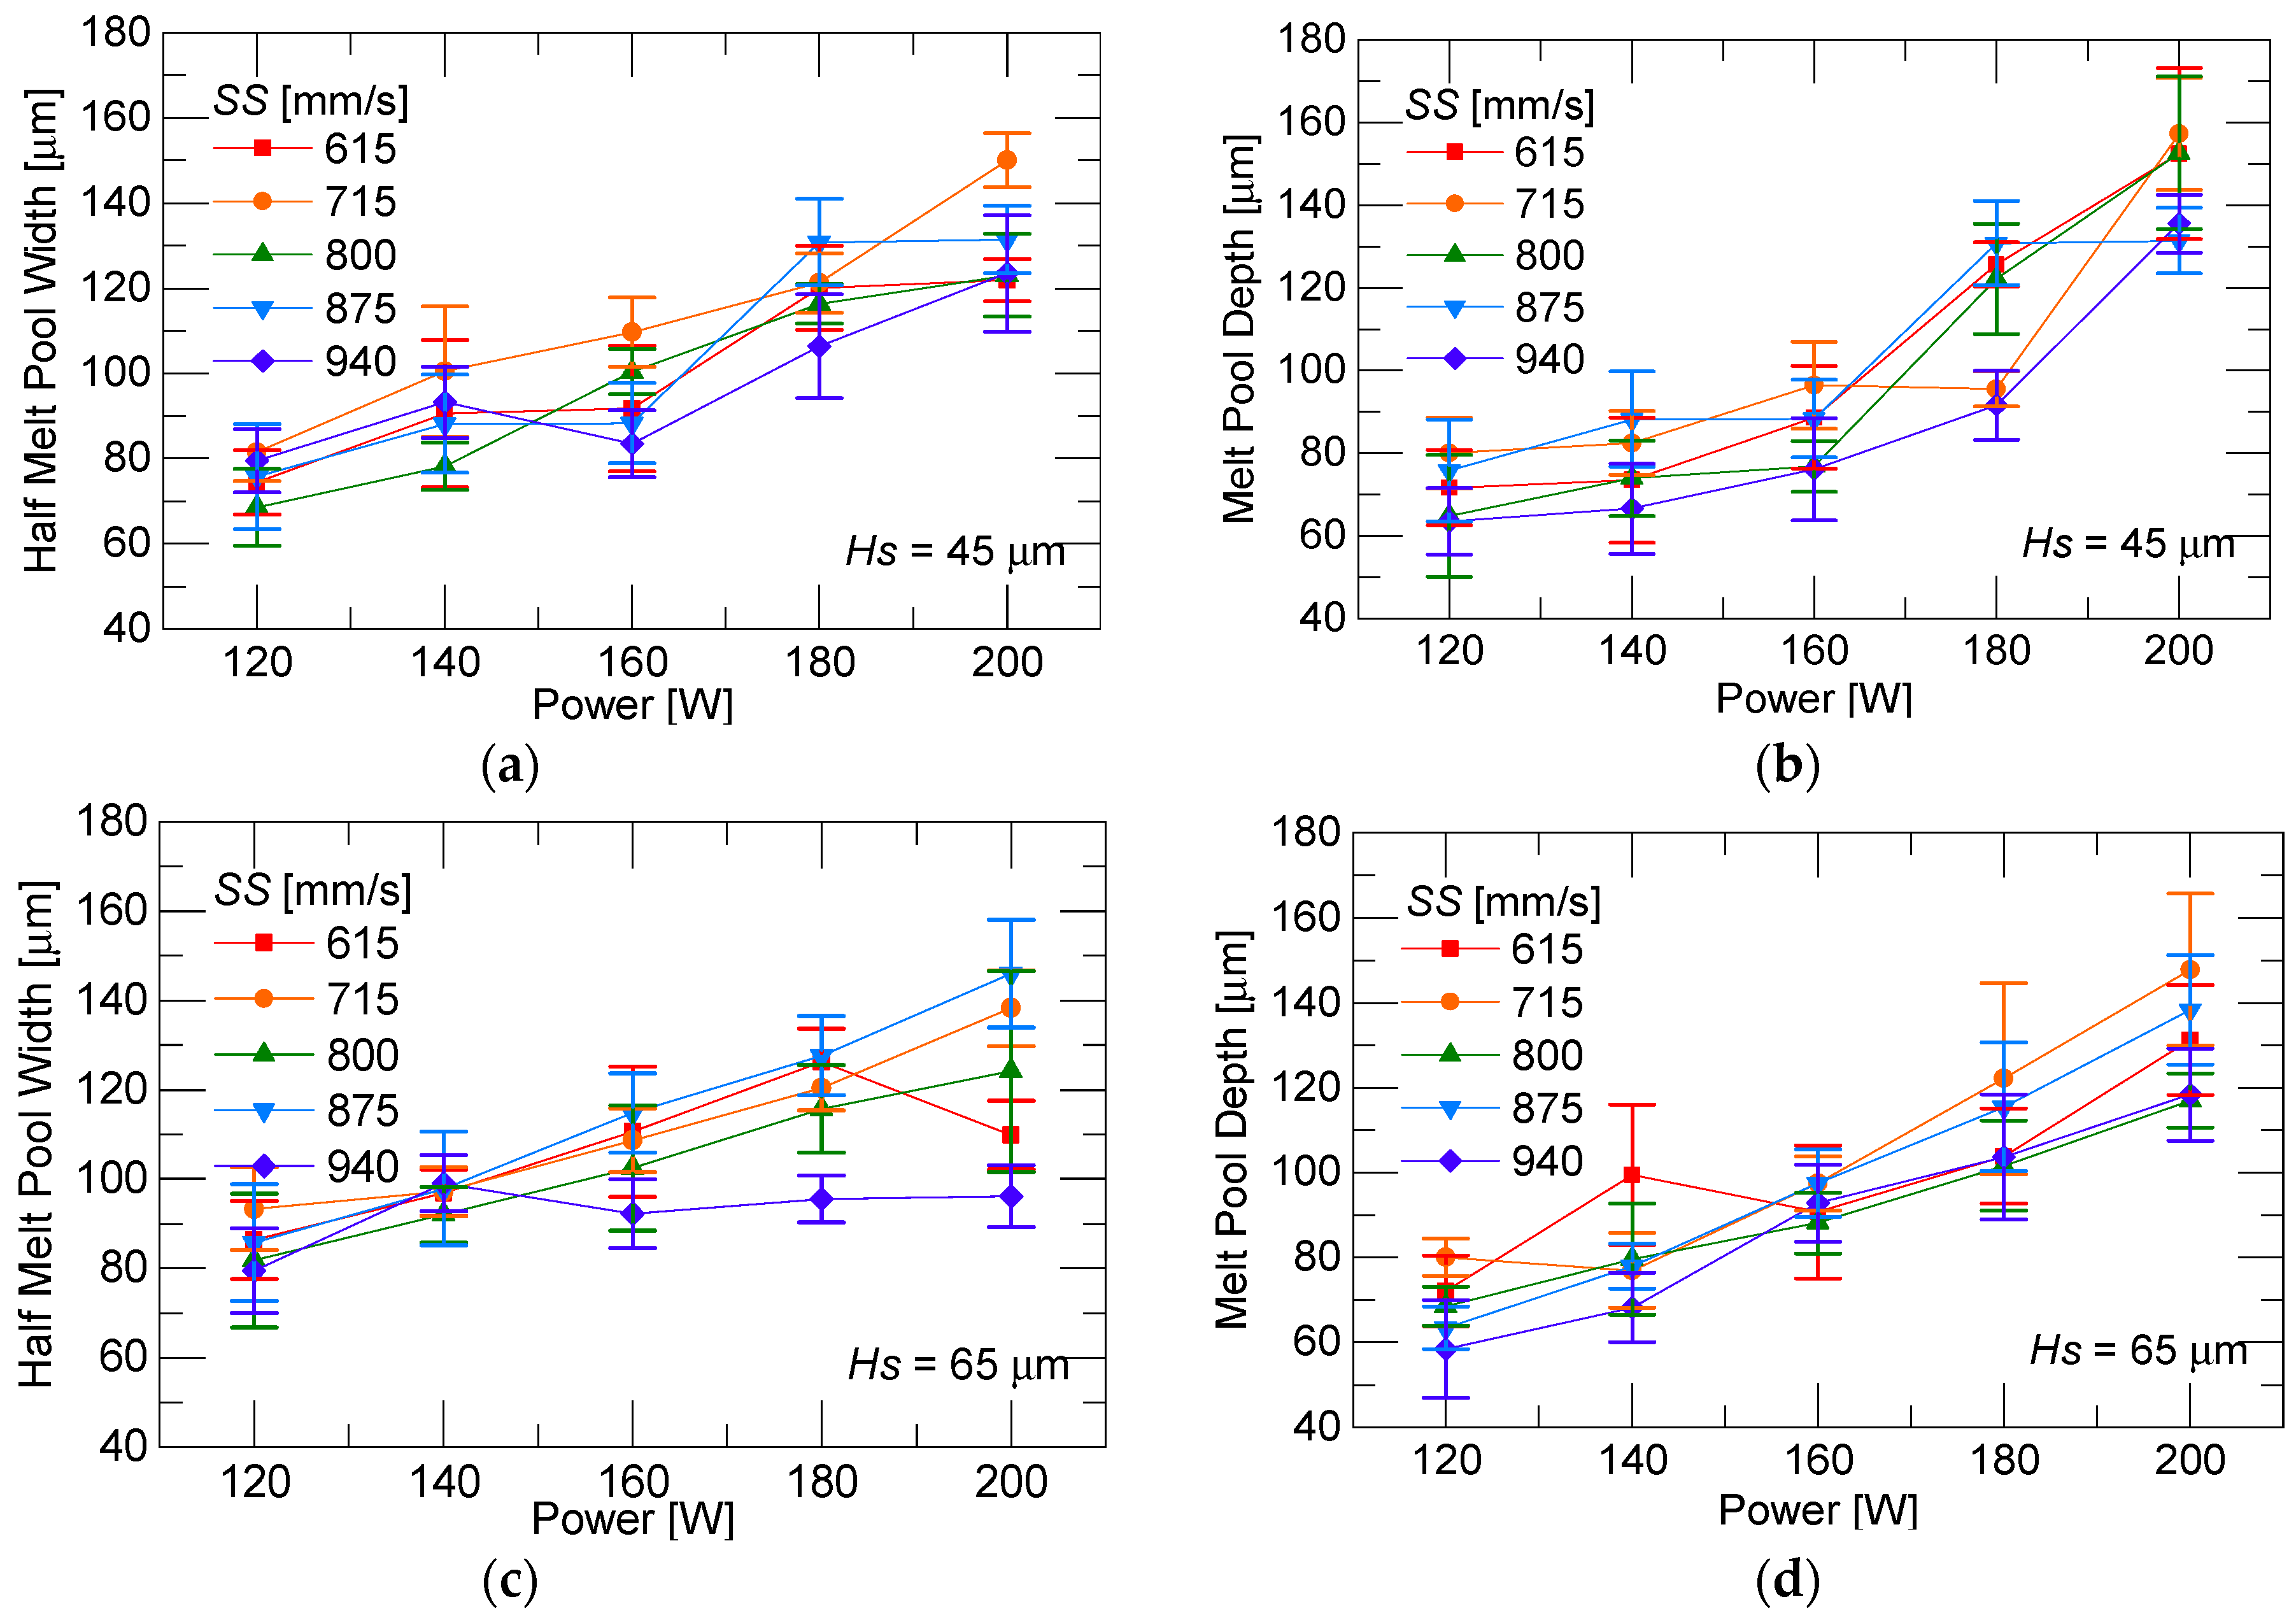
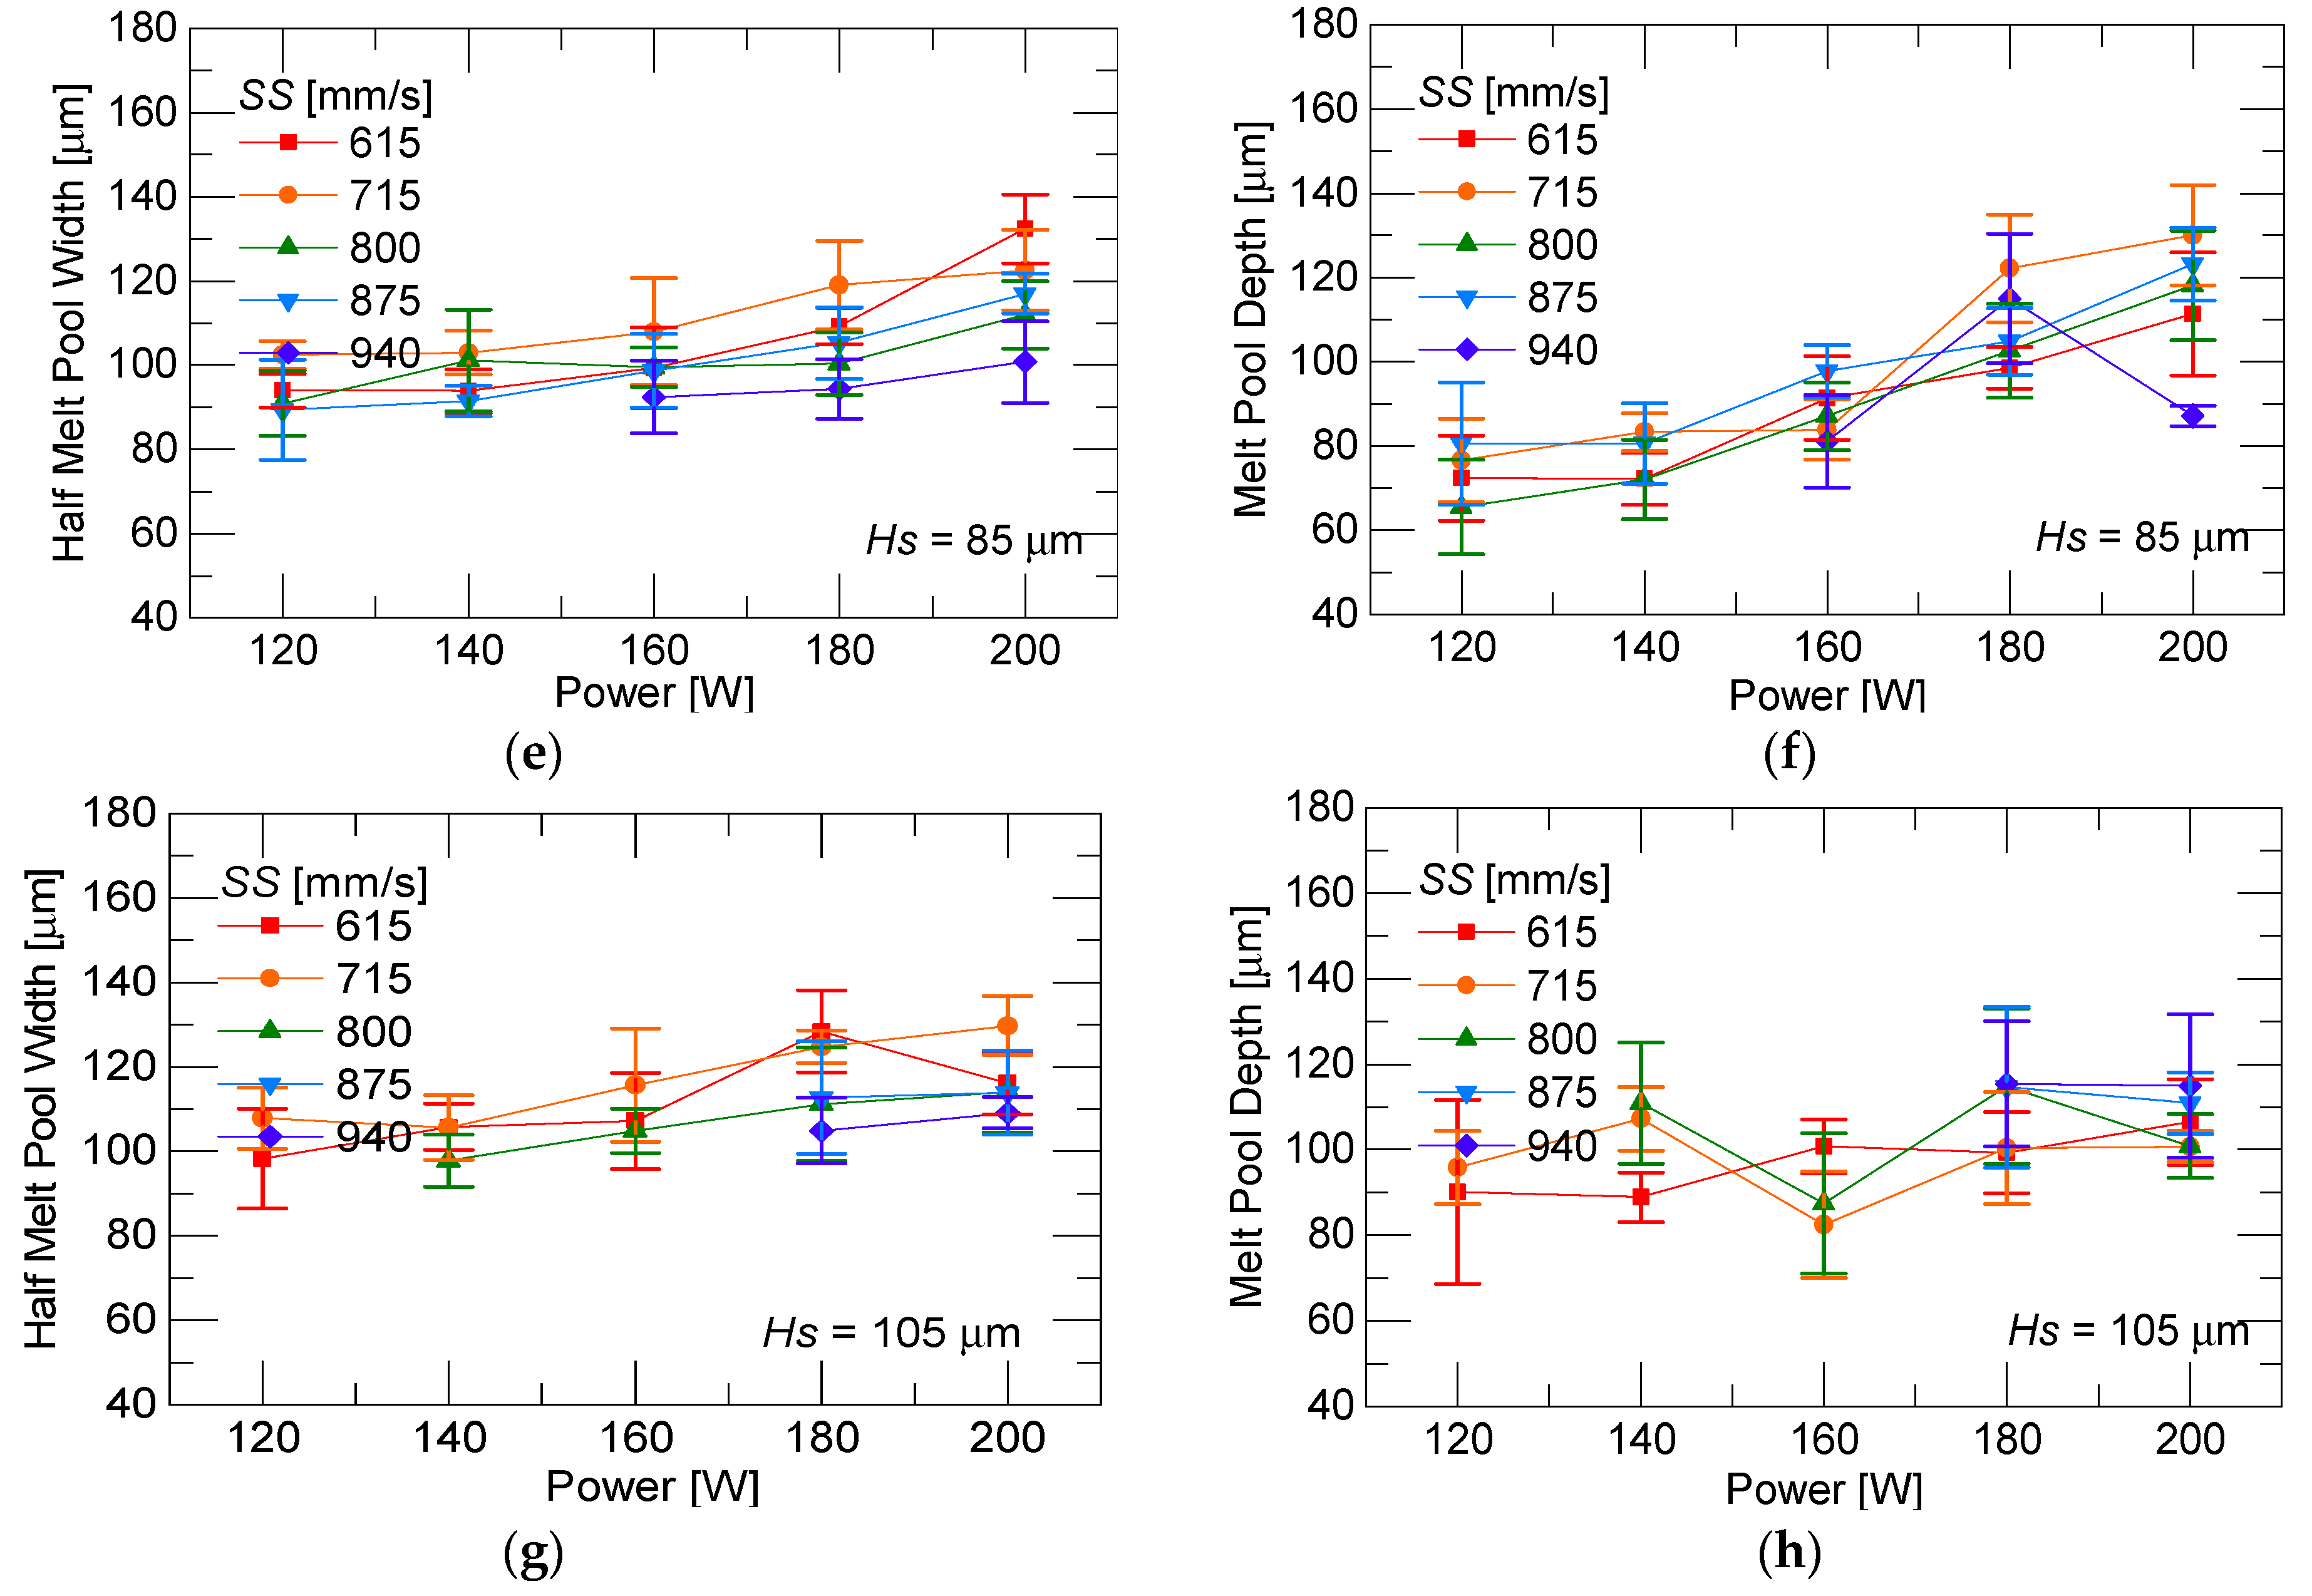
4.3. Experimental Melt Pool Size

Figure 5a shows the definition of simulated melt pool width and depth. The melt pool boundary is bordered by the melting temperature of 304L stainless steel. Figure 5b shows experimental melt pool width and depth defined by the visible laser track boundary.
Figure 6a–h contain experimental melt pool measurements as a function of laser power, scan speed and hatch spacing. Figure 6a–f show that melt pool size increased with laser power and decreased with scan speed at lower hatch spacing (45–85 µm). However, at a wider hatch spacing of 105 µm, melt pool size did not show a clear trend with respect to laser power and scan speed. This is attributed to the fact that wider hatch spacing causes less heat buildup from subsequent laser tracks; therefore, the melt pool was mainly affected by a single laser track.

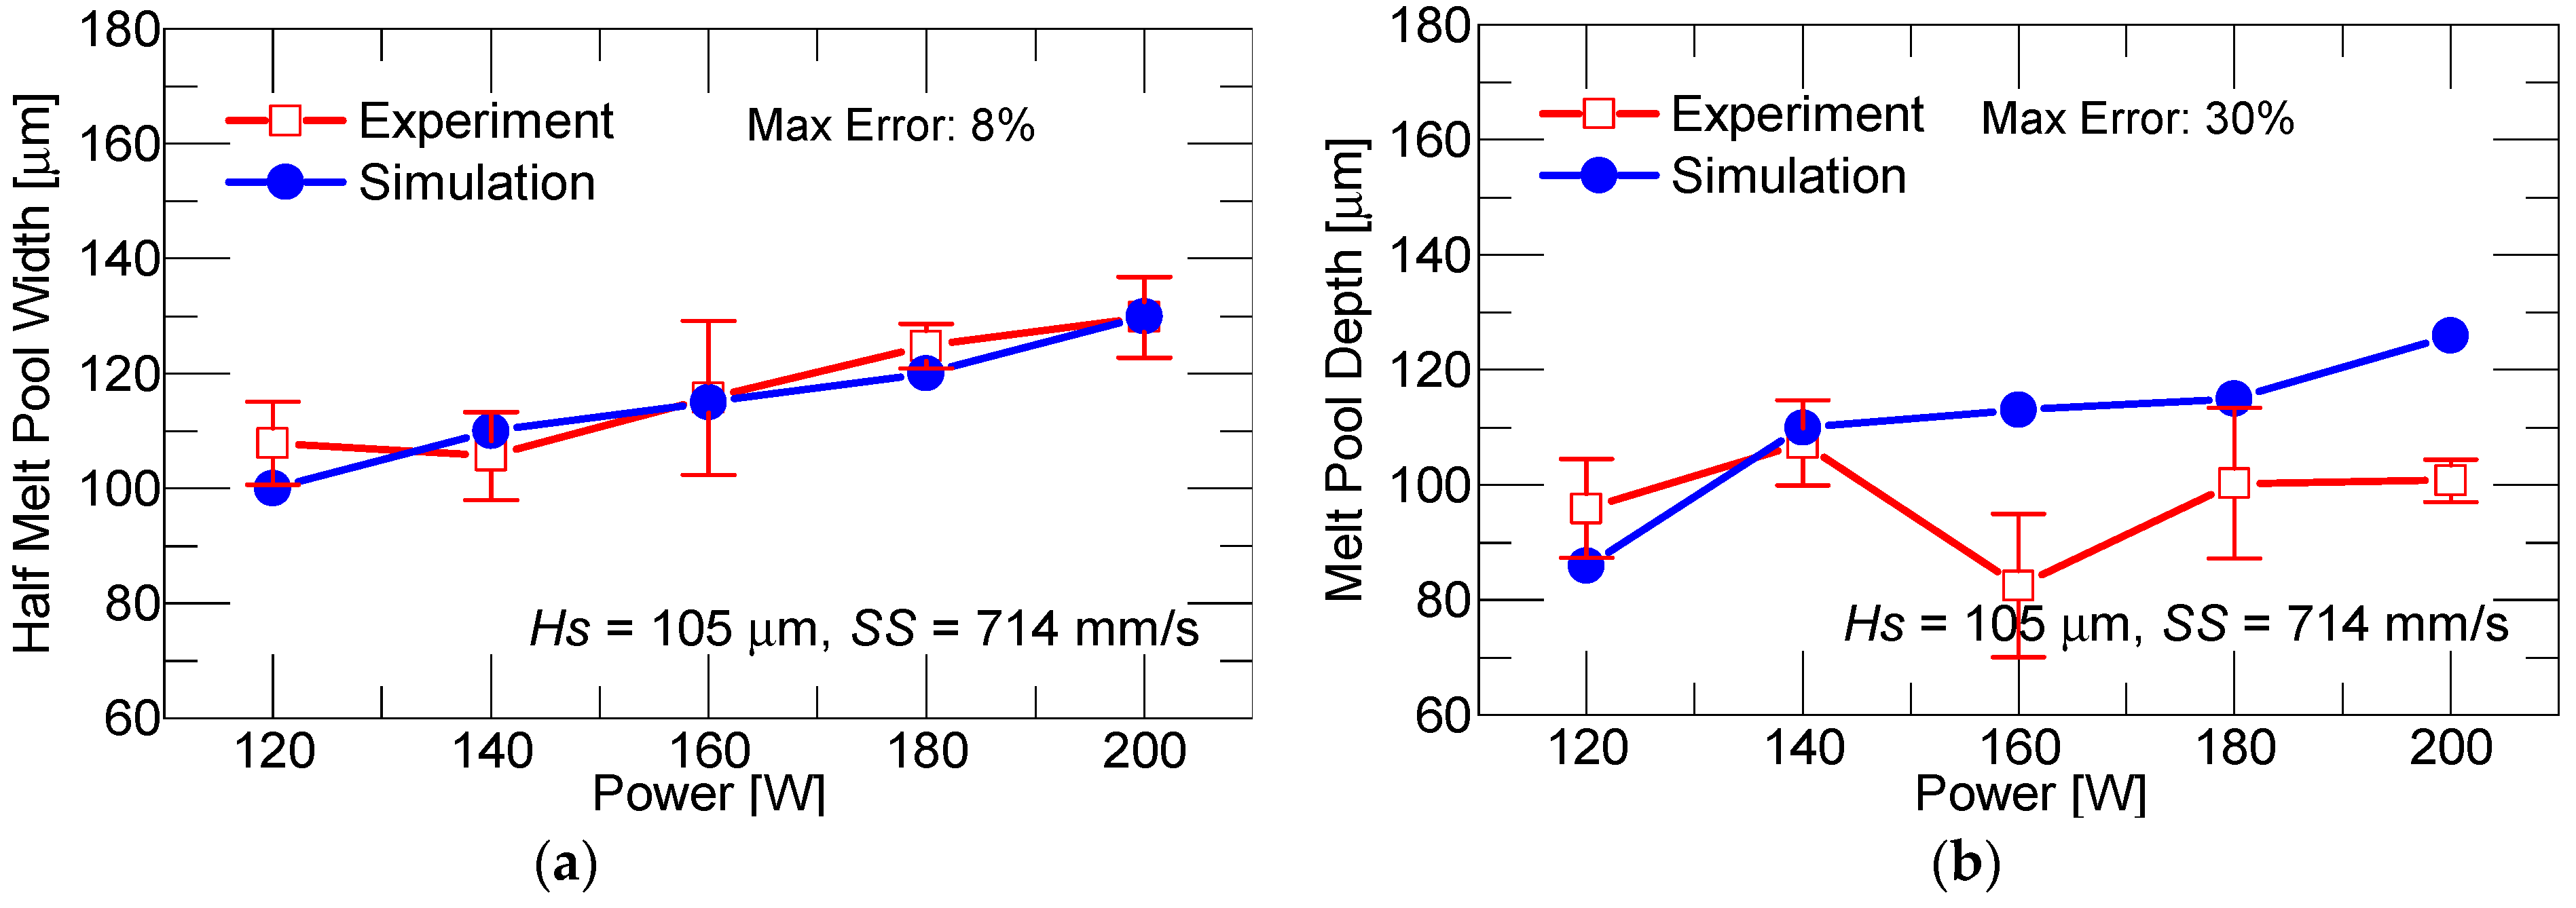
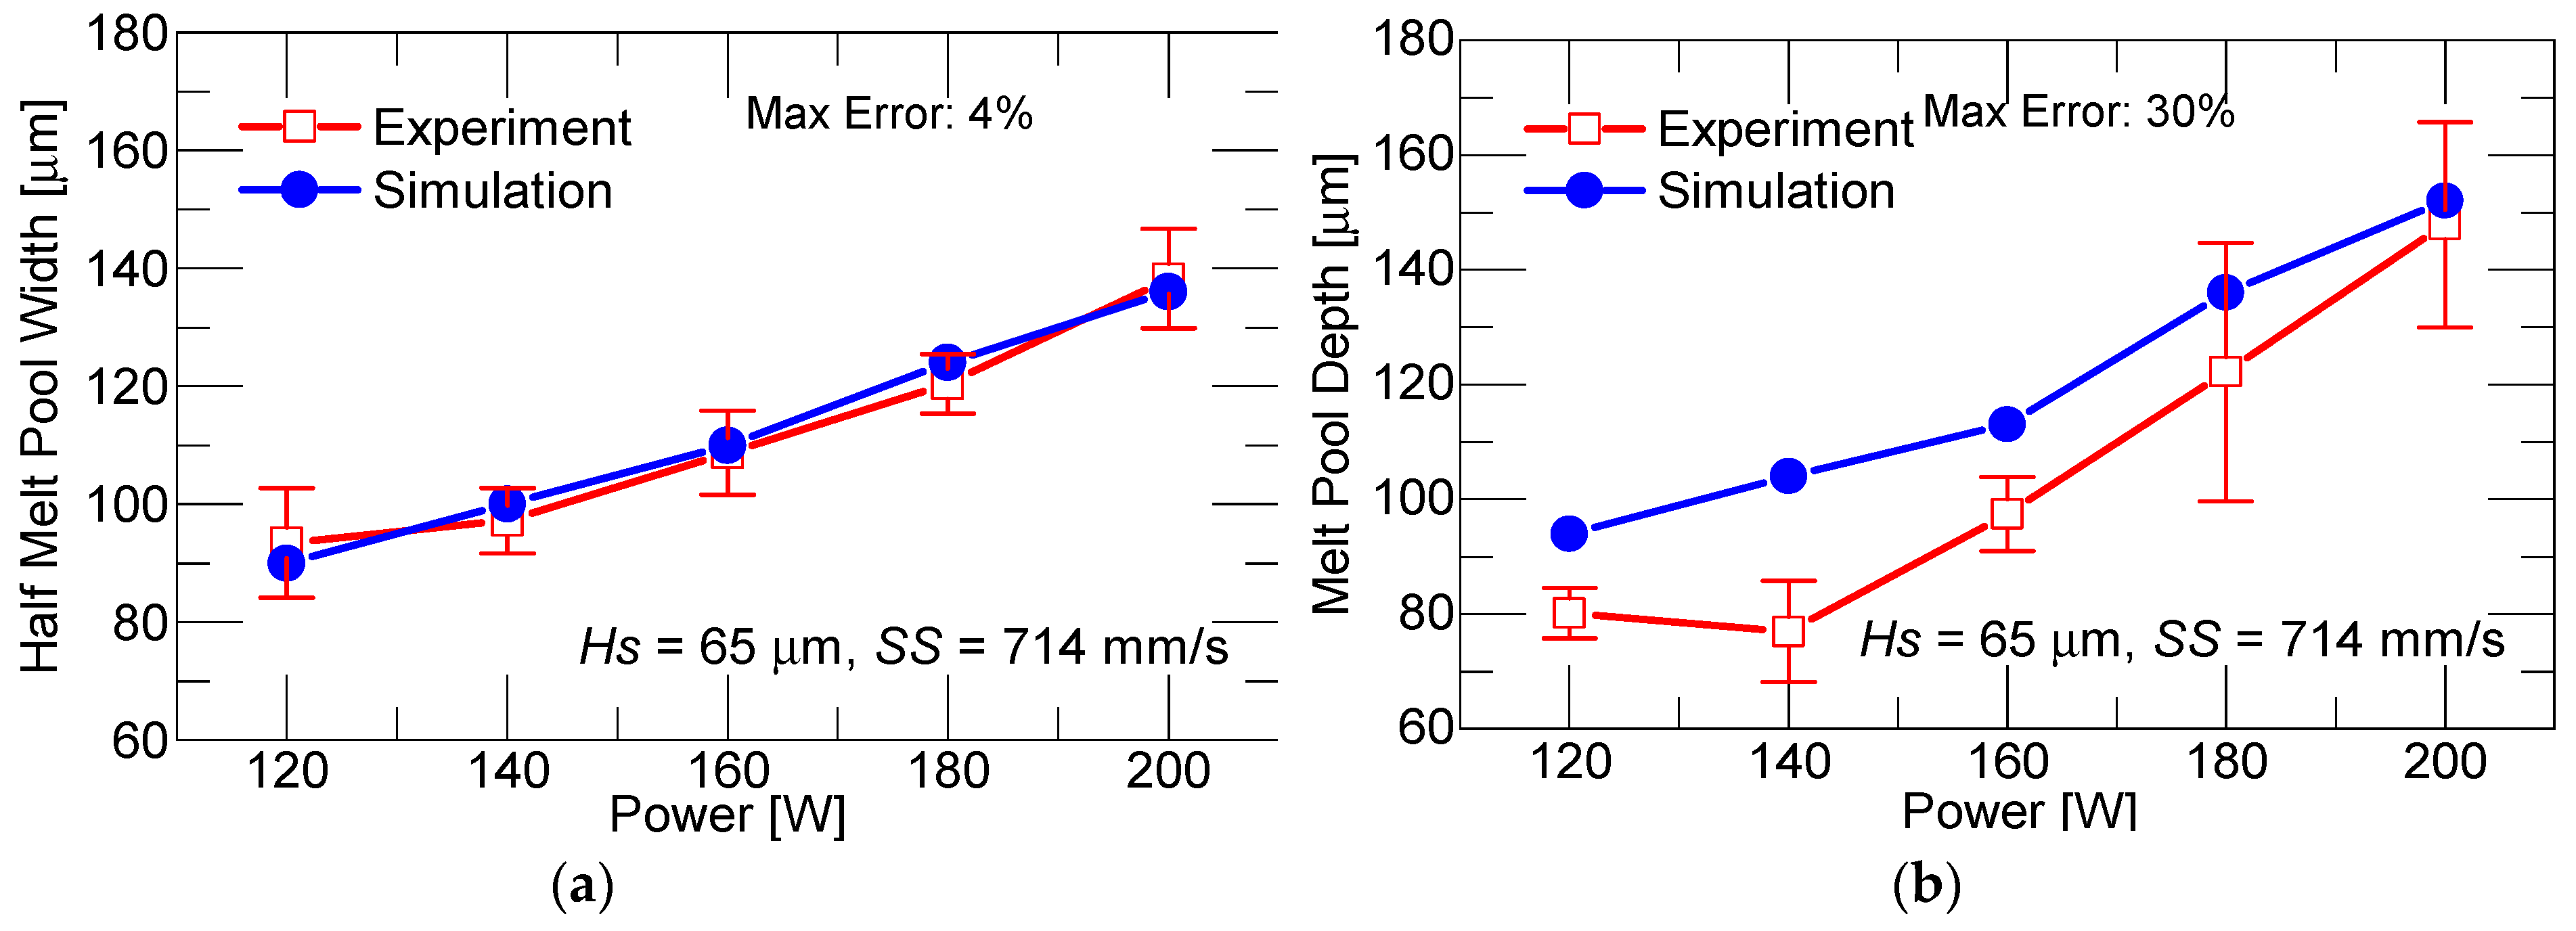
4.4. Validation of Simulated Melt Pool Size

Comparisons of melt pool sizes as a function of laser power from experimental and simulation results are displayed in Figure 7 and Figure 8. The scan speed was 715 mm/s and the hatch spacing was 65 µm and 105 µm, respectively. It shows that the simulated melt pool sizes were in good agreement with experimental results, especially for melt pool width in Figure 7a and Figure 8a. In these figures, the maximum error between simulation and experimental melt pool width was 4% and 8%, respectively. It can also be concluded that laser power, rather than hatch spacing, had the dominant effect on melt pool sizes. When the hatch spacing was 65 µm in Figure 7, melt width and depth increased rapidly as the power of the laser increased from 120 W to 1200 W, while when the hatch spacing was 105 µm in Figure 8b, melt depth did not increase linearly with the laser power. The underlying deposited tracks or underlying substrate did not melt enough to preheat the later deposit, which explains why the max error is as high as 30%; this hatch spacing should be avoided because this result is undesirable for additive deposition.

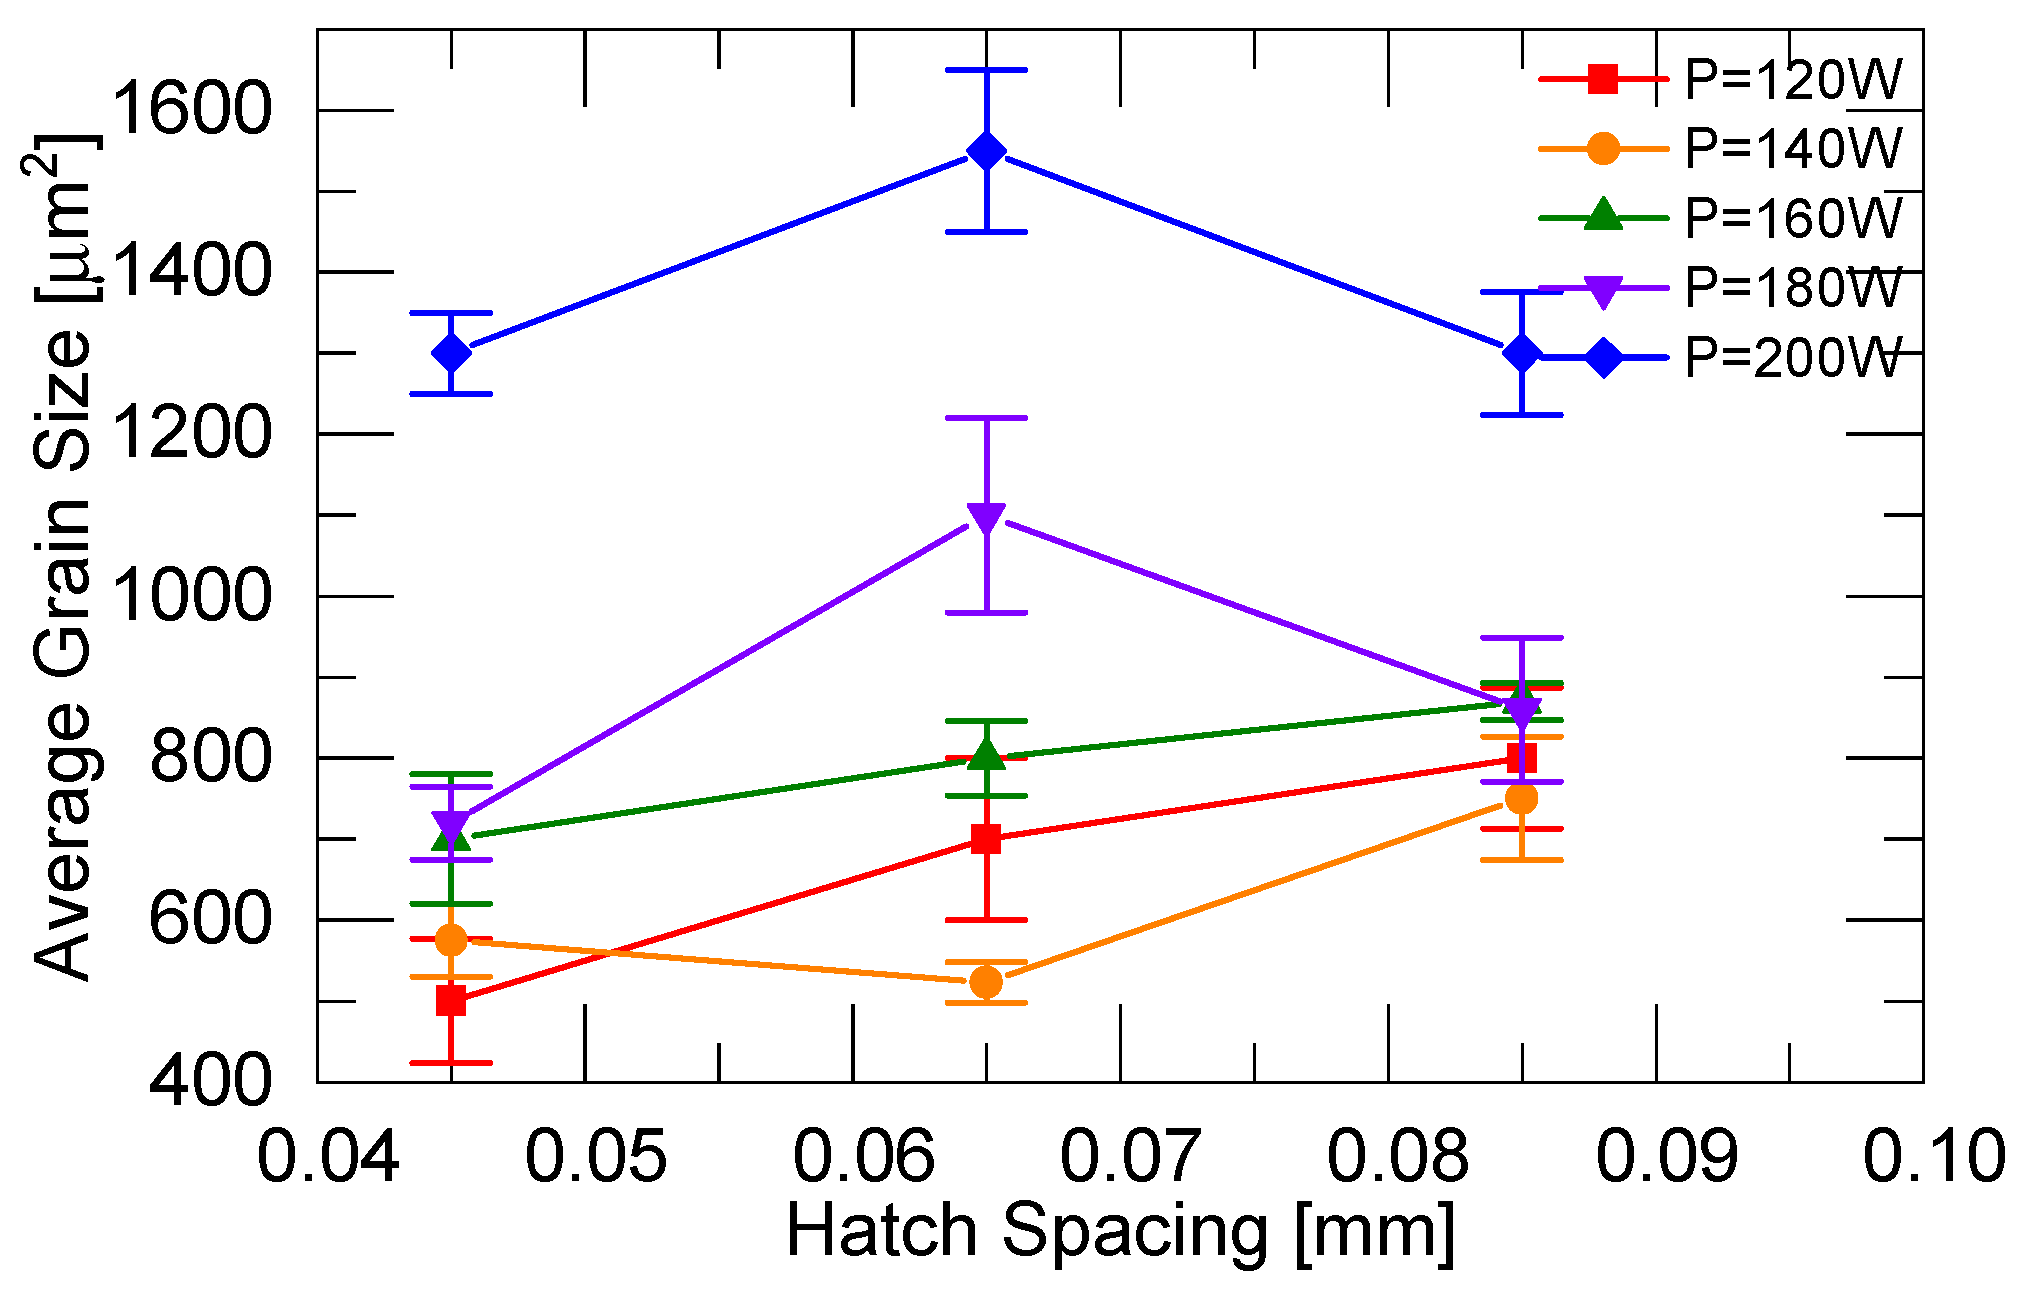
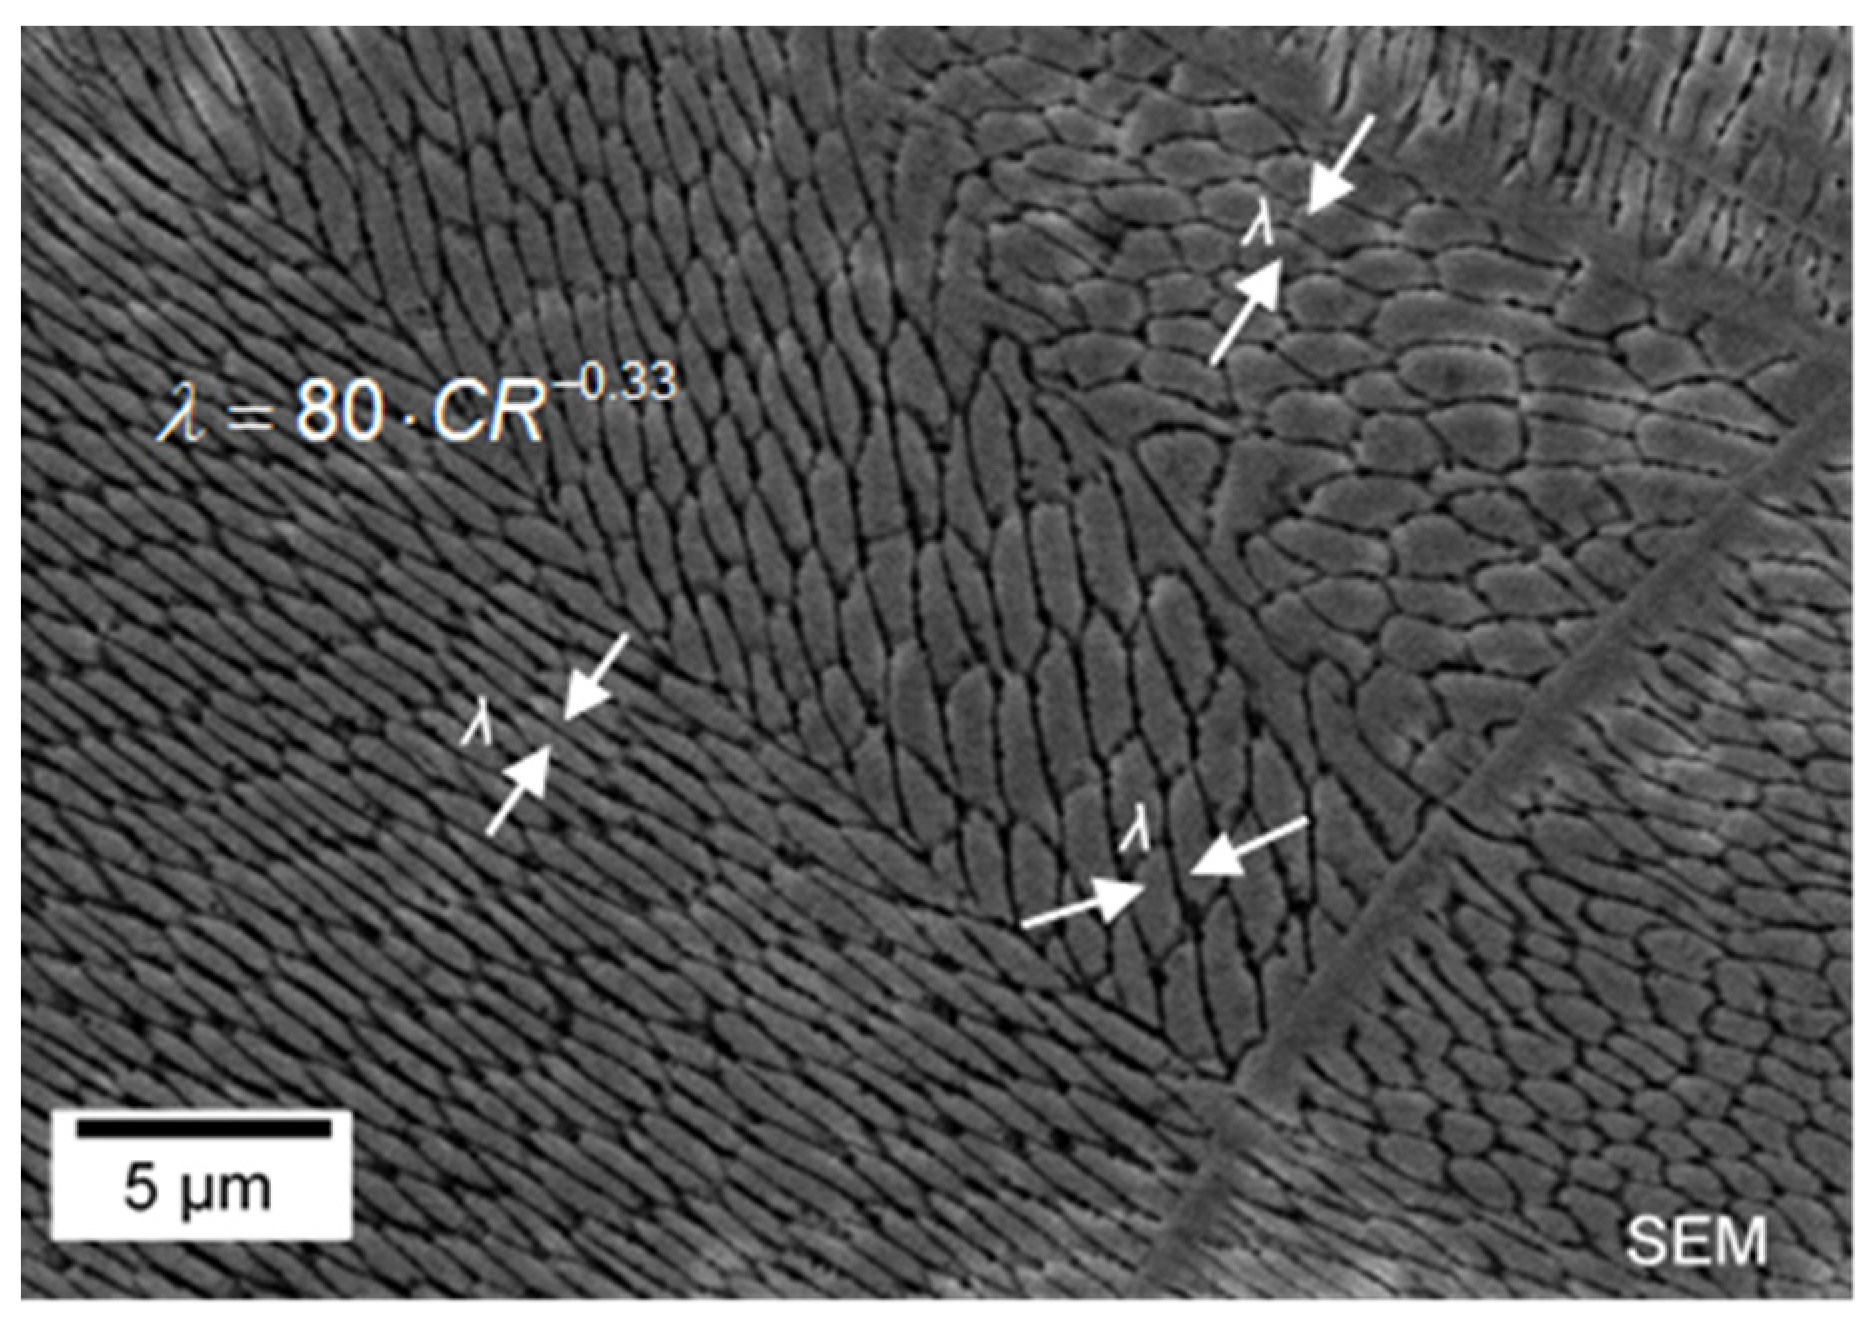
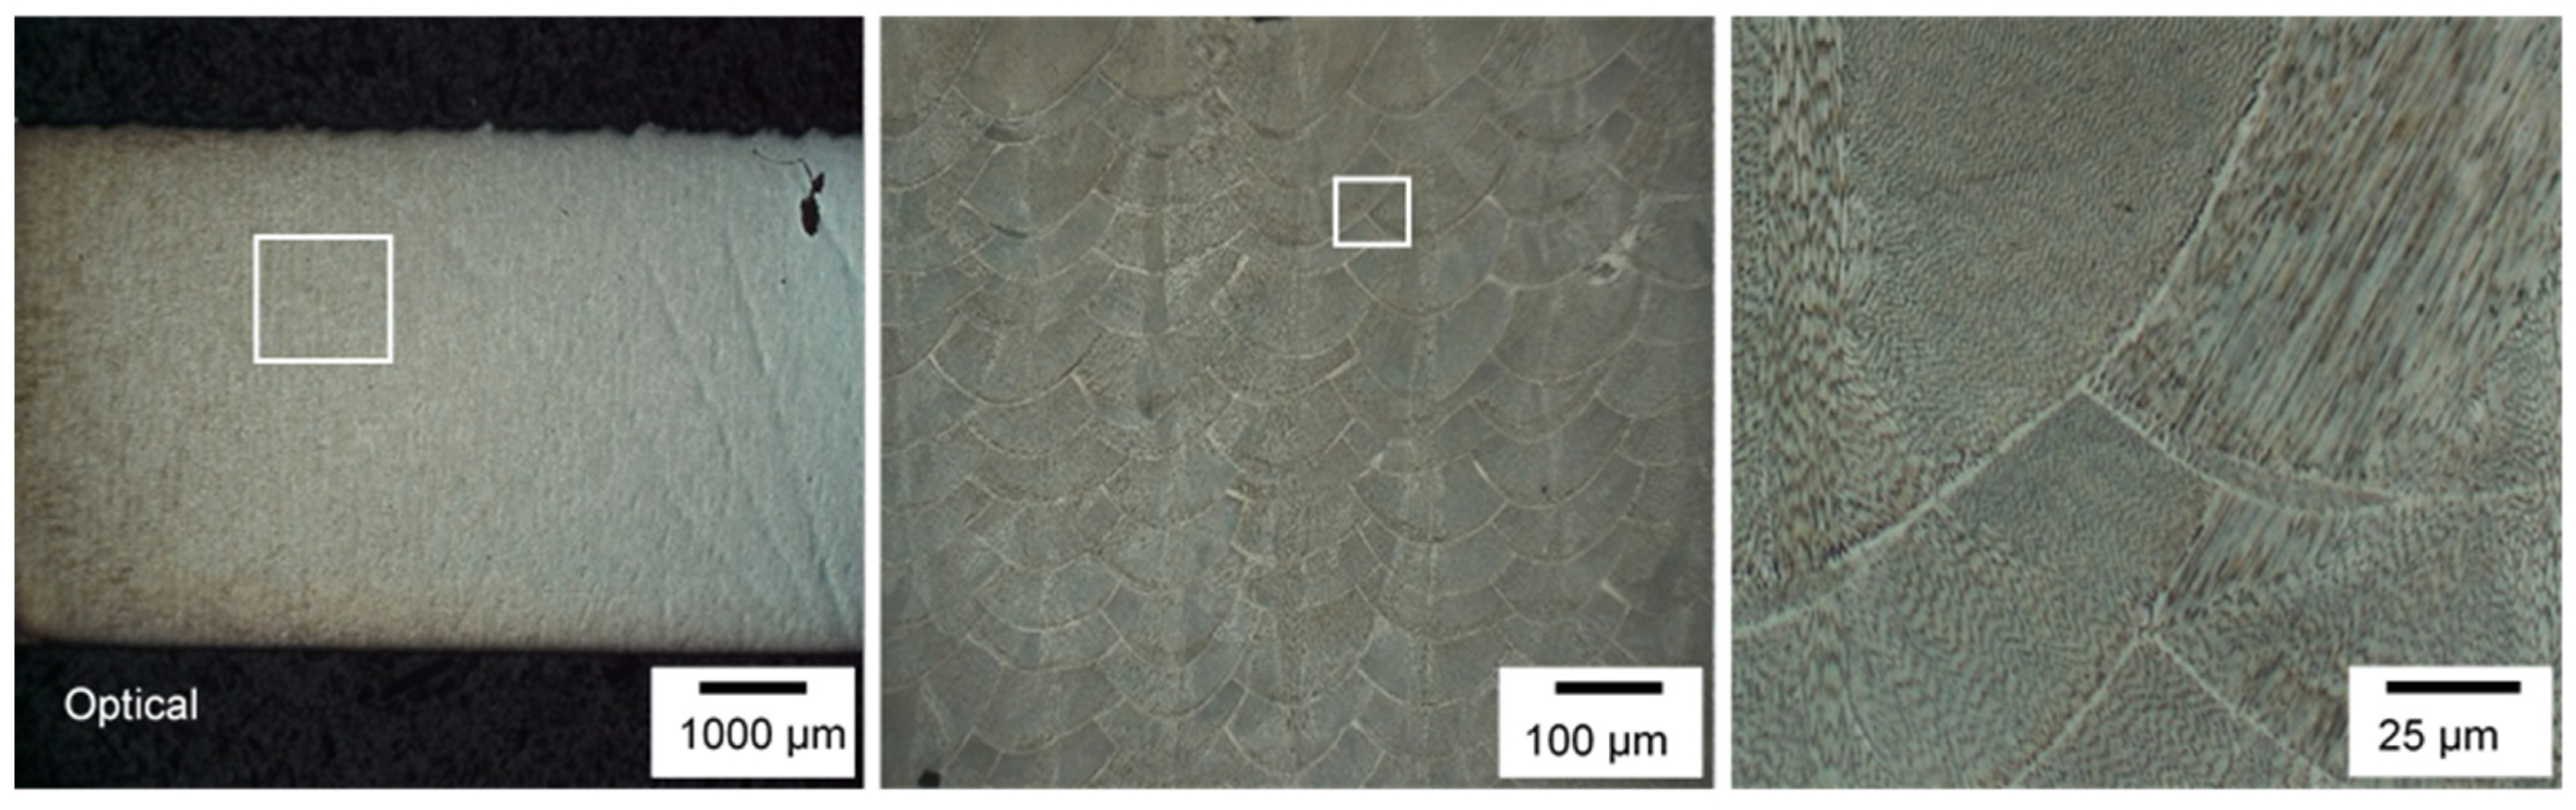
4.5. Experimental Microstructure

Figure 9 contains optical micrographs at different magnifications of a 304L stainless steel sample built at laser power of 180 W, hatch spacing of 65 µm, and scan speed of 940 mm/s. These graphs display the cellular grain structure of the sample. The austenitic phase of the sample is also highlighted in the figure through the dark gray shading. Cellular grain structure and austenitic phase seen in the figure were common features throughout the built samples.
The cellular grain structure is seen in these optical micrographs and identified by SEM (Figure 11), which confirms the prediction of a cellular solidification structure by the simulation. This validates the continuum thermal model and solidification parameter calculation approach used in this work to predict microstructure.
The average grain size in samples was measured following procedures outlined in ASTM E1382-97 [48]. The measured samples had hatch spacing from 45 μm to 85 μm and were subjected to laser power from 120 W to 200 W. Figure 10 shows the average grain size with respect to hatch spacing and laser power. It is seen that grain size increased with higher laser power because high energy input into the melting process led to a decrease in the cooling rate. For example, the measured grain sizes increased from 487 μm2 to 711 μm2 to 826 μm2 with hatch spacing increases from 45 μm to 65 μm and 85 μm when subjected to laser power of 200 W. It is noted that grain size correlates to cooling rate, with larger grain size resulting from slower cooling rates [43,44]. Therefore, the slower cooling rates at higher laser power resulted in larger grain sizes. This result is consistent with model predictions of lower cooling rates at higher laser power shown in Figure 4e.
In order to validate the simulated cooling rate, the experimental cooling rate needs to be calculated. Experimental cooling rate can be indirectly obtained by measuring cell spacing in samples. The relationship found in [49] between cell spacing and cooling rate in stainless steel is given by:
λ = 80 C R 0.33
where λ is the cell spacing and CR is the experimental cooling rate. Figure 11 shows the cellular microstructure in a 304L sample and the definition of cell spacing, λ. The measured λ was used in Equation (13) to estimate the experimental cooling rate.
Several cell spacing measurements were taken within samples to calculate the average cooling rate. The calculated cooling rate fell within the range of ~105 to ~106 K/s. This experimental cooling rate matches well with the simulated cooling rate which was ~105 K/s (Figure 4). It shows that the continuum thermal model in this paper successfully predicted the observed cellular solidification structure. It also presents that our numerical model successfully captured the trend in samples that cooling rate reduces with higher laser power through grain size analysis.

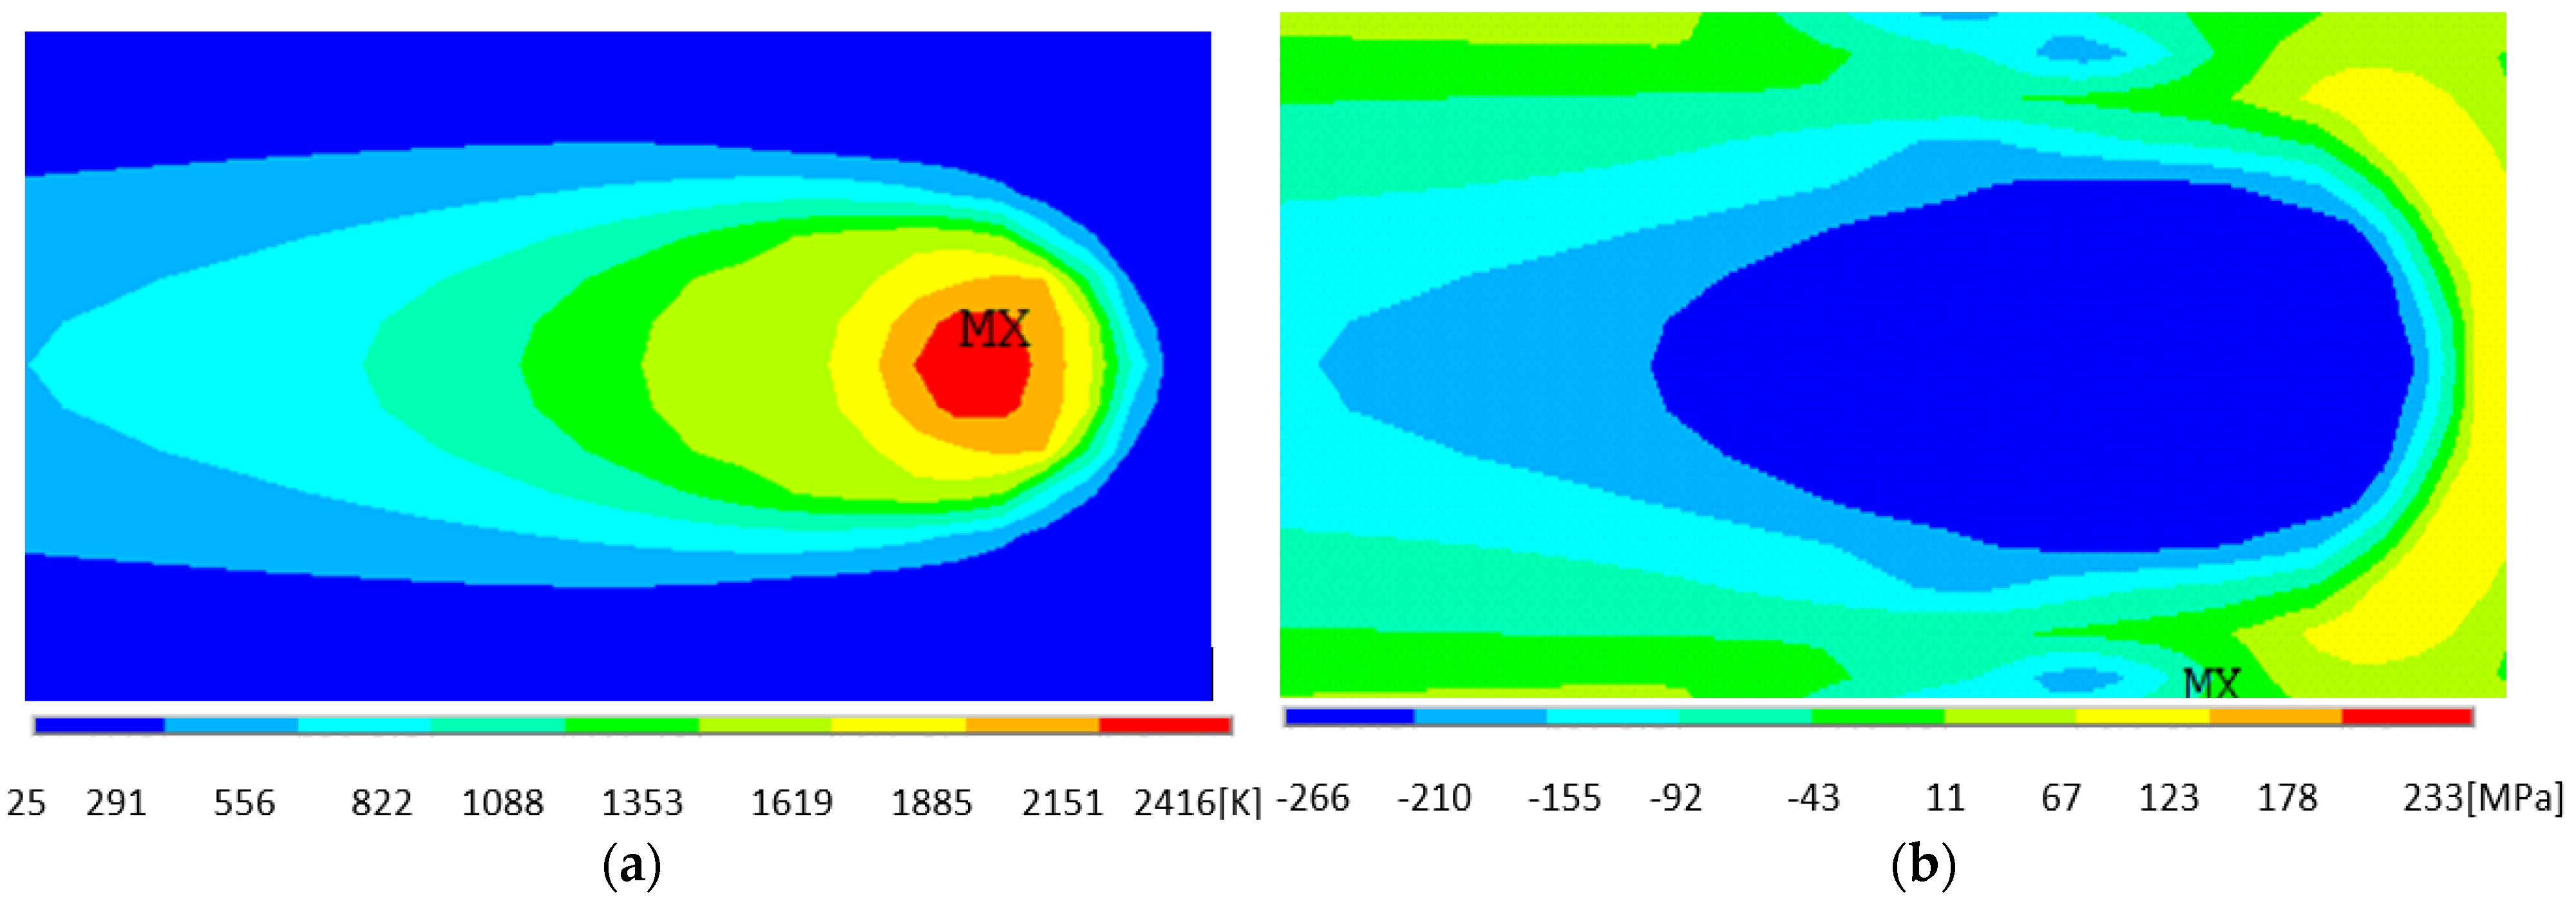
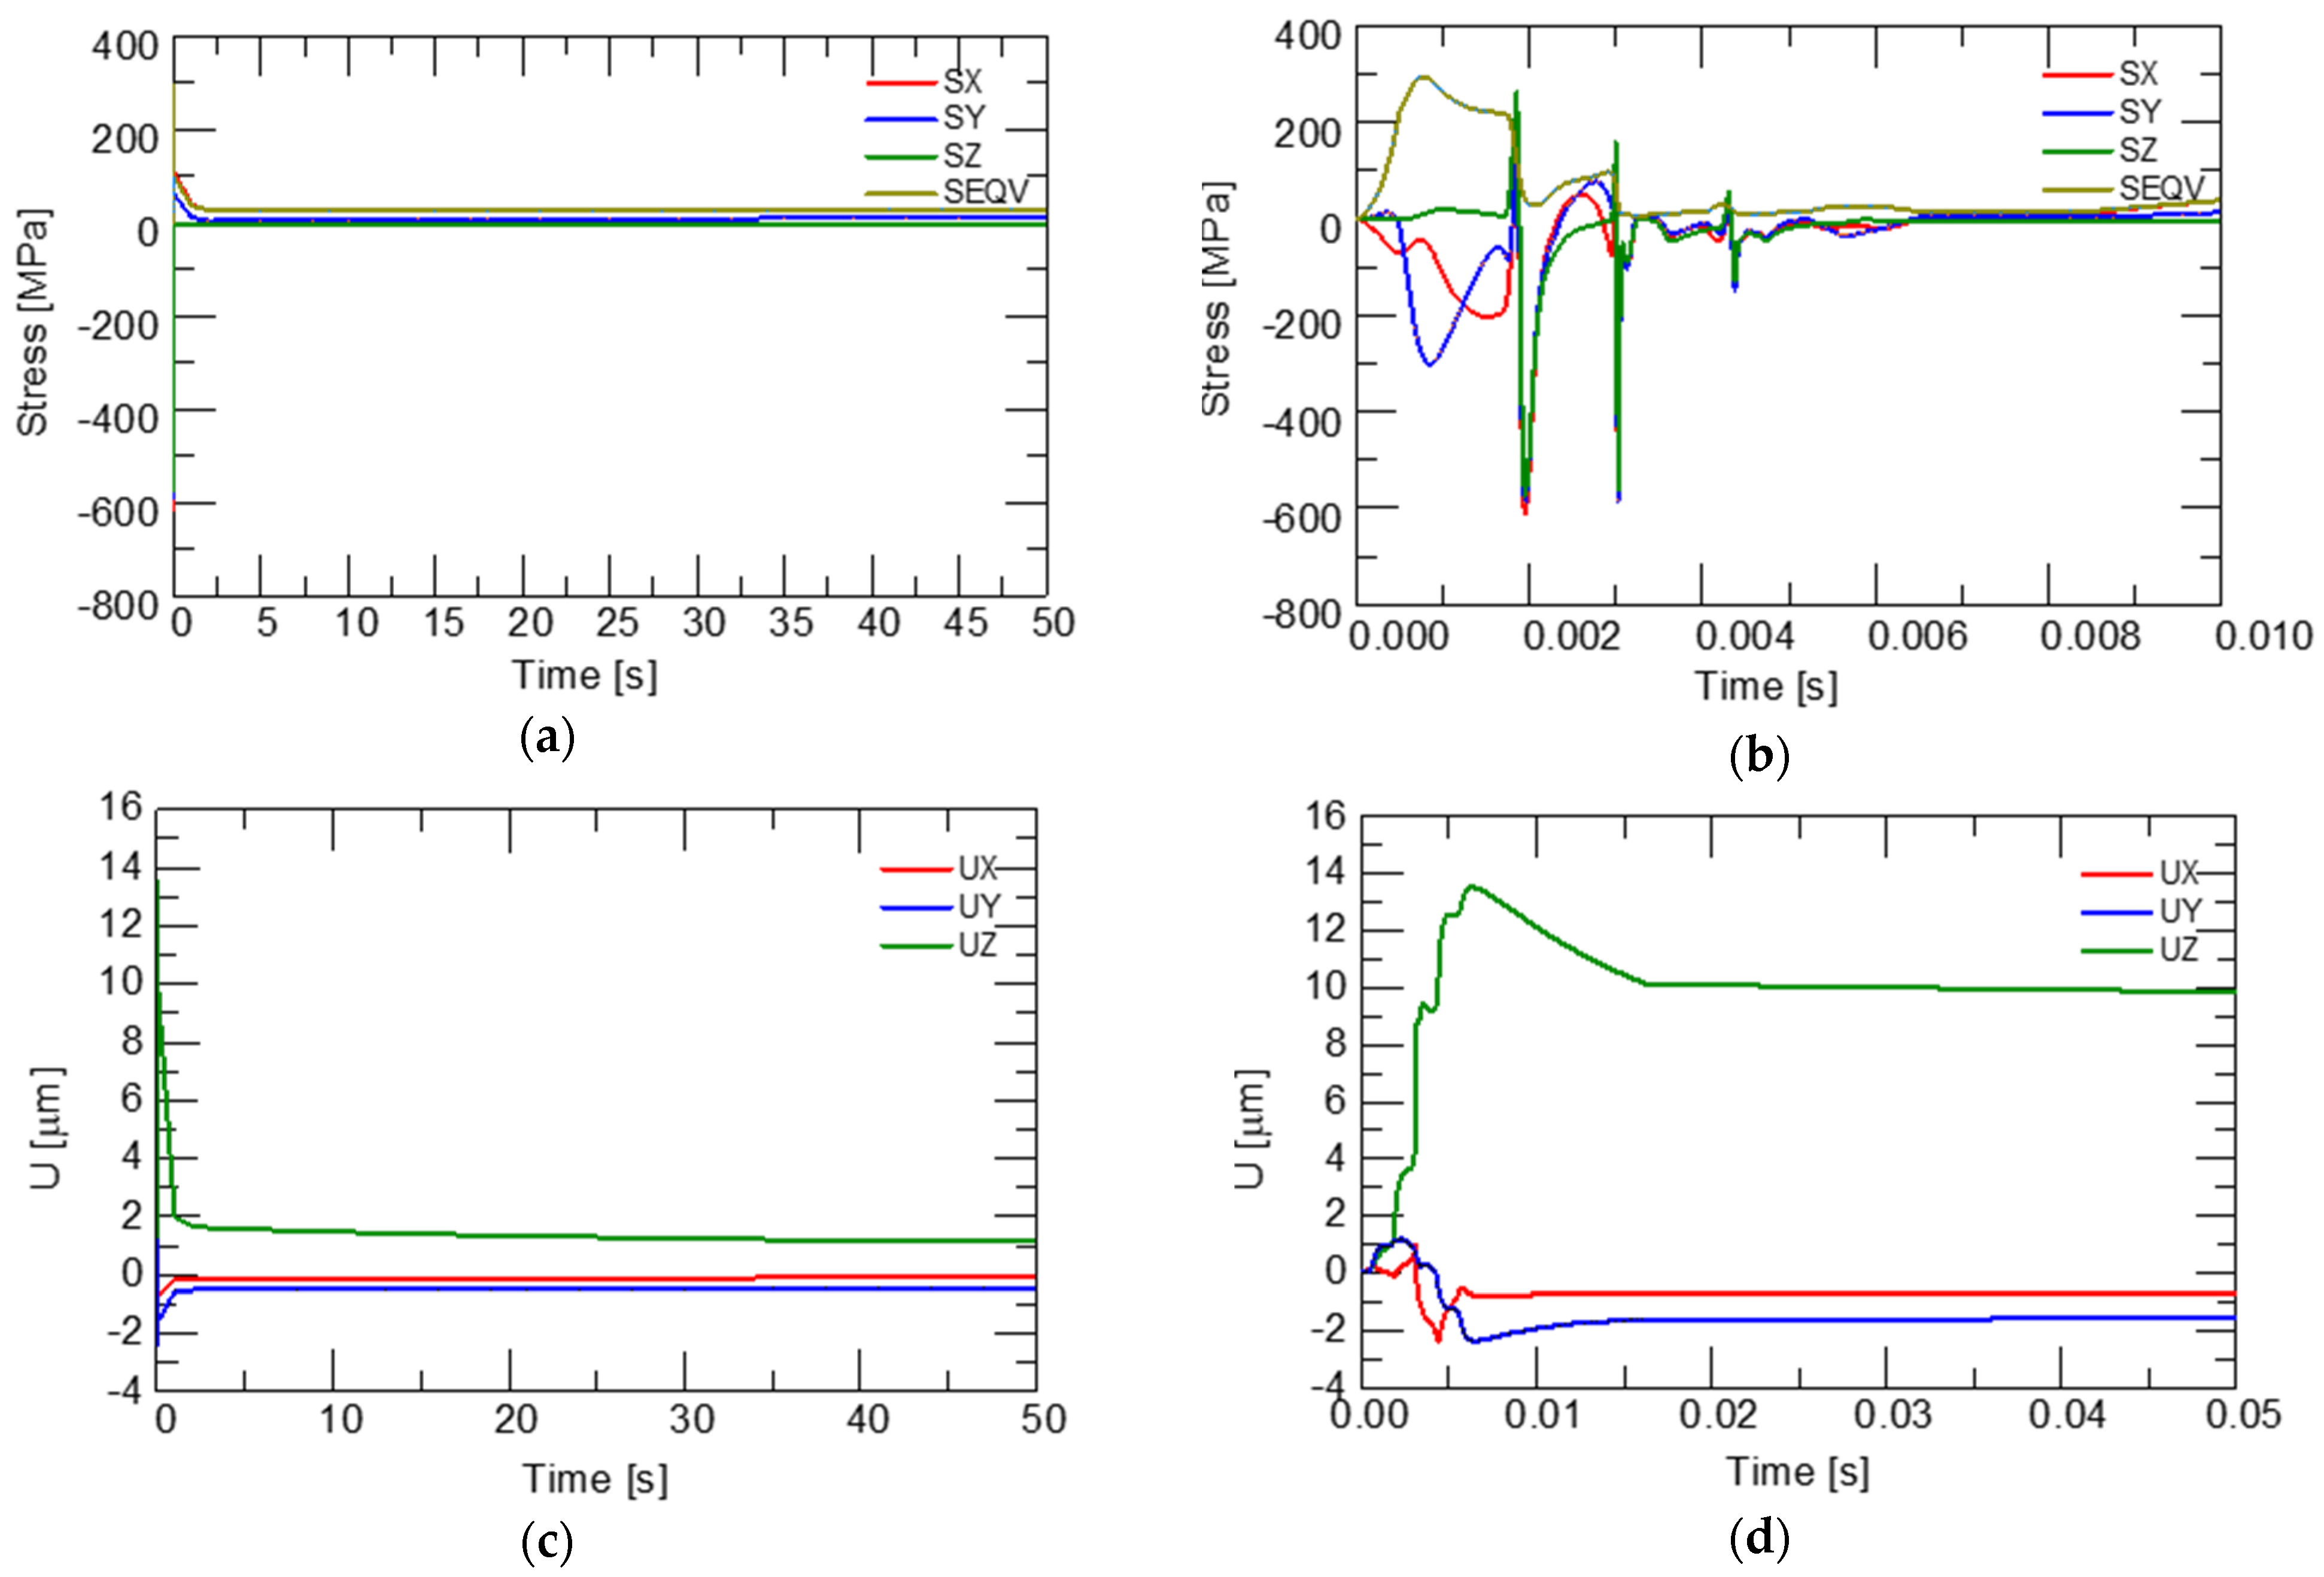
4.6. Simulated Thermal Stress Behavior

Figure 12a shows the temperature contour in the laser track when the laser traveled to point 1, the middle point of the first track. The color bar is set so that the highest value is marked as “MX” in the laser center. The maximum temperature during the process was predicted to be 2416 K. It is seen that the distance between two adjacent contours becomes longer in the rear of the laser center. It indicates a smaller temperature gradient away from the laser center and a smaller cooling rate as well. It is noted that the temperature gradient became higher when the laser power increased. The higher temperature gradient induced larger thermal stress, which means higher laser power is likely to induce greater residual stress fields within alloy components.
In the laser heating process, the outer region had lower temperature compared to the laser center; therefore the outer region tends to contract before the central melting region. This can be verified in Figure 12b; the center region had a higher temperature and was even larger than the melting point, thus the residual stress remained in compression as opposed to the outer region. It is noted that stress evolution depends on the direction of local thermal gradients. After cooling is completed, the material surface remains in compression, with the inner region remains in tension.
The stress evolution at point 2, middle of third track, is illustrated in Figure 13a,b. The longitudinal, transversal, normal stress components and von Mises stress with respect to simulation time are presented. It is shown in Figure 13b that different stress components presented complicated variation in the laser heating process (t < 0.007 s) and reached constant eventually as the part cooled down to room temperature. The final residual stress in different directions was read out from curves with X-component stress of 98 MPa, Y-component stress of 26 MPa, Z-component stress of 12 MPa and von Mises stress of 127 MPa, respectively. Longitudinal stress is the main contribution to residual stress due to the larger thermal gradient in the laser scanning direction.
In addition, thermal stress is in compression at the beginning of the heating process. As the heating process proceeds, the compressive stress reduces rapidly and turns into a tensile state [50]. This phenomenon is attributed to the alternating contraction and expansion in the heating process. Since the temperature at two adjacent tracks is higher than the melting temperature, elements in one track experience two melting stages. After the first track heating, the elements cool down and contract. As the laser in the second track approaches the elements in the first track, they start to heat up and expand. The sequential thermal cyclic melting in successive scanned tracks results in alternating compressive and tensile thermal stresses. This results in stress relaxation and a subsequent decrease in tensile stress.
The evolution of three deformation components at point 2 is illustrated in Figure 13c, d. Like the evolution of stress components, all deformation components presented complicated variation in the laser heating process (t < 0.00625 s) and eventually reached constant as the part cooled down to room temperature. The final deformation components in X, Y and Z direction were 0.13 μm, −0.055 μm and 1.1 μm, respectively. It is worth noting that the maximum of the deformation component in the Z direction was much larger than other two components, almost 14 μm at t = 0.00625 s.

5. Conclusions

Both numerical simulation and experiments were conducted to study the effects of laser process parameters on thermal history, melt pool size, microstructure formation and thermal stress during the SLM process using 304L stainless steel. The simulation and experiments showed good agreement in terms of melt pool size and cell size. The main results are summarized as follows:
(1) The continuum model correctly predicted melt pool size and found that melt pool size increased with higher laser power and lower scan speed.
(2) It was observed in experiments that grain size increased with higher laser power. Thermal model predicted lower cooling rates at higher laser power and thus larger grain sizes, which was consistent with the experimental findings.
(3) Cooling rate varied at different locations and ranges from ~105 to ~106 K/s in analyzed samples. The approach of solidification parameter calculation in numerical results was validated by correct prediction of the cellular structure.
(4) Cyclic melting in successive scanned tracks resulted in alternating compression and tension states of thermal stress. All stress and deformation components presented complicated variation trends in the laser heating process and eventually reached constant as the part cooled down to room temperature.

Author Contributions

Conceptualization, L.L. and F.L.; methodology, L.L. and F.L.; software, L.L.; validation, L.L.; investigation, L.L. and F.L.; writing—original draft preparation, L.L.; writing—review and editing, L.L.; supervision, F.L.; project administration, F.L.; funding acquisition, F.L. All authors have read and agreed to the published version of the manuscript.

Funding

This work was funded by Honeywell Federal Manufacturing & Technologies under Contract No. DE-NA0002839 with the U.S. Department of Energy and National Science Foundation (EEC-1461102).

Institutional Review Board Statement

Not applicable.

Informed Consent Statement

Not applicable.

Data Availability Statement

The data presented in this study are available on request from the corresponding author.

Acknowledgments

The United States Government retains and the publisher, by accepting the article for publication, acknowledges that the United States Government retains a nonexclusive, paid up, irrevocable, world-wide license to publish or reproduce the published form of this manuscript, or allow others to do so, for United States Government purposes.

Conflicts of Interest

The authors declare no conflict of interest.

References

  1. Patil, R.B.; Yadava, V. Finite element analysis of temperature distribution in single metallic powder layer during metal laser sintering. Int. J. Mach. Tools Manuf. 2007, 47, 1069–1080. [Google Scholar] [CrossRef]
  2. Roberts, I.; Wang, C.; Esterlein, R.; Stanford, M.; Mynors, D.; Roberts, I.; Wang, C.; Esterlein, R.; Stanford, M.; Mynors, D. A three-dimensional finite element analysis of the temperature field during laser melting of metal powders in additive layer manufacturing. Int. J. Mach. Tools Manuf. 2009, 49, 916–923. [Google Scholar] [CrossRef]
  3. Zhou, J.; Zhang, Y.; Chen, J. Numerical simulation of laser irradiation to a randomly packed bimodal powder bed. Int. J. Heat Mass Transf. 2009, 52, 3137–3146. [Google Scholar] [CrossRef]
  4. Yadroitsev, I.; Krakhmalev, P.; Yadroitsava, I. Selective laser melting of Ti6Al4V alloy for biomedical applications: Temperature monitoring and microstructural evolution. J. Alloy. Compd. 2014, 583, 404–409. [Google Scholar] [CrossRef]
  5. Alimardani, M.; Toyserkani, E.; Huissoon, J.P.; Paul, C.P. On the delamination and crack formation in a thin wall fabricated using laser solid freeform fabrication process: An experimental–numerical investigation. Opt. Lasers Eng. 2009, 47, 1160–1168. [Google Scholar] [CrossRef]
  6. Gusarov, A.; Yadroitsev, I.; Bertrand, P.; Smurov, I. Heat transfer modelling and stability analysis of selective laser melting. Appl. Surf. Sci. 2007, 254, 975–979. [Google Scholar] [CrossRef]
  7. Gusarov, A.; Smurov, I. Two-dimensional numerical modelling of radiation transfer in powder beds at selective laser melting. Appl. Surf. Sci. 2009, 255, 5595–5599. [Google Scholar] [CrossRef]
  8. Gusarov, A.; Smurov, I. Modeling the interaction of laser radiation with powder bed at selective laser melting. Phys. Procedia 2010, 5, 381–394. [Google Scholar] [CrossRef] [Green Version]
  9. Masmoudi, A.; Bolot, R.; Coddet, C. Investigation of the laser–powder–atmosphere interaction zone during the selective laser melting process. J. Mater. Process. Technol. 2015, 225, 122–132. [Google Scholar] [CrossRef]
  10. Loh, L.; Liu, Z.; Zhang, D.; Mapar, M.; Sing, S.; Chua, C.; Yeong, W.J.V.; Prototyping, P. Selective Laser Melting of aluminium alloy using a uniform beam profile: The paper analyzes the results of laser scanning in Selective Laser Melting using a uniform laser beam. Virtual Phys. Prototyp. 2014, 9, 11–16. [Google Scholar] [CrossRef]
  11. Kolossov, S.; Boillat, E.; Glardon, R.; Fischer, P.; Locher, M. 3D FE simulation for temperature evolution in the selective laser sintering process. Int. J. Mach. Tools Manuf. 2004, 44, 117–123. [Google Scholar] [CrossRef]
  12. Thijs, L.; Verhaeghe, F.; Craeghs, T.; Van Humbeeck, J.; Kruth, J.P. A study of the microstructural evolution during selective laser melting of Ti–6Al–4V. Acta Mater. 2010, 58, 3303–3312. [Google Scholar] [CrossRef]
  13. Thijs, L.; Sistiaga, M.L.M.; Wauthle, R.; Xie, Q.; Kruth, J.-P.; Van Humbeeck, J. Strong morphological and crystallographic texture and resulting yield strength anisotropy in selective laser melted tantalum. Acta Mater. 2013, 61, 4657–4668. [Google Scholar] [CrossRef] [Green Version]
  14. Thijs, L.; Kempen, K.; Kruth, J.-P.; Van Humbeeck, J. Fine-structured aluminium products with controllable texture by selective laser melting of pre-alloyed AlSi10Mg powder. Acta Mater. 2013, 61, 1809–1819. [Google Scholar] [CrossRef] [Green Version]
  15. ASTM. F2924—Standard Specification for Additive Manufacturing Titanium-6 Aluminum-4 Vanadium with Powder Bed Fusion; ASTM: West Conshohocken, PA, USA, 2014. [Google Scholar]
  16. Edwards, P.; Ramulu, M. Fatigue performance evaluation of selective laser melted Ti–6Al–4V. Mater. Sci. Eng. A 2014, 598, 327–337. [Google Scholar] [CrossRef]
  17. Luo, Z.; Zhao, Y.F. A survey of finite element analysis of temperature and thermal stress fields in powder bed fusion Additive Manufacturing. Addit. Manuf. 2018, 21, 318–332. [Google Scholar] [CrossRef] [Green Version]
  18. Wu, A.S.; Brown, D.W.; Kumar, M.; Gallegos, G.F.; King, W.E. An Experimental Investigation into Additive Manufacturing-Induced Residual Stresses in 316L Stainless Steel. Met. Mater. Trans. A 2014, 45, 6260–6270. [Google Scholar] [CrossRef]
  19. Zhao, H.; Zhang, G.; Yin, Z.; Wu, L. A 3D dynamic analysis of thermal behavior during single-pass multi-layer weld-based rapid prototyping. J. Mater. Process. Technol. 2011, 211, 488–495. [Google Scholar] [CrossRef]
  20. Ding, J.; Colegrove, P.; Mehnen, J.; Ganguly, S.; Almeida, P.S.; Wang, F.; Williams, S. Thermo-mechanical analysis of Wire and Arc Additive Layer Manufacturing process on large multi-layer parts. Comput. Mater. Sci. 2011, 50, 3315–3322. [Google Scholar] [CrossRef] [Green Version]
  21. Antony, K.; Arivazhagan, N.; Senthilkumaran, K. Numerical and experimental investigations on laser melting of stainless steel 316L metal powders. J. Manuf. Process. 2014, 16, 345–355. [Google Scholar] [CrossRef]
  22. Parry, L.; Ashcroft, I.; Wildman, R. Understanding the effect of laser scan strategy on residual stress in selective laser melting through thermo-mechanical simulation. Addit. Manuf. 2016, 12, 1–15. [Google Scholar] [CrossRef] [Green Version]
  23. Mukherjee, T.; Zuback, J.; Zhang, W.; DebRoy, T. Residual stresses and distortion in additively manufactured compositionally graded and dissimilar joints. Comput. Mater. Sci. 2018, 143, 325–337. [Google Scholar] [CrossRef]
  24. Cao, J.; Gharghouri, M.A.; Nash, P. Finite-element analysis and experimental validation of thermal residual stress and distortion in electron beam additive manufactured Ti-6Al-4V build plates. J. Mater. Process. Technol. 2016, 237, 409–419. [Google Scholar] [CrossRef]
  25. Dai, K.; Shaw, L. Thermal and stress modeling of multi-material laser processing. Acta Mater. 2001, 49, 4171–4181. [Google Scholar] [CrossRef]
  26. Dai, K.; Shaw, L. Thermal and mechanical finite element modeling of laser forming from metal and ceramic powders. Acta Mater. 2004, 52, 69–80. [Google Scholar] [CrossRef]
  27. Dai, K.; Shaw, L. Parametric studies of multi-material laser densification. Mater. Sci. Eng. A 2006, 430, 221–229. [Google Scholar] [CrossRef]
  28. Bergman, T.L.; Incropera, F.P.; Lavine, A.S.; Dewitt, D.P. Introduction to Heat Transfer; John Wiley & Sons: Hoboken, NJ, USA, 2011. [Google Scholar]
  29. Liu, H. Numerical Analysis of Thermal Stress and Deformation in Multi-Layer Laser Metal Deposition Process. Master’s Thesis, Missouri University of Science and Technology, Rolla, MO, USA, 2014. [Google Scholar]
  30. Megahed, M.; Mindt, H.-W.; N’Dri, N.; Duan, H.; Desmaison, O. Metal additive-manufacturing process and residual stress modeling. Integrating Mater. Manuf. Innov. 2016, 5, 61–93. [Google Scholar] [CrossRef] [Green Version]
  31. Peyre, P.; Aubry, P.; Fabbro, R.; Neveu, R.; Longuet, A. Analytical and numerical modelling of the direct metal deposition laser process. J. Phys. D Appl. Phys. 2008, 41, 025403. [Google Scholar] [CrossRef]
  32. Irwin, J.; Michaleris, P. A Line Heat Input Model for Additive Manufacturing. J. Manuf. Sci. Eng. 2016, 138, 111004. [Google Scholar] [CrossRef]
  33. Schilp, J.; Seidel, C.A.M.; Krauss, H.; Weirather, J. Investigations on Temperature Fields during Laser Beam Melting by Means of Process Monitoring and Multiscale Process Modelling. Adv. Mech. Eng. 2014, 6, 217584. [Google Scholar] [CrossRef]
  34. Papadakis, L.; Loizou, A.; Risse, J.; Bremen, S.; Schrage, J.J.V.; Prototyping, P. A computational reduction model for appraising structural effects in selective laser melting manufacturing: A methodical model reduction proposed for time-efficient finite element analysis of larger components in Selective Laser Melting. Virtual Phys. Prototyp. 2014, 9, 17–25. [Google Scholar] [CrossRef]
  35. Mills, K.C. Recommended Values of Thermophysical Properties for Selected Commercial Alloys; Woodhead Publishing: Sawston, UK, 2002. [Google Scholar]
  36. Deng, D.; Murakawa, H. Numerical simulation of temperature field and residual stress in multi-pass welds in stainless steel pipe and comparison with experimental measurements. Comput. Mater. Sci. 2006, 37, 269–277. [Google Scholar] [CrossRef]
  37. Ladani, L.; Romano, J.; Brindley, W.; Burlatsky, S. Effective liquid conductivity for improved simulation of thermal transport in laser beam melting powder bed technology. Addit. Manuf. 2017, 14, 13–23. [Google Scholar] [CrossRef]
  38. Zhang, Z.; Huang, Y.; Kasinathan, A.R.; Shahabad, S.I.; Ali, U.; Mahmoodkhani, Y.; Toyserkani, E. 3-Dimensional heat transfer modeling for laser powder-bed fusion additive manufacturing with volumetric heat sources based on varied thermal conductivity and absorptivity. Opt. Laser Technol. 2019, 109, 297–312. [Google Scholar] [CrossRef]
  39. Levy, O.; Stroud, D. Maxwell Garnett theory for mixtures of anisotropic inclusions: Application to conducting polymers. Phys. Rev. B 1997, 56, 8035–8046. [Google Scholar] [CrossRef] [Green Version]
  40. Hussein, A.; Hao, L.; Yan, C.; Everson, R. Finite element simulation of the temperature and stress fields in single layers built without-support in selective laser melting. Mater. Des. 2013, 52, 638–647. [Google Scholar] [CrossRef]
  41. Haque, E.; Hampson, P. Modelling Phase Change in a 3D Thermal Transient Analysis. Int. J. Multiphysics 2014, 8, 49–68. [Google Scholar] [CrossRef]
  42. Li, L.; Lough, C.; Replogle, A.; Bristow, D.; Landers, R.; Kinzel, E. Thermal modeling of 304L stainless steel selective laser melting. In Proceedings of the ASME 2017 International Mechanical Engineering Congress and Exposition, Advanced Manufacturing, Tampa, FL, USA, 3–9 November 2017; pp. 1068–1081. [Google Scholar]
  43. Zhang, W.; Roy, G.G.; Elmer, J.W.; Debroy, T. Modeling of heat transfer and fluid flow during gas tungsten arc spot welding of low carbon steel. J. Appl. Phys. 2003, 93, 3022–3033. [Google Scholar] [CrossRef] [Green Version]
  44. Verma, V.; Mandal, A.; Shukla, A.J.I.J. Laser Direct Metal Deposition (LDMD)–An Overview. Int. J. 2017, 5, 459–467. [Google Scholar]
  45. Bontha, S.; Klingbeil, N.W.; Kobryn, P.A.; Fraser, H.L. Thermal process maps for predicting solidification microstructure in laser fabrication of thin-wall structures. J. Mater. Process. Technol. 2006, 178, 135–142. [Google Scholar] [CrossRef]
  46. Raghavan, N.; Dehoff, R.; Pannala, S.; Simunovic, S.; Kirka, M.; Turner, J.; Carlson, N.; Babu, S.S. Numerical modeling of heat-transfer and the influence of process parameters on tailoring the grain morphology of IN718 in electron beam additive manufacturing. Acta Mater. 2016, 112, 303–314. [Google Scholar] [CrossRef] [Green Version]
  47. Hu, H.; Ding, X.; Wang, L. Numerical analysis of heat transfer during multi-layer selective laser melting of AlSi10Mg. Optik 2016, 127, 8883–8891. [Google Scholar] [CrossRef]
  48. ASTM. Standard Test Methods for Determining Average Grain Size Using Semiautomatic and Automatic Image Analysis; ASTM: West Conshohocken, PA, USA, 2010. [Google Scholar]
  49. Elmer, J.W.; Allen, S.M.; Eagar, T.W. Microstructural development during solidification of stainless steel alloys. Met. Mater. Trans. A 1989, 20, 2117–2131. [Google Scholar] [CrossRef]
  50. Vrancken, B.; Cain, V.; Knutsen, R.; Van Humbeeck, J. Residual stress via the contour method in compact tension specimens produced via selective laser melting. Scr. Mater. 2014, 87, 29–32. [Google Scholar] [CrossRef] [Green Version]
Figure 1. FEA model geometry and laser scan strategy of SLM process.
Metals 11 01003 g001
Figure 2. Experiment build.
Metals 11 01003 g002
Figure 3. Thermal history of Points 1–3 at laser power of 120 W.
Metals 11 01003 g003
Figure 4. (a) Cooling rate and (b) solidification morphology factor map for the model top surface; (c) Cooling rate and (d) solidification morphology factor map for the model cross-section; (e) Cooling rate and (f) solidification morphology factor across laser tracks for laser power of 120, 160, and 200 W.
Metals 11 01003 g004
Figure 5. Definition of melt pool half width and depth in (a) simulation and (b) experiment.
Metals 11 01003 g005
Figure 6. Melt pool size changes with laser power and scan speed including (a) half width for hatch spacing of 45 µm; (b) depth for hatch spacing of 45 µm; (c) half width for hatch spacing of 65 µm; (d) depth for hatch spacing of 65 µm; (e) half width for hatch spacing of 85 µm; (f) depth for hatch spacing of 85 µm; (g) half width for hatch spacing of 105 µm; and (h) depth for hatch spacing of 105 µm.
Metals 11 01003 g006aMetals 11 01003 g006b
Figure 7. Experiment vs. simulation (a) half melt pool width and (b) melt pool depth with respect to laser power for hatch spacing of 65 µm and scan speed of 715 mm/s.
Metals 11 01003 g007
Figure 8. Experiment vs. simulation (a) half melt pool width and (b) melt pool depth with respect to laser power for hatch spacing of 105 µm and scan speed of 715 mm/s.
Metals 11 01003 g008
Figure 9. Optical micrographs of sample built with laser power of 180 W, hatch spacing of 65 µm and scan speed of 940 mm/s.
Metals 11 01003 g009
Figure 10. Average grain size with respect to hatch spacing and laser power.
Metals 11 01003 g010
Figure 11. SEM image of 304L sample showing cellular grain structure and definition of cell spacing, λ.
Metals 11 01003 g011
Figure 12. (a) Temperature contour when laser travels to point 1 and (b) thermal stress corresponding to (a).
Metals 11 01003 g012
Figure 13. The stress and deformation components’ distribution at point 2: The stress components’ distribution during the entire simulation time (a,b); The deformation components’ distribution during the entire simulation time (c,d). (b,d) are the zoom graphs of (a,c), respectively.
Metals 11 01003 g013
Table 1. Hatch parameters of the simulation model.
Hatch ParametersModel
Power, P [W]120, 140, 160, 180, 200
Optical penetration depth, d [µm]50
Hatch spacing, Hs [µm]65, 105
Point distance, pd [µm]50, 60
Laser exposure time, te [µs]70, 75
Effective scan speed, SS [mm/s]715, 800
Laser radius, r0 [µm]70
Reflectance of SS304L, R0.6
Number of laser tracks, N5
Table 2. Thermal and mechanical properties of solid state SS304L.
T(K)cp(J/(kg·K))k(W/(m·K)) ρ(kg/m3)H(kJ)σy(MPa)α(10−6K−1)E(GPa) ν
29848014.880200220172000.29
37350015.880003621817.41930.295
47353017.7795088186181850.3
57354018.8790314117018.61750.31
67356020.77855196155191650.32
87359523.5775131114519.51600.33
107362025.8764543291201500.34
147367531.674316902520600.34
157369532.873817582120200.34
167372033.573518012020100.34
17278001406900112912010.34
17738001406900116612010.34
18738001406900124612010.34
Table 3. Experiment process parameters.
Power,
P, [W]
Hatch Spacing,
Hs, [mm]
Scan Speed,
SS, [mm/s]
1200.045615
1400.065715
1600.085800
1800.105875
2000.125940
Publisher’s Note: MDPI stays neutral with regard to jurisdictional claims in published maps and institutional affiliations.

