Article

Comparison of Corrosion Resistance of the AA2524-T3 and the AA2024-T3

by
Fernanda Martins Queiroz
1,
Maysa Terada
2,*,
Aline F. Santos Bugarin
3,
Hercílio Gomes de Melo
4 and
Isolda Costa
3
1
Escola e Faculdade de Tecnologia SENAI Suiço-Brasileira “Paulo Ernesto Tolle”, Av. Bento Branco de Andrade Filho, 379, São Paulo 04757-000, Brazil
2
Instituto SENAI de Inovação em Manufatura Avançada e Microfabricação, Av. Bento Branco de Andrade Filho, 379, São Paulo 04757-000, Brazil
3
IPEN, Instituto de Pesquisas Energéticas e Nucleares, Av. Prof. Lineu Prestes, 2242, São Paulo 05508-000, Brazil
4
Escola Politécnica da University de São Paulo, Departament de Engenharia Metalúrgica e de Materiais, Av. Prof. Mello de Moraes, 2463, São Paulo 05508-030, Brazil
*
Author to whom correspondence should be addressed.
Metals 2021, 11(6), 980; https://doi.org/10.3390/met11060980
Submission received: 6 May 2021 / Revised: 13 June 2021 / Accepted: 15 June 2021 / Published: 19 June 2021
(This article belongs to the Special Issue Advances in Corrosion and Protection of Materials)

Abstract

:
The 2XXX Al alloys are characterized by their superior mechanical properties resulting from alloying elements and precipitation hardening treatments. The AA2524-T3 alloy was developed to replace the AA2024-T3 alloy in the aerospace industry. However, both alloys present many intermetallic particles (IMCs) in their microstructure, and this is the main reason for their high susceptibility to localized corrosion (such as pitting and stress corrosion cracking). Despite the similarities between these alloys (e.g., chemical composition and type of intermetallics) the literature comparing their properties is scarce and focuses mainly on their mechanical properties, not their corrosion resistances. In this investigation, the corrosion resistance of the AA2524-T3 alloy was compared to the AA2024-T3 alloy. The microstructure of both alloys was analyzed by Scanning Electron Microscopy before and after immersion in the test electrolyte, and the number and area fraction of intermetallics of each alloy was determined. The corrosion resistance of both alloys was monitored as a function of exposure time by electrochemical impedance spectroscopy and the results were fitted using electrical equivalent circuits. The AA2524-T3 alloy presented not only higher impedance values but also less corroded areas than the AA2024-T3 alloy.

1. Introduction

The 2XXX Al alloys are largely used in the aircraft industry due to their superior mechanical properties resulting from alloying elements addition, mainly Cu and Mg, and precipitation hardening treatments. The AA2524-T3 alloy is a relatively new alloy (formerly known as C188-T3) developed by ALCOA to replace the AA2024-T3 alloy in fuselage skins. It is currently used in the Boeing 777 aircraft [1,2]. It presents high damage-tolerance and excellent fatigue properties [1]. However, both the AA2024-T3 and AA2524-T3 alloys possess a large amount of intermetallic particles (IMCs) in their microstructure, and this is the main reason for their high susceptibility to localized corrosion such as pitting and stress corrosion cracking [3,4,5,6,7,8]. Localized corrosion in aluminium alloys uses to be caused by microgalvanic effects between IMCs and the matrix [7,8,9,10]. This generally results in pitting corrosion, which is considered to be one of the main microstructure dependent damage mechanisms of high strength aluminium alloys [7]. Particles constituted by the alloying elements present different electrochemical activity from the matrix and, therefore, represent preferential sites for pitting nucleation. In potential-controlled conditions, pitting is characterized by two types of events, metastable and stable, which occur before and after the pitting potential, respectively [11].
According to Birbilis and Buchheit [12], three main types of IMCs particles can be found in high strength Al alloys: precipitates, dispersoids, and constituent particles. The first ones are formed by nucleation and growth from a supersaturated solution and their diameters are around few tenths to hundreds of nanometers. They contribute to an increase in the mechanical resistance of the alloy when they are coherent and homogeneously dispersed in the matrix [13]. It is reported that they can initiate intergranular corrosion and stress corrosion cracking when clustered near grain boundaries [12,14,15]. While dispersoids are typically bigger than the precipitates, they are still within the submicrometric to micrometric range. Their main role is to control recrystallisation and grain size [12,13]. Since they are mostly passive in environments where Al alloys are usually used and are uniformly distributed, they rarely increase corrosion susceptibility [12]. Finally, the constituent particles, in the present work denominated intermetallics (IMCs), are the largest ones. Its size range is from a few tenths of a micrometer to up to 10–20 micrometers. They tend to break down during mechanical treatments [12] and are frequently noticed in clusters [16]. They are enriched in different alloying elements and there is a universal agreement that pitting corrosion of high strength Al alloys is associated with these particles, mainly in chloride containing media.
In 2XXX series aluminium alloys, θ’ (Al2Cu) and S (Al2CuMg) are two of the most important types of coarse IMCs particles. The S phase is associated with pitting nucleation [17] and some mechanisms have been proposed in the literature [18]. According to Moreto, et al. [19] the AA2524-T3 aluminium alloy presents two types of coarse intermetallics particles (Al-Cu-Fe-Mn) and incoherent S (Al2CuMg) precipitates, which are also found in AA2024-T3 alloys [9,20]. The corrosion behaviour of these intermetallic particles has been largely investigated in the literature [17,21,22,23,24,25,26,27]. The effect of coarse Al-Cu-Mg IMCs on the localized corrosion behaviour of the AA2024-T3 alloy has been investigated by Buchheit, et al. [17] and Zhu, et al. [28]. Both authors [17,28] have noticed that this phase is an anodic site, favouring pitting nucleation. According to the literature [17,24], at an initial stage, anodic dissolution occurs on S phase particles. During this period, the Mg is preferentially oxidized, resulting in Cu-rich remnants. This leads to potential change into the nobler direction, promoting anodic dissolution of the alloy matrix at its neighbouring boundary. Zhu, et al. [28] proposed a “cathodic corrosion” mechanism to explain the localized corrosion in 2XXX alloys, which was in disagreement with Buchheit’s proposal [17]. According to Zhu, et al. [28], during the anodic reaction of S phase particles, cathodic reactions of water and/or oxygen reduction occur at the neighbouring sites of the matrix, generating hydroxyl ions (OH) [28]. Accordingly, local alkalization occurs around the S phase remnant and, once the local pH exceeds 9, chemical dissolution of the surrounding aluminium oxide layer takes place. Subsequently, the bare aluminium matrix would be oxidized to form a new oxide layer. On the other hand, the Al-Cu-Fe-Mn IMCs are usually cathodic sites, which are more stable and have less effect on the AA2024-T3 alloy’s corrosion resistance than the Al-Cu-Mg ones [25,29,30,31,32].
Very few studies can be found concerning AA2524 [4,33,34,35,36,37], and only a few studies compare this alloy to the AA2024, focusing on its mechanical properties [2,38]. Although it is generally accepted that the localized corrosion caused by the IMCs is the nucleation site for other types of corrosion in high strength Al alloys [23,24], the role of the IMCs on these alloys’ corrosion initiation has not been well established yet. This is mainly due to their small size, their chemical and microstructural complexity, and the dependence of reactivity to the environment [24]. This paper aims to evaluate the corrosion resistances of both AA2024 and AA2524, to compare the results, and to correlate them with their microstructure.

2. Materials and Methods

The materials studied in this work were the AA2524-T3 and the AA2024-T3 alloys produced by ALCOA, both provided as 1.6 mm sheets. Their chemical compositions are shown in Table 1 and their main mechanical and corrosion properties are shown in Table 2. The AA2524-T3 alloy has lower amounts of Fe and Si, which are considered as deleterious to the corrosion resistance, and a narrower range for the main alloying elements Cu and Mg [32].
Samples of 400 mm2 were cut from the sheets. Their surfaces were prepared by grinding them with silicon carbide paper up to # 4000, followed by polishing with a diamond paste (up to 0.25 µm) to a mirror surface, degreasing in ethyl alcohol, washing with deionized water, and drying under a hot air stream. The corrosion resistance of both aluminium alloys was monitored in 0.01 mol L−1 NaCl as a function of exposure time by immersion tests and electrochemical impedance spectroscopy (EIS).
Experiments were performed using a Solartron 1287 electrochemical interface coupled to a Solartron 1260 frequency response analyser (FRA), which was used to obtain the electrochemical impedance spectroscopy (EIS) diagrams. The perturbation range was 20 mV (rms). The acquisition rate was 10 points per decade in a frequency range from 10 mHz to 100 kHz for all samples. The electrochemical tests were performed using a three-electrode setup configuration with the aluminium alloys as working electrodes and an exposed area of 1.0 cm2 (Figure 1). The reference electrode used was an Ag/AgCl, 3 mol L−1 KCl, and a platinum wire was employed as an auxiliary electrode. The electrochemical experiments were carried out in naturally aerated solution at room temperature. Each test was performed six times to ensure their reproducibility.
The microstructures of the aluminium alloys were analyzed by a Field Emission Gun Scanning Electron Microscope FEI Quanta 650 (FEG–SEM) prior and after different exposure periods to the test electrolyte.

3. Results and Discussion

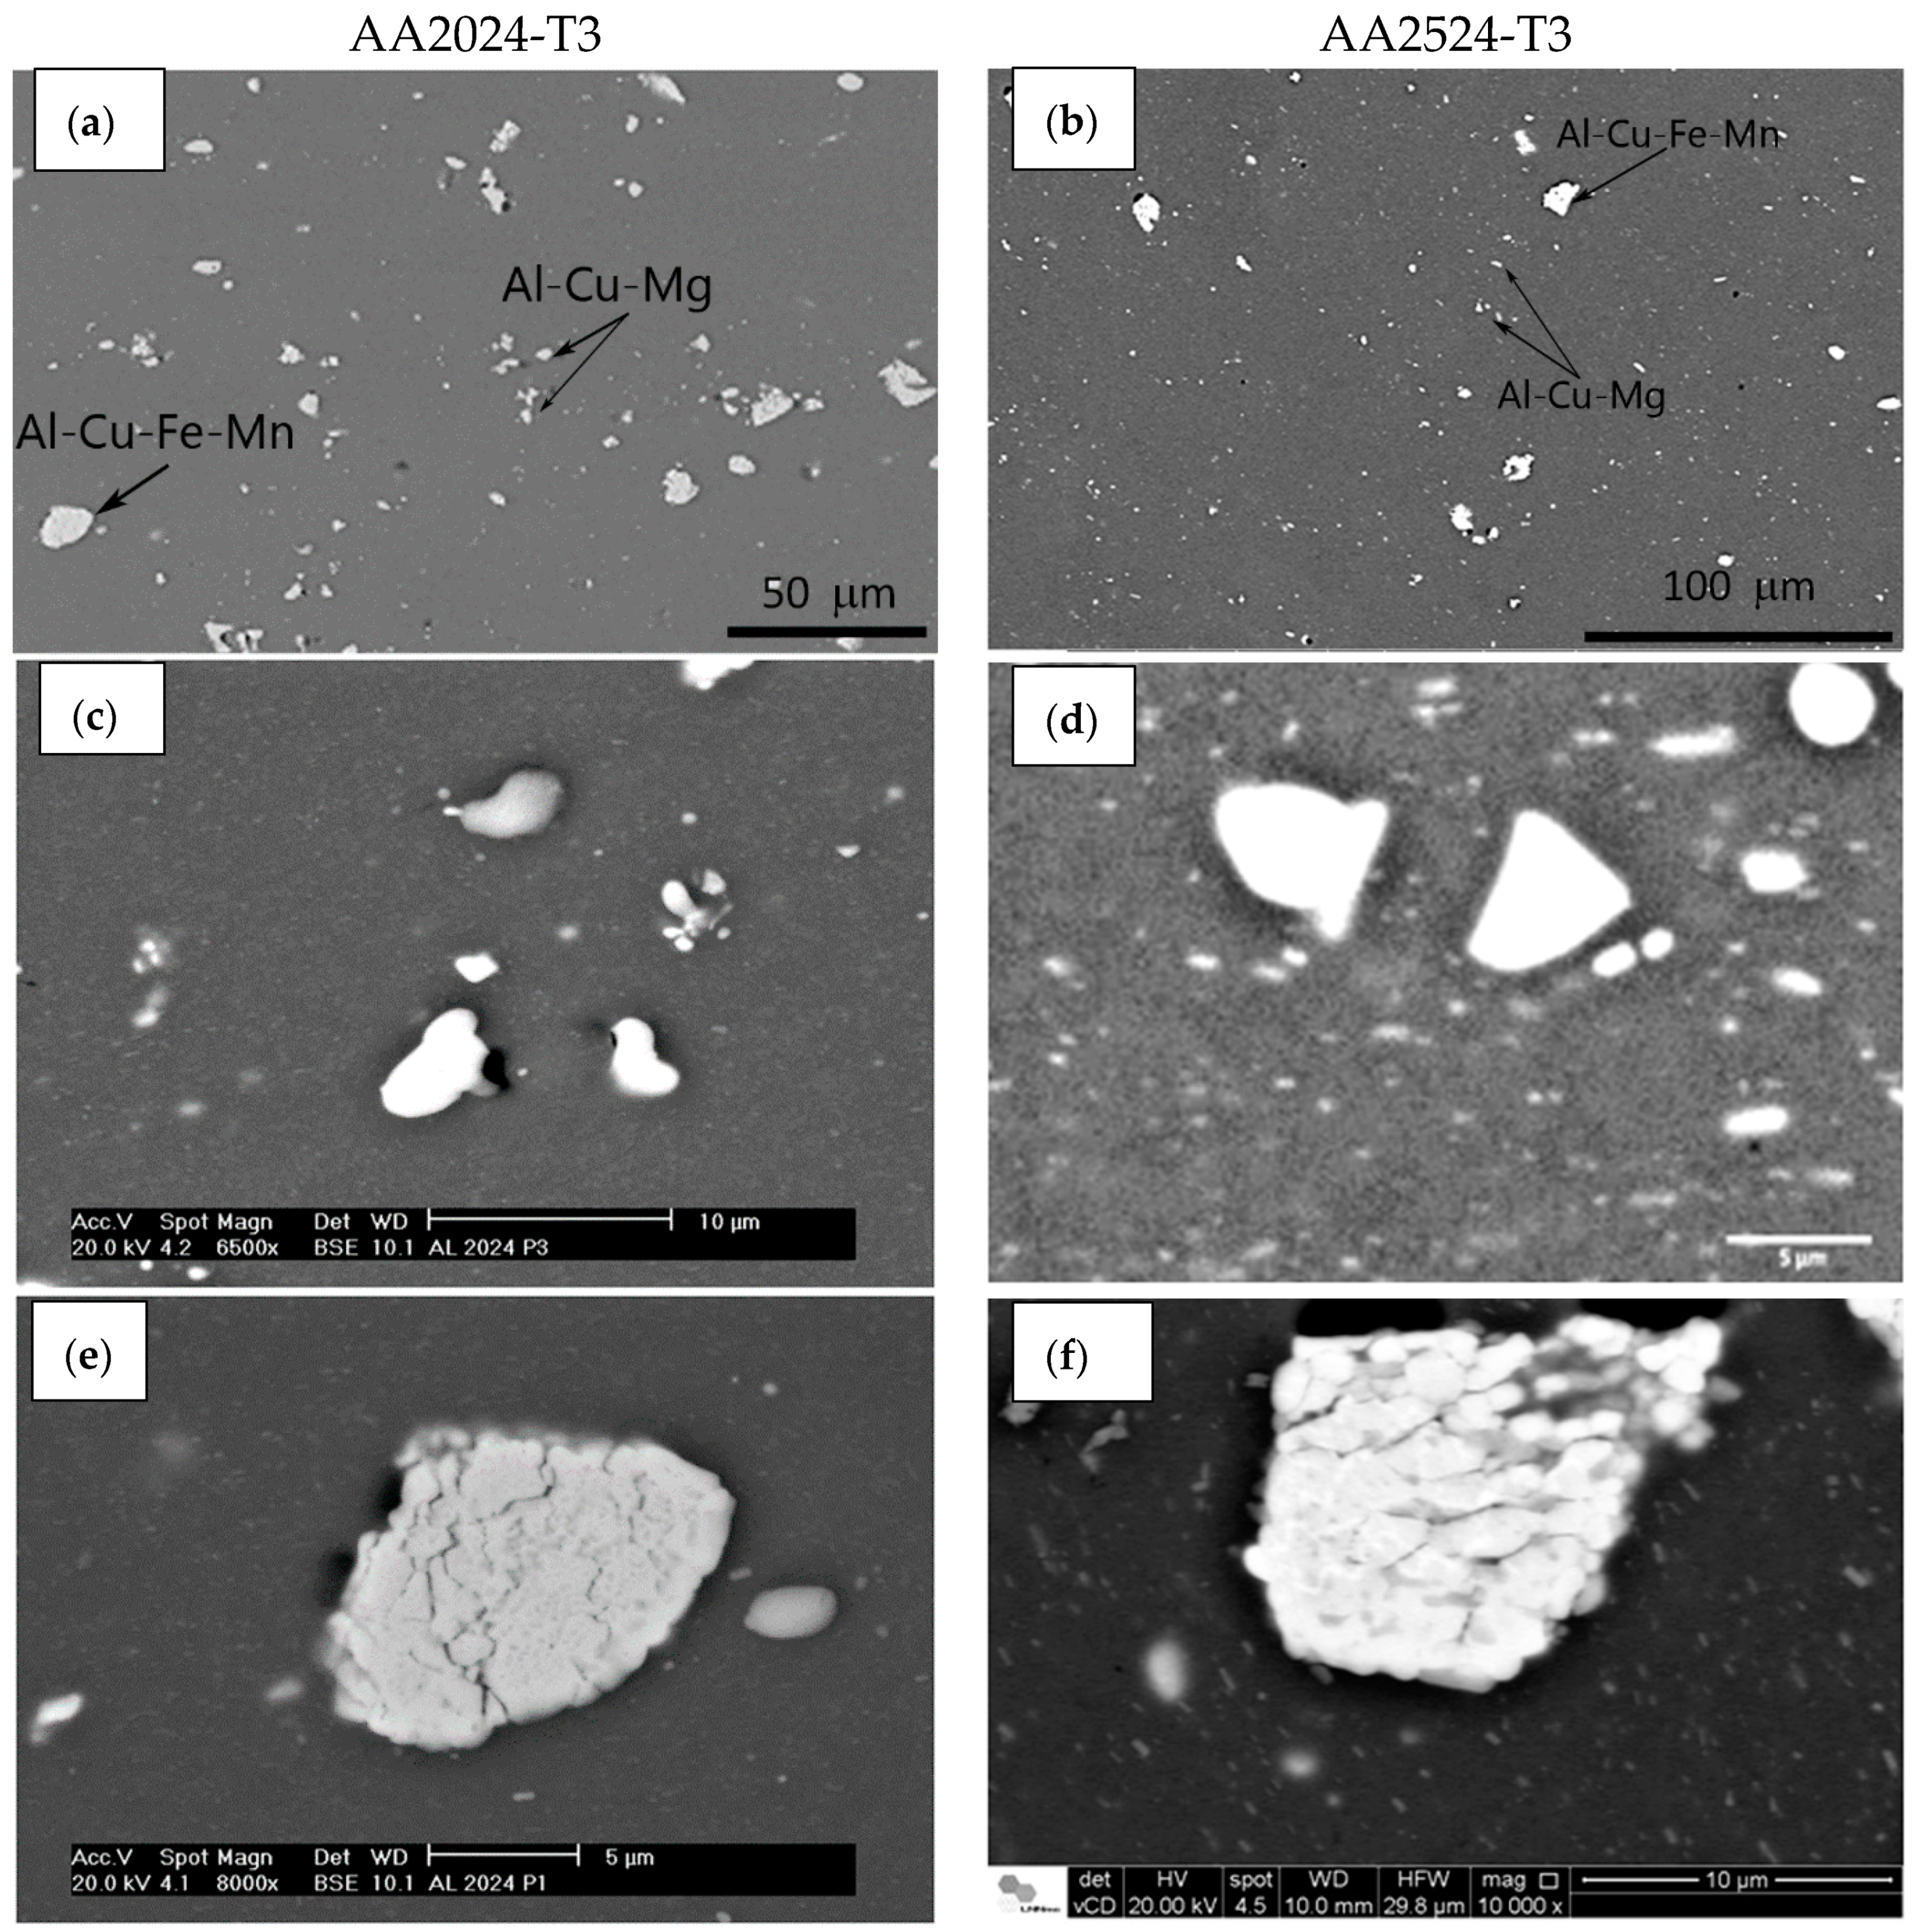
The surface of both the AA2024-T3 and AA2524-T3 alloys were observed by SEM after 2 h exposure to the 0.01 mol.L−1 NaCl solution. A general view of the microstructures of the AA2024-T3 and AA2524-T3 alloys are shown in Figure 2a,b, respectively (both in an as-received condition). The two main types of coarse IMCs particles (Al-Cu-Mg (Figure 2c,d) and Al-Cu-Mn-Fe-(Si) (Figure 2e,f)) were identified by EDX, and they are in agreement with the literature [9,10,19]. However, in the AA2524-T3 alloy, the Al-Cu-Mn-Fe-(Si) particles were present in a lower amount and with different morphologies from those found in the AA2024-T3 alloy, whereas the Al-Cu-Mg are more numerous, smaller, and more uniformly distributed. The AA2024-T3 alloy is characterized by a smaller number of IMCs, which, however, are generally larger than those found in the AA2024-T3 alloy (Figure 3). Consequently, the area fraction of the AA2024-T3 IMC’s is higher than the AA2524-T3 (Table 3).
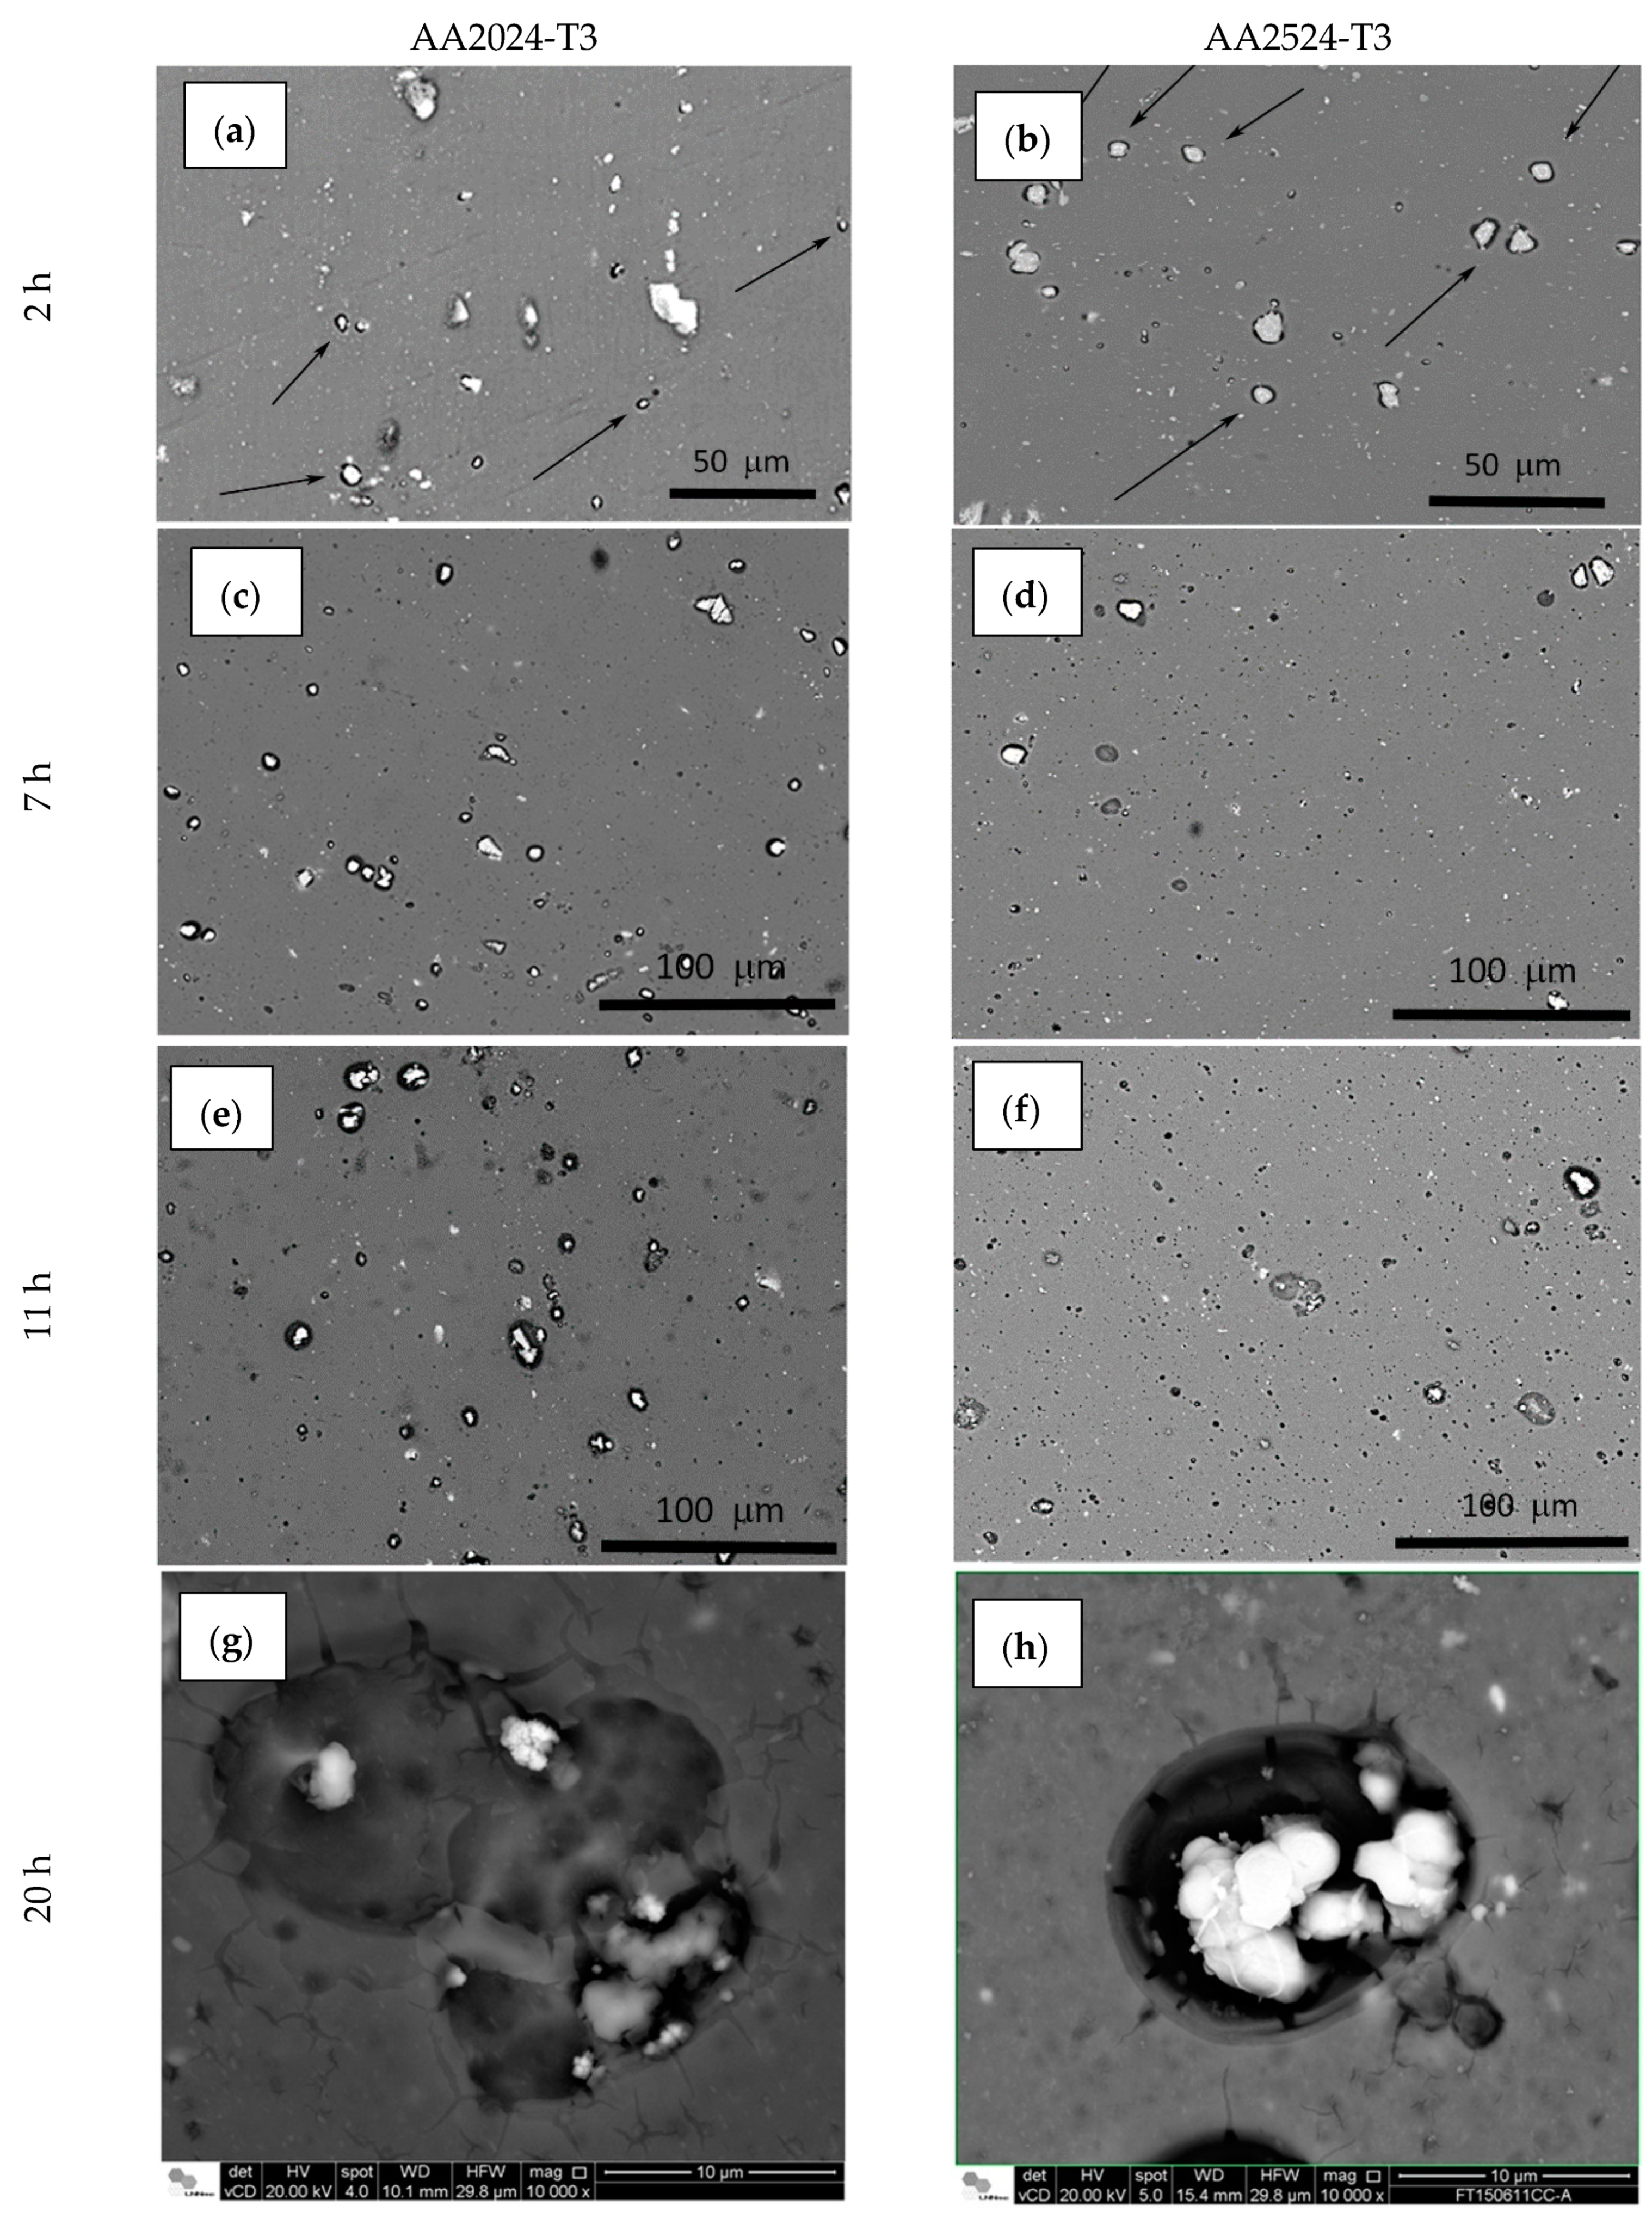
The general analysis of the micrographs (Figure 4) show that the corrosive attack is more evenly distributed on the AA2524-T3 alloy (Figure 4b), whereas for the AA2024-T3 alloy (Figure 4a) it is mainly concentrated around larger IMCs, including the dark areas around the bigger Al-Cu-Mg precipitates (indicated by arrows). On both alloys, the Al-Cu-Mn-Fe precipitates showed a rather random behaviour with some of them remaining intact after 2 h of immersion, likely due to a protective oxide film that hinder the cathodic reaction, as suggested by Birbilis, et al. [12] (Figure 4a,b).
After 7 h of testing of the AA2024-T3 alloy, the corrosive attack was mainly concentrated at the interface between the matrix and the larger intermetallic particles. No localized corrosion at the grain boundaries was detected. (Figure 4c). Figure 4d shows that most of the smaller precipitates had been removed from the surface of the AA2524-T3 sample by the corrosive attack, resulting in a “cleaner” surface in comparison with 2 h of test, even though some local activity remained around large IMCs. On the other hand, the corrosive attack of the AA2024-T3 continued to be mainly concentrated at the interface between the matrix and the larger intermetallic particles (Figure 4c), which, as previously showed, were more numerous in this material. For longer immersion times the “cleaning” effect on the AA2524-T3 surface is even more pronounced than that of the AA2024-T3 (Figure 4f,e, respectively).
After 11 h of exposure to the test electrolyte, most of the small precipitates were removed from the surface of both alloys (Figure 4e,f). Additionally, Figure 4g,h show the selective attack near the IMCs for longer exposure periods.
The results showed that IMCs’ area fraction of the AA2524-T3 is lower in comparison with the AA2024-T3. More than 94% of these IMCs of the first alloy are smaller than 10 µm, and only 82% of the latter, confirming the theory that the corrosion attack on the AA2524-T3 alloy surface was faster due to its larger number of small particles.
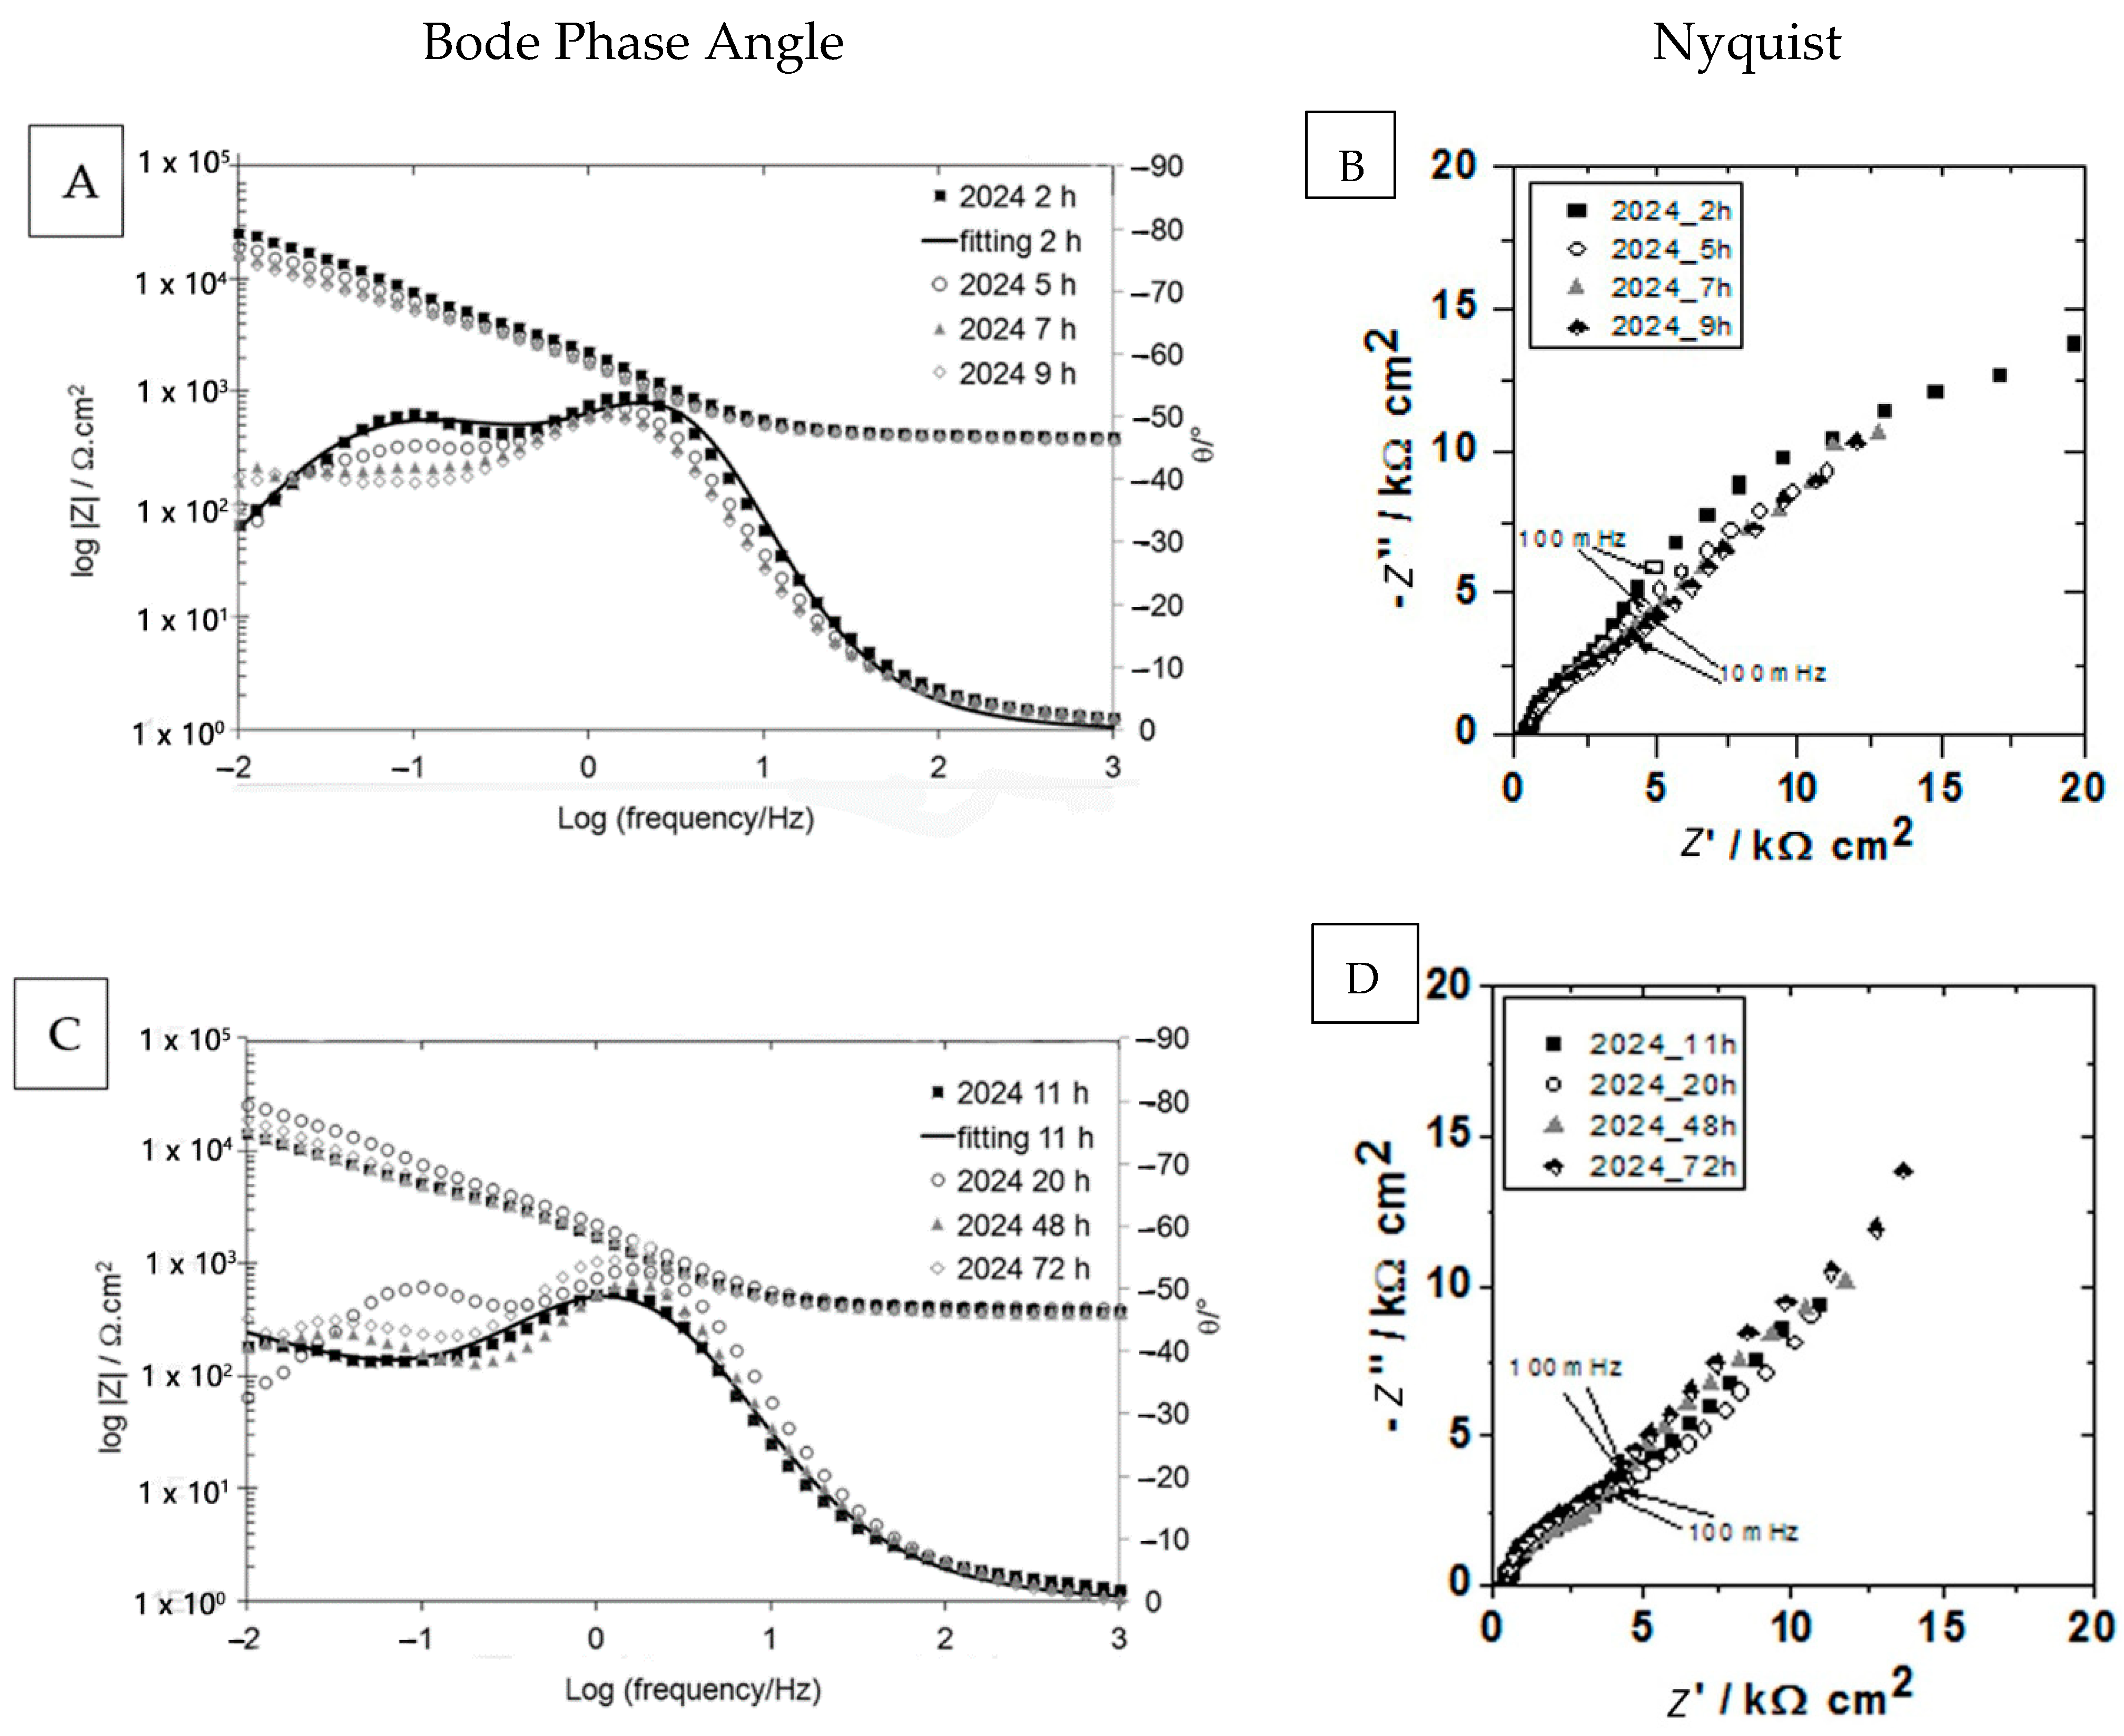
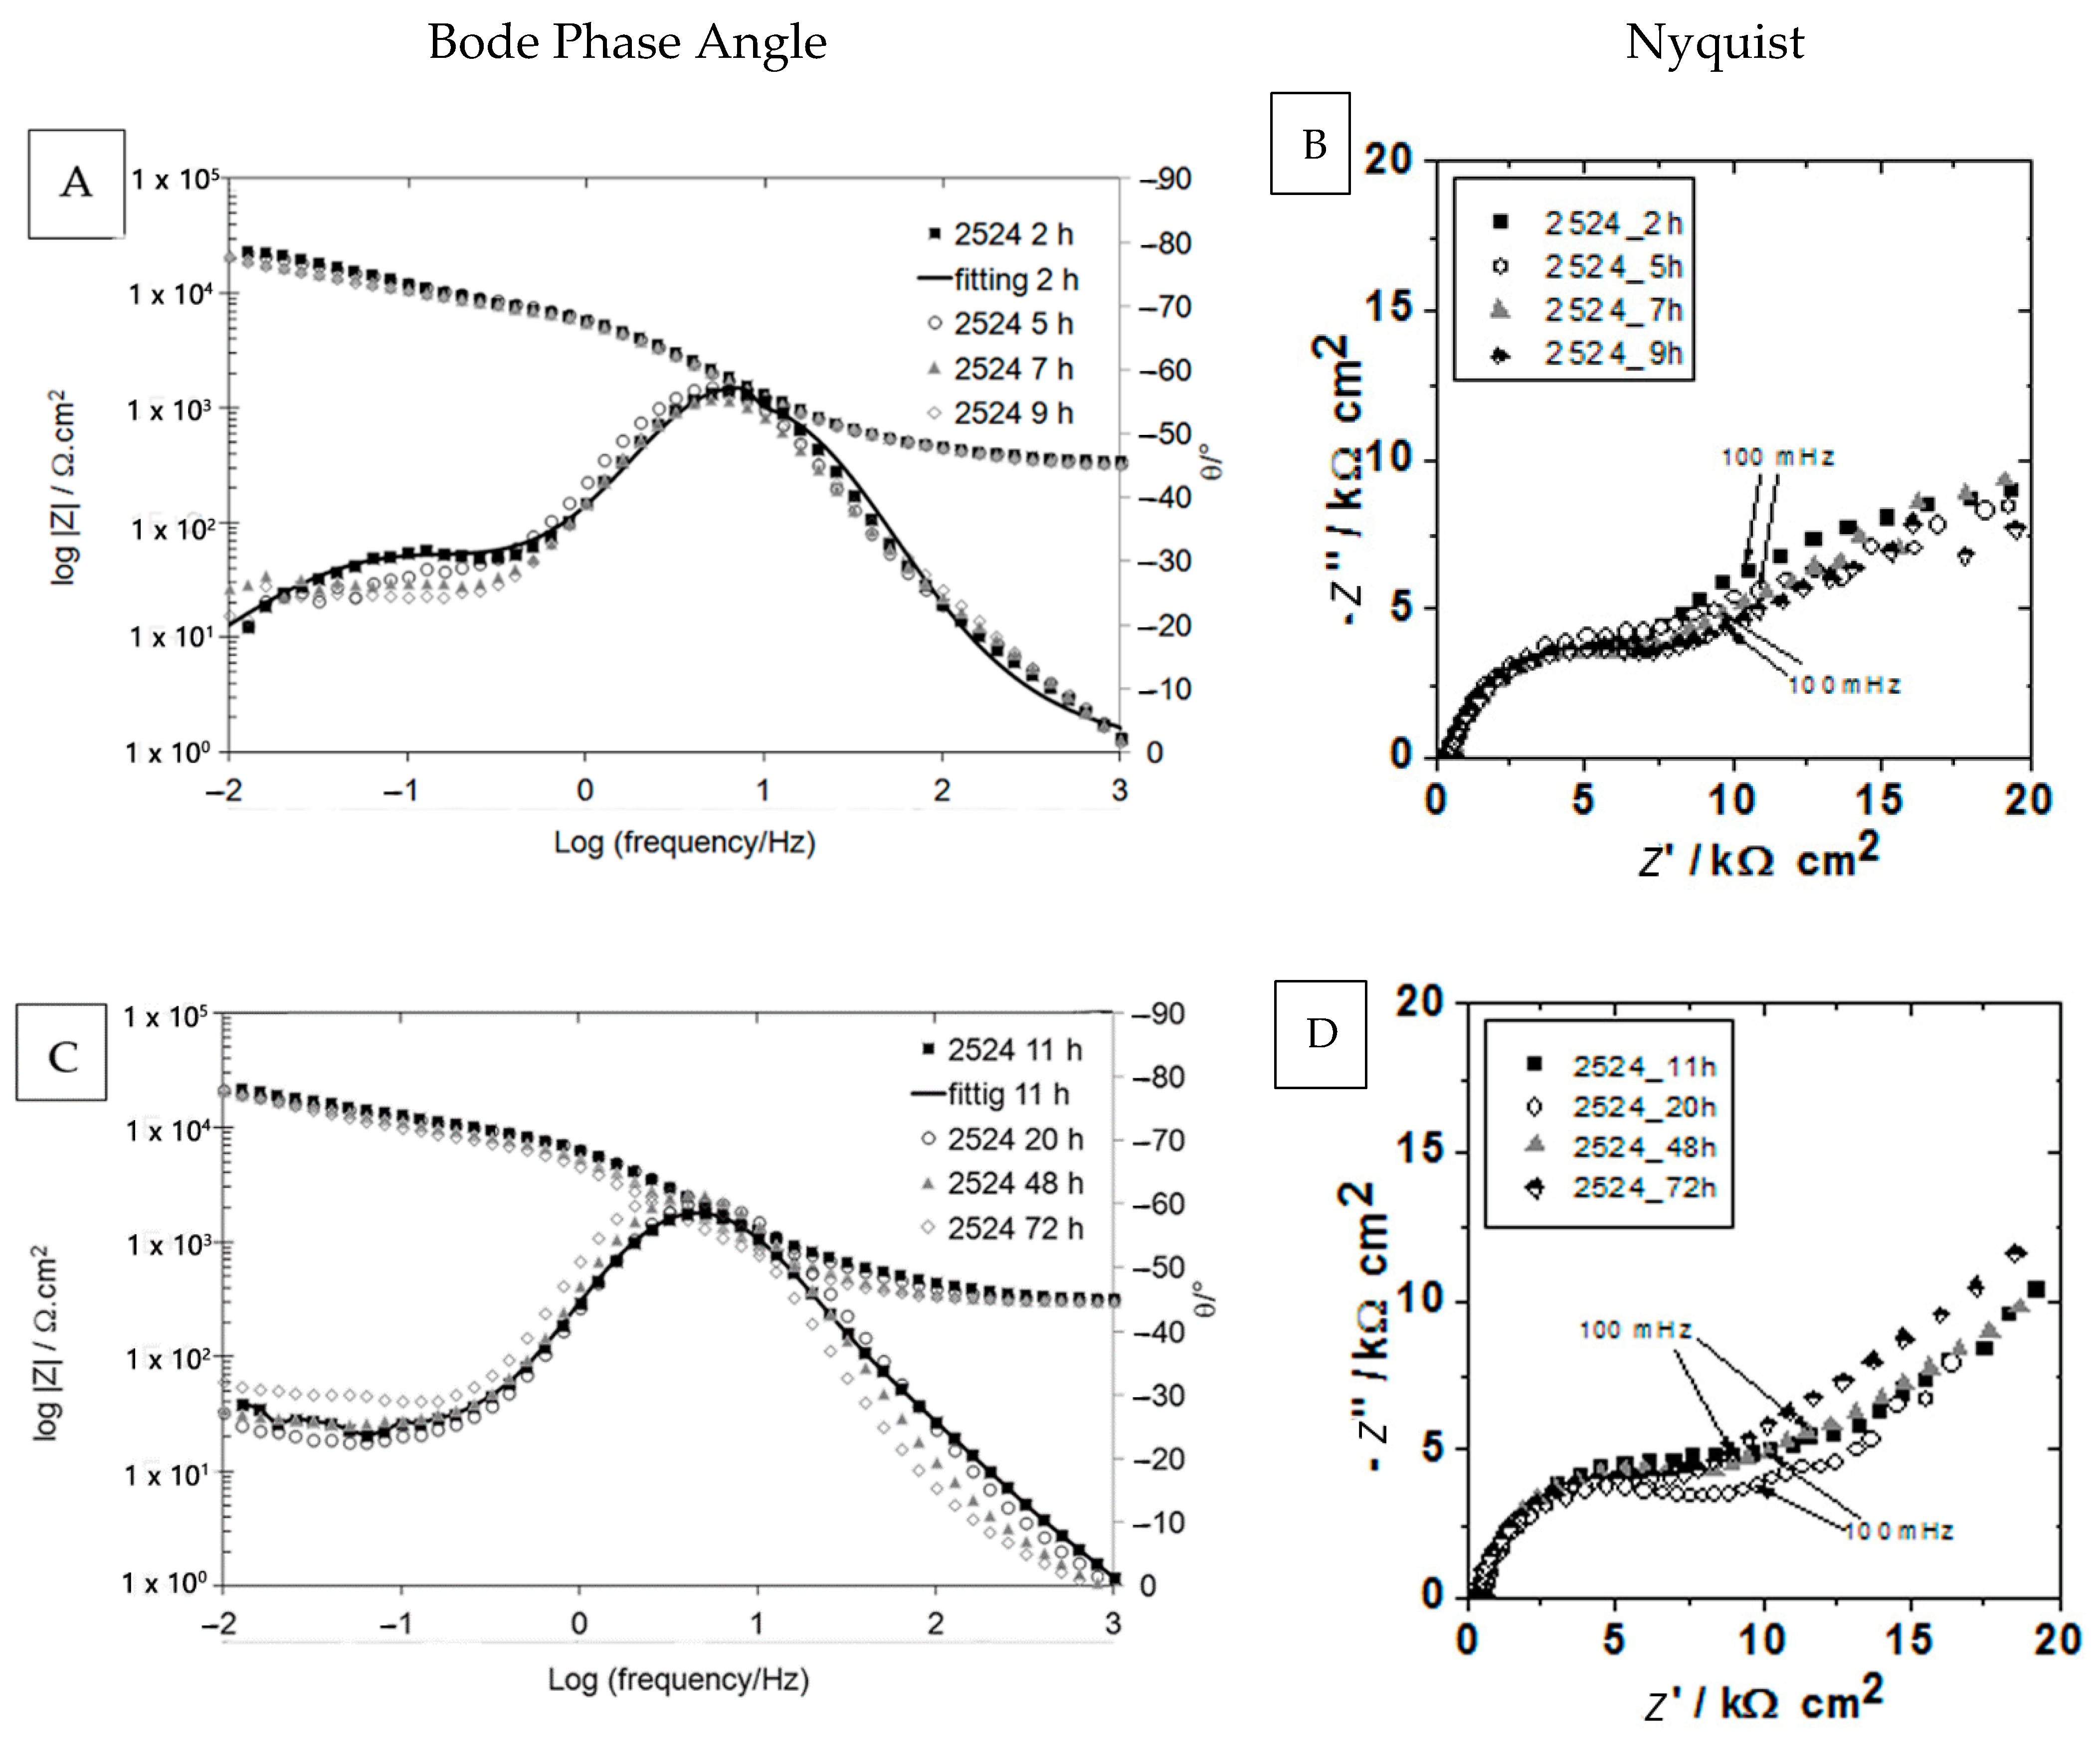
The corrosion resistance of both alloys was also evaluated by EIS with immersion time and the results are shown in Figure 5 and Figure 6. It is clearly seen that the impedance modulus associated with the AA2524-T3 alloy was higher than that of the AA2024-T3 during the whole test period. Independently of the alloy brand, EIS diagrams are characterized by a broad high frequency depressed capacitive loop followed by a low frequency capacitive loop that evolves to a diffusion-controlled process after 11 h of exposure to the test electrolyte.
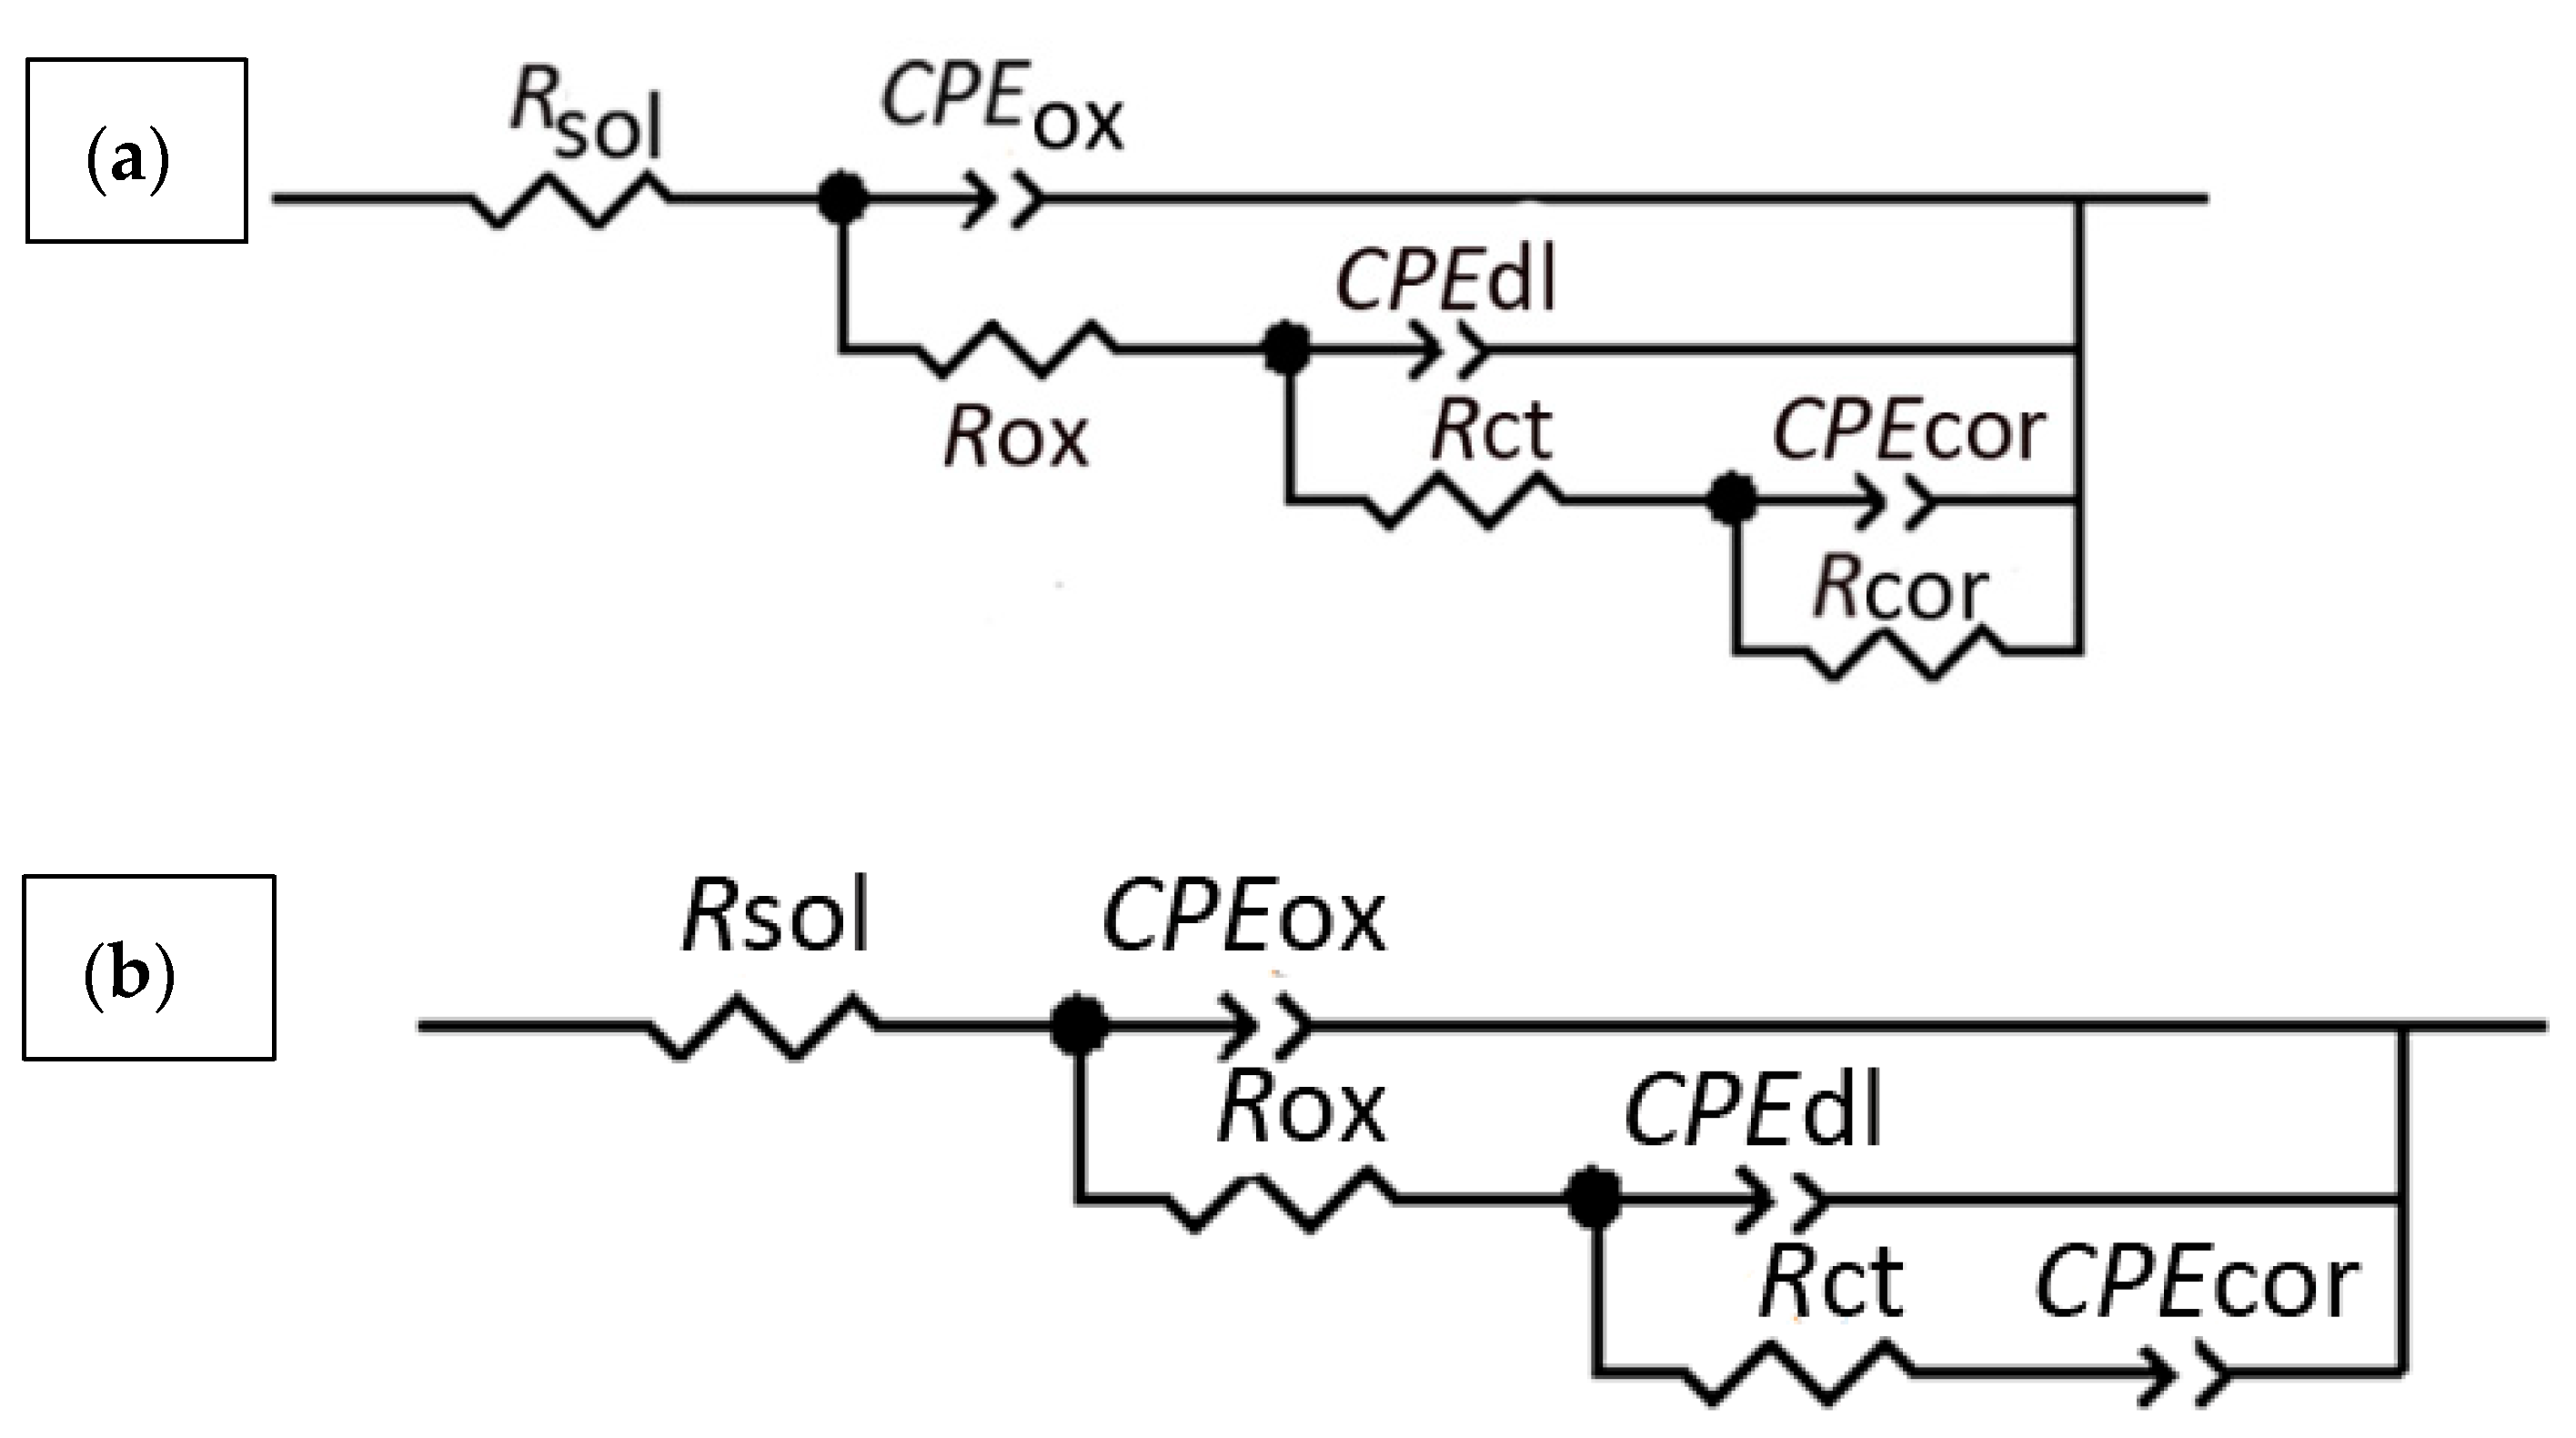
The EIS results for both alloys were fitted with the two/three-time constants equivalent electric circuits (EEC) shown in Figure 7. These ECC have been established in the literature on aluminium alloys EIS fittings and were also tested in previous works from our research group [9,44,45,46]. Table 4 presents the parameters obtained from the equivalent electrical circuit fitted to the AA2024-T3 and AA2524-T3 EIS data. The EEC of Figure 7a was used to fit the data acquired from the first hour until 9 h of immersion, whereas the diagrams obtained from 11 h until the end of the test were fitted with the EEC of Figure 7b. In this latter case, the low frequency R//CPE element was substituted for a single CPE, meant to simulate a diffusion-controlled process. According to Campestrini, et al. [47], when the resistance associated with the diffusion becomes very large the R//CPE element may be replaced by a simple CPE element with the exponent “α” value of 0.5, which, in an ideal situation, is represented by a Warburg element. In the proposed circuits the pair Rox//CPEox stands for the capacitance of the oxide film in parallel with conductive pathways associated with defective sites created by the IMCs, which leads to the unprotected metal surface. Rct//CPEdl refers to the charge transfer resistance coupled to the charging of the double layer, whereas CPEcor//Rcor is ascribed to the low frequency corrosion processes that kinetically control the alloys’ deterioration, which gradually evolves to a diffusion-controlled process and is likely associated with the oxygen reduction reaction taking place in nobler IMCs.
Table 4 shows the evolution of the Rox//CPEox values. For both alloys, CPEox increased with exposure time. SEM analysis has shown that as the corrosive attack proceeded, holes were formed in the samples surface as a result of the dissolution/detachment of the IMCs particles increasing the effective area exposed to the electrolyte [10]. If pits did not progress in these regions, a fresh oxide layer was formed. However, it should be more defective. Both facts contribute to capacitance increase. In addition, from the beginning of the exposure period, and during the whole test, CPEox was smaller for AA2524-T3, indicating the presence of a thicker oxide layer in this alloy, in agreement with the results from previous studies in the literature [46,48].
Concerning Rox, Table 4, it also increased with immersion time, indicating that electrochemically active sites on both alloys’ surfaces become less numerous and/or were less easily reachable. As already demonstrated in the SEM analysis (Figure 4), the selective attack near the IMCs results in surface “cleaning”, leading to a lower number of active sites. In addition, deposition of corrosion products was frequently found above large IMCs. These features would hinder the access of aggressive species to the matrix surface and can contribute to the Rox increase. Accordingly, as the surface of AA2524-T3 progressively became “cleaner” than AA2024-T3, the rate of the Rox increase was much faster for the former alloy. Therefore, it is proposed that the attack of the small particles and their removal from surface are the main reasons for the Rox increase, as this reduces the number of defective sites where electrochemical reactions could take place. However, blocking of active site by aluminium hydroxide precipitation may also have contributed to the Rox increase.
As mentioned earlier, the Rct//CPEdl pair is associated with the charge transfer reactions (Rct) occurring at the interface of the matrix at the defective sites of the oxide (near active IMCs). The evolution for the components Rct and CPEdl with exposure time to the 0.01 mol L−1 NaCl electrolyte is shown in Table 4. For AA2524-T3, Rct behaviour was significantly oscillating during the whole immersion period, which must has been a consequence of the detachment and outbreak of new IMCs as corrosion proceeded. For this sample, CPEdl remained almost constant during the first 15 h, indicating that the electrochemically active surface area remained almost unchanged. However, from this period onwards the decrease in CPEdl might be attributed to the formation of corrosion products on some active areas, clearly indicated on the AA2524-T3 surface, that partially blocked these sites.
Conversely, for AA2024-T3, after up to 40 h of testing, Rct decreased continuously. This tendency may be explained by the enrichment in the more noble components of the remaining active IMCs. Therefore, even though in smaller number, due to detachment, enhanced galvanic activity would be expected between the matrix and the Cu-enriched IMCs. For longer immersion periods, an increase of Rct was observed. This can be ascribed to the precipitation of corrosion products above the IMCs and their vicinity, which provided a barrier between the electrolyte and the metallic surface. Accordingly, CPEdl initially increased, indicating that the electrochemically active surface augmented. However, for longer exposure times, it started to decrease due to active surface area reduction as corrosion products precipitated.
Finally, the low frequency time constant, corresponding to the rate-controlling step of the corrosion process, was mainly represented by CPEcor and its “αcor”, and Rcor were important only up to nine hours of exposure. During the initial immersion period, αcor values ranged between 0.69 and 0.83, suggesting a mixed controlled process for both alloys, corresponding to the period where the EIS diagrams were fitted with the EEC of Figure 6. For longer immersion times, “αcor” varied between 0.4 and 0.6, showing the main contribution of diffusive processes likely through the precipitated corrosion products.
Higher capacitance values were associated with the AA2024-T3 alloy comparatively to the AA2524-T3 (Table 4) after the first hour of immersion, although there was much larger variation in the CPEcor values for this latter alloy, likely due to the stronger contribution of partially soluble corrosion products on active sites at its surface which were periodically removed.
The electrochemical results demonstrated that the corrosion resistance of the AA2524-T3 was higher than the AA2024-T3.

4. Conclusions

In this study, the corrosion resistances of the AA2024-T3 and the AA2524-T3 alloys were compared. The differences between these alloys are the number and the precipitates’ area fraction. The AA2024-T3 alloy has a smaller number of IMCs, which, however, are larger than those found in the AA2524-T3 alloy. Therefore, the IMCs area fraction of the former is higher than the latter. The SEM results suggest that the rapid removal of active sites from the AA2524-T3 surface (smaller IMCs) promotes a cleaner surface.
The hypothesis that defective areas prone to electrochemical reactions were removed from AA2524-T3 was confirmed by the EEC fitting to EIS results, as AA2524 Rox increases and CPEox decreases with immersion time. Additionally, the corrosion process of AA2524, represented by CPEcor, “αcor” and Rcor, are significant only up to nine hours of exposure and confirm the higher contribution of active sites of the surface, caused by partially soluble corrosion products.
The electrochemical tests also showed that the localized corrosion resistance of the AA2524-T3 was higher than the AA2024-T3 during the whole test period. This was indicated by the higher impedance values associated with the first alloy and confirmed by surface observation after various immersion periods in the tested electrolyte. On the other hand, SEM analysis showed that the corrosion attack on the AA2524-T3 alloy surface was faster due to its larger number of small particles.

Author Contributions

Conceptualization, I.C. and H.G.d.M.; methodology, F.M.Q. and M.T.; validation, I.C. and H.G.d.M.; formal analysis, F.M.Q. and M.T.; investigation, F.M.Q., M.T. and A.F.S.B.; writing—original draft preparation, M.T. and A.F.S.B.; writing—review and editing, M.T. and A.F.S.B.; visualization, I.C. and H.G.d.M.; supervision, I.C.; project administration, I.C.; funding acquisition, I.C. All authors have read and agreed to the published version of the manuscript.

Funding

This research was funded by CNPq, grants number 400895/2014-5, 400781/2013-1 and 158764/2014-5 and CAPES, grant number 1536157.

Data Availability Statement

Not applicable.

Acknowledgments

The authors acknowledge CNPq and CAPES.

Conflicts of Interest

The authors declare no conflict of interest.

References

  1. Chen, Y.Q.; Pan, S.P.; Zhou, M.Z.; Yi, D.Q.; Xu, D.Z.; Xu, Y.F. Effects of inclusions, grain boundaries and grain orientations on the fatigue crack initiation and propagation behavior of 2524-T3 Al alloy. Mater. Sci. Eng. A 2013, 580, 150–158. [Google Scholar] [CrossRef]
  2. Golden, P. A comparison of fatigue crack formation at holes in 2024-T3 and 2524-T3 aluminum alloy specimens. Int. J. Fatigue 1999, 21, 211–219. [Google Scholar] [CrossRef]
  3. Bonzom, R.; Oltra, R. Droplet cell investigation of intergranular corrosion on AA2024. Electrochem. Commun. 2017, 81, 84–87. [Google Scholar] [CrossRef]
  4. Moreto, J.A.; Broday, E.E.; Rossino, L.S.; Fernandes, J.C.S.; Bose Filho, W.W. Effect of localized corrosion on fatigue–crack growth in 2524-T3 and 2198-T851 aluminum alloys used as aircraft materials. J. Mater. Eng. Perform. 2018, 27, 1917–1926. [Google Scholar] [CrossRef]
  5. Queiroz, F.M.; Donatus, U.; Prada Ramirez, O.M.; de Sousa Araujo, J.V.; Gonçalves de Viveiros, B.V.; Lamaka, S.; Zheludkevich, M.; Masoumi, M.; Vivier, V.; Costa, I.; et al. Effect of unequal levels of deformation and fragmentation on the electrochemical response of friction stir welded AA2024-T3 alloy. Electrochim. Acta 2019, 313, 271–281. [Google Scholar] [CrossRef]
  6. Cabrini, M.; Bocchi, S.; D’Urso, G.; Giardini, C.; Lorenzi, S.; Testa, C.; Pastore, T. Stress corrosion cracking of friction stir-welded AA-2024 T3 alloy. Materials 2020, 13, 2610. [Google Scholar] [CrossRef] [PubMed]
  7. Nisancioglu, K. Corrosion of aluminium alloys. In Proceedings of the 3rd International Conference on Aluminium Alloys, Trondheim, Norway, 25–29 October 1992; p. 239. [Google Scholar]
  8. Milagre, M.X.; Donatus, U.; Machado, C.S.C.; Araujo, J.V.S.; da Silva, R.M.P.; de Viveiros, B.V.G.; Astarita, A.; Costa, I. Comparison of the corrosion resistance of an Al–Cu alloy and an Al–Cu–Li alloy. Corros. Eng. Sci. Technol. 2019, 54, 402–412. [Google Scholar] [CrossRef]
  9. Queiroz, F.M.; Magnani, M.; Costa, I.; de Melo, H.G. Investigation of the corrosion behaviour of AA 2024-T3 in low concentrated chloride media. Corros. Sci. 2008, 50, 2646–2657. [Google Scholar] [CrossRef]
  10. Queiroz, F.M. Estudo Do Comportamento de Corrosão Dos Intermetálicos Presentes Na Liga Aa2024-T3, Por Meio De Técnicas De Microscopia Associadas A Técnicas Eletroquímicas. Ph.D. Thesis, Universidade de São Paulo, São Paulo, Brazil, 2008. [Google Scholar]
  11. Murer, N.; Buchheit, R.G. Stochastic modeling of pitting corrosion in aluminum alloys. Corros. Sci. 2013, 69, 139–148. [Google Scholar] [CrossRef]
  12. Birbilis, N.; Cavanaugh, M.K.; Buchheit, R.G. Electrochemical behavior and localized corrosion associated with Al7Cu2Fe particles in aluminum alloy 7075-T651. Corros. Sci. 2006, 48, 4202–4215. [Google Scholar] [CrossRef]
  13. Bousquet, E. Durabilité des Assemblages Soudès par Friction Stir Welding (FSW). Ph.D. Thesis, L’Université de Bordeaux, Bordeaux, France, 2011. [Google Scholar]
  14. Jariyaboon, M.; Davenport, A.J.; Ambat, R.; Connolly, B.J.; Williams, S.W.; Price, D.A. The effect of welding parameters on the corrosion behaviour of friction stir welded AA2024-T351. Corros. Sci. 2007, 49, 877–909. [Google Scholar] [CrossRef]
  15. Paglia, C.S.; Buchheit, R.G. A look in the corrosion of aluminum alloy friction stir welds. Scr. Mater. 2008, 58, 383–387. [Google Scholar] [CrossRef]
  16. Zhou, X.; Luo, C.; Hashimoto, T.; Hughes, A.E.; Thompson, G.E. Study of localized corrosion in AA2024 aluminium alloy using electron tomography. Corros. Sci. 2012, 58, 299–306. [Google Scholar] [CrossRef]
  17. Buchheit, R.G.; Grant, R.P.; Hlava, P.F.; Mckenzie, B.; Zender, G.L. Local dissolution phenomena associated with s phase  (al2cumg)  particles in aluminum alloy 2024-T3. J. Electrochem. Soc. 1997, 144, 2621–2628. [Google Scholar] [CrossRef]
  18. Li, J.F.; Ziqiao, Z.; Na, J.; Chengyu, T. Localized corrosion mechanism of 2×××-series Al alloy containing S(Al2CuMg) and θ′(Al2Cu) precipitates in 4.0% NaCl solution at pH 6.1. Mater. Chem. Phys. 2005, 91, 325–329. [Google Scholar] [CrossRef]
  19. Moreto, J.; Gamboni, O.; Rocha, L. Corrosion behavior of Al and Al-Li alloys used as aircraft materials. Corrosão Protecção Mater. 2012, 31, 60–64. [Google Scholar]
  20. Bugarin, A.F.S.; De Abreu, C..; Terada, M.; De Melo, H.G.; Costa, I. Effect of friction stir welding (FSW) on the electrochemical behavior and galvanic coupling of AA2024-T3 and AA7475-T651. Mater. Today Commun. 2020, 25, 101591. [Google Scholar] [CrossRef]
  21. Buchheit, R.G. A compilation of corrosion potentials reported for intermetallic phases in aluminum alloys. J. Electrochem. Soc. 1995, 142, 3994–3996. [Google Scholar] [CrossRef]
  22. Buchheit, R.; Boger, R.; Carroll, M.; Leard, R.; Paglia, C.; Searles, J. The electrochemistry of intermetallic particles and localized corrosion in Al alloys. JOM 2001, 53, 29–33. [Google Scholar] [CrossRef]
  23. Blanc, C.; Lavelle, B.; Mankowski, G. The role of precipitates enriched with copper on the susceptibility to pitting corrosion of the 2024 aluminium alloy. Corros. Sci. 1997, 39, 495–510. [Google Scholar] [CrossRef]
  24. Blanc, C.; Gastaud, S.; Mankowski, G. Mechanistic studies of the corrosion of 2024 aluminum alloy in nitrate solutions. J. Electrochem. Soc. 2003, 150, B396. [Google Scholar] [CrossRef]
  25. Campestrini, P.; Terryn, H.; Hovestad, A.; de Wit, J.H.W. Formation of a cerium-based conversion coating on AA2024: Relationship with the microstructure. Surf. Coat. Technol. 2004, 176, 365–381. [Google Scholar] [CrossRef]
  26. Leard, R.R.; Buchheit, R.G. Electrochemical characterization of copper-bearing intermetallic compounds and localized corrosion of Al-Cu-Mg-Mn alloy 2024. Mater. Sci. Forum 2002, 396–402, 1491–1496. [Google Scholar] [CrossRef]
  27. Obispo, H.M.; Murr, L.E.; Arrowood, R.M.; Trillo, E.A. Copper deposition during the corrosion of aluminum alloy 2024 in sodium chloride solutions. J. Mater. Sci. 2000, 35, 3479–3495. [Google Scholar] [CrossRef]
  28. Zhu, D.; van Ooij, W.J. Corrosion protection of AA 2024-T3 by bis-[3-(triethoxysilyl) propyl]tetrasulfide in sodium chloride solution. Part 2: Mechanism for corrosion protection. Corros. Sci. 2003, 45, 2177–2197. [Google Scholar] [CrossRef]
  29. Schneider, O.; Ilevbare, G.O.; Scully, J.R.; Kelly, R.G. In situ confocal laser scanning microscopy of aa 2024-t3 corrosion metrology. J. Electrochem. Soc. 2004, 151, B465. [Google Scholar] [CrossRef]
  30. Leblanc, P.; Frankel, G.S. A study of corrosion and pitting initiation of AA2024-T3 using atomic force microscopy. J. Electrochem. Soc. 2002, 149, B239. [Google Scholar] [CrossRef]
  31. Schmutz, P.; Frankel, G.S. Characterization of AA2024-T3 by scanning kelvin probe force microscopy. J. Electrochem. Soc. 1998, 145, 2285–2295. [Google Scholar] [CrossRef] [Green Version]
  32. Schmutz, P.; Frankel, G.S. Corrosion study of AA2024-T3 by scanning kelvin probe force microscopy and in situ atomic force microscopy scratching. J. Electrochem. Soc. 1998, 145, 2295–2306. [Google Scholar] [CrossRef] [Green Version]
  33. Li, Z.; Chen, L.J. Feature recognition of corrosion pit for pre-corroded AA 2524 and statistical analysis. In Advanced Materials Research; Trans Tech Publications Ltd.: Stafa-Zurich, Switzerland, 2014; Volume 906, pp. 263–267. [Google Scholar]
  34. Costenaro, H.; Lanzutti, A.; Paint, Y.; Fedrizzi, L.; Terada, M.; de Melo, H.G.; Olivier, M.-G. Corrosion resistance of 2524 Al alloy anodized in tartaric-sulphuric acid at different voltages and protected with a TEOS-GPTMS hybrid sol-gel coating. Surf. Coat. Technol. 2017, 324. [Google Scholar] [CrossRef]
  35. Guadagnin, H.C. Corrosion Resistance Study of AA2524 Anodized in Sulphuric-Tartaric Acid and Sealed with Hybrid Coatings. Ph.D. Thesis, Universidade de São Paulo, State of São Paulo, Brazil, 2017. [Google Scholar]
  36. Liu, C.; Liu, Y.; Li, S.; Ma, L.; Zhao, X.; Wang, Q. Effect of creep aging forming on the fatigue crack growth of an AA2524 alloy. Mater. Sci. Eng. A 2018, 725, 375–381. [Google Scholar] [CrossRef]
  37. Terada, M.; Queiroz, F.M.; Costenaro, H.; Olivier, M.; Costa, I.; Melo, H.G. The Effect of Cerium ( III ) on the Corrosion Protection Properties of the Film Formed on the Aa2524-T3 Alloy by Hydrothermal Treatments. In Proceedings of the European Corrosion Congress, Montpellier, France, 11–15 September 2016. [Google Scholar]
  38. Yang, B.; Yan, J.; Sutton, M.A.; Reynolds, A.P. Banded microstructure in AA2024-T351 and AA2524-T351 aluminum friction stir welds. Mater. Sci. Eng. A 2004, 364, 55–65. [Google Scholar] [CrossRef]
  39. The Aluminium Association. International Alloy. Designations and Chemical Composition Limits for Wrought Aluminum and Wrought Aluminum Alloys With Support for On-Line Access From:s Aluminum Extruders Council Use of the Information; The Aluminium Association: Arlington County, VA, USA, 2015. [Google Scholar]
  40. ASM Handbook Committee. ASM Handbook Volume 2 Properties and Selection: Nonferrous Alloys and Special-Purpose Materials; ASM International: Cleveland, OH, USA, 1993. [Google Scholar]
  41. Fontana, Á. Utilização de Polianilina Como Revestimento Protetor Contra Corrosão Das Ligas de Alumínio 2014 F, 2024 T3 e 7075 O. Master’s Degree, Universidade de São Paulo, São Paulo, Brazil, 2008. [Google Scholar]
  42. Moreto, J.A.; Gambonf, O.; Rucherf, C.O.F.T.; Romagnoli, F.; Moreira, M.F.; Beneduce, F.; Filho, W.W.B. Corrosion and fatigue behavior of new Al alloys. Procedia Eng. 2011, 10, 1521–1526. [Google Scholar] [CrossRef]
  43. Moreto, J.A. Estudo da Corrosão e Corrosão-Fadiga em Ligas de Al e Al–Li de Alta Resistência para Aplicação Aeronáutica. Ph.D. Thesis, Universidade de São Paulo, State of São Paulo, Brazil, 2012. [Google Scholar]
  44. Moreto, J.A.; dos Santos, M.S.; Ferreira, M.O.A.; Carvalho, G.S.; Gelamo, R.V.; Aoki, I.V.; Taryba, M.; Bose Filho, W.W.; Fernandes, J.C.S. Corrosion and corrosion-fatigue synergism on the base metal and nugget zone of the 2524-T3 Al alloy joined by FSW process. Corros. Sci. 2021, 182, 109253. [Google Scholar] [CrossRef]
  45. Moreto, J.A.; Rossino, L.S.; Filho, W.W.B.; Marino, C.E.B.; Da Conceição Ferreira, M.; Taryba, M.; Fernandes, J.C.S. On the global and localised corrosion behaviour of the AA2524-T3 aluminium alloy used as aircraft fuselage skin. Mater. Res. 2019, 22. [Google Scholar] [CrossRef] [Green Version]
  46. Queiroz, F.M.; Bugarin, A.F.S.; Hammel, N.P.; Capelossi, V.R.; Terada, M.; Costa, I. EIS behavior of anodized and primer coated AA2198–T851 compared to AA2024–T3 exposed to salt spray CASS test. Surf. Interface Anal. 2016, 48. [Google Scholar] [CrossRef]
  47. Campestrini, P.; Van Westing, E.P.M.; De Wit, J.H.W. Influence of surface preparation on performance of chromate conversion coatings on Alclad 2024 aluminium alloy–Part II: EIS investigation. Electrochim. Acta 2001, 46, 2631–2647. [Google Scholar] [CrossRef]
  48. Capelossi, V.R.; Poelman, M.; Recloux, I.; Hernandez, R.P.B.; de Melo, H.G.; Olivier, M.G. Corrosion protection of clad 2024 aluminum alloy anodized in tartaric-sulfuric acid bath and protected with hybrid sol–gel coating. Electrochim. Acta 2014, 124, 69–79. [Google Scholar] [CrossRef]
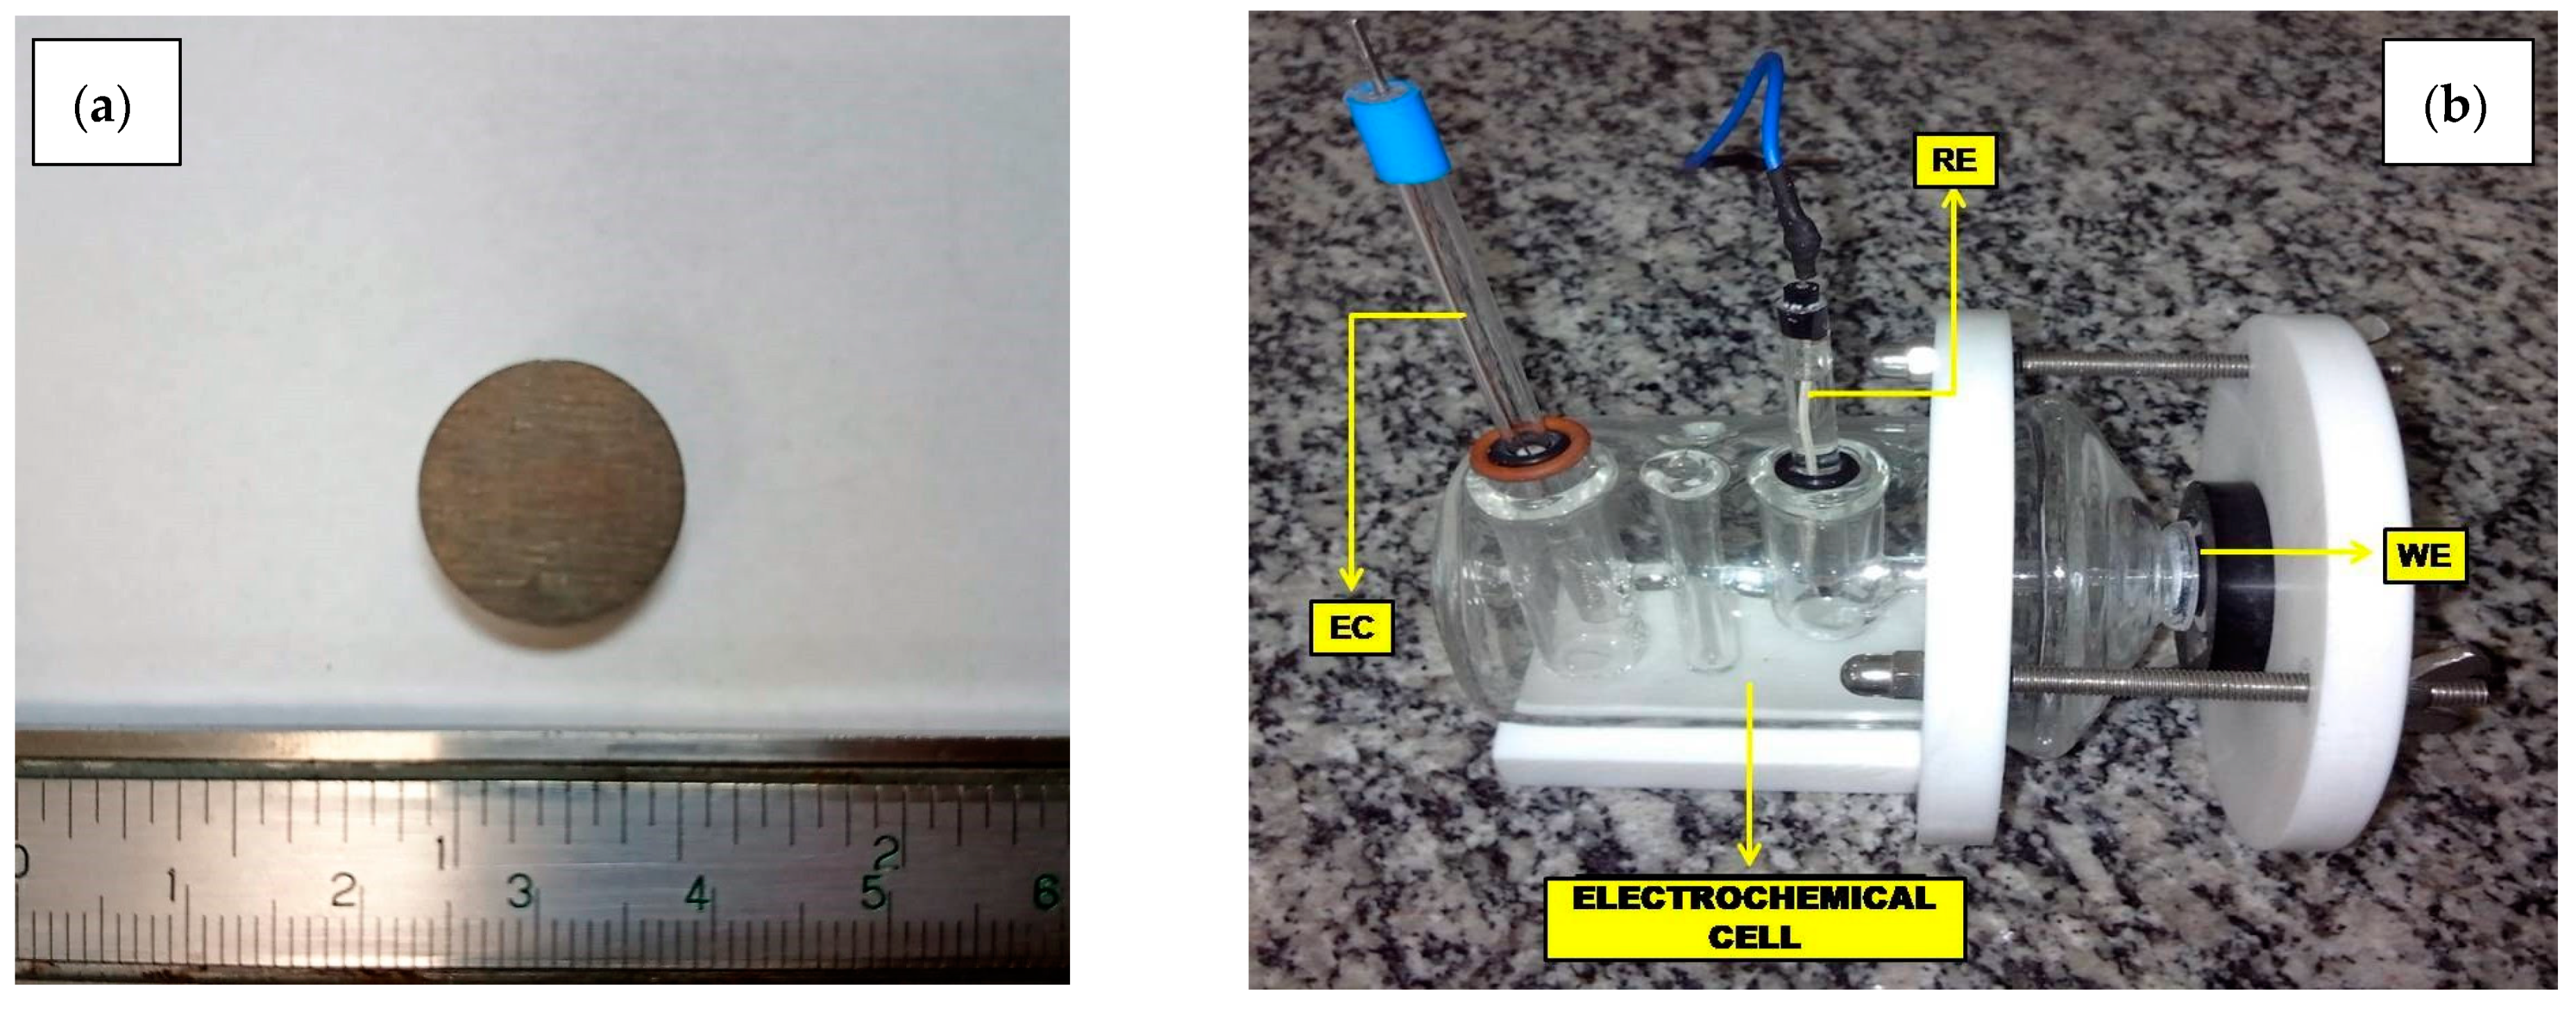
Figure 1. (a) Specimen of AA2524 in as-received condition and (b) three-electrode setup configuration cell. The reference electrode (RE) was an Ag/AgCl, 3 mol L−1 KCl, and a platinum wire was employed as an auxiliary electrode (EC). The sample was the working electrode (WE).
Metals 11 00980 g001
Figure 2. Microstructures of AA2024-T3: (a) general view; (c) Al-Cu-Mg; and (e) Al-Cu-Mn-Fe-(Si) particles. Microstructures of AA2524-T3: (b) general view; (d) Al-Cu-Mg; and (f) Al-Cu-Mn-Fe-(Si) particles. As-received condition. SEM–BSE.
Metals 11 00980 g002
Figure 3. Frequency (%) and size distribution (µm2) of IMCs for as-received samples. More than 94% of the AA2524-T3 alloy and 82% of the AA2024-T3 alloy IMCs are smaller than 10 µm2.
Metals 11 00980 g003
Figure 4. Microstructures of AA2024-T3 after (a) 2 h, (c) 7 h, (e) 11 h, and (g) 20 h. AA2524-T3 after (b) 2 h, (d) 7 h, (f) 11 h, and (h) 20 h of exposure to the 0.01 mol.L−1 NaCl solution. SEM–BSE. The micrographs show the evolution of the localized corrosion at the interface IMC/matrix (indicated by arrows).
Metals 11 00980 g004
Figure 5. Evolution of EIS results for the AA2024-T3 as a function time of exposure to 0.01 mol L−1 NaCl electrolyte. (A) Bode phase angle and (B) Nyquist diagram. Measurements were taken after 2, 5, 7 and 9 h of the experiment. (C) Bode phase angle and (D) Nyquist diagram. Measurements were taken after 11, 20, 48 and 72 h of the experiment.
Metals 11 00980 g005
Figure 6. Evolution of EIS results for the AA2524-T3 as a function time of exposure to 0.01 mol L−1 NaCl electrolyte. (A) Bode phase angle and (B) Nyquist diagram. Measurements taken after 2, 5, 7, and 9 h of the experiment. (C) Bode phase angle and (D) Nyquist diagram. Measurements taken after 11, 20, 48, and 72 h of the experiment.
Metals 11 00980 g006
Figure 7. Equivalent electrical circuits (EEC) proposed to fit the data of the AA2024-T3 and AA2524-T3 (a) until 9 h and (b) from 11 h of immersion in a 0.01 mol L−1 NaCl solution.
Metals 11 00980 g007
Table 1. Analyzed and nominal chemical composition (wt %) of the AA2024-T3 and AA2524-T3 alloys [39].
ElementsAA2024-T3AA2524-T3
Cu4.06 (3.8–4.9)3.84 (4.0–4.5)
Mg1.77 (1.2–1.8)1.31 (1.2–1.6)
Mn0.63 (0.3–0.9)0.56 (0.45–0.7)
Si0.11 (0.5 max)0.04 (0.06 max)
Fe0.14 (0.5 max)0.06 (0.12 max)
Ti−(0.15 max)0.029 (0.10 max)
Zn0.02 (0.25 max)0.01 (0.15 máx)
AlBalanceBalance
Table 2. Mechanical and corrosion properties of the AA2024-T3 and AA2524-T3 alloys.
Tensile Strength (MPa)Yield Strength (MPa)Elongation (%)Electrical Conductivity % IACSOpen Circuit Potential (VSCE)
AA2024 [40]43529010–1530−0.722 [41]
AA2524 [42]445.4340.31934−0.590 [43]
Table 3. Comparison of IMCs area fraction of AA2024 and AA2524 alloys.
MaterialIMCs Area Fraction (%)
AA2024-T32.52 ± 0.42
AA2524-T31.64 ± 0.14
Table 4. Parameters obtained from the equivalent electrical circuit fitted to the AA2024-T3 and AA2524-T3 EIS data.
2 h5 h7 h9 h11 h20 h48 h72 h
2524202425242024252420242524202425242024252420242524202425242024
Rsol Ω·cm2346.40394.20342.10388.70334.90382.80330380.40328.40381.20325.10373.80316.90362.30318.80376.90
Error (%)0.400.270.500.220.400.160.320.160.340.270.340.250.370.370.320.30
CPEox µF·cm−2·s(α−1)6.2716.605.9916.306.0714.906.3915.306.8419.208.5820.8013.8034.7018.0043.30
Error (%)2.448.142.365.841.753.881.283.521.294.571.273.411.394.281.443.63
Rox Ω·cm2327.1057.15351.6056.04413.1057.71479.1064.06541.8079.83752.30107954.50210.20761.40239.70
Error (%)6.189.324.535.173.783.023.152.773.373.785.213.337.589.467.7810.02
CPEdL µF·cm−2·s(α−1)14.8058.9016.4075.4016.6089.3016.1091.5014.4083.5011.5080.808.8544.0013.1050.20
Error (%)3.233.393.262.193.131.402.531.352.842.064.652.146.206.934.736.19
α dL0.860.890.880.880.880.870.870.870.890.890.900.900.970.990.940.96
Error (%)0.810.660.810.490.830.350.710.360.780.501.330.571.741.791.401.69
Rct kΩ·cm27.374.667.734.376.984.287.274.067.883.166.263.485.432.476.543.50
Error (%)2.092.942.892.782.612.202.012.112.882.613.793.434.305.093.035.48
CPEcor µF·cm−2·s(α−1)174.00180.04187.70241.00239.59313.00274.00358.00204.00341.00283.00327.00199.00352.41275.00295.00
Error (%)1.951.003.311.283.051.382.881.443.071.164.461.872.651.752.711.98
α cor0.760.810.630.740.650.690.640.640.450.540.460.500.420.590.570.60
Error (%)1.771.002.781.423.261.512.721.432.250.793.841.261.701.332.161.56
Rcor kΩ·cm222.4630.1527.5127.9827.9133.6626.0654.26
Error (%)3.361.935.353.708.765.496.947.53
Publisher’s Note: MDPI stays neutral with regard to jurisdictional claims in published maps and institutional affiliations.