Abstract
Cantilever-type rotating bending fatigue tests were conducted under a very high cycle fatigue regime using conventionally manufactured Ti-6Al-4V specimens having drilled artificial defects with different sizes. The relationship between fatigue limit and defect size was defined as a fatigue limit design curve considering the transition from the fracture-mechanics dominating area to the fatigue-limit dominating area. A conventional Murakami’s equation was applicable as a design curve of additively manufactured Ti-6Al-4V with defects at 107 cycles. However, conventional equation gave un-conservative predictions for the fatigue limit at 108 cycles. Therefore, two kinds of modified Murakami’s equation were proposed as fatigue limit design curves for the very high cycle fatigue regime. Simple parallel shift of Murakami’s equation gave a conservative fatigue limit, whilst better result was obtained by changing the slope of Murakami’s equation. The proposed design curve was valid for the defect sizes ranging from 10 to 500 μm.
1. Introduction
Additive manufacturing (AM) has been attracting large attention due to its many advantages. Near-net-shape and complicated-shape components can be fabricated by AM using hard-to-work materials, such as high-strength steels, titanium (Ti) alloys and so on [1,2]. It is believed that AM is suitable for large-item and small-scale production, and for trial production especially in the aerospace industries. Ti-6Al-4V is widely used as aerospace components and one of the hard-to-work materials. Therefore, the fabrication of Ti-6Al-4V components by AM is a practical issue, and many prototype components have been manufactured [3]. One of the major drawbacks of AM is the formation of pore-like defects during AM process, which have a significant effect on the fatigue performances [4,5,6,7]. That is because pore-like defects could be assumed as fatigue crack starters. It has been reported that hot isostatic pressing (HIP) could reduce the size and number of pores [8,9]. However, the processing cost of AM is relatively high itself, and HIP after AM would further increase the cost. Therefore, as-built components with defects are sometimes used from the viewpoint of reducing costs, indicating the importance of quantitative evaluation of the effect of defects on fatigue properties.
There have been several research studies about the fatigue behaviour of additively manufactured (AMed) Ti-6Al-4V [10,11,12,13,14,15]. For example, Li et al. [11] surveyed some fatigue test results of wrought and AMed Ti-6Al-4V from the literature and revealed that the fatigue performances of AMed Ti-6Al-4V were inferior to those of wrought Ti-6Al-4V in the as-built conditions, mainly due to the defect-dominated fatigue crack initiation.
For the fatigue endurance limit design, the definition of fatigue limits of AMed materials with defects is quite important. Murakami and Endo [16,17] proposed an empirical equation using Vickers hardness and the inclusion size as follows to predict fatigue limits at 107 cycles of many kinds of steels, in which square root of the area of the inclusion, √area, was assumed as initial fatigue crack length. In the following equations, σ represents the stress amplitude in fatigue tests:
where σw (107) is the fatigue limit at 107 cycles and HV is Vickers hardness.
The above √area model, namely Murakami’s equation, is an empirical equation. The defects are assumed as cracks, and the model simulates the transition from the linear elastic fracture mechanics (LEFM) dominating area to fatigue-limit dominating area in Kitagawa–Takahashi diagram [18]. The √area model was proved using specimens with drilled artificial defects or pre-cracks [19], and the proposed model has been widely and practically used for the prediction of fatigue limits of steels. There have been some attempts to apply Murakami’s equation for evaluating fatigue limits of non-ferrous alloys with different elastic moduli, such as cast aluminium (Al) alloys having casting defects [20,21,22] because that equation was empirical. In that research, it was found that some modification should be given to the equation to be used for the precise prediction for Al alloys. Matsunaga et al. [23] conducted uniaxial fatigue tests using Ti-6Al-4V specimens with drilled artificial defects and applied Murakami’s equation as the fatigue limit design curve at 107 cycles. They concluded that the equation could be used for the prediction without any modification, unlike the case of Al alloys. However, they did not prove the applicability of the equation for the prediction of fatigue limit in the very high cycle fatigue (VHCF) regime, where the number of cycles of fatigue loading was up to 108 cycles. Furthermore, the validity was checked only for five different artificial defect sizes and for uniaxial fatigue tests. Accordingly, the transition size of the defect from LEFM dominating area to Murakami’s equation was only roughly estimated as 450 μm. Thus, it seems that the confirmation of the applicability of Murakami’s equation for Ti-6Al-4V alloy for VHCF regime and for AMed material is insufficient.
In our previous study [24], cantilever-type rotating bending fatigue tests were conducted using AMed Ti-6Al-4V at room temperature and elevated temperature of 523 K (250 °C) under the as-built condition. The maximum defect size in the AMed specimen was estimated by the statistics of extremes [25,26], and it was proved that Murakami’s equation was valid to predict the fatigue limits of AMed Ti-6Al-4V at both temperatures. However, it was proved only for one statistically estimated maximum defect size of 85.1 μm, which was defined using 20 samples. To prove that the equation is valid for the wide range of defect sizes, many AMed materials with different statistically estimated maximum defect sizes should be investigated, whilst controlling the maximum defect sizes in the actual AMed materials is difficult. Therefore, in the present study, conventionally manufactured (CMed) Ti-6Al-4V was used.
The drilled artificial hole defects with many different sizes were introduced to the specimens to simulate the wide range of maximum defects in the AMed samples, and cantilever-type rotating bending fatigue tests were conducted using those specimens. In the actual AMed materials, the shapes and types of defects are not limited to pore-like defects, while all defects act as fatigue crack starters irrespective of their shapes and types. The number of cycles to fatigue crack initiation from the defect is dependent on the shapes and types of defects, but the number of cycles to crack initiation is much smaller than the number of cycles to failure, especially in VHCF regime. Therefore, it is reasonable to assume that the drilled artificial defects could simulate many kinds of defects acting as crack starters. After the fatigue tests, the relationship between fatigue limit and defect size was analysed to propose fatigue limit design curves for the AMed samples having different maximum defect sizes, considering a transition from LEFM dominating area to fatigue-limit dominating area. Furthermore, VHCF properties of AMed materials should be investigated for the actual applications [27,28]. Therefore, the applicability of Murakami’s equation in the VHCF regime was also investigated.
2. Experimental Procedure
2.1. Material and Specimen
The material used is Ti-6Al-4V alloy, which was conventionally manufactured by forging. The chemical composition is Al: 6.35, V: 4.28, N: 0.009, C: 0.008, H: 0.007, Fe: 0.05, O: 0.16, Ti: Bal. (wt%). The as-received round bar was annealed at 1013 K (740 °C) and would be denoted as CM-Ti in the following text and figures. The reference material is electron beam-melted (EBMed) Ti-6Al-4V, used in the previous study [24], denoted as AM-Ti. The mechanical properties are summarized in Table 1. It should be noted that the properties, especially Vickers hardness, of both materials are nearly comparable. The microstructures of those materials are summarized elsewhere [24]. It is considered that the residual stress of AM-Ti is small because the fabrication process is electron beam melting, in which the energy input is larger than selective laser melting. Furthermore, the residual tensile stress on the as-built sample approaches zero at a depth of 200–500 μm from the surface in the EBMed Ti-6Al-4V [29]. In the present case, surface was removed by the machining followed by careful polishing and buff finishing using alumina suspension [24]. Therefore, the effect of residual stress in the EBMed samples could be negligible.

Table 1.
Mechanical properties of materials.
The fatigue specimens are sampled from the annealed round bar, whose configuration is shown in Figure 1. As shown in the figure, one specimen has four drilled artificial defects of different sizes. The specimens could be classified into three types depending on the defect sizes, namely specimens I, II and III having large, medium and small defects, respectively. The designed diameter, depth and corresponding √area of the defects in each specimen are summarized in Table 2. Figure 2 is a typical result showing the actual shape of a hole defect measured by a laser scanning microscope (LSM: Keyence VK9710, Osaka, Japan). The actual sizes of all the defects, √area, were precisely measured by an LSM; therefore, the measurement error in hole size was quite small. The positions of the holes in the sample were also controlled precisely to minimize the error. The actual hole-like defects in the AMed materials have complicated geometries. However, since the localized stress induced by the complicated geometry is very high, the round shape crack appears immediately at the defects in the very early stage of fatigue life. Similarly, in bending, the complicated geometry of the actual defects at the specimen surface changes its shape to semi-circular immediately under bending fatigue loading. Therefore, drilled artificial defects could simulate the actual defects with complicated shapes [19].
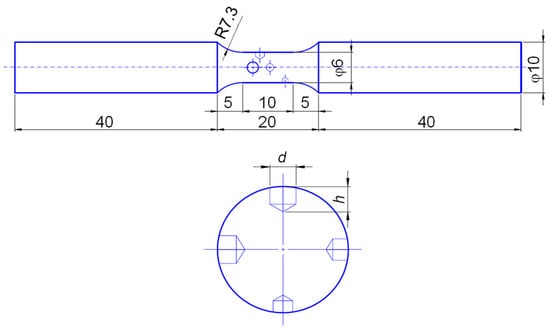
Figure 1.
Fatigue specimen configuration with drilled artificial defects. Dimension is in mm.
Table 2.
Sizes of artificial defects of specimens I, II and III.
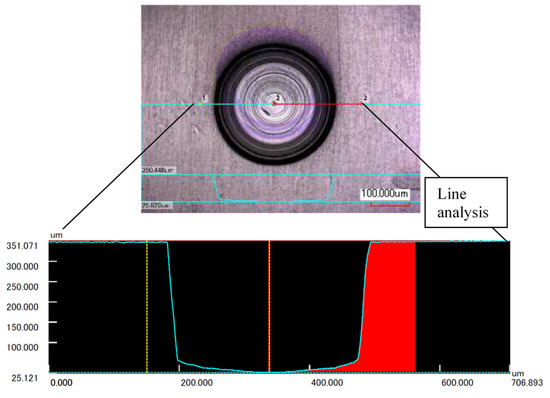
Figure 2.
An example of the shape of a hole defect measured by an LSM.
The effect of residual stress in the thin layer around the artificial hole, where fatigue crack initiates, was minimized by removing the hole-edge work-hardened layer on the surface, as per finishing with Emery paper and alumina suspension. Furthermore, it could be considered that the effect of residual stress at the thin layer around the hole was small because crack propagation (not crack initiation), especially non-propagating crack, was taken into account in the √area model, as will be shown in Section 3.2 using Figures 6 and 7.
2.2. Test Procedures
Cantilever-type rotating bending fatigue tests were conducted at a frequency, f = 52.5 Hz (3150 rpm) using a fatigue testing machine called the GIGA QUAD YRB200 (Yamamoto Metal Technos Co., Ltd., Osaka, Japan). As shown in Figure 3 [21], the larger defect experiences a lower bending moment in the cantilever-type rotating bending fatigue tests, with the hope that all the defects could be potential fatigue crack initiation sites. After fatigue tests, the defects in the fatigue-failed and run-out samples were examined in detail by a scanning electron microscope (SEM: JEOL JSM-6060, Tokyo, Japan), whether fatigue crack initiated at the defect or not. The run-out cycle was defined as 108, while the fatigue crack initiation was checked by an SEM at both 107 and 108 cycles.
Figure 3.
Schematic illustration of moment distribution at each artificial defect.
3. Results
3.1. Crack Initiation at Artificial Defects
Figure 4 shows the simple relationships between stress amplitudes and the number of cycles to failure in the samples with artificial defects, in which the stress amplitude represents the nominal stress at the centre of each defect with different bending moments (see Figure 3). Therefore, one sample has four data plots. Red cross symbols in the figure are the defects, where the main crack was initiated and propagated until final failure. The specimens having smaller defects exhibit higher fatigue strengths. This figure is not for drawing regular S-N diagram, but is shown only for summarizing experimental data sets, which are used to draw the Kitagawa–Takahashi diagram. The details will be mentioned in Section 4.
Figure 4.
Experimental data sets used to draw Kitagawa–Takahashi diagram.
The typical fatigue fracture surface is shown in Figure 5, whose fatigue crack initiated at the defect with the size of √area ≈ 0.6 mm. Subsequently, all the defects of the fatigue-failed and run-out samples were examined in detail. Figure 6 indicates a defect having fatigue cracks at 8.0 × 10⁴ cycles, and Figure 7a–c are those at 1.0 × 10⁵, 1.5 × 10⁵ and 9.0 × 10⁶ cycles, respectively. In those cases, the main fatigue cracks initiated at the other defects and propagated until final failure. The lengths of those secondary cracks in Figure 6 and Figure 7 are ranging from 10 to a few hundred microns. The cracks were not found in the run-out samples. However, the fatigue crack with a length of 20 μm was found at 9.0 × 10⁶ cycles Figure 7c, and it might be equivalent to non-propagating crack at 107 cycles.
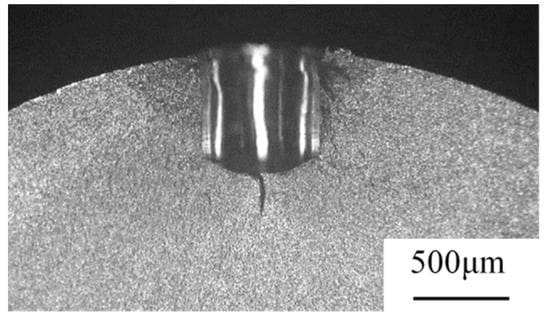
Figure 5.
Typical fatigue crack initiation from an artificial defect (√area ≈ 0.6 mm).
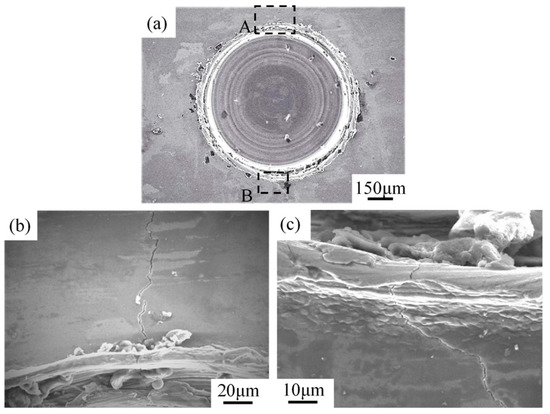
Figure 6.
Secondary fatigue cracks found at an artificial defect (d = 0.73 mm, N = 8.0 × 10⁴, specimen Type II in Table 2). (a) Macroscopic view; (b) magnified view of area A in Figure (a); (c) magnified view of area B in Figure (a).
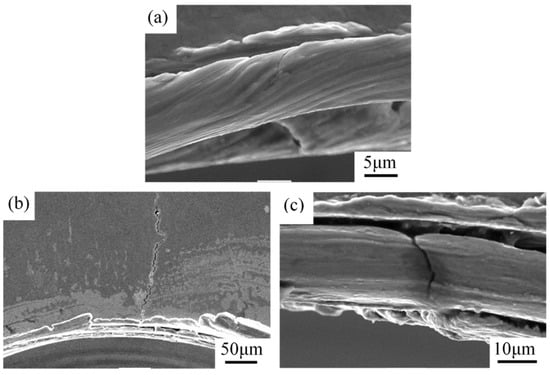
Figure 7.
Some examples of secondary fatigue cracks found at artificial defects; (a) d = 0.48 mm, N = 1.0 × 10⁵, (b) d = 1.28 mm, N = 1.5 × 10⁵, (c) d = 1.26 mm, N = 9.0 × 10⁶ ((a–c) are all specimen type ii in Table 2).
3.2. Stress Amplitude as a Function of √area
Figure 8a shows the relationship between stress amplitude and √area of defect at 107 cycles. Four data points correspond to one specimen with four defects of different sizes. Cross symbols in the figure represent the defects at which the main fatigue crack initiated and propagated until final failure. Circular hollow symbols are the defects that survived 107 cycles without any fatigue crack initiation. Red triangular symbols mean that fatigue cracks initiated at those defects, but the main crack leading to the final failure initiated at the other defects. Small blue solid dots mean that fatigue crack did not initiate at those defects, but fatigue failure occurred before 107 cycles at the other defects with the main crack. Figure 8b is the same figure at 108 cycles. It should be noted that some specimens survived 107 cycles in Figure 8a, whilst failed before 108 cycles in Figure 8b, namely fatigue failure, took place in the VHCF regime. The following discussion will be made based on Figure 8a,b.
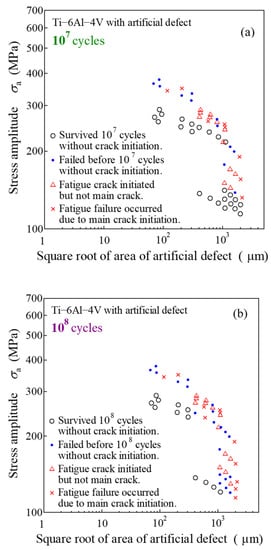
Figure 8.
Relationship between stress amplitude and √area of the defect; (a) 107 cycles, (b) 108 cycles.
4. Discussion
4.1. Kitagawa–Takahashi-Murakami Diagram at 107 Cycles
Figure 9 is the S-N diagram of CM-Ti and EBMed Ti-6Al-4V, namely AM-Ti, at room temperature in the previous study [24]. The fatigue limits of CM-Ti were 625 MPa and 575 MPa, and those of AM-Ti were 300 MPa and 225 MPa at 107 and 108 cycles, respectively. The number of data points is limited, but the approximate curve of discrete data points in Figure 9 is defined as 50% fracture probability curve in the P-S-N curves. Therefore, the above fatigue limits are the approximations of the precise fatigue limits obtained by a staircase method. The defect sizes at the crack initiation sites of AM-Ti in Figure 9 were measured as typically shown in Figure 10, in which the defect size, √area, as defined by the envelope of the defect. The effective defect size at the crack initiation site was proposed by Masuo et al. [30]. Still, it was not considered in the present case because the statistical analyses of the defect sizes were done using the envelope shown in Figure 10 [24]. Figure 11 summarises the results of CM-Ti with artificial defects and AM-Ti at 107 cycles, as a relationship between stress amplitude and defect size. In this figure, the Kitagawa–Takahashi diagram is drawn in Figure 8a. The threshold value of long fatigue crack propagation (FCP), Kmax, th = 6.2 MPam1/2 was obtained by the FCP tests of Ti-6Al-4V with a similar microstructure using compact tension (CT) specimens at the load ratio, R = 0.05 [31,32]. It should be noted that FCP at the stress ratio, R = −1, could be estimated using the results at R = 0.05 because the stress intensity factor in the negative portion could be neglected because of crack closure.
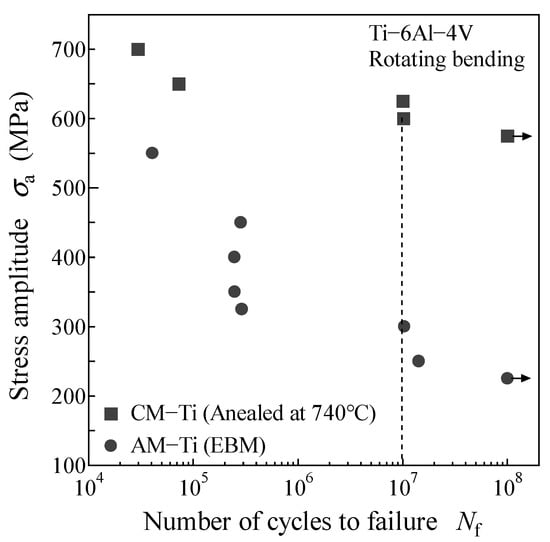
Figure 9.
S-N diagram of conventionally manufactured and EBMed Ti-6Al-4V.
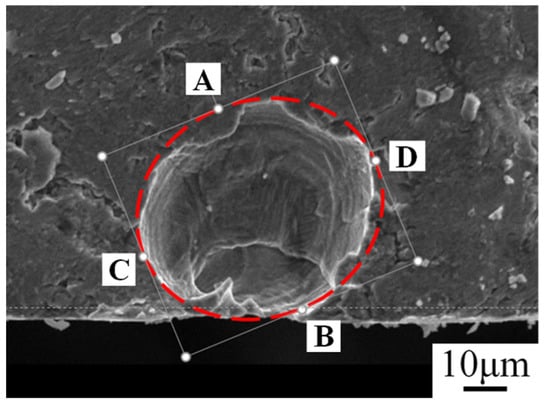
Figure 10.
Defect at fatigue crack initiation site of EBMed Ti-6Al-4V (σa = 450 MPa, Nf = 2.8 × 10⁵).
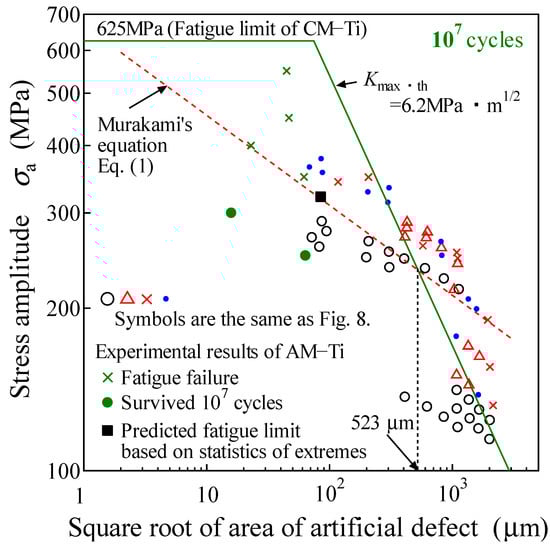
Figure 11.
Kitagawa–Takahashi-Murakami diagram at 107 cycles.
The following equation was used for the stress intensity factor calculation in Figure 11, assuming the surface defects [19].
Two solid symbols of AM-Ti at the stress amplitudes of 250 and 300 MPa (green circular symbols) mean that fatigue failure did not occur at 107 cycles. However, the fatigue tests were continued beyond 107 cycles until final fatigue failure, as will be discussed in the next section. Therefore, the actual defect sizes at the crack initiation sites are plotted for those data after fatigue failure in VHCF regime. Murakami’s Equation (1) is given in the figure as a red dotted line, in which the Vickers hardness of AM-Ti, HV351 (Table 1) is used. It should be noted that AM-Ti and CM-Ti have comparable hardness, as shown in Table 1, which enables direct comparison between AM-Ti and CM-Ti using Murakami’s equation.
In the present study, the statistically estimated maximum defect size of AM-Ti is 85.1 μm and the predicted fatigue limit (107), based on Murakami’s equation, is shown by a black solid square symbol at 321 MPa [24]. It is clear that fatigue failure of AM-Ti (green cross symbols) and fatigue failure or fatigue crack initiation of CM-Ti with artificial defects (red cross and triangular symbols) occurred in the upper areas of Murakami’s equation and LEFM line of Kitagawa–Takahashi diagram. The results correspond with those by Matsunaga et al. [23]. In the present study, the transition defect size from LEFM-dominating area to Murakami’s equation could be clearly defined as 523 μm, whilst the rough estimation by Matsunaga et al. [23] was about 450 μm. Figure 11 implies that conventional Murakami’s equation could be used as a fatigue limit (107) design curve for AMed Ti-6Al-4V with different defect sizes. Masuo et al. also showed that the fatigue failure of EBMed Ti-6Al-4V occurred when the stress amplitudes were higher than the predicted fatigue limit (107) by Equation (1) [32].
4.2. Kitagawa–Takahashi-Murakami Diagram at 108 Cycles
As mentioned above, fatigue tests of CM-Ti with artificial defects and AM-Ti were continued up to 108 cycles to investigate the applicability of Murakami’s equation in VHCF regime. Figure 12 shows Kitagawa–Takahashi-Murakami diagram at 108 cycles. In Figure 11, the fatigue tests of AM-Ti at the stress amplitudes of 250 MPa and 300 MPa survived 107 cycles, but failed before 108 cycles, as shown by green bold cross symbols in Figure 12. As the fatigue specimen tested at 225 MPa survived 108 cycles, the actual defect size at the crack initiation site was unknown. Therefore, the data was plotted as a green solid circular symbol in the figure assuming the defect size of 85.1 μm, which was estimated based on the statistics of extremes [24].
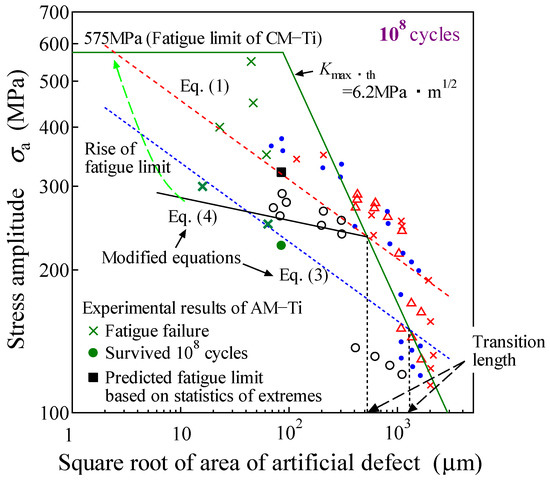
Figure 12.
Kitagawa–Takahashi-Murakami diagram at 108 cycles.
Some results of CM-Ti with artificial defects in Figure 11 changed from run-out to failure or to fatigue crack initiation, as shown in Figure 12. In addition, the fatigue failure of AM-Ti occurred below Murakami’s equation in VHCF regime, indicating that the prediction of fatigue limits at 108 cycles using that conventional equation would not be sufficient. Thus, the following modified Murakami’s equation is proposed as a fatigue limit (108) design curve at 108 cycles, which is shown as a blue dotted line in Figure 12.
This equation is a simple parallel shift of Murakami’s equation obtained by the fitting of some data points (two bold green cross symbols, one green solid circular symbol and two triangular red symbols below the dashed blue line in Figure 12) and keeping the slope of Murakami’s equation. Since some circular hollow symbols (un-failed data of CM-Ti with artificial defects at 108 cycles) are in the upper area of the proposed equation, Equation (3) can give conservative fatigue limits (108), which implies the practical merit of this equation. However, a simple parallel shift means that the transition crack length from the LEFM-dominating area to Murakami’s equation becomes longer with increasing loading cycles as shown by the dashed black arrows in Figure 12. The transition crack length seems to be constant from the viewpoint of the basic concept of LEFM. Thus, the following equation is shown in the figure as a solid black line, which is crossing the transition crack length of 523 μm at 107 cycles, and is drawn to roughly divide the areas of fatigue failure and un-failure.
Although some plots indicating the non-failure of CM-Ti with artificial defects are seen in the upper area of the proposed line by Equation (4), the equation still gives a conservative and better estimation of fatigue limits at 108 cycles than Equation (3). It should be noted that this design curve is valid only for the defect sizes ranging from 10 to 500 μm. For the smaller defects than 10 μm, Equation (4)’s prediction of fatigue limits (108) are too conservative, which are much lower than the fatigue limit of the smooth specimen (575 MPa). We anticipated that a drastic rise in the fatigue limit (108) would take place when the defect size became smaller than 10 μm, as shown by the dashed green curve in the figure. However, Equation (4) could be used for the practical cases because typical defect sizes in the AMed materials are approximately a few tens of microns [10,11,12,13,14,15].
Consequently, the fatigue limit (108) prediction procedure is as follows. First, the maximum defect size in the AMed fatigue specimen should be estimated using statistics of extremes [19], and subsequently, the fatigue limit (108) of VHCF regime could be predicted by Equation (4). This fatigue limit (107) prediction procedure is similar to that of steels having inclusions (usually intermetallic compounds), in which inclusions are assumed to be non-propagating cracks. In the present case, defects in the AMed samples and artificial defects in CMed samples could be assumed to be non-propagating cracks as well.
5. Conclusions
Cantilever-type rotating bending fatigue tests were conducted using conventionally manufactured (CMed) Ti-6Al-4V. Four drilled artificial defects with different sizes were introduced to each specimen. The defects were classified into three types after fatigue tests. First, the defect at which the main crack initiated and grew to the final failure. Second, the defect at which fatigue crack initiated but not related to the final failure (secondary crack initiation). Third, the defects survived up to 107 or 108 cycles without fatigue crack initiation. Finally, the results were used to draw fatigue limit design curves of additively manufactured (AMed) Ti-6Al-4V in a very high cycle fatigue regime considering the transition from LEFM-dominating area to fatigue-limit dominating area. The conclusions are as follows.
- (1)
- Fatigue limits of AMed Ti-6Al-4V at 107 and 108 cycles were lower than those of CMed Ti-6Al-4V, because the defects acted as fatigue crack starters.
- (2)
- Kitagawa–Takahashi diagram was drawn, and the fatigue test results of CMed Ti-6Al-4V with artificial defects were compared with those of AMed Ti-6Al-4V. The transition from the LEFM-dominating area to the fatigue limit dominating area was well described by the conventional Murakami’s equation at 107 cycles. However, conventional equation gave an insufficient prediction of the fatigue limit at 108 cycles.
- (3)
- Two kinds of modified Murakami’s equations were proposed as fatigue limit design curves at 108 cycles. A parallel shift of Murakami’s equation was simple and gave conservative results. However, a parallel shift means that the transition crack length from LEFM-dominating area to Murakami’s equation becomes longer with increasing loading cycles. A better prediction could be given by changing the slope of Murakami’s equation in keeping with the transition crack length constant, and the modified equation was valid for the defect sizes ranging from 10 to 500 μm.
Author Contributions
Fatigue test planning, Y.U., T.K. and M.N.; conducting fatigue tests, Y.H.; analysis, Y.U.; writing, Y.U.; review and editing, T.K and M.N. All authors have read and agreed to the published version of the manuscript.
Funding
This research received no external funding.
Institutional Review Board Statement
Not applicable.
Informed Consent Statement
Not applicable.
Data Availability Statement
Data sharing is not applicable to this article.
Acknowledgments
The authors wish to thank Akira UENO (Ritsumeikan University), who suddenly passed away in July 2020, for kind advice on the experimentalmethod using specimens with artificial defects, and analyses using Murakami’s concept.
Conflicts of Interest
The authors declare no conflict of interest.
References
- Murr, L.E.; Gaytan, S.M.; Ramirez, D.A.; Martinez, E.; Hernandez, J.; Amato, K.N.; Shindo, P.W.; Medina, F.R.; Wicker, R.B. Metal Fabrication by Additive Manufacturing Using Laser and Electron Beam Melting Technologies. J. Mater. Sci. Technol. 2012, 28, 1–14. [Google Scholar] [CrossRef]
- Herzog, D.; Seyda, V.; Wycisk, E.; Emmelmann, C. Additive manufacturing of metals. Acta Mater. 2016, 117, 371–392. [Google Scholar] [CrossRef]
- Liu, S.; Shin, Y.C. Additive manufacturing of Ti6Al4V alloy: A review. Mater. Des. 2019, 164, 107552. [Google Scholar] [CrossRef]
- Akita, M.; Uematsu, Y.; Kakiuchi, T.; Nakajima, M.; Kawaguchi, R. Defect-dominated fatigue behavior in type 630 stainless steel fabricated by selective laser melting. Mater. Sci. Eng. A 2016, 666, 19–26. [Google Scholar] [CrossRef]
- Croccolo, D.; De Agostinis, M.; Fini, S.; Olmi, G.; Vranic, A.; Ciric-Kostic, S. Influence of the build orientation on the fatigue strength of EOS maraging steel produced by additive metal machine. Fatigue Fract. Eng. Mater. Struct. 2016, 39, 637–647. [Google Scholar] [CrossRef]
- Tang, M.; Pistorius, P.C. Oxides, porosity and fatigue performance of AlSi10Mg parts produced by selective laser melting. Int. J. Fatigue 2017, 94, 192–201. [Google Scholar] [CrossRef]
- Zhang, M.; Sun, C.-N.; Zhang, X.; Wei, J.; Hardacre, D.; Li, H. Predictive models for fatigue property of laser powder bed fusion stainless steel 316L. Mater. Des. 2018, 145, 42–54. [Google Scholar] [CrossRef]
- Fatemi, A.; Molaei, R.; Simsiriwong, J.; Sanaei, N.; Pegues, J.; Torries, B.; Phan, N.; Shamsaei, N. Fatigue behaviour of additive manufactured materials: An overview of some recent experimental studies on Ti-6Al-4V considering various processing and loading direction effects. Fatigue Fract. Eng. Mater. Struct. 2019, 42, 991–1009. [Google Scholar] [CrossRef]
- Benzing, J.; Hrabe, N.; Quinn, T.; White, R.; Rentz, R.; Ahlfors, M. Hot isostatic pressing (HIP) to achieve isotropic micro-structure and retain as-built strength in an additive manufacturing titanium alloy (Ti-6Al-4V). Mater. Lett. 2019, 257, 126690. [Google Scholar] [CrossRef]
- Leuders, S.; Thöne, M.; Riemer, A.; Niendorf, T.; Tröster, T.; Richard, H.A.; Maier, H.J. On the mechanical behaviour of tita-nium alloy TiAl6V4 manufactured by selective laser melting: Fatigue resistance and crack growth performance. Int. J. Fatigue 2013, 48, 300–307. [Google Scholar] [CrossRef]
- Li, P.; Warner, D.; Fatemi, A.; Phan, N. Critical assessment of the fatigue performance of additively manufactured Ti–6Al–4V and perspective for future research. Int. J. Fatigue 2016, 85, 130–143. [Google Scholar] [CrossRef]
- Hrabe, N.; Gnäupel-Herold, T.; Quinn, T. Fatigue properties of a titanium alloy (Ti–6Al–4V) fabricated via electron beam melting (EBM): Effects of internal defects and residual stress. Int. J. Fatigue 2017, 94, 202–210. [Google Scholar] [CrossRef]
- Biswal, R.; Zhang, X.; Syed, A.K.; Awd, M.; Ding, J.; Walther, F.; Williams, S. Criticality of porosity defects on the fatigue performance of wire + arc additive manufactured titanium alloy. Int. J. Fatigue 2019, 122, 208–217. [Google Scholar] [CrossRef]
- Dallago, M.; Winiarski, B.; Zanini, F.; Carmignato, S.; Benedetti, M. On the effect of geometrical imperfections and defects on the fatigue strength of cellular lattice structures additively manufactured via Selective Laser Melting. Int. J. Fatigue 2019, 124, 348–360. [Google Scholar] [CrossRef]
- Li, P.; Warner, D.; Pegues, J.; Roach, M.; Shamsaei, N.; Phan, N. Towards predicting differences in fatigue performance of laser powder bed fused Ti-6Al-4V coupons from the same build. Int. J. Fatigue 2019, 126, 284–296. [Google Scholar] [CrossRef]
- Murakami, Y.; Endo, M.; Murakami, Y.; Endo, M. Effects of defects, inclusions and inhomogeneities on fatigue strength. Int. J. Fatigue 1994, 16, 163–182. [Google Scholar] [CrossRef]
- Murakami, Y. Material defects as the basis of fatigue design. Int. J. Fatigue 2012, 41, 2–10. [Google Scholar] [CrossRef]
- Kitagawa, H.; Takahashi, S. Applicability of fracture mechanics to very small cracks or cracks in the early stage. In Proceedings of the Second International Conference on Mechanical Behavior of Materials, ASM 1976, Boston, MA, USA, 16–20 August 1976; pp. 627–631. [Google Scholar]
- Murakami, Y. Metal Fatigue: Effects of Small Defects and Nonmetallic Inclusions; Elsevier: Amsterdam, The Netherlands, 2002. [Google Scholar]
- Tajiri, A.; Nozaki, T.; Uematsu, Y.; Kakiuchi, T.; Nakajima, M.; Nakamura, Y.; Tanaka, H. Fatigue Limit Prediction of Large Scale Cast Aluminum Alloy A356. Procedia Mater. Sci. 2014, 3, 924–929. [Google Scholar] [CrossRef]
- Ueno, A.; Nishida, M.; Miyakawa, S.; Yamada, K.; Kikuchi, S. Fatigue Limit Estimation of Aluminum Die-casting Alloy by Means of √area Method. J. Soc. Mater. Sci. Jpn. 2014, 63, 844–849. [Google Scholar] [CrossRef]
- Uematsu, Y.; Kakiuchi, T.; Tajiri, A.; Nakajima, M. Fatigue limit prediction of A356-T6 cast aluminum alloys with different defect sizes sampled from an actual large-scale component. Int. J. Struct. Integr. 2017, 8, 617–631. [Google Scholar] [CrossRef]
- Matsunaga, H.; Murakami, Y.; Kubota, M.; Lee, J.H. Fatigue strength of T-6Al-4V alloys containing small artificial defects. Mat. Sci. Res. Int. 2003, 9, 263–269. [Google Scholar] [CrossRef]
- Kakiuchi, T.; Kawaguchi, R.; Nakajima, M.; Hojo, M.; Fujimoto, K.; Uematsu, Y. Prediction of fatigue limit in additively manufactured Ti-6Al-4V alloy at elevated temperature. Int. J. Fatigue 2019, 126, 55–61. [Google Scholar] [CrossRef]
- Murakami, Y.; Usuki, H. Quantitative evaluation of effects of non-metallic inclusions on fatigue strength of high strength steels. II: Fatigue limit evaluation based on statistics for extreme values of inclusion size. Int. J. Fatigue 1989, 11, 299–307. [Google Scholar] [CrossRef]
- Murakami, Y. Inclusion rating by statistics of extreme values and its application to fatigue strength prediction and quality control of materials. J. Res. Natl. Inst. Stand. Technol. 1994, 99, 345. [Google Scholar] [CrossRef]
- Günther, J.; Krewerth, D.; Lippmann, T.; Leuders, S.; Tröster, T.; Weidner, A.; Biermann, H.; Niendorf, T. Fatigue life of ad-ditively manufactured Ti–6Al–4V in the very high cycle fatigue regime. Int. J. Fatigue 2017, 94, 236–245. [Google Scholar] [CrossRef]
- Nicoletto, G. Anisotropic high cycle fatigue behavior of Ti–6Al–4V obtained by powder bed laser fusion. Int. J. Fatigue 2017, 94, 255–262. [Google Scholar] [CrossRef]
- Vastola, G.; Zhang, G.; Pei, Q.X.; Zhang, Y.W. Controlling of residual stress in additive manufacturing of Ti6Al4V byfinite element modelling. Addit. Manuf. 2016, 12, 231–239. [Google Scholar]
- Masuo, H.; Tanaka, Y.; Morokoshi, S.; Yagura, H.; Uchida, T.; Yamamoto, Y.; Murakami, Y. Influence of defects, surface roughness and HIP on the fatigue strength of Ti-6Al-4V manufactured by additive manufacturing. Int. J. Fatigue 2018, 117, 163–179. [Google Scholar] [CrossRef]
- Sugeta, A.; Jono, M.; Uematsu, Y.; Yamamoto, M.; Ueda, H. Effect of Microstructure on Fatigue Crack Growth Behavior in Ti-6Al-4V Alloy. J. Soc. Mater. Sci. Jpn. 1998, 47, 273–278. [Google Scholar] [CrossRef]
- Sugeta, A.; Uematsu, Y.; Kitayama, Y.; Jono, M. Fatigue Crack Growth Behavior of Ti-6Al-4V Alloy with Bimodal Microstructure under Repeated Two-step Load Sequences. Trans. Jpn. Soc. Mech. Eng. Ser. A 2005, 71, 1153–1159. (In Japanese) [Google Scholar] [CrossRef]
Publisher’s Note: MDPI stays neutral with regard to jurisdictional claims in published maps and institutional affiliations. |
© 2021 by the authors. Licensee MDPI, Basel, Switzerland. This article is an open access article distributed under the terms and conditions of the Creative Commons Attribution (CC BY) license (https://creativecommons.org/licenses/by/4.0/).