Abstract
Geometrical tolerances play a very important role in the functionality and assembly of parts made of light alloys for aeronautical applications. These parts are frequently machined in dry conditions. Under these conditions, the tool wear becomes one of the most important variables that influence geometrical tolerances. In this work, the influence of tool wear on roundness, straightness and cylindricity of dry-turned UNS A97075 alloy has been analyzed. The tool wear and form deviations evolution as a function of the cutting parameters and the cutting time has been assessed. In addition, the predominant tool wear mechanisms have been checked. The experimental results revealed that the indirect adhesion wear (BUL and BUE) was the main tool-wear mechanism, with the feed being the most influential cutting parameter. The combination of high feed and low cutting speed values resulted in the highest tool wear. The analyzed form deviations showed a general trend to increase with both cutting parameters. The tool wear and the form deviations tend to increase with the cutting time only within the intermediate range of feed tested. As the main novelty, a relationship between the cutting parameters, the cutting time (and, indirectly, the tool wear) and the analyzed form deviations has been found.
1. Introduction
Manufacturing processes have a high influence on the surface integrity of manufactured parts, altering both the geometrical and physicochemical properties of the surface. These changes may affect the functionality, reliability and final cost of the product [1]. Geometrical deviations can be considered at both micro-scale (roughness profile) and macro-scale (dimensional and geometrical tolerances) levels [2]. With regard to the geometrical tolerances (form, orientation, location and run-out) [3], these play a very important role both in the parts assembly and functionality [4]. These deviations may even affect mechanical properties as important as fatigue behavior [5]. In fact, some standards for conducting fatigue tests require maximum tolerances for certain geometrical deviations [6].
The demands on the quality requirements of structural components for aircraft are usually very high [7]. Many of these components are often manufactured integrally, in order to reduce the number of joints. For this reason, machining processes, with large material removals, are widely used [8]. In these processes, lubricants and coolants (cutting fluids) have traditionally been applied, with the aim of reducing the tool wear and improving the tool life. Its use also results in a quality improvement of the machined parts [9]. However, current regulations require their recycling, because these substances are highly polluting and harmful to health [10]. Therefore, the cost of waste disposal is increased [11]. Various techniques try to optimize and/or minimize its use, such as high-pressure coolant (HPC), minimum quantity of lubricant (MQL) [12], cryogenic cooling [13] or air cooling, among others. Other hybrid strategies, such as nitrogen minimum quantity lubrication (N2MQL) or Ranque–Hilsch vortex tube (RHVT) N2MQL are also currently used [14].
The use of these techniques requires complex systems that are often expensive. For alloys with good machinability, as in the case of wrought aluminum alloys (2000 and 7000 series), their application is not entirely profitable [15]. Therefore, dry machining has become the current trend for this alloys group [16]. Nevertheless, the total absence of cutting fluids negatively affects the tool wear and tool life, which are some of the most important economic factors in machining [17]. As a result, the surface integrity of these parts is also altered. This fact may lead to non-compliance with high-quality requirements of aeronautical parts [18].
The tool wear in the dry machining of aluminum alloys for aeronautical purposes has been extensively studied. Their low melting point (around 700 °C) makes the indirect adhesion wear the main tool wear mechanism [19]. This results in the Built-up Edge (BUE) formation at the cutting edge, as well as the Built-up Layer (BUL) appearing on the tool rake face [20]. The cutting parameters’ influence (cutting speed, feed and cutting depth) on tool wear has been also widely studied. On one hand, most studies have shown that the feed is the most influential parameter. Its increment results in higher tool wear intensity [21]. On the other hand, the cutting speed has shown less relevance than the feed. The tool wear intensity tends to reduce with the cutting speed. Finally, the cutting depth has been revealed as the least important cutting parameter, with the tool wear showing a slight trend to increase with this cutting parameter [22].
The tool coating is another variable to keep in mind. The tool wear intensity becomes higher for coated than uncoated tools because coatings materials usually show lower thermal conductivity. In [23], an analysis of the tool surface of uncoated and coated (TiN) inserts was performed, after the dry turning of the UNS A97050 alloy, applying the same cutting parameters. The authors concluded that the adhesion effects’ intensity was harder in the coated tool for all the tests due to the lower thermal conductivity of the Ti. The use of uncoated tools reduced the BUL and BUE intensity.
With regard to the tool wear influence on geometrical tolerances, most research is focused on the surface profile analysis. Most authors agree that BUE formation results in both geometrical and physical-chemical tool alterations that may affect the surface quality, usually evaluated through the arithmetical mean roughness (Ra) and the maximum height of the roughness profile (Rz). In [24], the influence of the cutting speed, feed and axial machining length on the surface roughness of dry turned UNS A97075 was studied. The authors concluded that the feed was the most influential variable on Ra. Its value tended to increase with the feed. No clear trend was found for the cutting speed. Additionally, a soft reduction of Ra with the tool wear and the cutting time was also observed, for low feed values along the axial machining length. The authors justified this behavior due to the geometric alterations that the BUE generated in the cutting edge and the tool footprint on the machined surface. However, the tool wear was less influential than the cutting parameters on the surface profile. Further studies were performed in order to analyze the cutting depth influence on Ra for the same alloy and under similar cutting conditions [25]. The experimental data revealed that its influence on surface roughness and tool wear was relatively low. A similar trend was obtained for Ra as a function of the cutting parameters for the UNS A92050 Al-Cu-Li alloy [26] and the UNS A92024 Al-Cu alloy [27]. Most of these studies obtained potential parametric models that allow predicting Ra and Rz as a function of the cutting parameters. A parametric analysis of the micro-hardness and surface roughness of dry-turned UNS A97075 alloy was performed in [28]. The authors concluded that Ra and Rz exhibited a similar trend with the cutting parameters. The feed was the most influential variable. Additionally, the periodic BUE growth and detachment gave rise to instabilities and vibrations in the machining that led to Rz increments. All these studies were carried out in a relatively low-speed range with respect to the values that are usually applied in the high-speed machining of aluminum alloys. These lows speed values are needed when wrought aluminum alloys are hybridized with other materials, such as carbon fiber reinforced polymers (CFRP) or titanium, to form fiber metal laminates (FML) [29].
Regarding the macro-geometrical deviations, this kind of analysis is less common. The influence of the cutting speed and feed on some form deviations of low slenderness parts has been studied. Salguero et al. [30] and Sánchez-Sola et al. [31] studied the cutting parameters’ influence on several geometrical deviations in the dry turning of the UNS A92024 alloy. The experimental results revealed that the most influential variable was the feed. With regard to the cutting speed, different trends were found, depending on the feed applied. In general, the worst results were obtained when high feeds and low cutting speeds were applied. In [32], a similar analysis was performed in the dry turning of the UNS A97075 alloy. The authors concluded that the sensibility to change with the cutting parameters was lower than for the surface roughness. No clear trend was found as a function of the cutting parameters. In these studies [30,31,32], the authors developed mathematical expressions that allow the evolution of some geometrical deviations to be obtained as a function of the cutting parameters, for low slenderness parts. These equations were of the exponential type.
For parts with high slenderness, more common in aeronautical applications [33], these studies revealed that the form deviations have a higher sensibility to change with the cutting parameters. Additionally, the feed was the most influential cutting parameter. Martín-Béjar et al. analyzed the influence of the cutting speed and feed on geometrical deviations in the dry turning of the UNS A97075 alloy for high-slenderness specimens. The highest tolerances were obtained when high feed and cutting speed values were combined [34,35]. In that work, a set of parametric equations (potential type) was obtained by the authors. These equations allow predicting the form deviations’ evolution under the studied conditions. However, they highlighted that it is necessary to include more variables in the equation to obtain higher accuracy.
The tool wear and the cutting time are variables to consider in this kind of analysis. Nevertheless, a lack of research that analyzes the tool wear and the cutting time influence on geometrical deviations has been found in the literature. Everything seems to indicate that the tool wear’s influence on the geometrical tolerances of these alloys, turned in dry conditions, is relatively small in absolute value. However, these small deviations may lead to a rejection of the part, due to the high quality demands of the aircraft’s structural parts. Hence, more studies are needed in order to identify whether the tool wear evolution throughout the cutting time significantly affects the geometrical tolerances. This is the main objective of this work.
Therefore, the cutting time and the tool wear influence on several form deviations (roundness, straightness and cylindricity) of dry-turned UNS A97075 alloy specimens is analyzed in this work. The cutting parameters’ influence on the tool wear and the main tool wear mechanisms were checked. Finally, a set of equations that allows one to obtain the form of deviation tolerances as a function of the cutting parameters and the cutting time, under the studied cutting conditions, was obtained.
It is necessary to highlight that the aim of these equations is not to obtain a general model that allows calculating the value of the geometric deviations under any cutting conditions. These types of general models are very difficult to obtain in machining, given the large number of variables involved in these processes and the synergy between them. However, these equations are easy to obtain and have an immediate practical application in the industry, since they allow obtaining, under the specified conditions, the values of the cutting parameters to manufacture fatigue test specimens, complying with the geometric tolerances required in the standards [6]. Given the special geometric characteristics of these specimens, the selected cutting parameters and the geometry of the tool used in this work are usually common in their manufacture.
Therefore, the main novelty of this work lies in the inclusion of the machining time and, indirectly, the tool wear in the study of the form of tolerances as a function of the cutting parameters, which has not been addressed in previous research. This kind of information is highly demanded by the industry.
2. Materials and Methods
Cylindrical bars (Ø20 mm) of the UNS A97075 (Al-Zn) alloy were used as raw material for this research. An Atomic Emission Spectroscopy equipment was used to get the alloy composition (Table 1).

Table 1.
Chemical composition of the tested alloy (weight%).
These bars were machined to obtain a final geometry as shown in Figure 1. This specimen design was selected according to the ISO 1143 standard specifications in order to reuse the specimens for subsequent fatigue behavior studies [6]. In addition, this design allows analyzing the evolution of form deviations in slender parts, which are less studied in the literature [35].
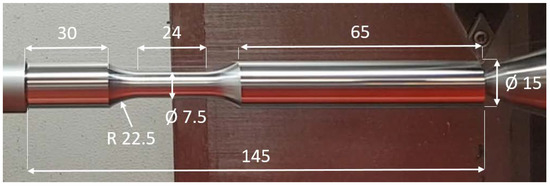
Figure 1.
Specimen geometry (dimensions in mm).
Turning was the selected machining operation because it is easy to perform and monitor. In addition, it minimizes the geometric variables involved in the process and simplifies the study. The specimen geometry was obtained in two steps. First, a roughing operation was performed under the same cutting conditions for every specimen. A thickness of one millimeter was left for the last finishing operation. In order to analyze the cutting parameters’ influence on the form deviations and the tool wear, the finishing step was carried out under different cutting speed (vc) and feed (f) values (Table 2). The cutting depth (ap) remained constant for every test.
Table 2.
Cutting parameters used in the tests.
It is necessary to highlight that low cutting speeds are not usual in the machining of this alloy. However, the UNS A97075 alloy is frequently used hybridized with other materials, such as carbon fiber reinforced polymers (CFRP) or titanium, to form composite materials for aircrafts’ structural components. These materials have to be machined under low cutting speeds [29].
A turning center was used to perform the machining tests, conducted under dry conditions (Figure 2). Inserts with ISO reference DCGT11T308-M3 were used to carry out the finishing step in the turning tests. The insert and the tool edge were made of cermet (uncoated tungsten carbide within a cobalt matrix, WC-Co), with grade HX. This material is recommended by the manufacturer (SECO tools) in the machining of wrought alloys (Si < 7%) for rough and semi-finish operations. A neutral geometry was selected (κr = κr’= 62.5°) in order to avoid collisions, given the geometrical features of the specimen. The tool geometry is shown in Figure 2d. The main parameters of the tool geometry are shown in Table 3.
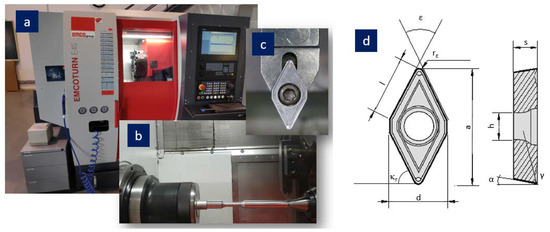
Figure 2.
Machining tests setup: (a) turning center; (b) machined specimen before the finishing operation; (c) cutting tool and tool holder; (d) tool geometry.
Table 3.
Tool geometry main parameters.
Additionally, this tool geometry allows comparing the experimental results with previous work in relation to the dry machining of this alloy, carried out by the authors within a wider research project. In these works, a parametric analysis of the surface roughness [24,25], geometrical deviations [32,34,35], micro-hardness [28], fatigue behavior [5], tool wear [22] and chip geometry [29] was performed, keeping the tool geometry constant.
A new tool was used to perform the last machining step for every cutting parameter combination (Table 2). In order to analyze the cutting time influence on the geometrical deviations, every test was repeated four times (R1, R2, R3 and R4), using the same tool. Hence, 48 machining tests were carried out and 12 inserts were used.
At the end of every finishing pass, the tool was removed from the tool holder and monitored. A Stereoscopic Optical Microscopy (SOM) equipment was used to observe the tool edge and the rake and flank face, with the aim of analyzing the tool wear intensity (Figure 3). A digital-image processing software (Omnimet BUEHLER, Lake Bluff, IL, USA) was used to measure the tool wear intensity on the tool rake face.
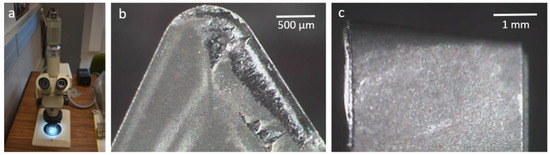
Figure 3.
Tool wear monitoring: (a) SOM equipment; (b) tool rake face SOM image; (c) tool edge and flank face SOM image.
A Scanning Electron Microscope was used to analyze the tool wear mechanisms. For this purpose, Scanning Electron Microscopy (SEM) and Energy Dispersive Spectroscopy (EDS) techniques were applied (Figure 4).
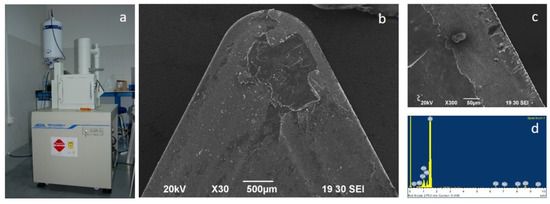
Figure 4.
SEM and EDS equipment: (a) scanning electron microscope; (b) tool rake face SEM image; (c) cutting edge SEM image; (d) EDS Spectrum.
After each machining test and before the next repetition, several form deviations were controlled for every specimen. A form-measuring machine was used for this purpose (Figure 5a). The analysis was focused on the most unfavorable section, with lower diameter (calibrated area). Specifically, the roundness (RON), the straightness (STR) and the cylindricity (CYL) of the calibrated area were measured (Figure 5b). With the aim of ensuring repeatability, several measurements were carried out along the specimen. The RON was controlled in six equidistant sections (S1–S6). The specimen roundness was expressed as the average result in these sections. The STR was controlled in four generatrixes (G1–G4) 90° apart, expressing the specimen straightness as the mean value. From these data, the CYL was calculated.
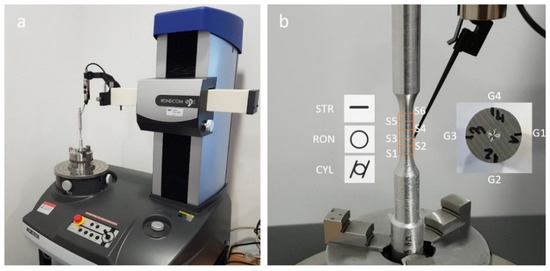
Figure 5.
(a) Form-measuring machine; (b) form deviations measurement in the calibrated area.
The Minimal Zone Circumscribing (MZC) was the centering method used, in order to get the minimum roundness error value. The sampling number was 14,400 pt. A low pass filter 2RC was applied to eliminate the high-frequency profile (roughness effect), using a 50 peaks/rotation along the rotational axis and a cut off (λc) of 0.8 mm along the rectilinear direction.
3. Results and Discussion
3.1. Tool Wear
Figure 6 and Figure 7 show SOM images of the tool rake face and the tool flank face for each cutting parameters combination (vc, f) and each repetition (from R1 to R4), respectively. In general, material adhesion to the tool edge (BUE) and the tool rake face (BUL) is observed in a wide range of vc and f. Therefore, the indirect adhesion wear (or secondary adhesion wear) appears to be the predominant tool wear mechanism. This wear is caused by the incorporation of work-piece material to the tool that gives rise to tool changes in the cutting area (both geometrical and material changes) [23]. The adhered material-to-tool edge (BUE) is very unstable due to the high plasticity of the alloy (high Zn%). The BUE grows to a critical thickness and is periodically extruded on the tool rake or detached from the cutting edge (Figure 8). Hence, the tool wear intensity is very difficult to evaluate through the BUE thickness measurement at the end of the machining test. The BUE may be growing after its extrusion, and its thickness might not represent the maximum. Therefore, the surface (S) of adhered material to the tool rake face has been measured to evaluate the tool wear intensity (Figure 9). This surface includes the primary BUL and the extruded BUE that gives rise to the secondary BUL [22,23]. It is necessary to point out that the main objective of this research is not to measure the tool wear with high accuracy but to establish a relationship between cutting time and the evolution of the tool wear and the geometrical deviations.
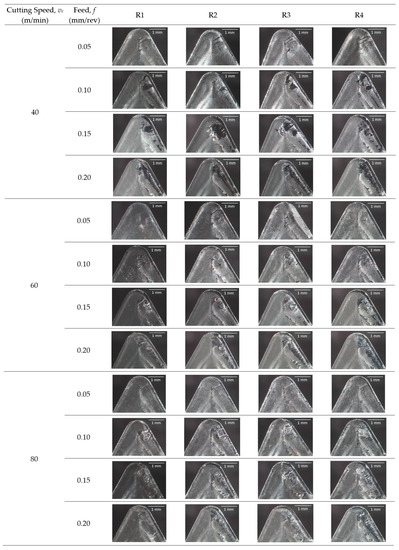
Figure 6.
SOM images (30×) of the tool rake face after machining test for each cutting parameters combination.
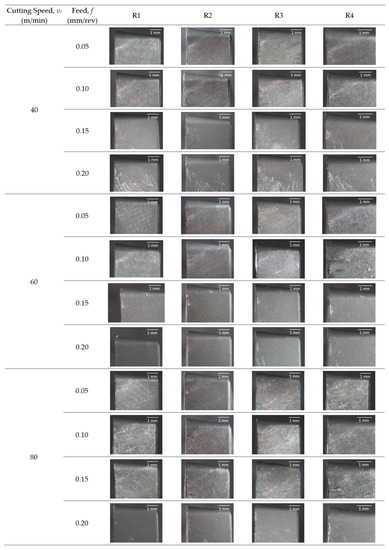
Figure 7.
SOM images (30–40×) of the tool flank face after machining test for each cutting parameters combination.
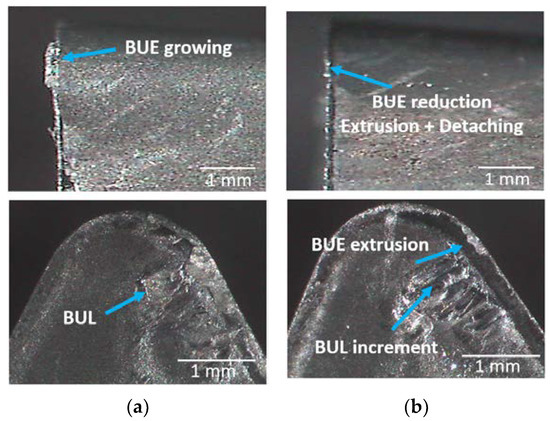
Figure 8.
SOM images of the flank and the rake tool face for vc = 80 m/min and f = 0.15 mm/rev; (a) R1; (b) R3.
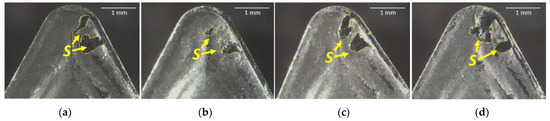
Figure 9.
S measurement on the tool rake face for vc = 40 m/min and f = 0.10 mm/rev; (a) R1; (b) R2; (c) R3; (d) R4.
Figure 10 shows the S evolution as a function of f and the repetitions Ri (R1 to R4), for every vc. Figure 6 and Figure 10 show the feed (f) as the most influential cutting parameter in the material adhesion phenomena. An increase in the material adhesion intensity was observed as the f value increased, throughout the range of vc.
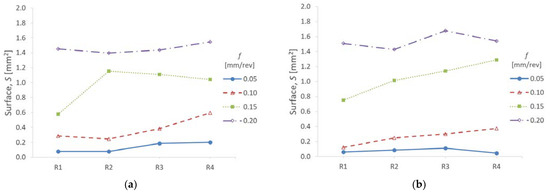
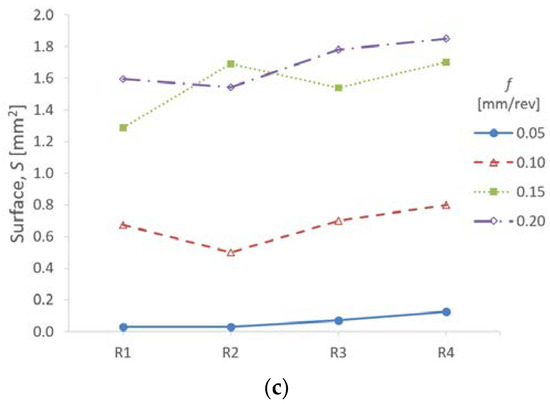
Figure 10.
S evolution for each repetition (Ri) as a function of f, for: (a) vc = 40 m/min; (b) vc = 60 m/min; (c) vc = 80 m/min.
For f = 0.05 mm/rev, the S value was very low, regardless of vc. The BUL was only present for vc = 40 m/min, with low intensity as well. For f = 0.10 and 0.15 mm/rev, the material adhesion was more evident in the full range of vc. However, the quantity of adhering material tended to decrease with vc. For f = 0.20 mm/rev, the adhesion mechanism was present with high intensity. Nevertheless, the intensity reduction with vc was less apparent than for 0.10 and 0.15 mm/rev.
With regard to vc, its influence on the indirect adhesion wear was lower. A general trend to increase BUL and BUE with vc was observed. This behavior was more apparent for intermediate f values (0.10 and 0.15 mm/rev).
All these observations can be explained by taking into account that the indirect adhesion wear occurs due to thermo-mechanical effects during the cutting process [22]. On one hand, as the feed increases, the chip section increases as well and, consequently, the cutting forces become higher. This causes adhesion of material on the cutting edge (BUE) by mechanical effects, which tends to extrude on the rake face (BUL). On the other hand, the increase in the cutting speed results in temperature increments in the cutting edge. This fact gives rise to a fast alloy melting, resulting in BUL formation in the first machining instants [25]. Nevertheless, the cutting speed increments facilitate the fast chip evacuation, and therefore, the generated heat at the cutting edge is removed more quickly. These two opposite effects make the cutting speed less influential on adhesion than feed, under the studied cutting conditions.
Regarding the tool wear evolution with the cutting time (repetitions from R1 to R4), for f = 0.05 mm/rev, no significant evolution of the tool wear intensity was observed within the whole vc range analyzed. For f = 0.10 mm/rev, the S increment was more evident for vc = 40 and 60 m/min. This increment was slightly lower for vc = 80 m/min. For f = 0.15 mm/rev, an increment in the tool wear intensity was observed, mainly for vc = 40 m/min. This increment was softer for vc = 60 and 80 m/min. In addition, for vc = 40 m/min, a soft reduction of S was observed from R2 to R4, maybe due to the material detaching. For f = 0.20 mm/rev, the tool wear intensity was high from R1 to R4 and no significant evolution with the cutting time was observed.
Hence, the effect of the cutting time on the evolution of tool wear was more appreciable in the intermediate range of f (0.10 and 0.15 mm/rev), for which the BUE was growing and evolving to form BUL, which was finally extruded on the tool rake face. This effect was less noticeable for low and high f (0.05 and 0.20 mm/rev), for which the tool wear intensity was very low or high, respectively, from the first repetition.
In addition, an adhered material instability was observed along the cutting time. This can be explained because the BUE grows to a critical size and then is extruded along the rake face. This behavior is repeated periodically, giving rise to material detaching over time [24,25].
With regard to the flank face, Figure 7 shows abrasion on the tool flank face due to chip friction and particles from the alloy that strike and adhere to the tool surface. The abrasion intensity was higher at high vc and low f. This fact can be explained considering that the chip morphology tends to be longer (leading to chip nest formation) for low f and high vc, as shown in Figure 11. Under these conditions, the chip friction and abrasion were higher. This fact worsened with the machining time. The f increments and the vc reductions result in increases in the cutting forces, and therefore the chip fragmentation becomes easier. As a result, the abrasion effect is reduced. This behavior was similar in the whole range of the analyzed cutting parameters.
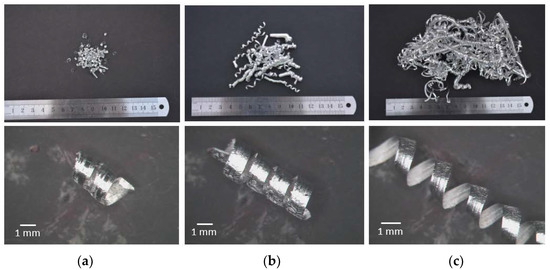
Figure 11.
Chip morphology for: (a) vc = 40 m/min, f = 0.15 mm/rev; (b) vc = 60 m/min, f = 0.10 mm/rev; (c) vc = 80 m/min, f = 0.05 mm/rev.
To check the tool wear mechanisms, several SEM and EDS analyses were performed on the tool rake face, the edge and the flank face. A set of tests, for which the complete tool wear mechanism can be clearly appreciated (primary BUL, BUE and secondary BUL formation), was selected. Figure 12 shows SEM images of the tool rake face for one of the tests. Four different points (spectrums S1 to S4) were selected to perform an EDS analysis in those areas where material adhesion was present. A close area to the cutting edge (spectrums S1 and S2) and an area on the tool rake face (spectrums S3 and S4) were analyzed. Figure 13 shows the SEM and EDS analysis on the tool flank face. A point (spectrum S5) with signs of abrasive wear was selected. The EDS results (S1 to S5) are shown in Table 4. The alloy composition is added to compare it with the spectrum’s composition (weight%).
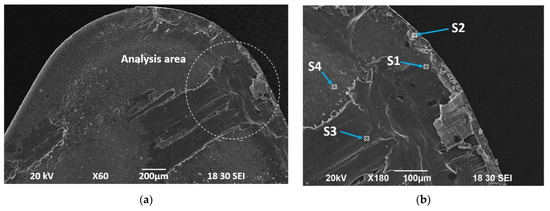
Figure 12.
Tool rake face SEM image for vc = 40 m/min, f = 0.05 mm/rev, R4; (a) analysis area; (b) spectrums (analyzed points).
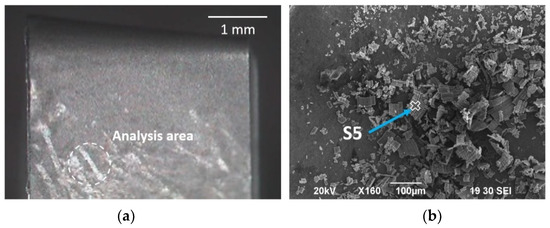
Figure 13.
(a) SOM image (40×) of the tool flank face, for vc = 40 m/min, f = 0.20 mm/rev and R1; (b) EDS Spectrum analyzed point.
Table 4.
Spectrum composition (wt%).
Spectrum 1 (S1) shows the presence of Al, intermetallic elements (Zn, Mg, Cu, etc.) and tool components (W, C and Co). The amount of pure aluminum is proportionally higher than the alloy while there is a lower content of intermetallics elements. This area corresponds to the formation of a first layer of BUL in the first machining moments. The aluminum matrix has a lower melting point and forms a thin layer of almost pure Al, whereas the intermetallics elements, with a higher melting point, are removed along with the chip. This primary BUL is formed due to thermal effects [24,25].
Spectra 2 and 3 (S2, S3) present a proportion of elements very close to the machined alloy composition. Once the primary BUL has formed, the BUE begins to grow in the tool edge mainly due to mechanical effects (S2). When the thickness reaches a critical value, the BUE is extruded along the tool rake face to form a secondary BUL (S3) due to the high Zn alloy content that provides it with high ductility. Consequently, this secondary BUL is formed due to mechanical effects. Spectrum 4 corresponds to a zone free of material adhesion on the tool rake face.
Spectrum 5 (S5) shows a similar composition to the alloy and corresponds to adhered particles from the chip. These particles hit the surface and detach over the time, giving rise to surface abrasion.
This analysis was extended to an additional set of tests with different cutting conditions, finding very similar results. Therefore, the indirect adhesion wear was the most important tool wear mechanism, both on the tool rake face and in the tool edge, caused by thermo-mechanical effects. On the other hand, the abrasion was the most important tool-wear mechanism on the tool flank face, but with lower intensity than the BUL and BUE. These observations are in good agreement with previous works in this regard [22,23].
3.2. Form Deviations
Figure 14 shows the roundness (RON) mean values as a function of f and the repetitions Ri (R1 to R4) for every vc. In general, f was the most influential variable on RON, which tended to increase with f regardless of vc. These increments reached around 2 and 2.5 times the RON value, depending on the f applied. Increases in f give rise to an increase in the cutting forces that tend to cause greater deformation in the machined parts, especially in highly slender parts. In addition, the f increment results in higher tool wear (BUE and BUL formation) and instabilities along the cutting process.
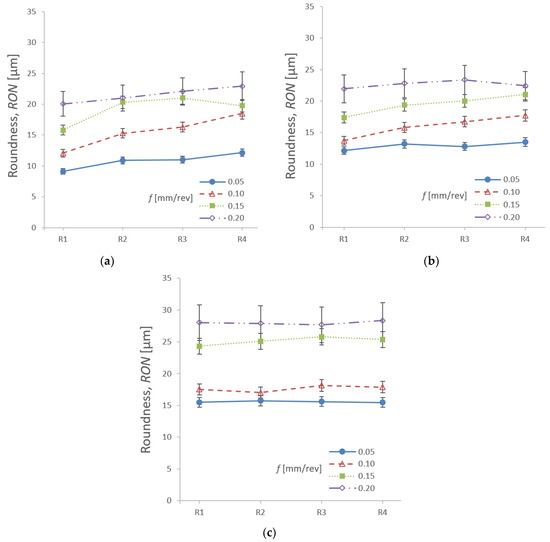
Figure 14.
Roundness evolution for each repetition (Ri) as a function of f, for: (a) vc = 40 m/min; (b) vc = 60 m/min; (c) vc = 80 m/min.
Although the roundness values were relatively low and the differences in absolute value were not very large (approximately between 8 and 32 μm), these differences may make a part rejectable, taking into account the high level of quality requirements in aeronautical parts.
With regard to vc, RON showed a general trend to increase with vc, but these increments were softer than for f. Only for vc = 80 m/min and f = 0.15 and 0.20 mm/rev were these increments more noticeable, reaching maximum values when high values of f and vc were combined. On one hand, vc increments result in higher main spindle rotation speed, which may cause higher vibrations and increase this form deviation. On the other hand, the increase in vc reduces the tool wear (less material adhesion), which may improve the RON evolution. These two effects are combined and make the influence of vc on RON softer than the influence of f.
Regarding the RON evolution with the cutting time (repetitions R1 to R4) for vc = 40 and 60 m/min and low f (0.05 mm/rev) or high f (0.20 mm/rev), a soft trend to increase RON with the cutting time was observed. The RON showed increments around 30% for f = 0.05 mm/rev and around 15% for f = 0.20 mm/rev. Nevertheless, these increments were more noticeable in the intermediate range of f tested (0.10 and 0.15 mm/rev), reaching increases of up to 40% in some cases. For vc = 80 m/min, the RON increments with the number of repetitions was softer and showed a general trend to remain constant in a wide range of f.
These observations may be explained due to the effect of tool wear in the cutting conditions and its evolution with the cutting parameters. The material adhesion gives rise to alterations in the starting cutting conditions (higher chip section and shear angle), which give rise to cutting force increments [20,26]. Furthermore, the BUE and BUL grow and detach periodically, causing instabilities and vibrations during the cutting process, which may cause an increment in form deviations [25].
For vc = 40 and 60 m/min and f = 0.05 mm/rev, the material adhesion intensity was very low, and its variation with the cutting time was almost negligible (Figure 6 and Figure 10). For vc = 40 and 60 m/min and f = 0.20 mm/rev, the tool wear intensity was high from the first repetition and remained more or less constant throughout the machining time. Therefore, the tool wear evolution with the cutting time was soft for these cutting parameters combinations, and its influence on RON was low.
For vc = 40 and 60 m/min and f = 0.10 and 0.15 mm/rev, a progressive increment in the material adhesion intensity with the cutting time was observed. Hence, RON was more affected within this range. For vc = 80 m/min, the indirect adhesion wear intensity and its evolution along the repetitions were lower. Therefore, the tool wear influence on RON was softer in the whole range of f.
Figure 15 shows the straightness (STR) and cylindricity (CYL) mean values as a function of f and the repetitions Ri for every vc. A very similar evolution to RON was observed for both form deviations. Hence, comments and discussions previously made for RON may be extrapolated for STR and CYL.
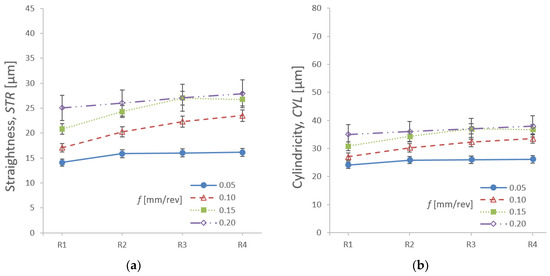
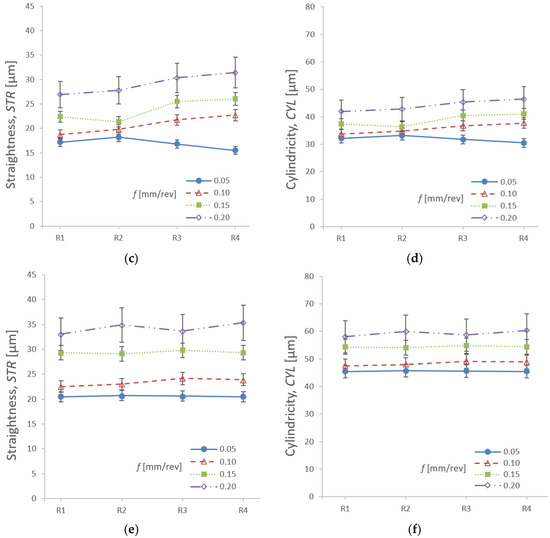
Figure 15.
Straightness and cylindricity evolution for each repetition (Ri) as a function of f, for: (a,b) vc = 40 m/min; (c,d) vc = 60 m/min; (e,f) vc = 80 m/min.
The STR absolute values were slightly higher than for RON, ranging from 14 to 37 μm (depending on f, vc and Ri). The way in which STR is measured (along the entire calibrated area) compared to roundness (six cross-sections of the calibrated area) makes it more sensitive to surface profile variations. However, the percentage variation with vc, f and Ri was very similar that for RON.
Regarding the CYL, the absolute values for this form deviation were the highest, varying from 23 to 65 μm (depending on the cutting parameters’ values and repetitions). As observed for STR, the percentage variation with the studied variables (vc, f and Ri) was very similar to that for RON. This form deviation includes both the RON and the STR effects, and hence its value is higher. In addition, the influence of vc was higher than for RON and STR. This form deviation involves a volumetric tolerance zone and is more sensitive to any change or instability along the machining process.
Figure 16 plots the form deviations (RON, STR and CYL) as a function of f and vc, for the first repetition, R1. In this figure, a clear dependence of the three form deviations on the cutting parameters is observed. RON, STR and CYL tend to increase with vc and f, and the worst results are obtained when the highest values of vc and f are combined. The influence of f is clearly higher than vc for RON and STR, whereas the influence of vc and f becomes more equilibrated for CYL. A similar trend was found for R2, R3 and R4.
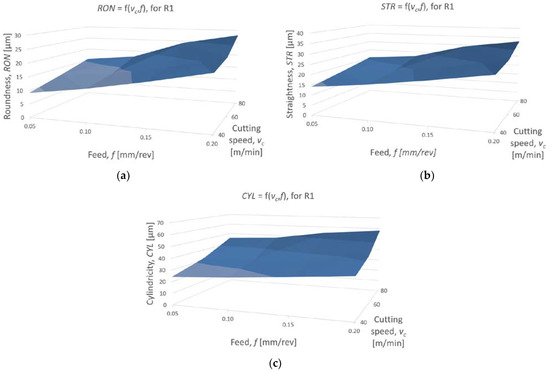
Figure 16.
(a) Roundness, (b) straightness and (c) cylindricity as a function of the cutting parameters (f, vc), for R1.
Figure 17 shows the form deviations’ evolution as a function of the cutting time (tc), for each vc and f combination. The highest slopes are obtained when values of vc = 40 and 60 m/min and values of f = 0.10 and 0.15 mm/rev are combined. Therefore, under these cutting conditions, the influence of tc and, therefore, the influence of tool wear on the form deviations is higher. For vc = 80 m/min (within the whole f range) and for f = 0.05 and 0.20 mm/rev, the slope is lower, in general. Hence, the dependence on tc and tool wear is also lower.
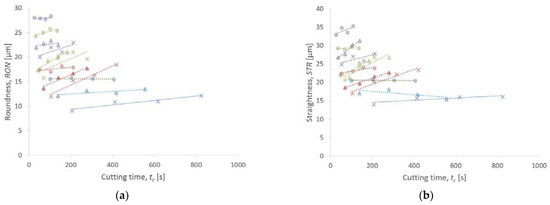
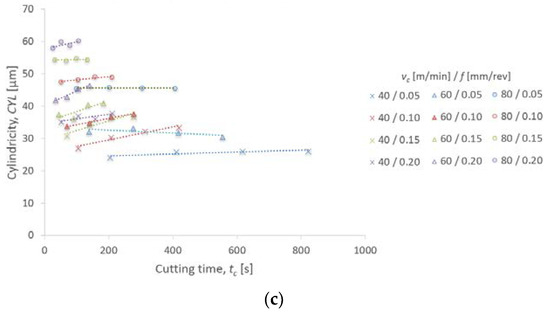
Figure 17.
Form deviations evolution as a function of the cutting time and the cutting parameters: (a) roundness; (b) straightness; (c) cylindricity.
From the experimental data, it was possible to obtain a mathematical expression to calculate the form deviations (FD) as a function of vc, f and tc. The mathematical expressions found in the literature review, regarding the parametric analysis of the geometrical deviations in the dry machining of this alloy, were exponential and potential equations [30,31,32,34]. In this work, a similar exponential equation to the one described in [32] was tested, without success, due to convergence problems. A potential equation (Equation (1)), as proposed in [34], was also tested. This kind of equations (potential or Taylor equations) is widely used in machining in order to explain the output variables behavior as a function of the cutting parameters (input variables).
FD = K∙ vc x ∙ f y ∙ tc z
Equation (1) can be expressed in log form as follows (Equation (2)):
Log (FD) = log (K) + x ∙ log (vc) + y ∙ log (f) + z ∙ log (tc)
From Equation (2), the model coefficients (K, x, y and z) were obtained by multivariate linear regression (least-squares fit method). The coefficients’ values for each form deviation (roundness, straightness and cylindricity) are shown in Table 5, as well as the regression statistical data. The adjusted coefficient of determination (adjusted R2) showed a reasonable fit for all FD (0.90 for RON, 0.88 for STR and 0.86 for CYL).
Table 5.
Model coefficients and regression statistics.
The y coefficient shows a higher value than x for RON and STR (between 17% and 25% higher), which indicates that f has a higher influence on these deviations than vc. However, the x coefficient was slightly higher than y for CYL. Hence, the influence of both cutting parameters was more equilibrated for this form deviation. In addition, the z value was lower than x and y. Therefore, the influence of tc was lower than the cutting parameters. Nevertheless, this coefficient allows modulating the effect of tc on FD and, therefore, considering the tool wear effect on FD. All these values are in good agreement with the experimental observations and previous discussions.
This kind of parametric equation is highly demanded by the industry because it allows predicting the geometrical deviation value as a function of the main input variables of the process (vc and f) under the analyzed conditions. The inclusion of the cutting time effect and, in an indirect way, the tool wear effect on the geometrical tolerances, is the main novelty of these equations. Therefore, it may be useful to select the correct combination of cutting parameters and cutting time to avoid exceeding geometrical tolerances, which are usually very demanding in the aeronautical sector.
4. Conclusions
The influence of tool wear on several form deviations (roundness, straightness and cylindricity) of dry-turned UNS A97075 alloy specimens has been studied in this work. The influence of the cutting speed and feed on the tool wear intensity has been assessed, as well as the analysis of the predominant tool wear mechanisms.
The indirect adhesion wear was the main tool wear mechanism within a wide range of analyzed cutting parameters values. BUE and BUL were observed in the tool edge and on the tool rake face, respectively, formed due to thermo-mechanical effects. The feed was the most influential parameter on the tool wear intensity. The cutting speed was less influential. These observations were in good agreement with previous works under similar conditions.
The evolution of the tool wear intensity with the cutting time was less relevant for the lowest (0.05 mm/rev) and the highest (0.20 mm/rev) feed, with very low or very high tool wear intensity, respectively. Nevertheless, this influence was higher for the intermediate range of feed analyzed (0.10 and 0.20 mm/rev). Within this range, the cutting time increments resulted in higher material adhesion.
The analyzed form deviations (roundness, straightness and cylindricity) showed a general trend to increase with the feed and the cutting speed. The worst results were obtained when the highest feed (0.20 mm/rev) and cutting speed (80 m/min) were combined. The feed was the most influential cutting parameter on most form deviations. Only for the cylindricity did the cutting speed show a similar influence on the feed.
The cutting time effect on the geometrical tolerances was assessed. The analyzed form deviations exhibited a general trend to remain constant with the cutting time for the lowest (0.05 mm/rev) and the highest (0.20 mm/rev) feed values, regardless of the cutting speed. However, the form deviations tended to increase with the cutting time for the intermediate range of feed (0.10 and 0.20 mm/rev). This behavior can be related to the tool wear evolution throughout the cutting time. Therefore, under this intermediate feed range, the cutting time becomes more relevant and may cause a part to exceed supported tolerance values.
The main novelty of this work lies in the inclusion of the machining time and, indirectly, the tool wear in the study of the form tolerances as a function of the cutting parameters, which has not been addressed in previous research. In addition, a set of parametric equations, which allows predicting the analyzed form deviations as a function of the cutting parameters and the cutting time, has been obtained. The main objective of these equations is not to obtain a general behavior model, which is very difficult due to the large number of variables involved in machining. However, these equations have an immediate practical application in the industry. They allow selecting the cutting parameters’ values to manufacture fatigue test specimens, complying with the geometric tolerances required in the standards. Given the special geometric characteristics of these specimens, the cutting parameters and the tool geometry used in this work are usually common in their manufacture.
It is necessary to highlight that these results are valid within the cutting conditions tested, and it is only an additional, but necessary, step in the knowledge of the dry machining of this alloy. Further research is needed to test a wider range of cutting parameters, tools and specimen geometries to confirm these trends. The authors are currently planning these new tests. The results presented in this work are highly useful for planning and optimizing them.
Author Contributions
Conceptualization, F.J.T.V., S.M.B. and L.S.H.; methodology, F.J.T.V. and S.M.B.; data curation, S.M.B. and M.H.F.; writing—original draft preparation, F.J.T.V.; writing—review and editing, F.J.T.V., S.M.B., C.B.G., M.H.F. and L.S.H.; supervision, L.S.H.; All authors have read and agreed to the published version of the manuscript.
Funding
This research received no external funding.
Institutional Review Board Statement
Not applicable.
Informed Consent Statement
Not applicable.
Data Availability Statement
Not applicable.
Acknowledgments
The authors thank the University of Malaga-Andalucia Tech Campus of International Excellence for its economic contribution to this paper.
Conflicts of Interest
The authors declare no conflict of interest.
Abbreviations
| BUE | built-up edge |
| BUL | built-up layer |
| CFRP | carbon fiber reinforced polymers |
| CYL | cylindricity |
| EDS | energy dispersive spectroscopy |
| FD | form deviation |
| HCP | high-pressure coolant |
| MQL | minimum quantity of lubrication |
| RON | roundness |
| SEM | scanning electron microscopy |
| SOM | stereoscopic optical microscopy |
| STR | straightness |
| MZC | minimal zone circumscribing |
Nomenclature
| Ra | arithmetical mean roughness |
| Rz | maximum height of the roughness profile |
| vc | cutting speed |
| f | feed |
| ap | cutting depth |
| α | tool clearance angle |
| γ | tool rake angle |
| ε | tool included angle |
| rε | nose radius |
| κr | main cutting edge angle |
| κr’ | secondary cutting edge angle |
| d | tool width |
| l | cutting edge length |
| a | tool length |
| h | tool fixing hole diameter |
| s | tool thickness |
| Ri | test repetition (i = 1 to 4) |
| Si | roundness measurement section (i = 1 to 6) |
| Gi | straightness measurement generatrix (i = 1 to 4) |
| λc | cut off |
| S | adhered material surface to the tool rake face |
| tc | cutting time |
| K | form deviations model constant |
| x | cutting speed coefficient |
| y | feed coefficient |
| z | cutting time coefficient |
| R2 | coefficient of determination |
References
- Wiesner, C.; Künzi, H.U.; Ilschner, B. Characterization of the topography of turned surfaces and its influence on the fatigue life of Al-7075. Mater. Sci. Eng. A 1991, 145, 151–158. [Google Scholar] [CrossRef]
- Clares, J.M.; Vazquez, J.M.; Gomez-Parra, A.; Puerta, F.J.; Marcos, M. Experimental methodology for evaluating workpieces surface integrity in dry turning of aerospace alloys. In Proceedings of the 26th DAAAM International Symposium on Intelligent Manufacturing and Automation, Zadar, Croatia, 21–24 October 2015; pp. 0849–0855. [Google Scholar]
- ISO 1101:2017. Geometrical Product Specifications (GPS)—Geometrical Tolerancing—Tolerances of Form, Orientation, Location and Run-Out; International Organization for Standardization: Geneva, Switzerland, 2017. [Google Scholar]
- Umamaheswara, R.S.; Ramesh, R.; Rohit, K. Development of surface texture evaluation system for highly sparse data-driven machining domains. Int. J. Comput. Integr. Manuf. 2020, 33, 859–868. [Google Scholar] [CrossRef]
- Martín-Béjar, S.; Trujillo, F.J.; Bermudo, C.; Sevilla, L. Fatigue behavior parametric analysis of dry machined UNS A97075 aluminum alloy. Metals 2020, 10, 631. [Google Scholar] [CrossRef]
- ISO ISO 1143:2010. Metallic Materials—Rotating bar Bending Fatigue Testing; International Organization for Standardization: Geneva, Switzerland, 2010. [Google Scholar]
- Sánchez, M.; Marcos, M. On the machinability of aluminium and aluminium alloys. J. Mech. Behav. Mater. 1996, 7, 179–193. [Google Scholar]
- Santos, M.C.; Machado, A.R.; Sales, W.F.; Barrozo, M.A.S.; Ezugwu, E.O. Machining of aluminum alloys: A review. Int. J. Adv. Manuf. Technol. 2016, 86, 3067–3080. [Google Scholar] [CrossRef]
- Khettabi, R.; Nouioua, M.; Djebara, A.; Songmene, V. Effect of MQL and dry processes on the particle emission and part quality during milling of aluminum alloys. Int. J. Adv. Manuf. Technol. 2017, 92, 2593–2598. [Google Scholar] [CrossRef]
- Krolczyk, G.M.; Maruda, R.W.; Krolczyk, J.B.; Wojciechowski, S.; Mia, M.; Nieslony, P.; Budzik, G. Ecological trends in machining as a key factor in sustainable production—A review. J. Clean. Prod. 2019, 218, 601–615. [Google Scholar] [CrossRef]
- Sugihara, T.; Nishimoto, Y.; Enomoto, T. New production technologies in aerospace industry—5th machining innovations conference (MIC 2014) on-machine tool resharpening for dry machining of aluminum alloys. In Procedia CIRP; Elsevier B.V.: Amsterdam, The Netherlands, 2014; Volume 24, pp. 68–73. [Google Scholar]
- Sarikaya, M.; Gupta, M.K.; Tomaz, I.; Danish, M.; Mia, M.; Rubaiee, S.; Jamil, M.; Pimenov, D.Y.; Khanna, N. Cooling techniques to improve the machinability and sustainability of light-weight alloys: A state-of-the-art review. J. Manuf. Process. 2021, 62, 179–201. [Google Scholar] [CrossRef]
- Kopac, J.; Krolczyk, G. Cryogenic machining, surface integrity and machining performance. Arch. Mater. Sci. Eng. 2015, 71, 83–93. [Google Scholar]
- Gupta, M.K.; Mia, M.; Singh, G.; Pimenov, D.Y.; Sarikaya, M.; Sharma, V.S. Hybrid cooling-lubrication strategies to improve surface topography and tool wear in sustainable turning of Al 7075-T6 alloy. Int. J. Adv. Manuf. Technol. 2018, 101, 55–69. [Google Scholar] [CrossRef]
- Goindi, G.S.; Sarkar, P. Dry machining: A step towards sustainable machining—Challenges and future directions. J. Clean. Prod. 2017, 165, 1557–1571. [Google Scholar] [CrossRef]
- Grzesik, W. 15.2—Dry and semi-dry machining. In Advanced Machining Processes of Metallic Materials; Elsevier: Amsterdam, The Netherlands, 2008; pp. 226–245. ISBN 978-0-08-044534-2. [Google Scholar]
- Hamed, M.; Zedan, Y.; Samuel, A.M.; Doty, H.W.; Samuel, F.H. Effect of tool quality on the machinability characteristics of Al-Cu and Al-Si cast alloys. Int. J. Adv. Manuf. Technol. 2020, 106, 1317–1326. [Google Scholar] [CrossRef]
- Il, A.; Chatelain, J.F.; Lalonde, J.F.; Balazinski, M.; Rimpault, X. An experimental investigation of the influence of cutting parameters on workpiece internal temperature during Al2024-T3 milling. Int. J. Adv. Manuf. Technol. 2018, 97, 413–426. [Google Scholar] [CrossRef]
- Carrilero, M.S.; Bienvenido, R.; Sánchez, J.M.; Álvarez, M.; González, A.; Marcos, M. A SEM and EDS insight into the BUL and BUE differences in the turning processes of AA2024 Al–Cu alloy. Int. J. Mach. Tools Manuf. 2002, 42, 215–220. [Google Scholar] [CrossRef]
- Batista, M.; Salguero, J.; Gómez, A.; Álvarez, M.; Marcos, M. Image based analysis evaluation of the elements of secondary adhesion wear in dry turning of aluminum alloys. Adv. Mater. Res. 2012, 498, 133–138. [Google Scholar] [CrossRef]
- Batista, M.; Del Sol, I.; Fernandez-Vidal, S.; Salguero, J. Experimental parametric model for adhesion wear measurements in the dry turning of an AA2024 alloy. Materials 2018, 11, 1598. [Google Scholar] [CrossRef] [PubMed]
- Trujillo, F.J.; Sevilla, L.; Marcos, M. Experimental parametric model for indirect adhesion wear measurement in the dry turning of UNS A97075 (Al-Zn) alloy. Materials 2017, 10, 152. [Google Scholar] [CrossRef]
- Gómez-Parra, A.; Álvarez-Alcón, M.; Salguero, J.; Batista, M.; Marcos, M. Analysis of the evolution of the Built-Up Edge and Built-Up Layer formation mechanisms in the dry turning of aeronautical aluminium alloys. Wear 2013, 302, 1209–1218. [Google Scholar] [CrossRef]
- Trujillo, F.J.; Sevilla, L.; Marcos, M. Influence of the axial machining length on microgeometrical deviations of horizontally dry-turned UNS A97075 Al-Zn alloy. Procedia Eng. 2013, 63, 405–412. [Google Scholar] [CrossRef]
- Trujillo, F.J.; Sevilla, L.; Salguero, J.; Batista, M.; Marcos, M. Parametric potential model for determining the micro-geometrical deviations of horizontally dry-turned UNS A97075 (Al-Zn) alloy. Adv. Sci. Lett. 2013, 19, 731–735. [Google Scholar] [CrossRef]
- Salguero, J.; Puerta, F.J.; Gomez-Parra, A.; Trujillo, F.J.; Sevilla, L.; Marcos, M. An analysis of geometrical models for evaluating the influence of feed rate on the roughness of dry turned UNS A92050 (Al-Cu-Li) alloy. Adv. Mater. Process. Technol. 2016, 2, 578–589. [Google Scholar] [CrossRef]
- Salguero, J.; Gómez, A.; Carrilero, M.S.; Batista, M.; Álvarez, M. Roughness prediction models for tangential cutting forces in the dry turning of Al-Cu alloys. In Proceedings of the 14th International Conference on Advances in Material Processing Technologies AMPT, Istambul, Turkey, 13–16 July 2011; Volume 1. [Google Scholar]
- Martín-Béjar, S.; Trujillo Vilches, F.J.; Bermudo Gamboa, C.; Sevilla Hurtado, L. Cutting speed and feed influence on surface microhardness of Dry-Turned UNS A97075-T6 Alloy. Appl. Sci. 2020, 10, 1049. [Google Scholar] [CrossRef]
- Trujillo, F.J.; Sevilla, L.; Martín, F.; Gamboa, C. Analysis of the chip geometry in dry machining of aeronautical aluminum alloys. Appl. Sci. 2017, 7, 132. [Google Scholar] [CrossRef]
- Salguero, J.; Sanchez, J.M.; Sebastian, M.A.; Sanchez-Carrilero, M.; Marcos, M. Cutting speed and feed based model for evaluating parallelism deviations in horizontal dry turning of aluminium alloys. Ann. Daaam Proc. 2010, Volume 1, 719–720. [Google Scholar]
- Sánchez, J.M.; Batista, M.; Salguero, J.; Gómez, A.; Marcos, M. Cutting speed-feed based parametric model for macro-geometrical deviations in the dry turning of UNS A92024 Al-Cu alloys. Key Eng. Mater. 2012, 504–506, 1311–1316. [Google Scholar] [CrossRef]
- Trujillo, F.J.; Sevilla, L.; Marcos, M. Cutting speed-feed coupled experimental model for geometric deviations in the dry turning of UNS A97075 Al-Zn alloys. Adv. Mech. Eng. 2014, 6, 382435. [Google Scholar] [CrossRef]
- Li, B.; Cao, Y.; Ye, X.; Guan, J.; Yang, J. Multi-scale prediction of the geometrical deviations of the surface finished by five-axis ball-end milling. Proc. Inst. Mech. Eng. Part B J. Eng. Manuf. 2017, 231, 1685–1702. [Google Scholar] [CrossRef]
- Martín-Béjar, S.; Trujillo, F.J.; Bermudo, C.; Sevilla, L. Parametric analysis of macro-geometrical deviations in dry turning of UNS A97075 (Al-Zn) alloy. Metals 2019, 9, 1141. [Google Scholar] [CrossRef]
- Martín-Béjar, S.; Trujillo, F.J.; Bermudo, C.; Sevilla, L. Cutting parameters influence on total run-out of dry machined UNS A97075 alloy parts. Procedia Manuf. 2019, 41, 835–842. [Google Scholar] [CrossRef]


Publisher’s Note: MDPI stays neutral with regard to jurisdictional claims in published maps and institutional affiliations. |
© 2021 by the authors. Licensee MDPI, Basel, Switzerland. This article is an open access article distributed under the terms and conditions of the Creative Commons Attribution (CC BY) license (https://creativecommons.org/licenses/by/4.0/).