
Strategy for Surface Post-Processing of AISI 316L Additively Manufactured by Powder Bed Fusion Using Ultrasonic Nanocrystal Surface Modification


Abstract
1. Introduction
2. Materials and Methods
2.1. Materials
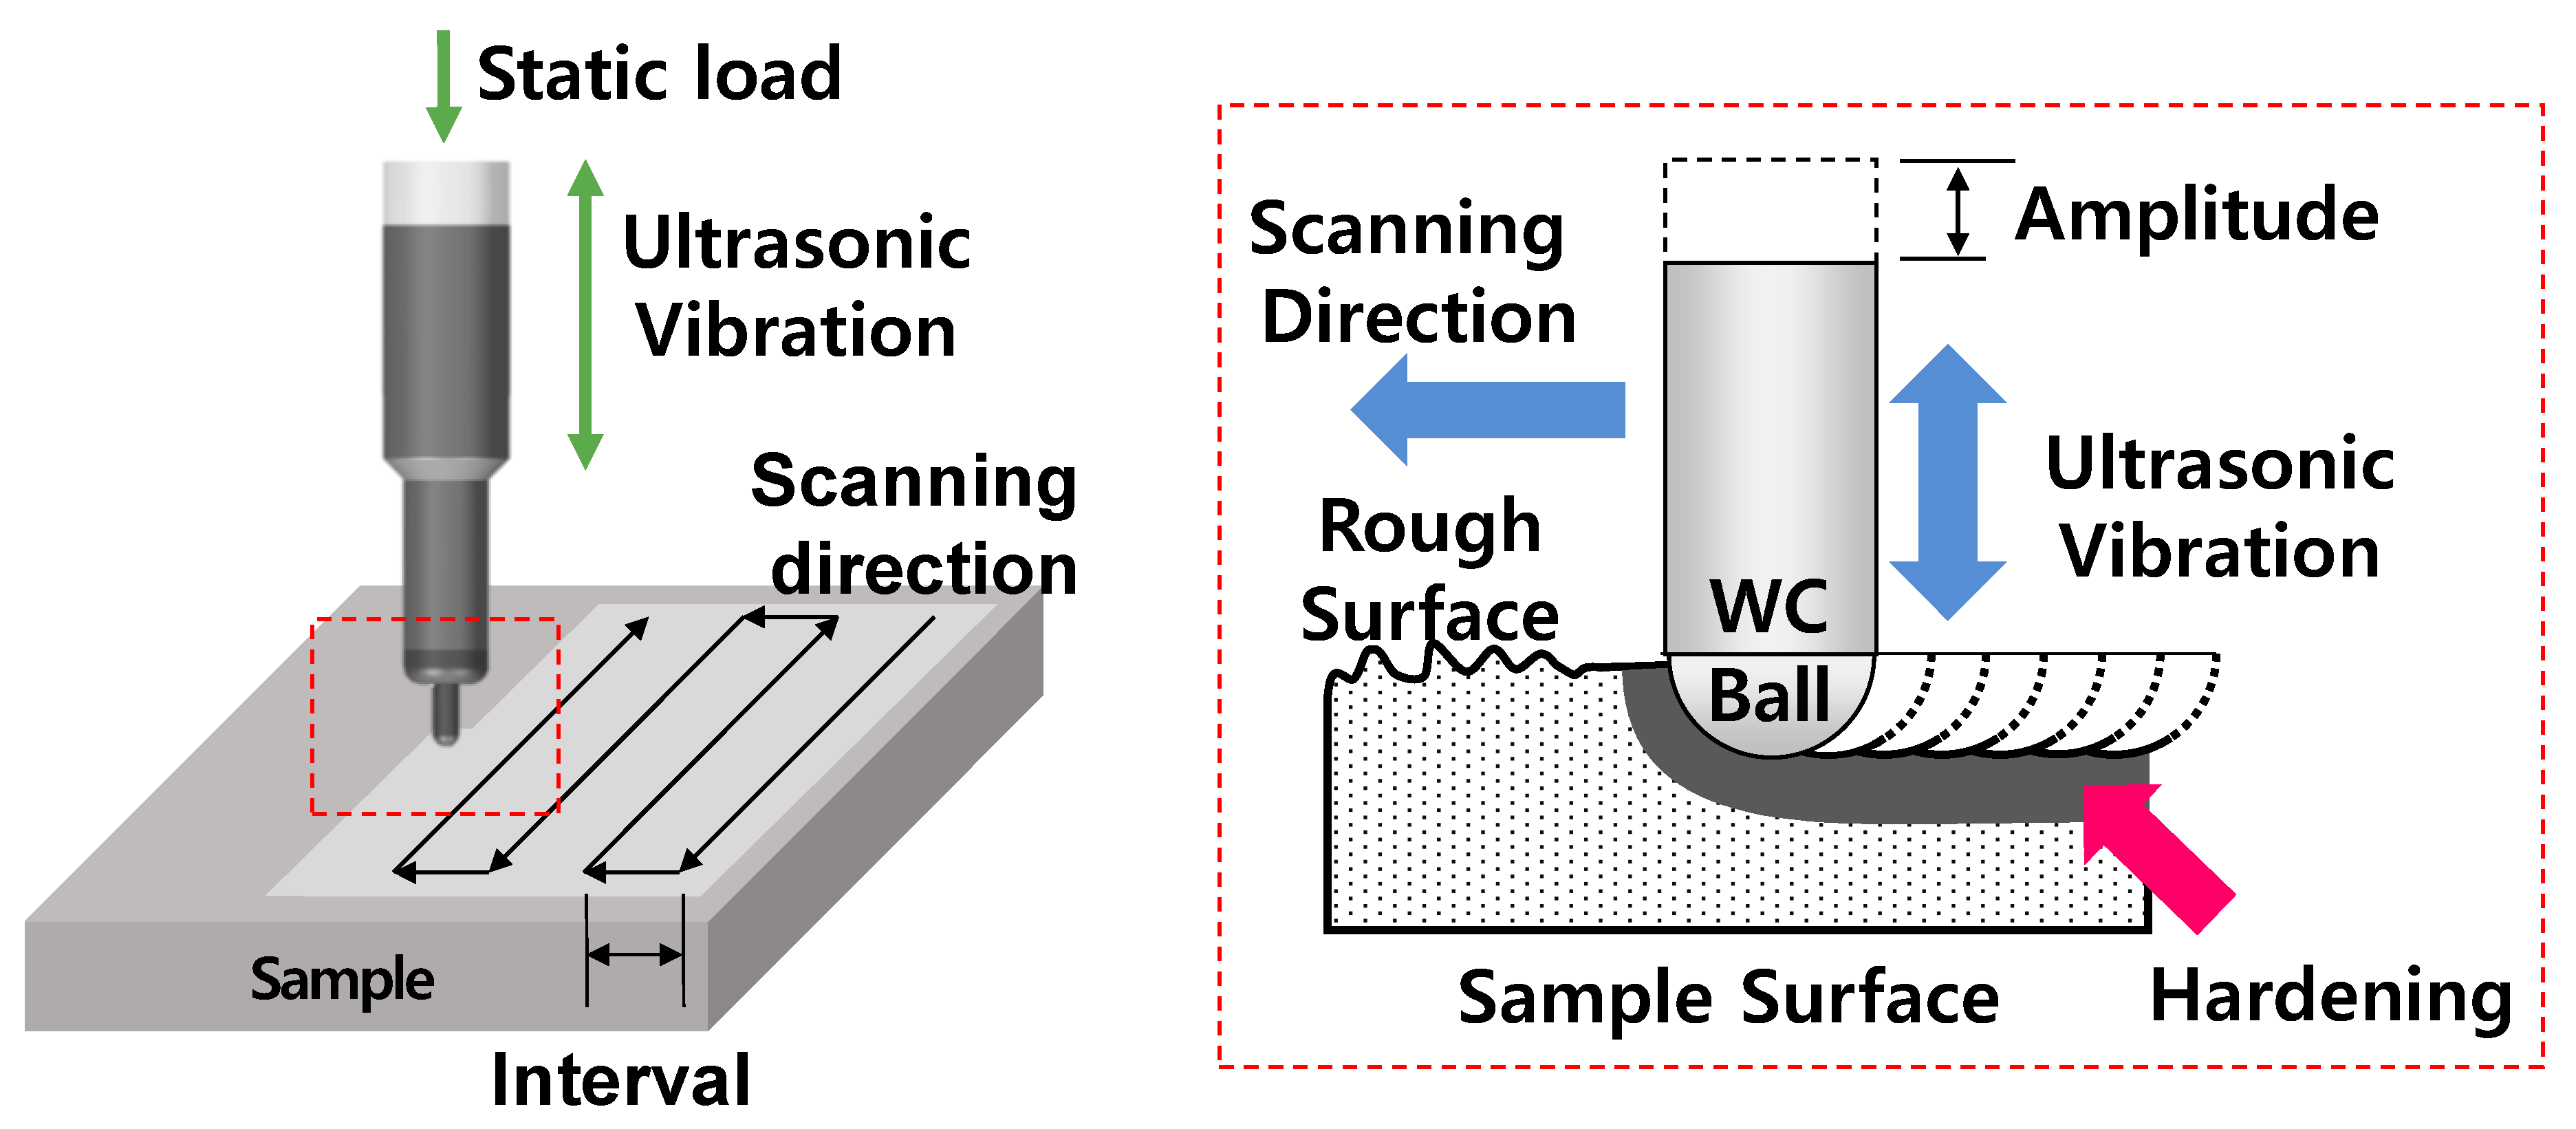
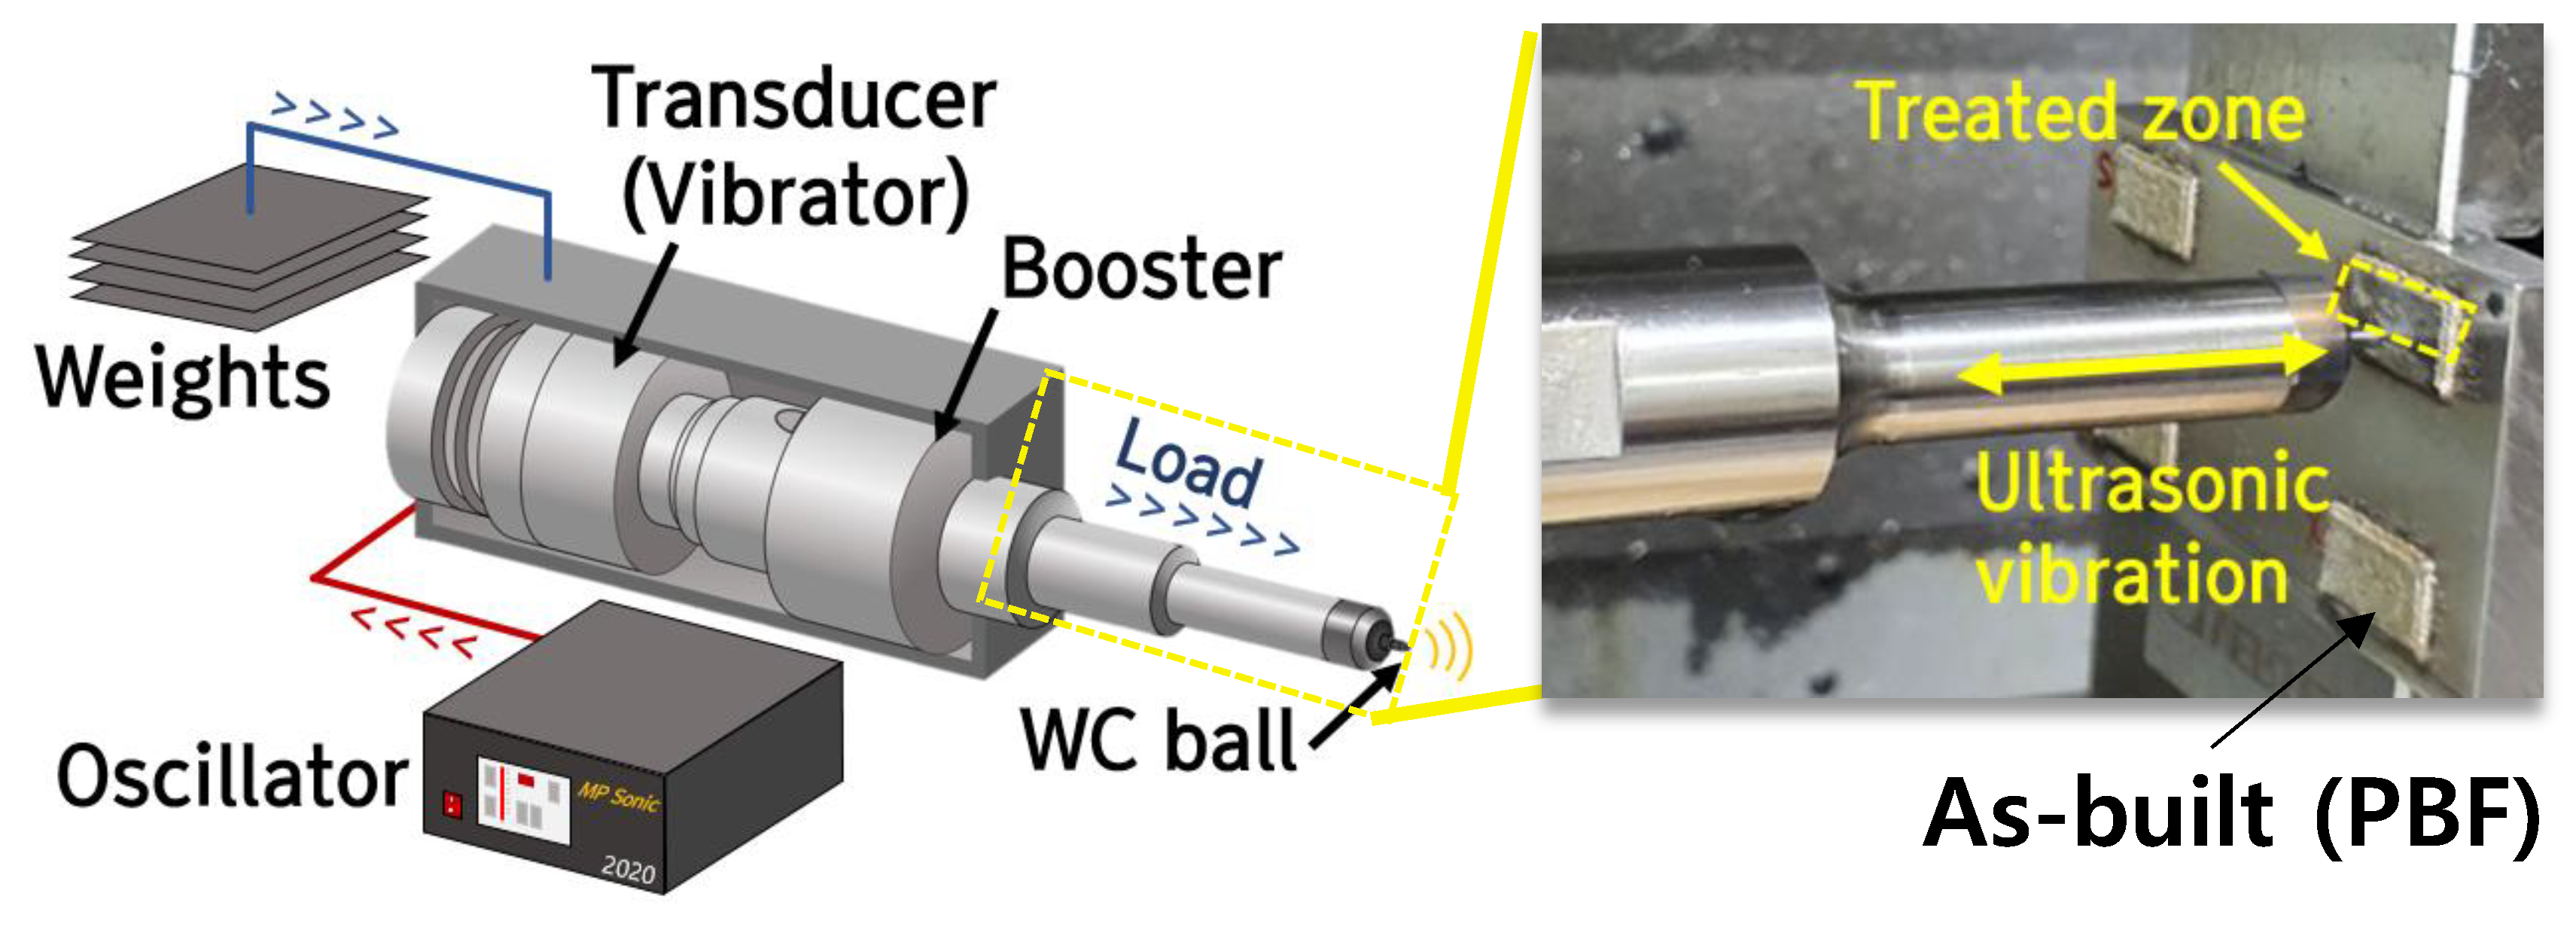
2.2. Ultrasonic Nanocrystal Surface Modification (UNSM)
2.3. Design of Experiment
2.3.1. Response Surface Methodology (RSM)
2.3.2. Box–Behnken Design (BBD)
2.4. Experimental Details
3. Experimental Results
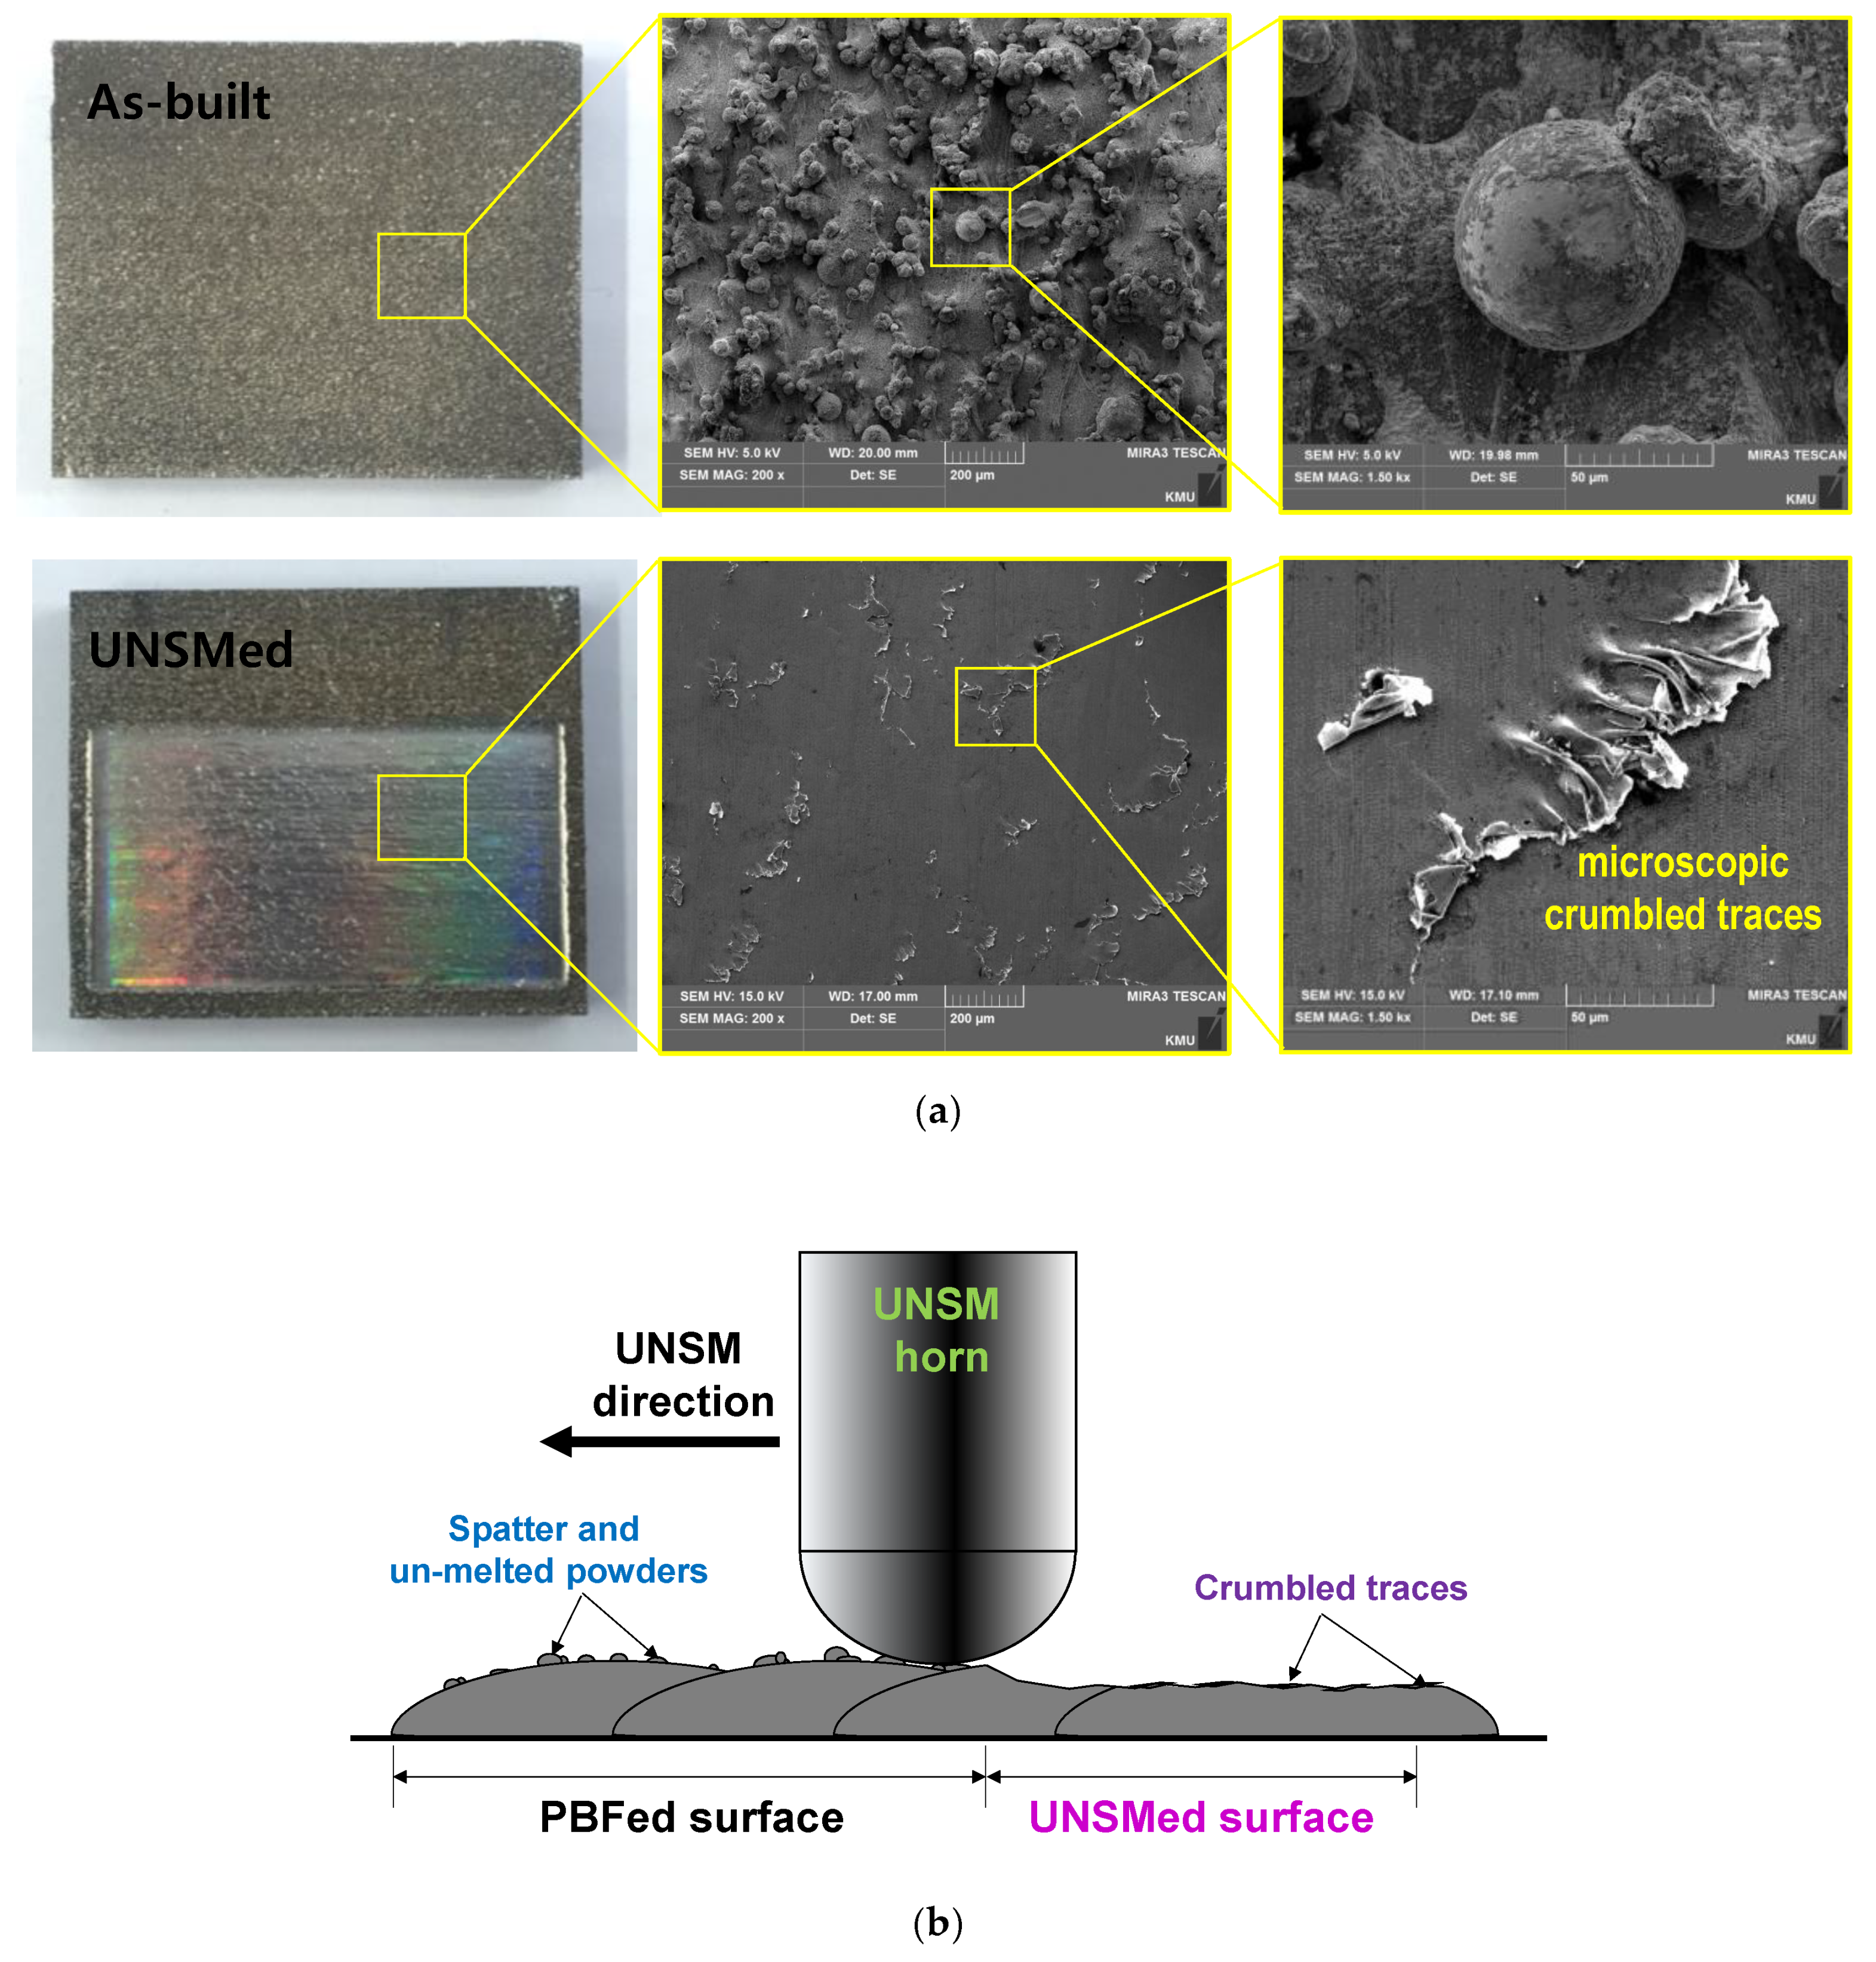
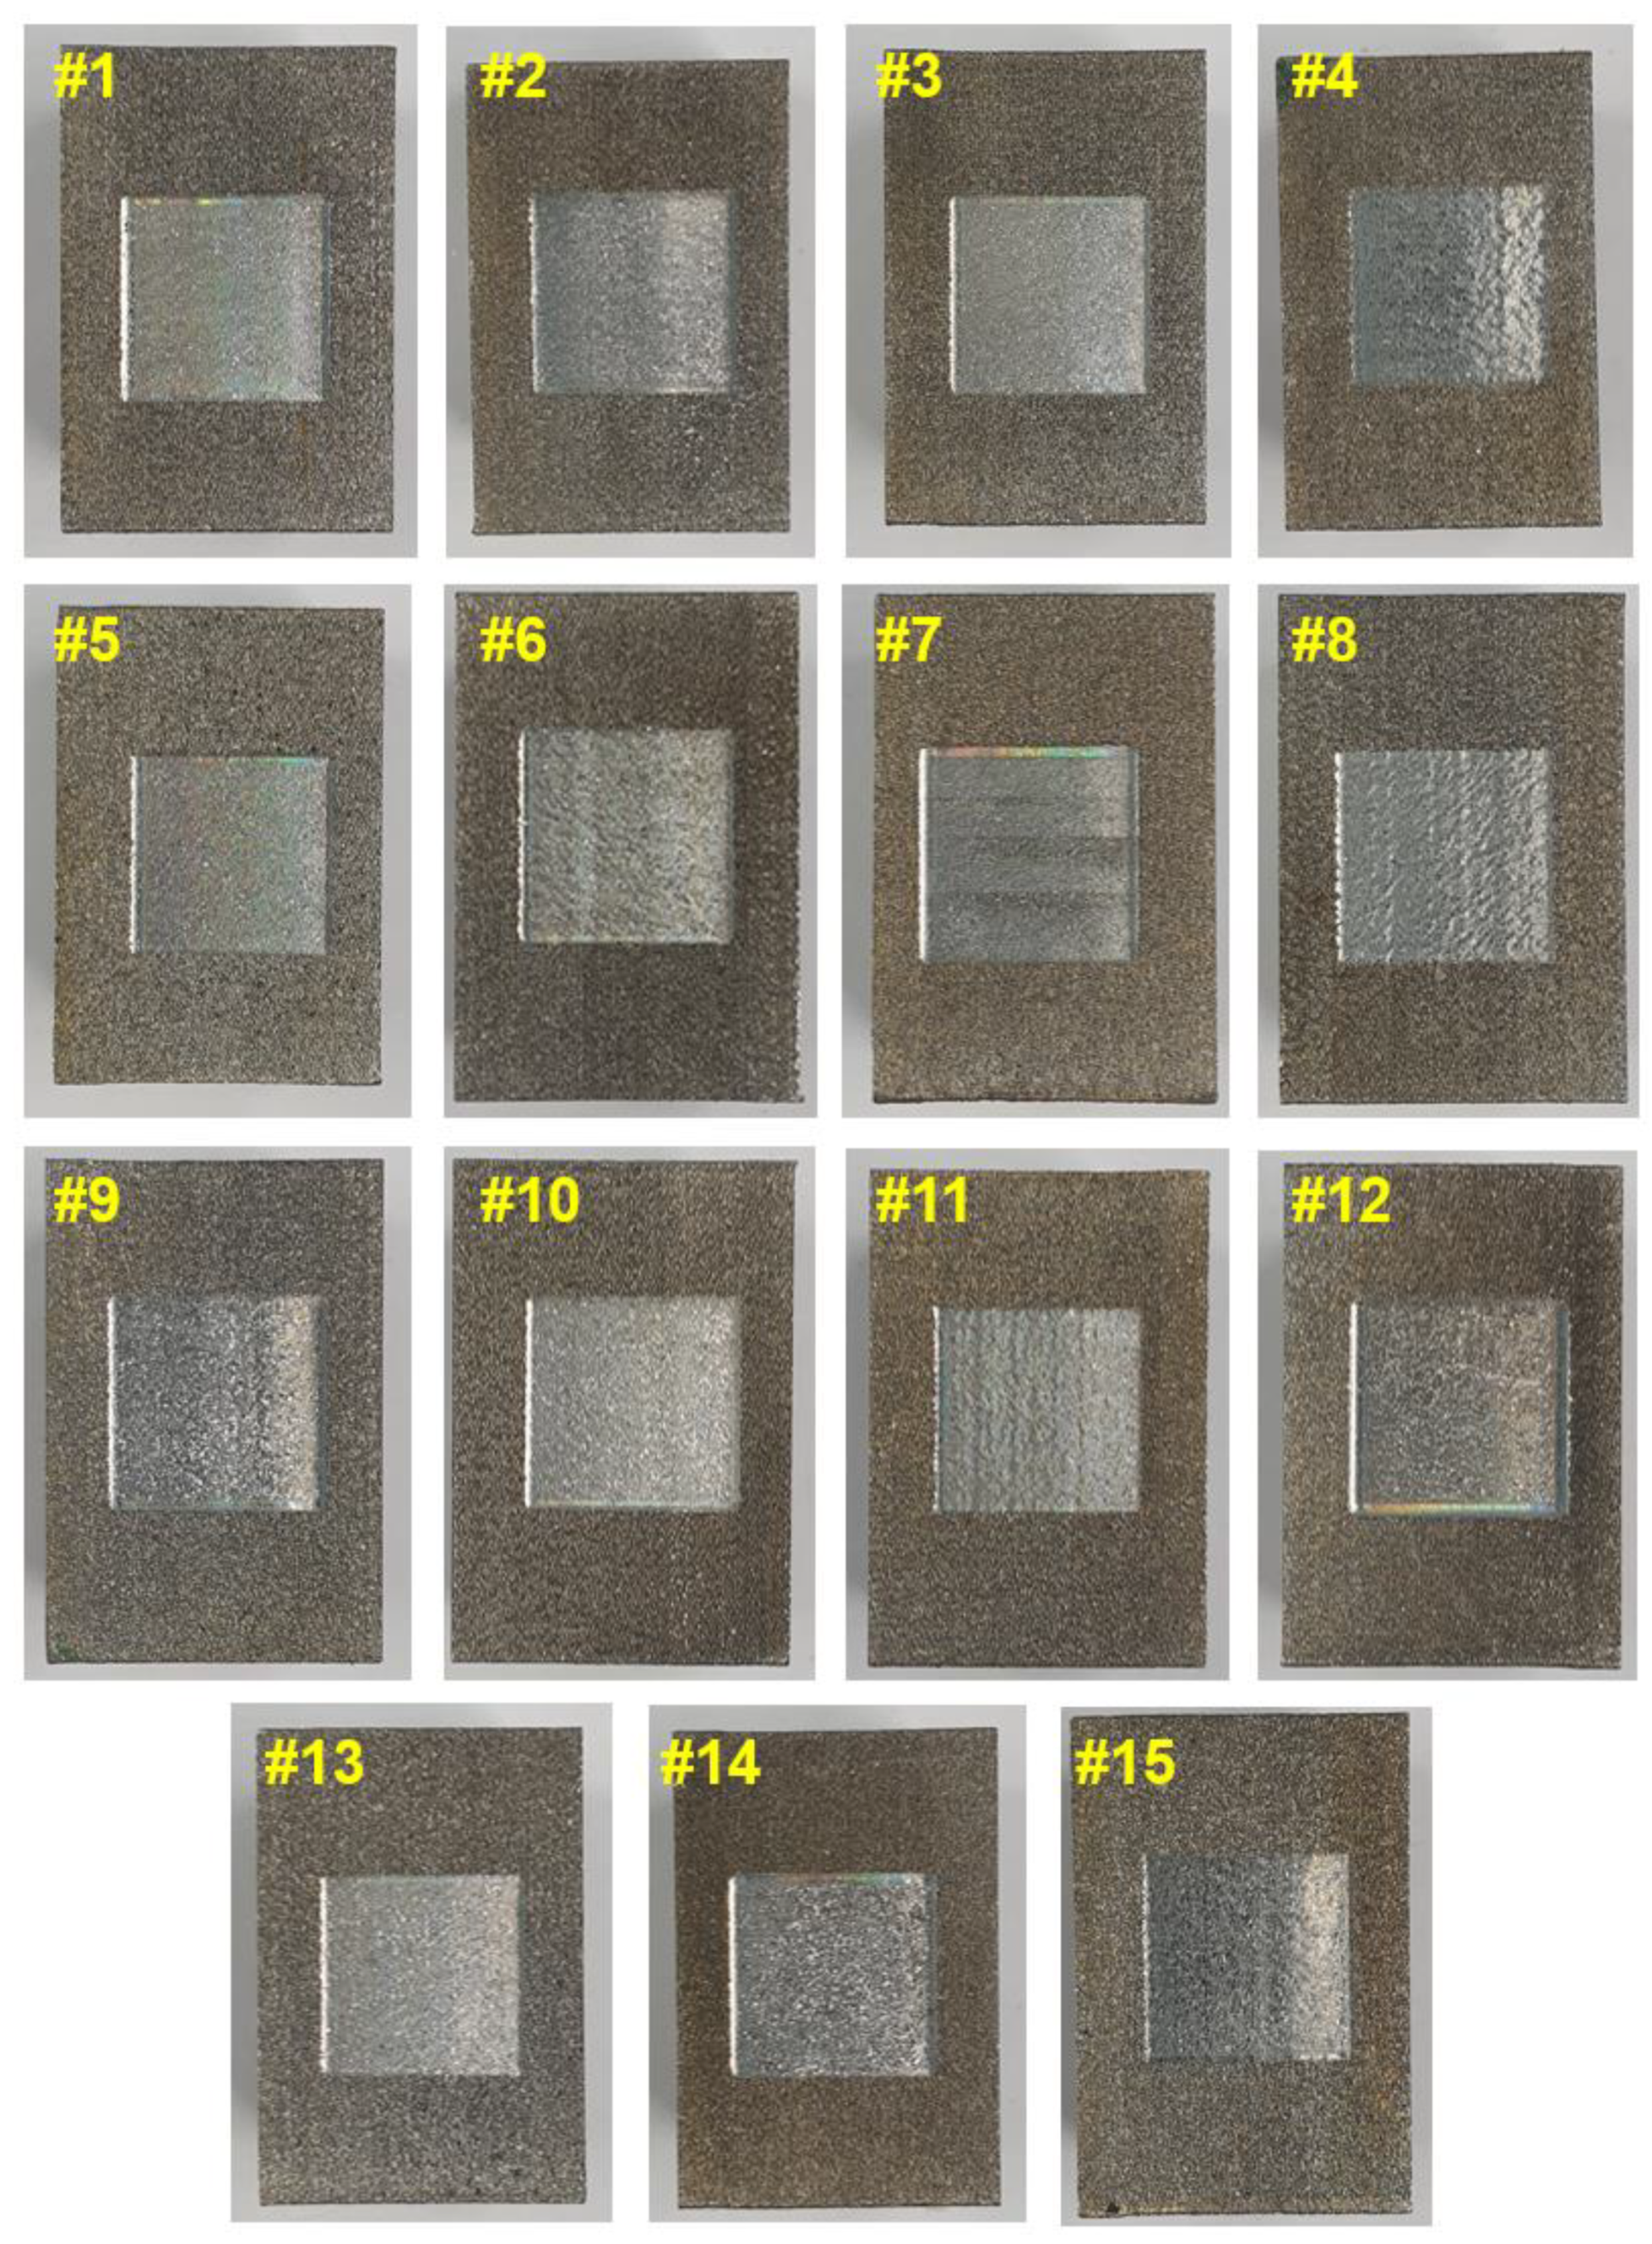
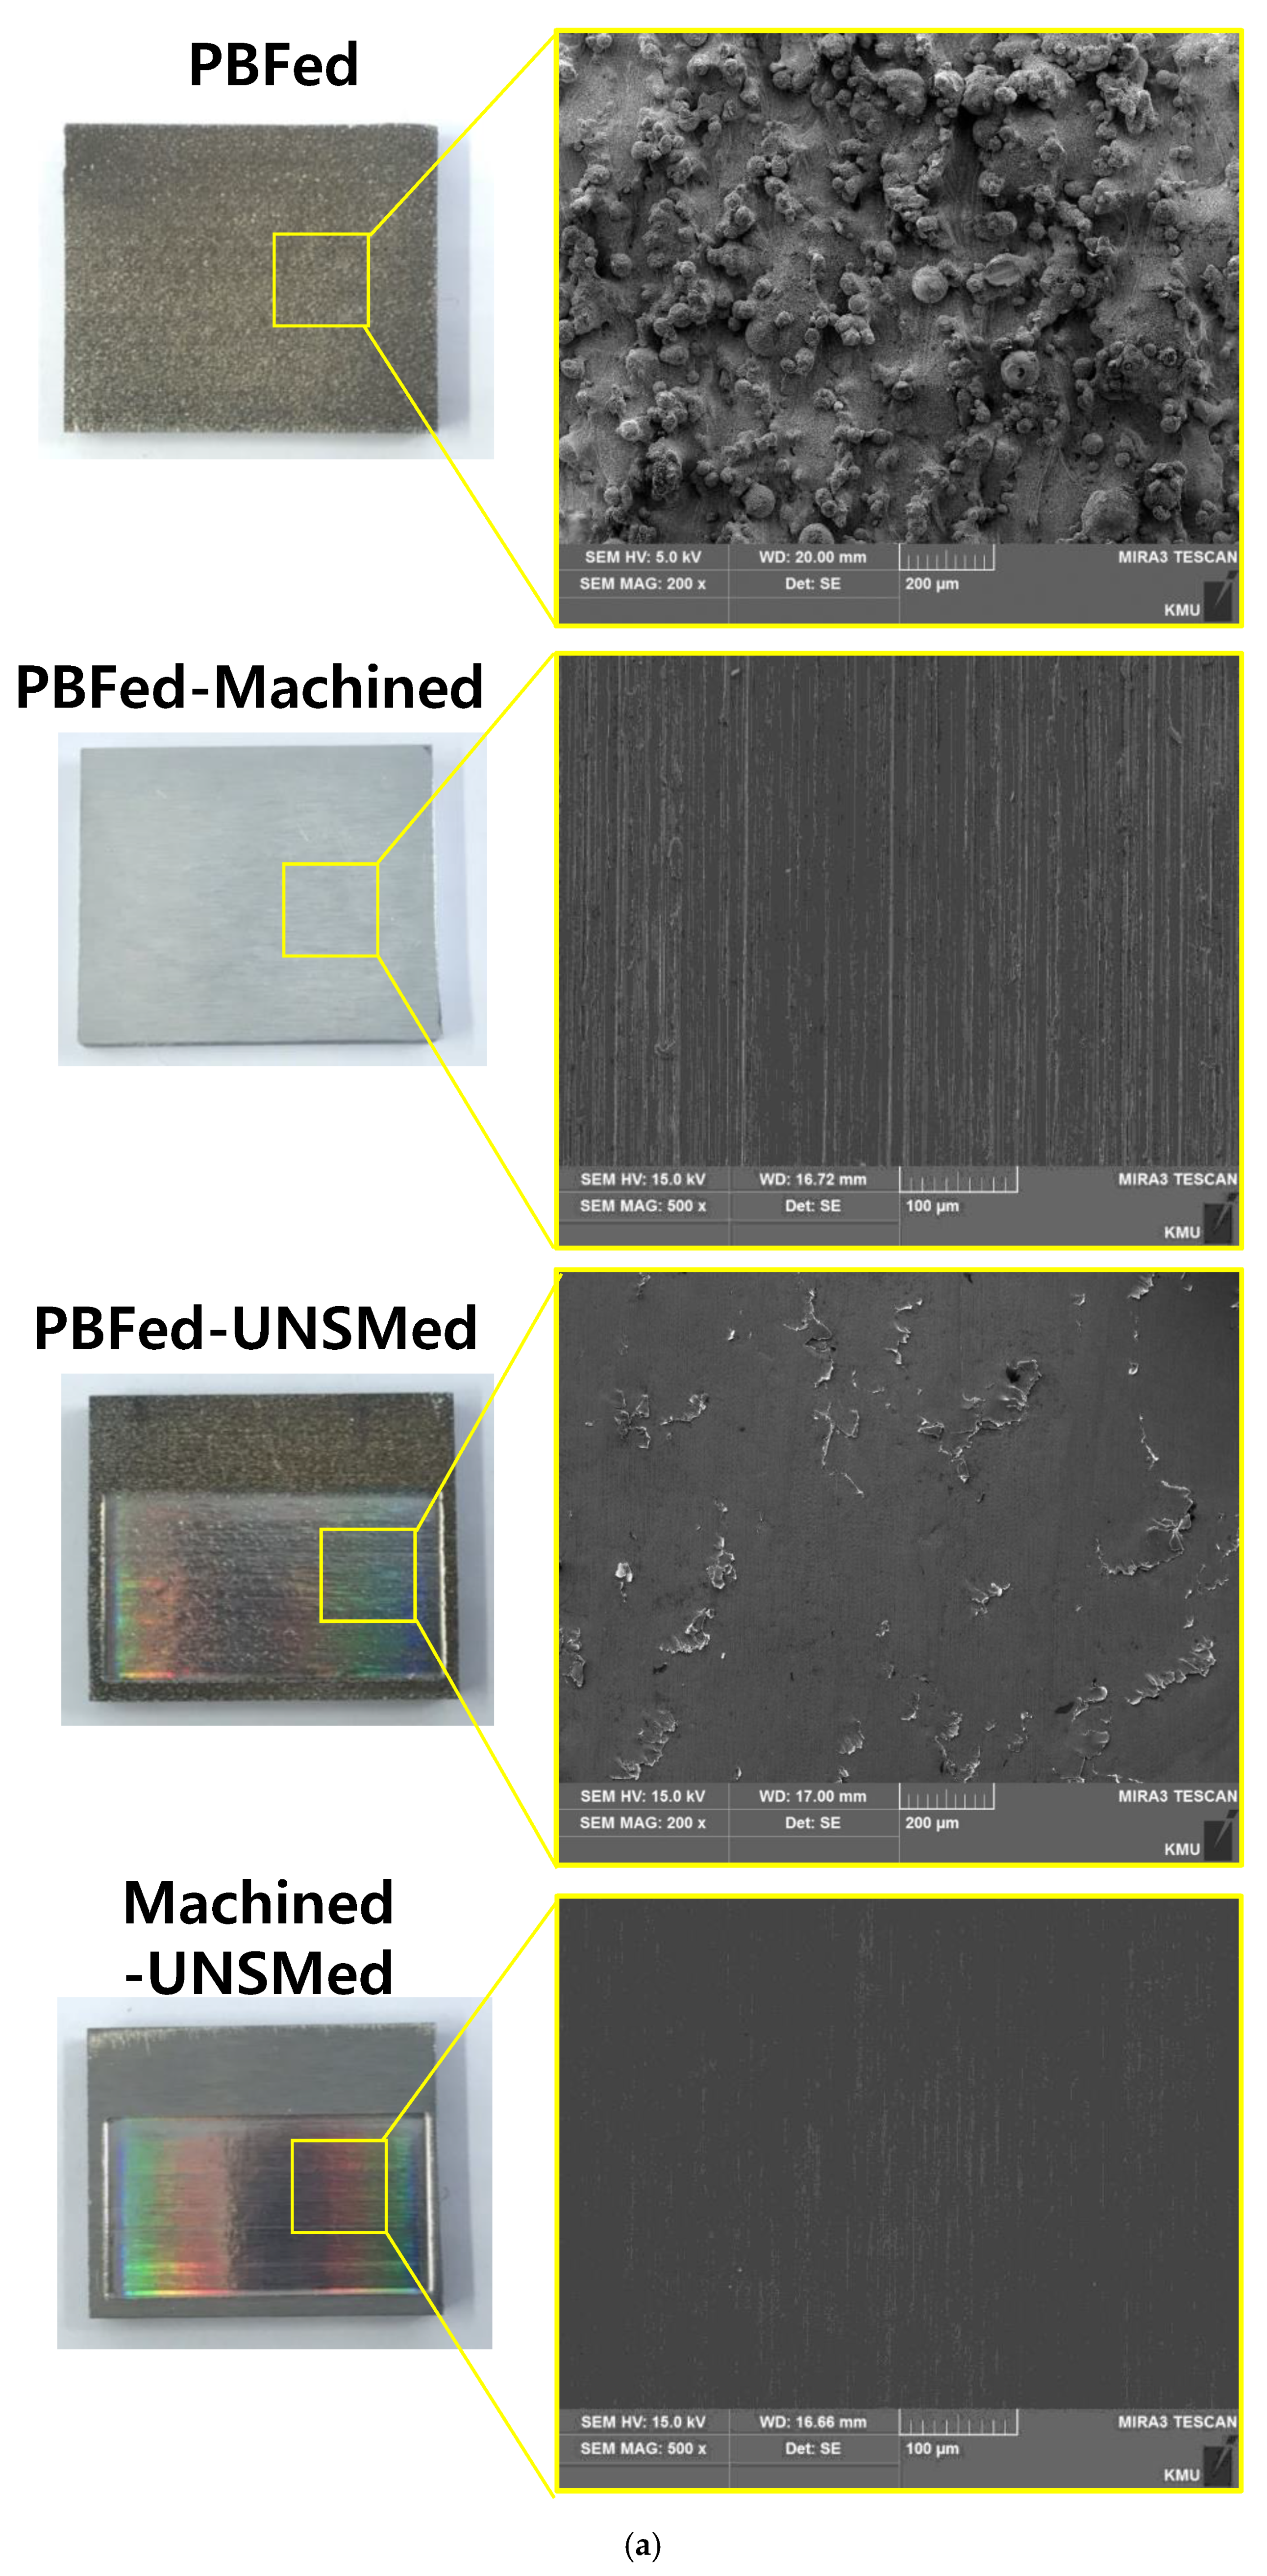
3.1. Changes in Surface Topography
3.2. Results of ANOVA
3.2.1. Roughness
3.2.2. Surface Hardness
3.3. Analysis of Response Surface
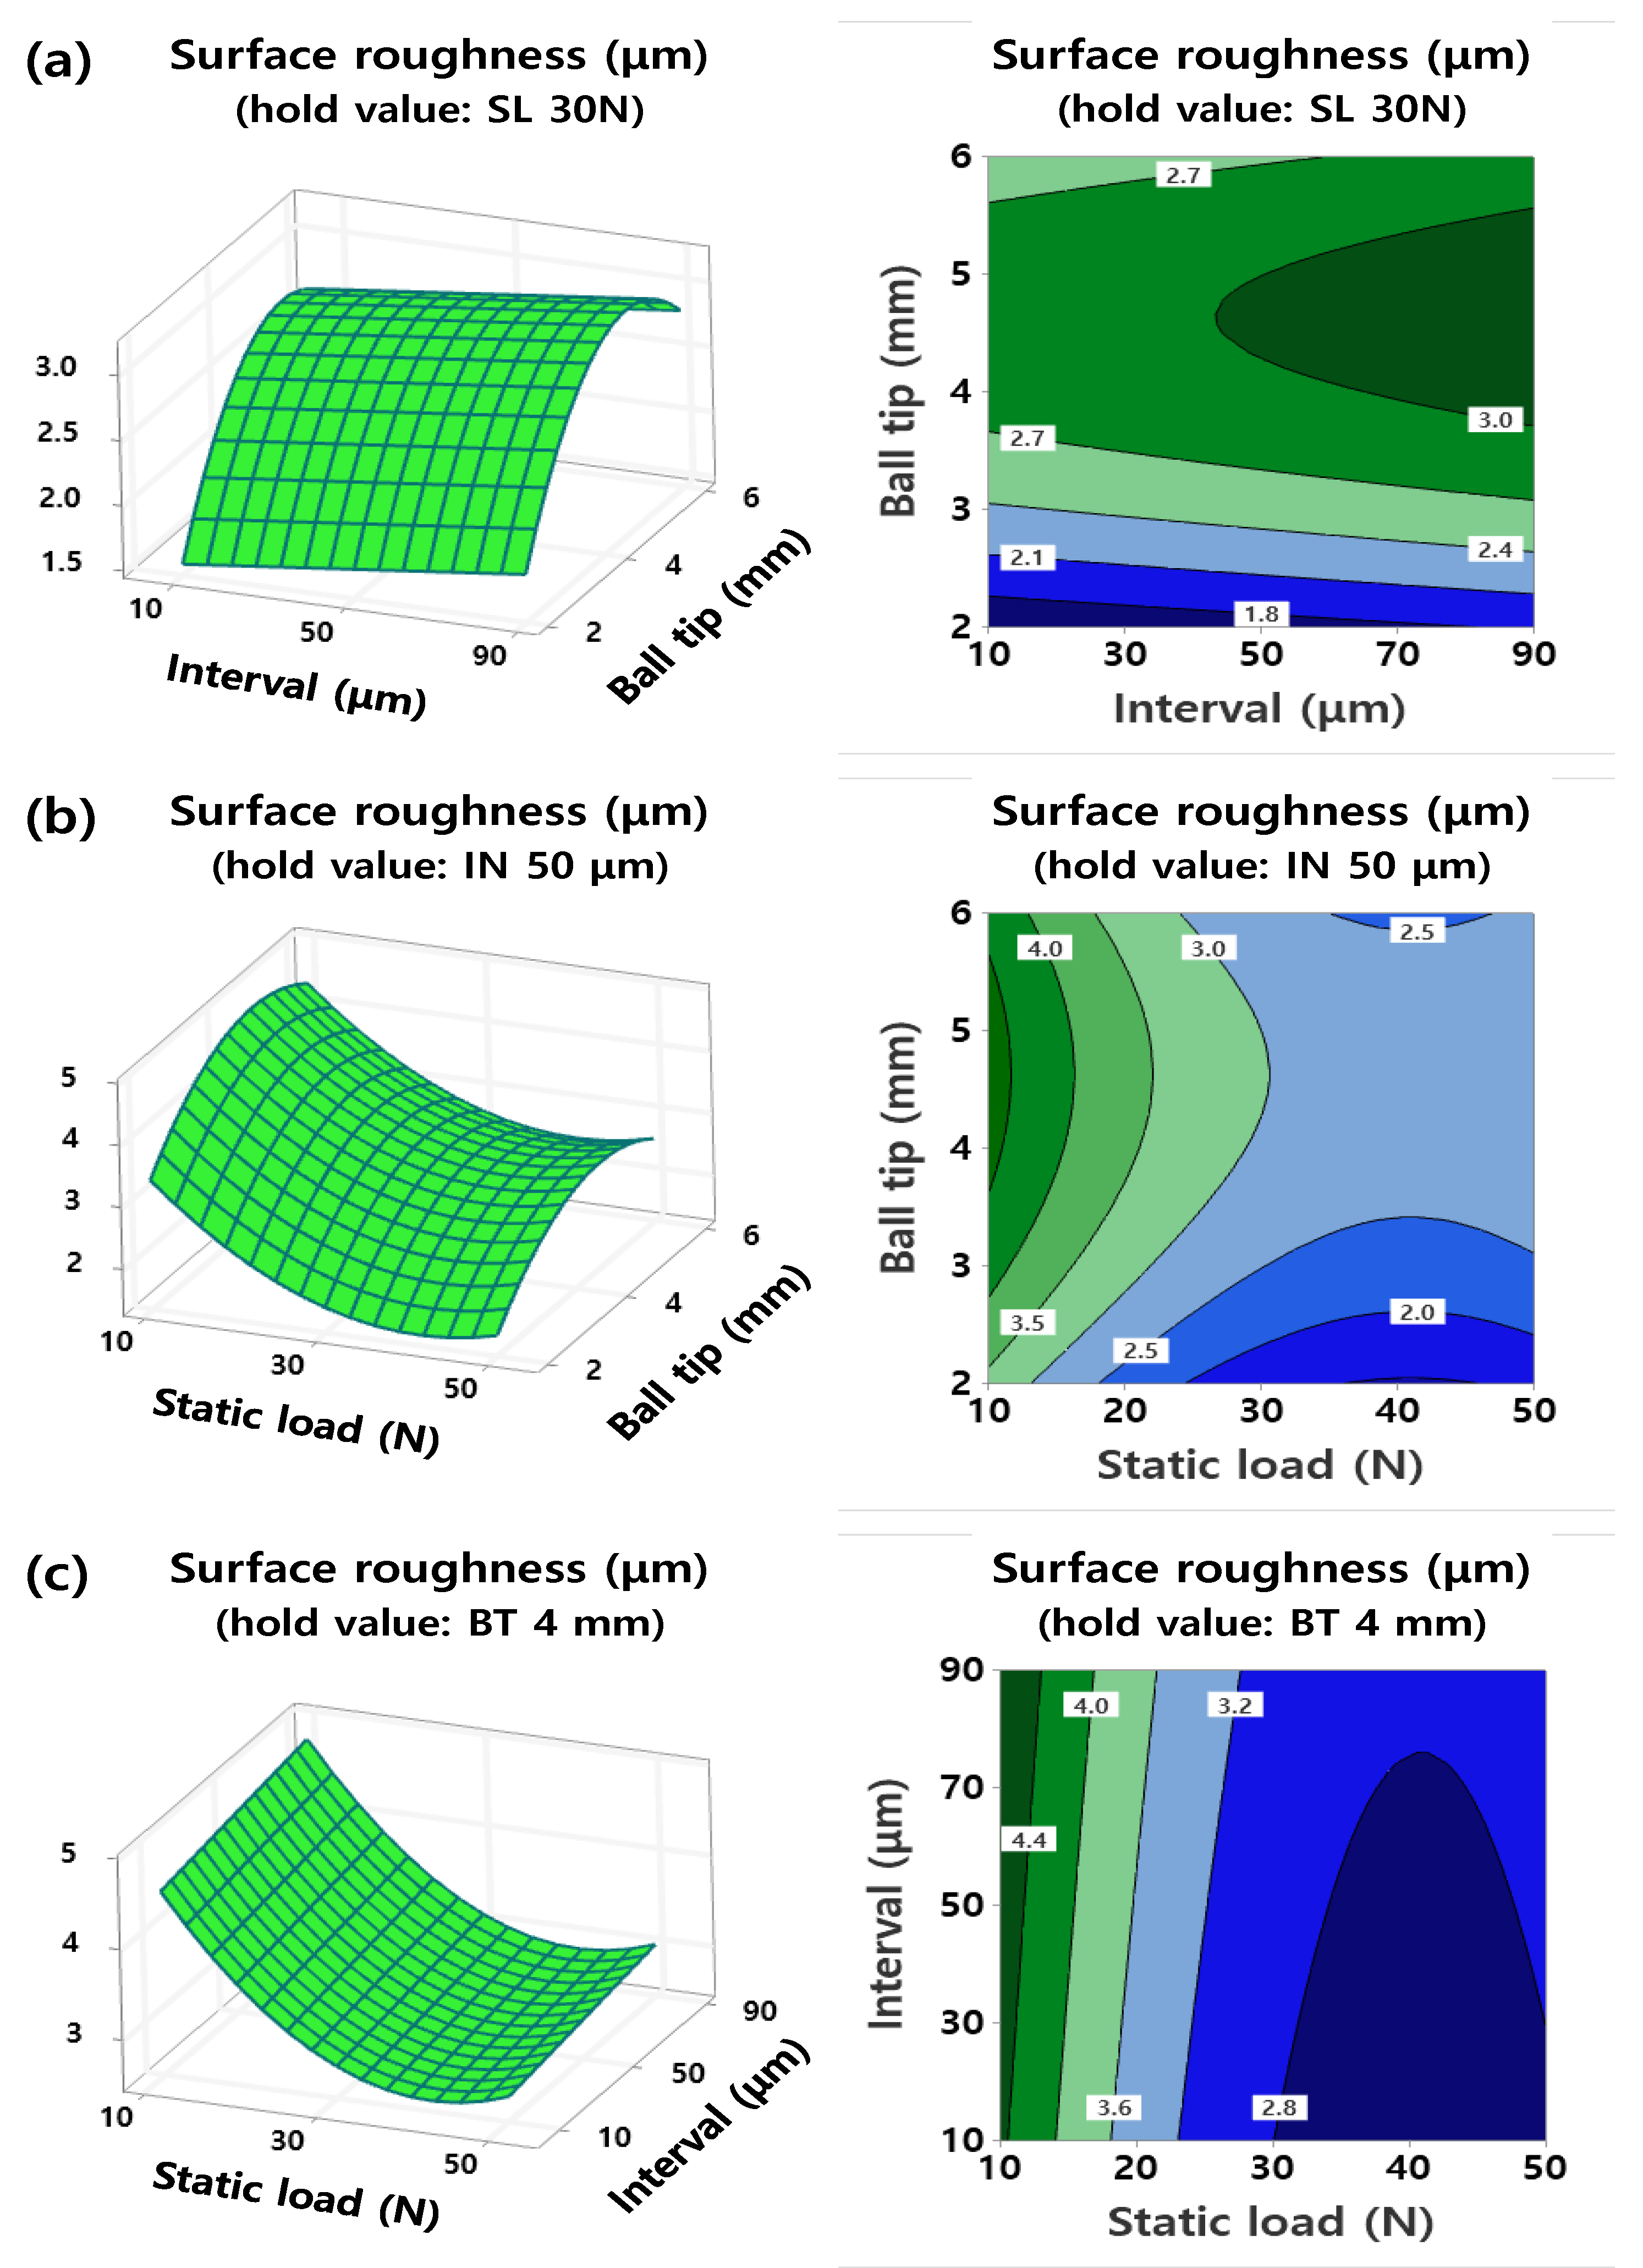
3.3.1. Surface Roughness
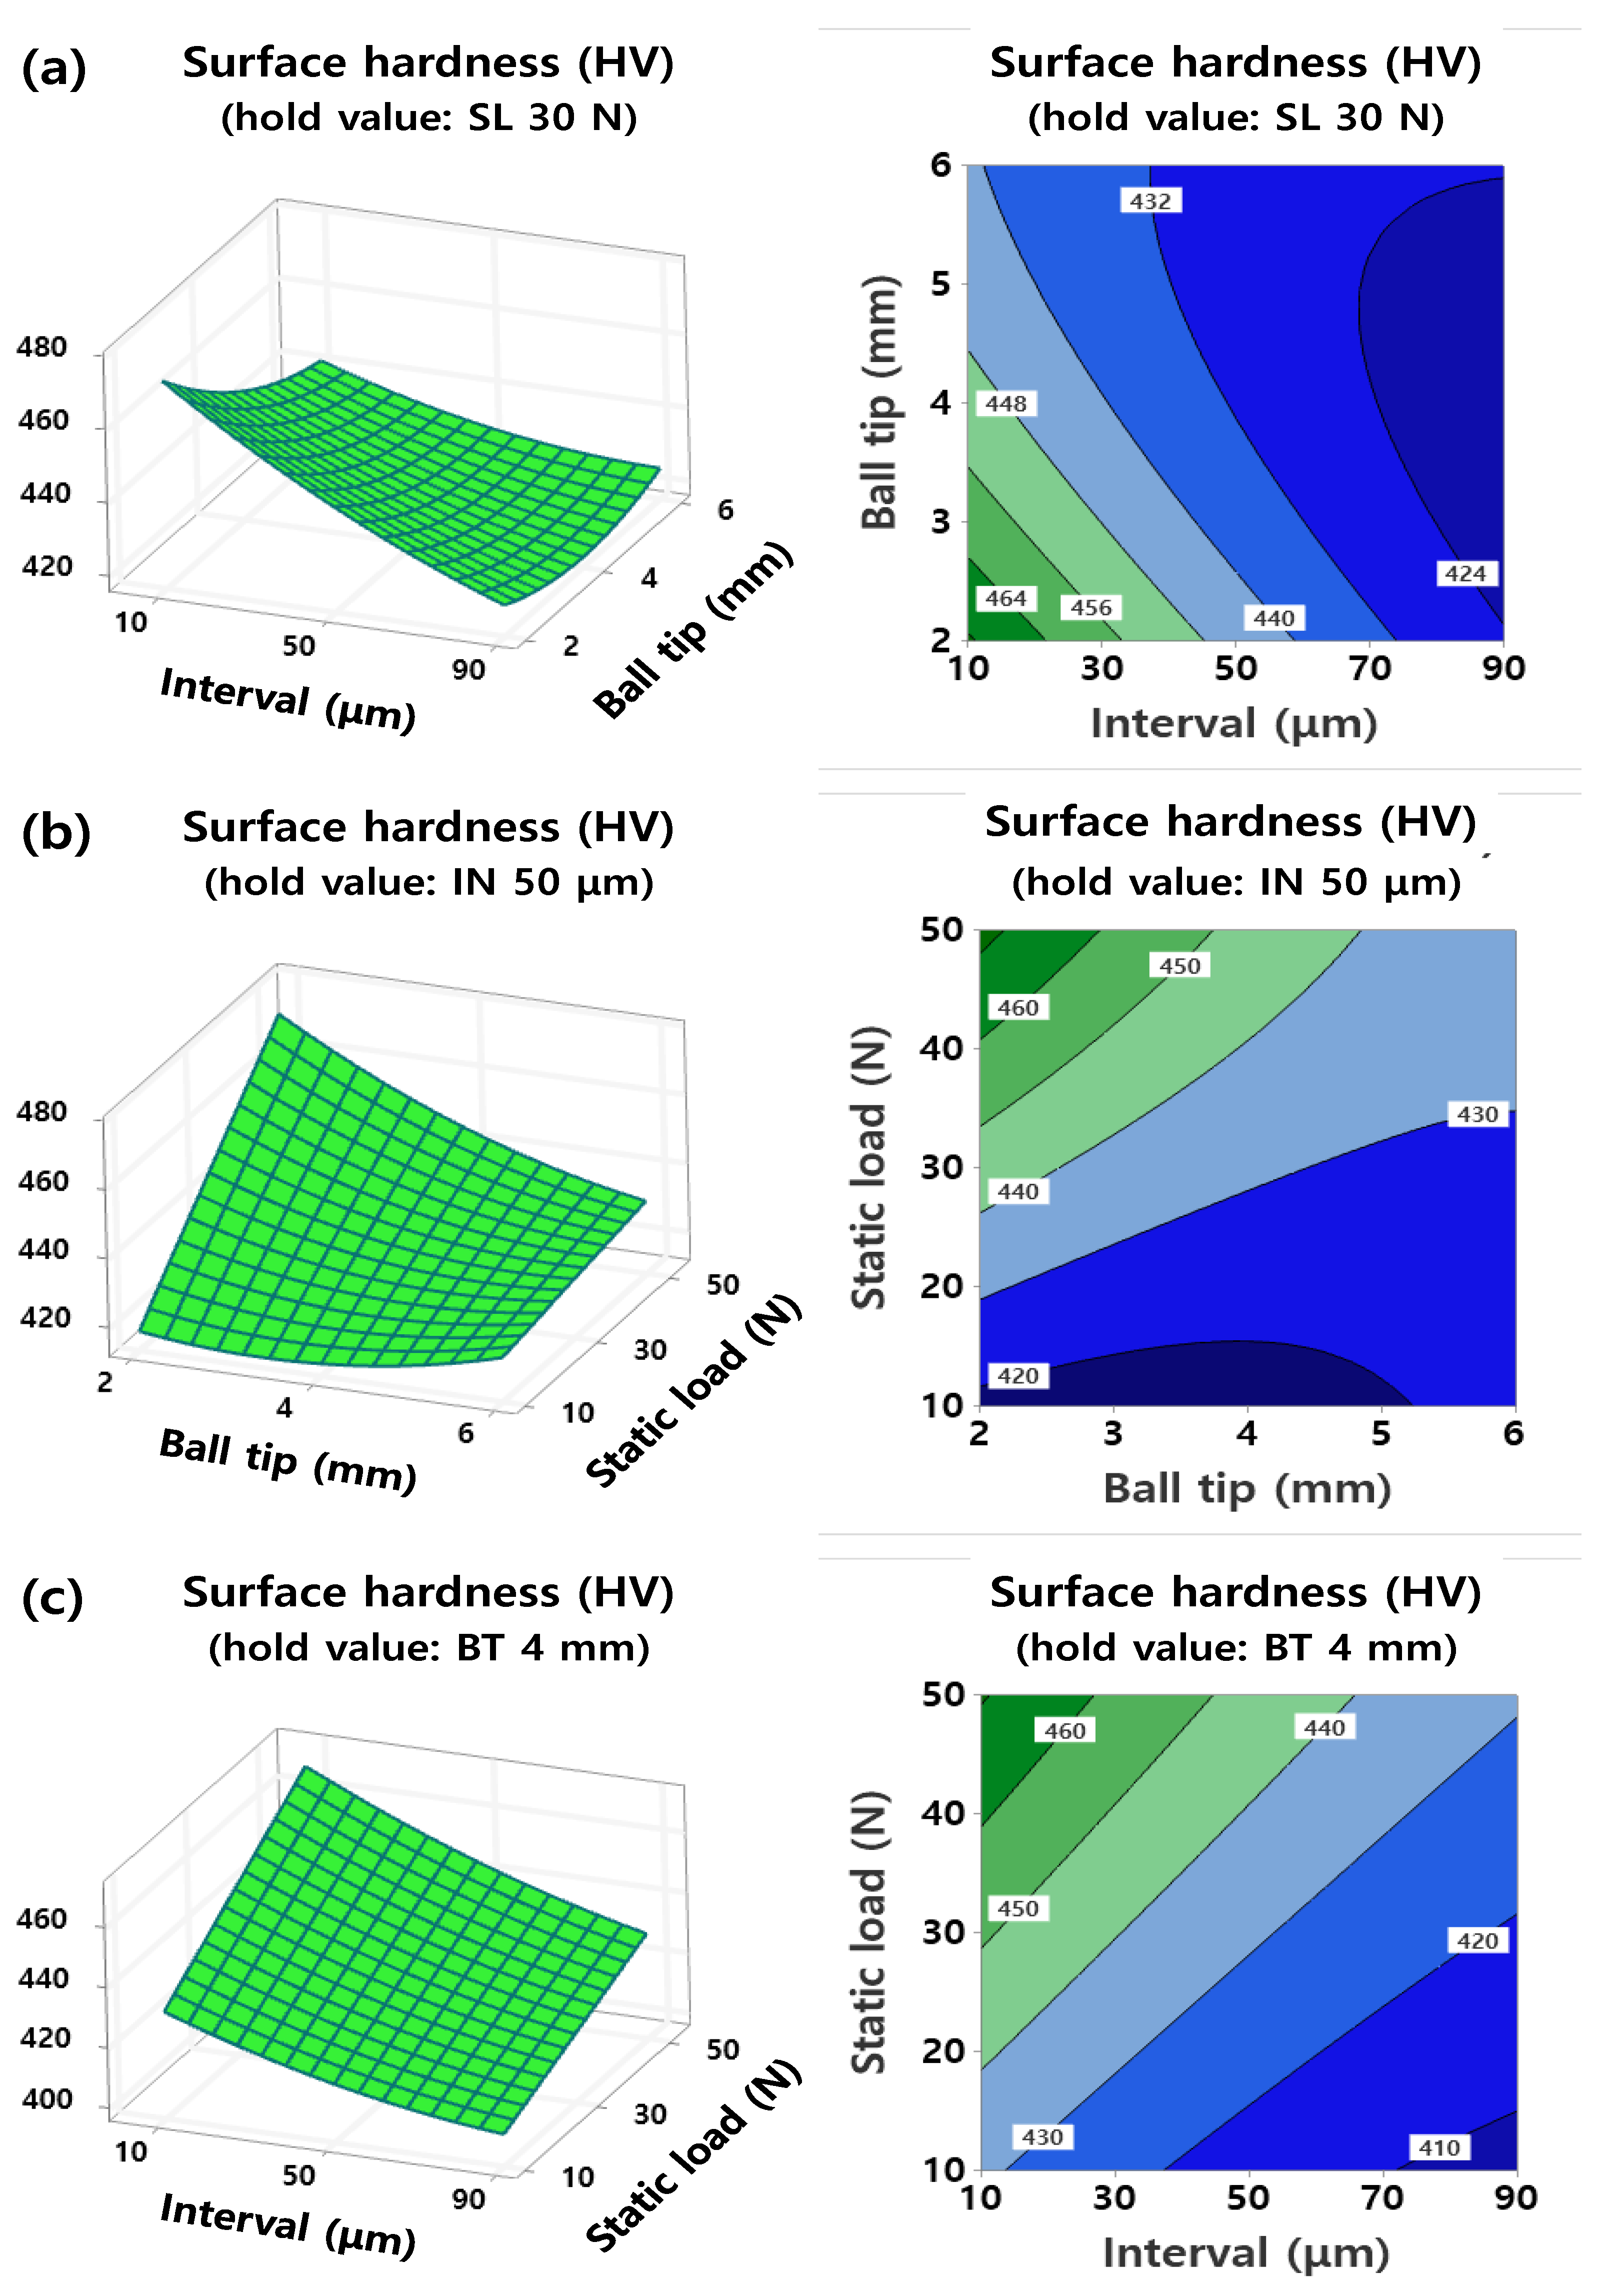
3.3.2. Hardness
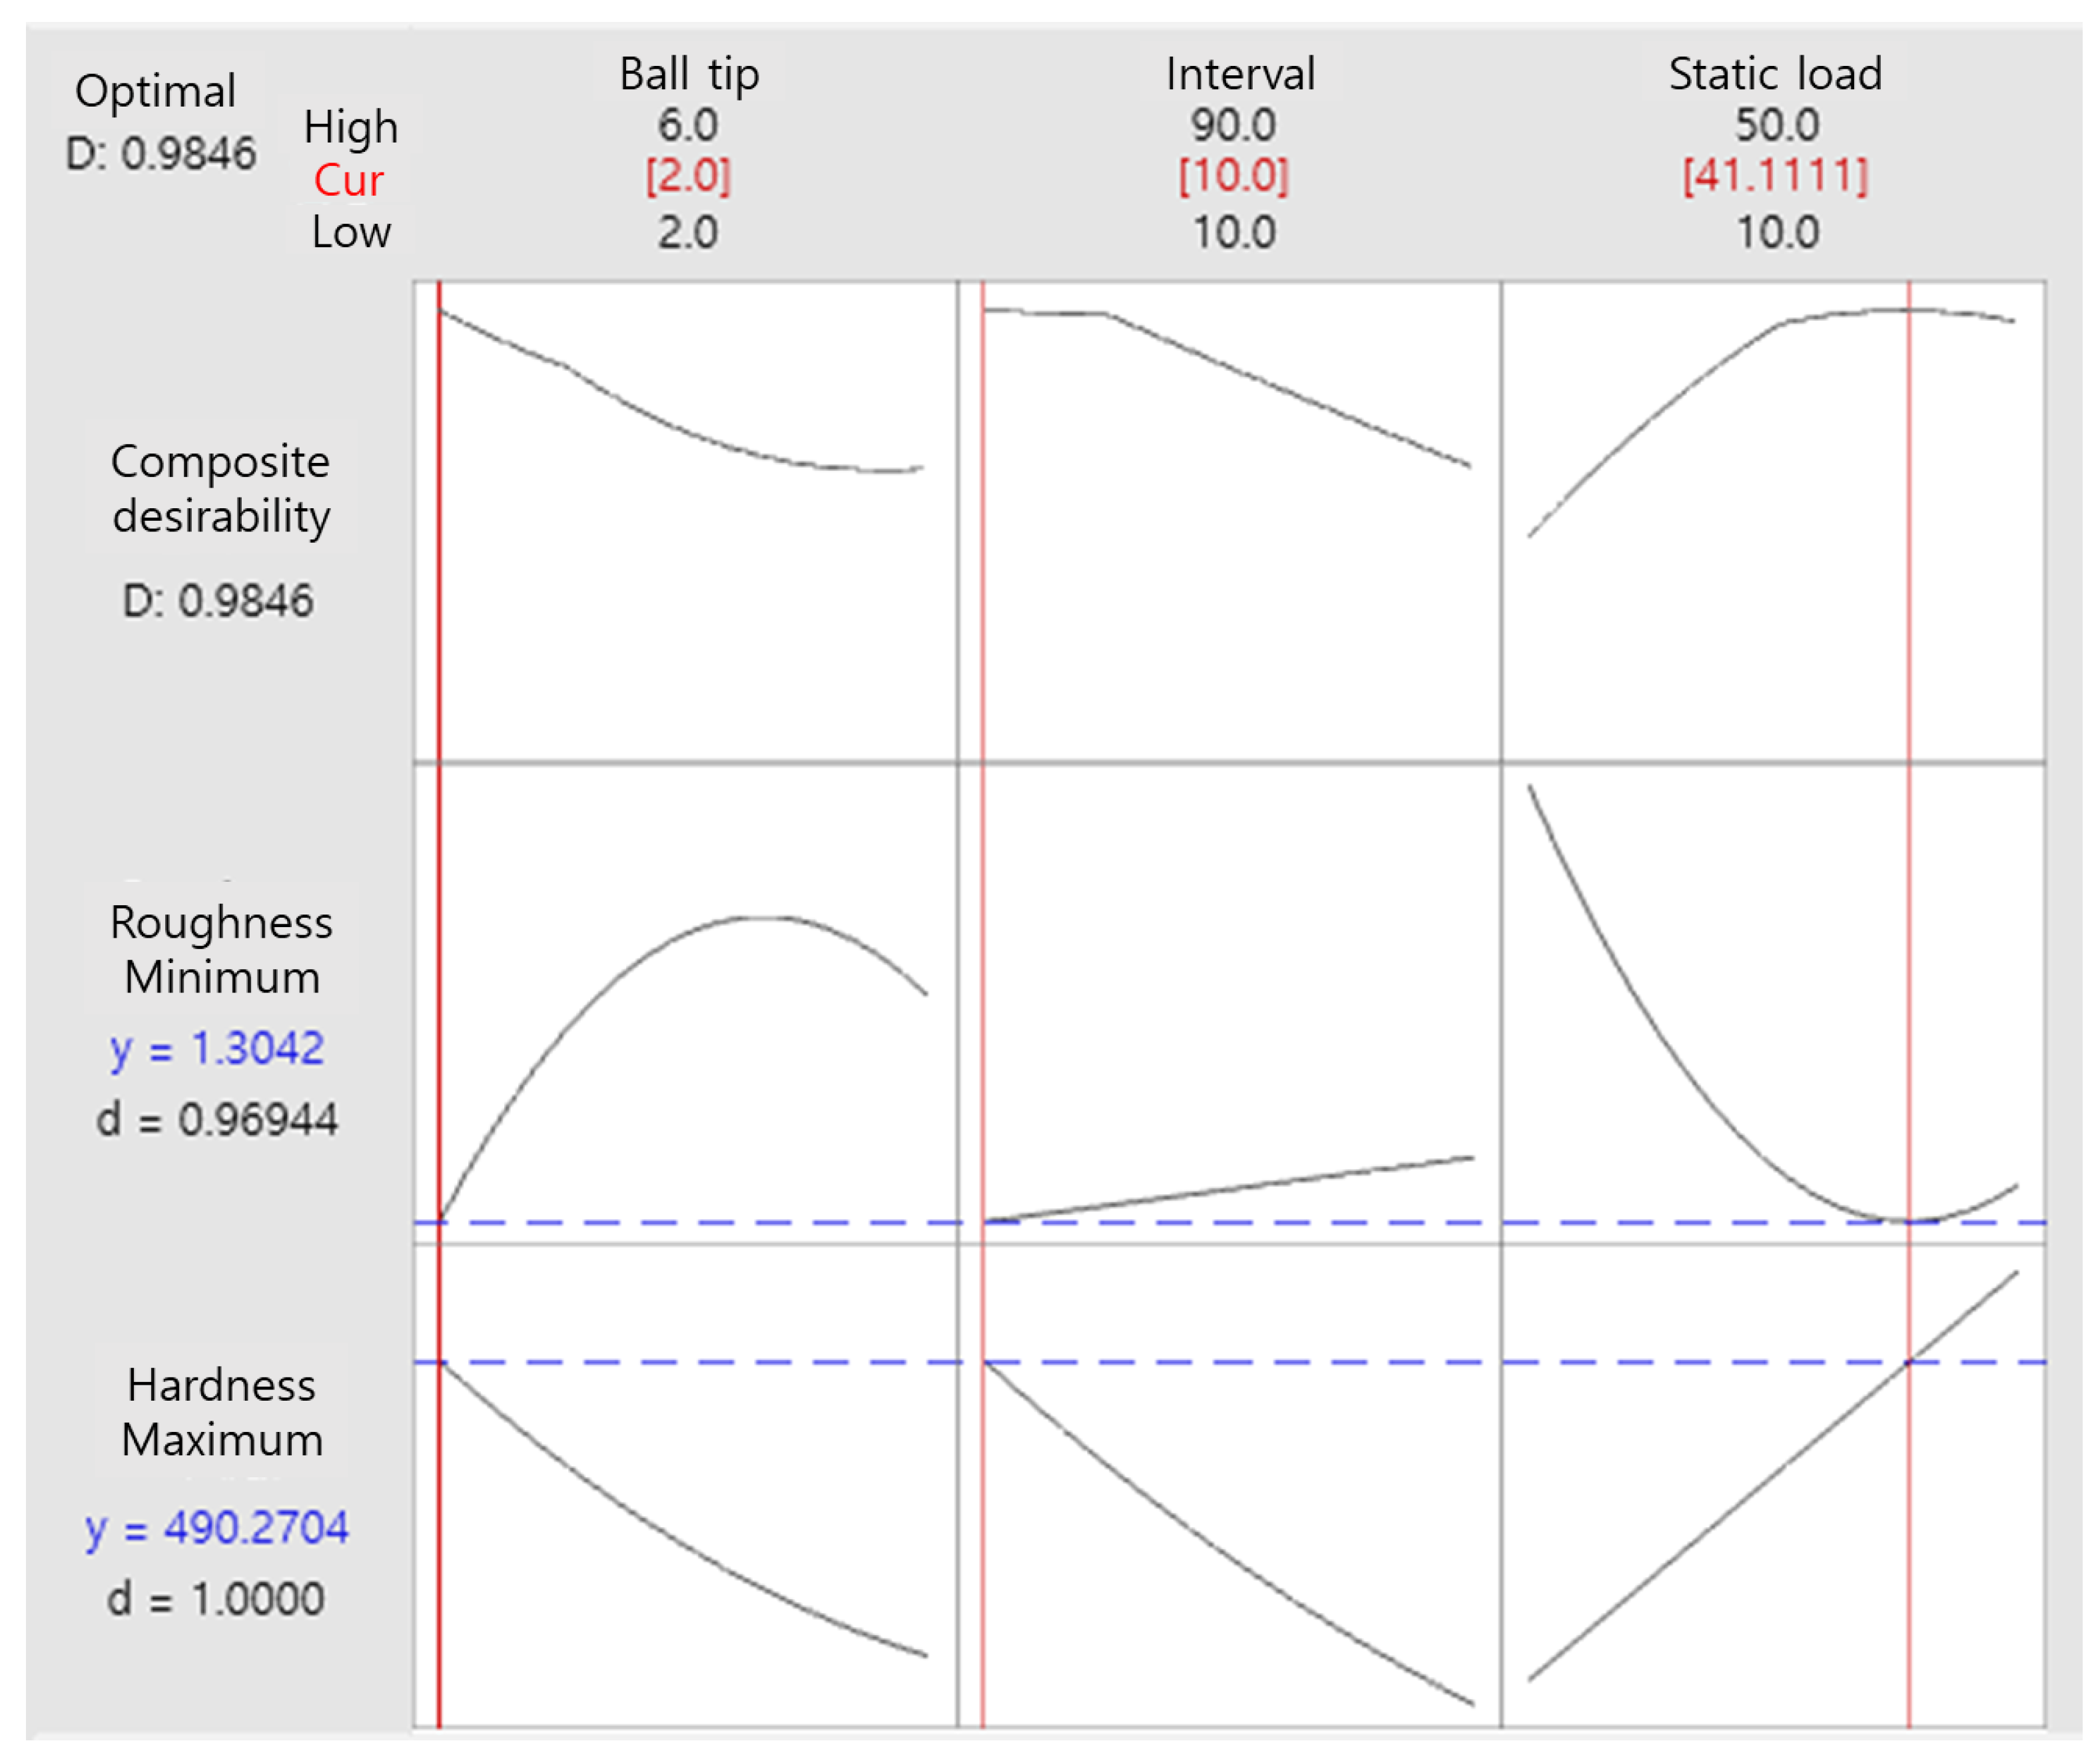
3.4. Multi-Objective Optimization
3.5. Experimental Validation
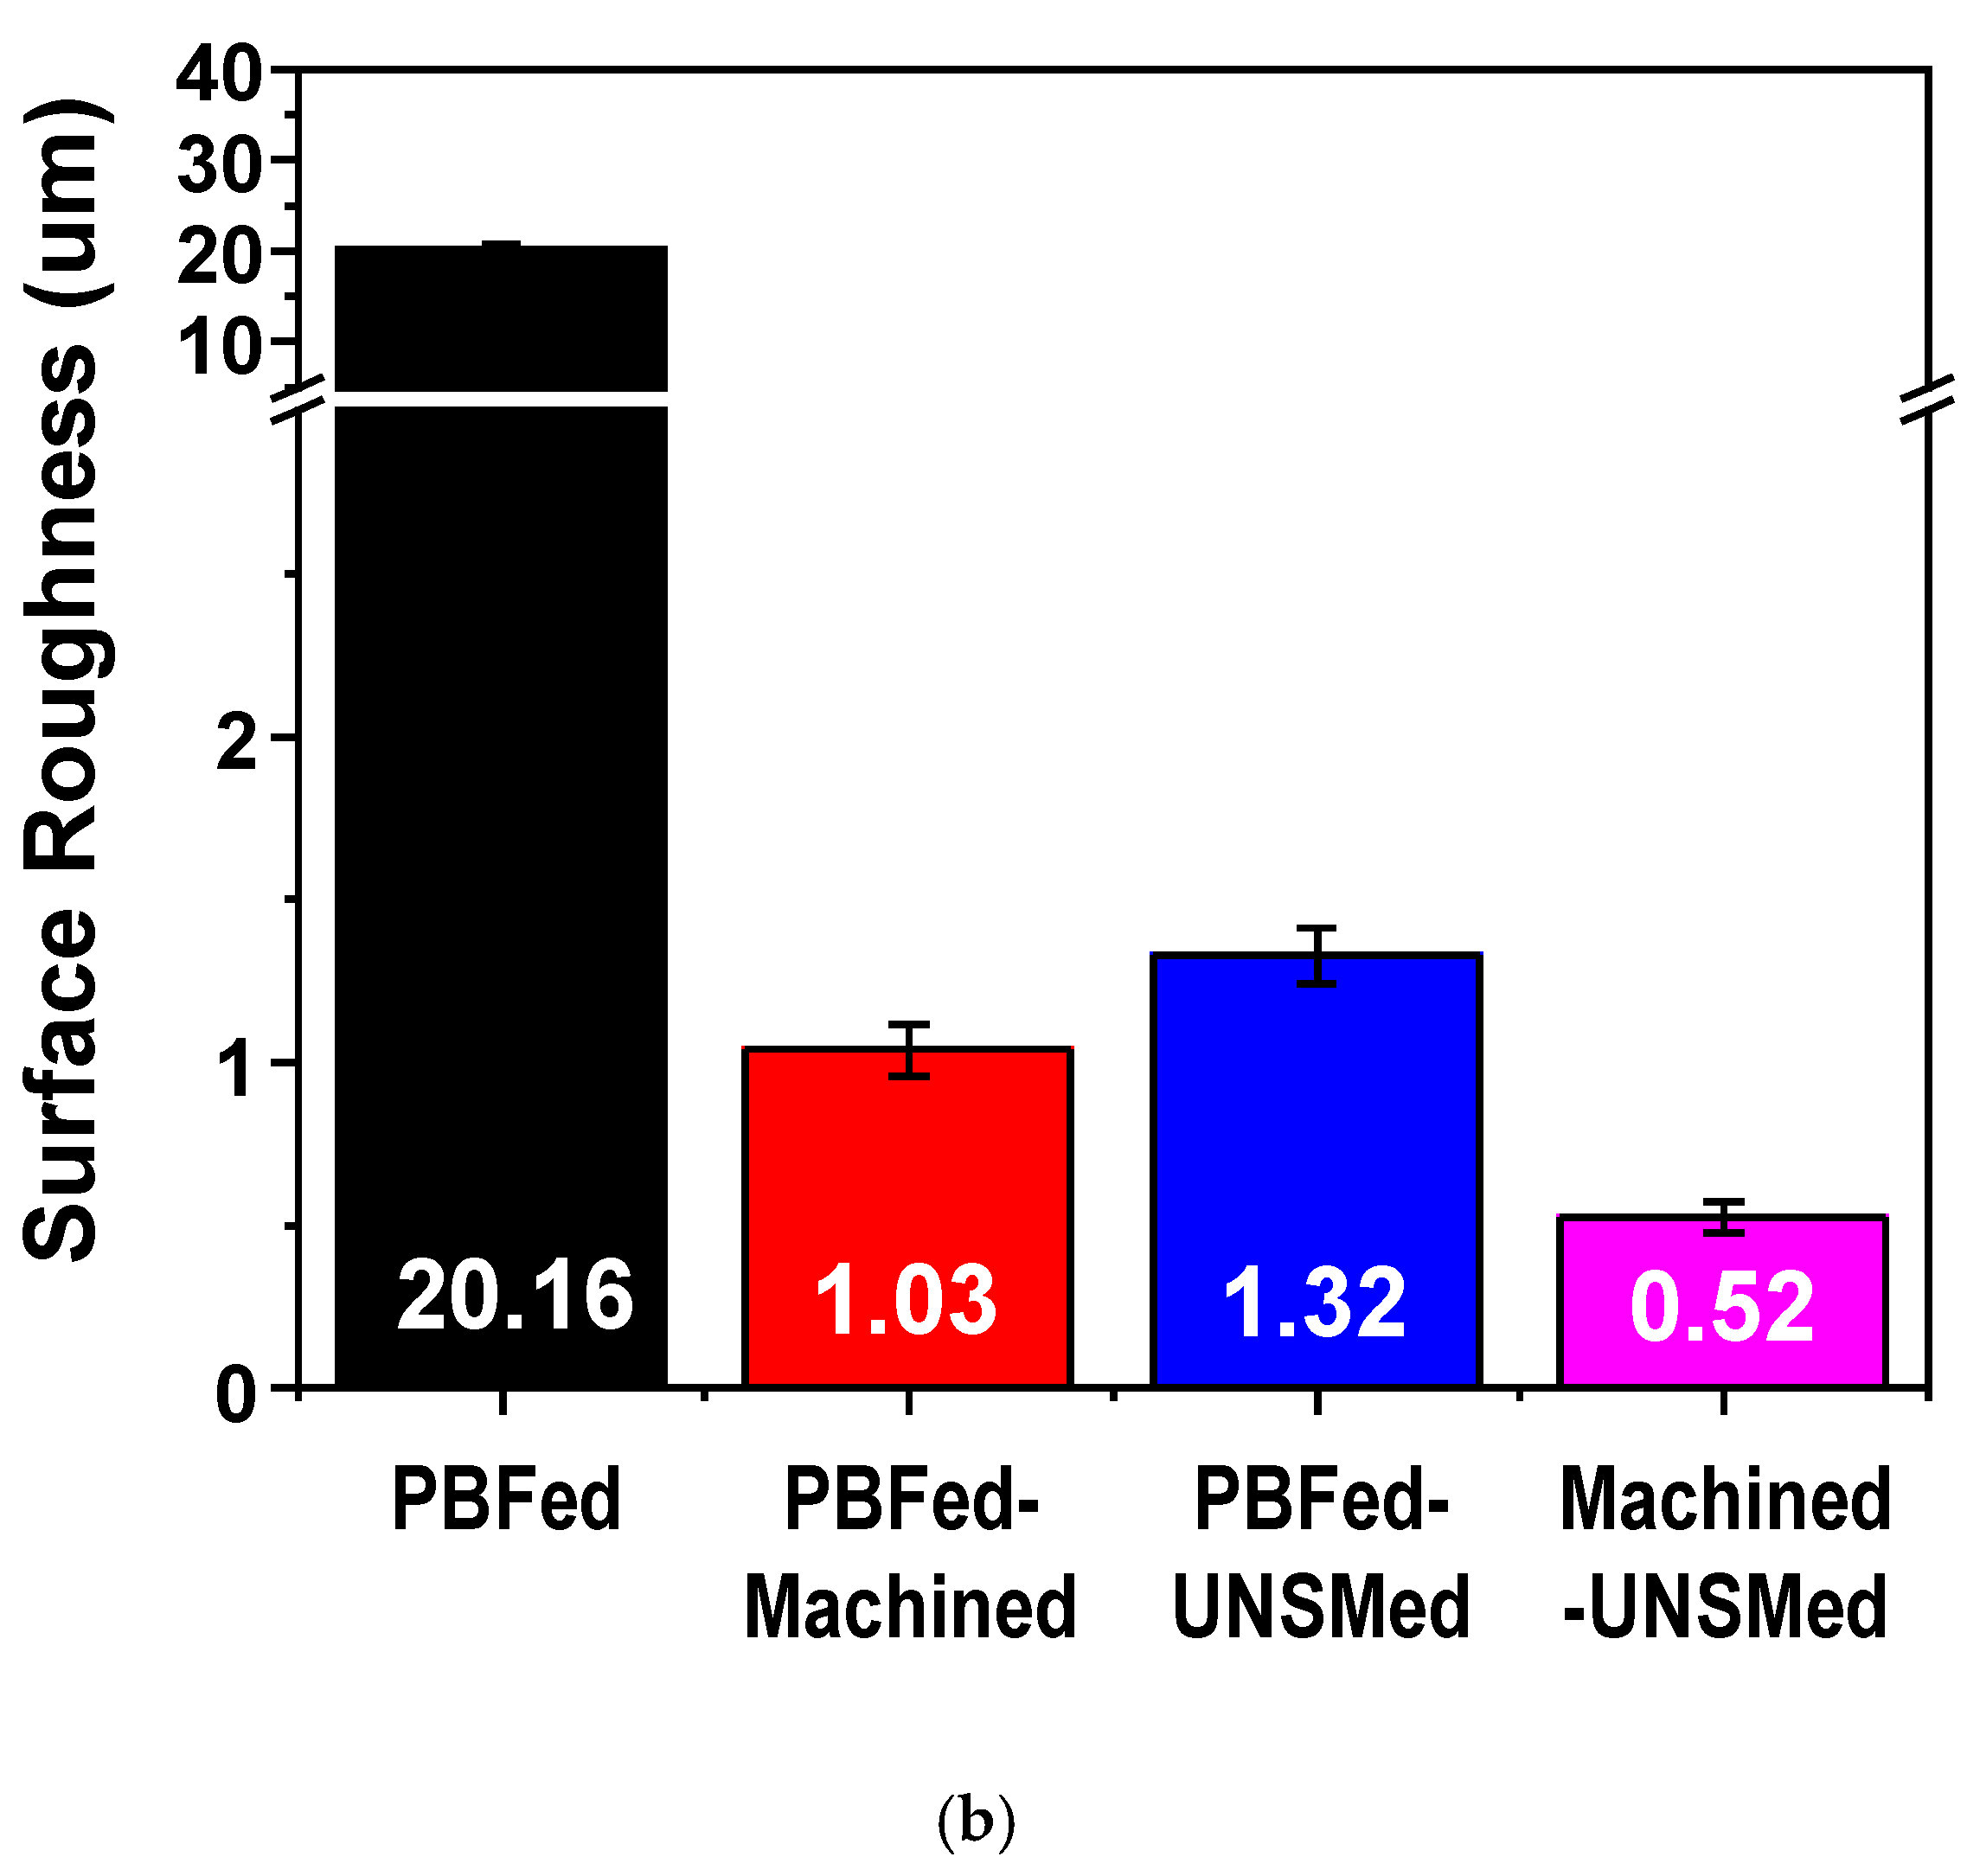
3.5.1. Roughness
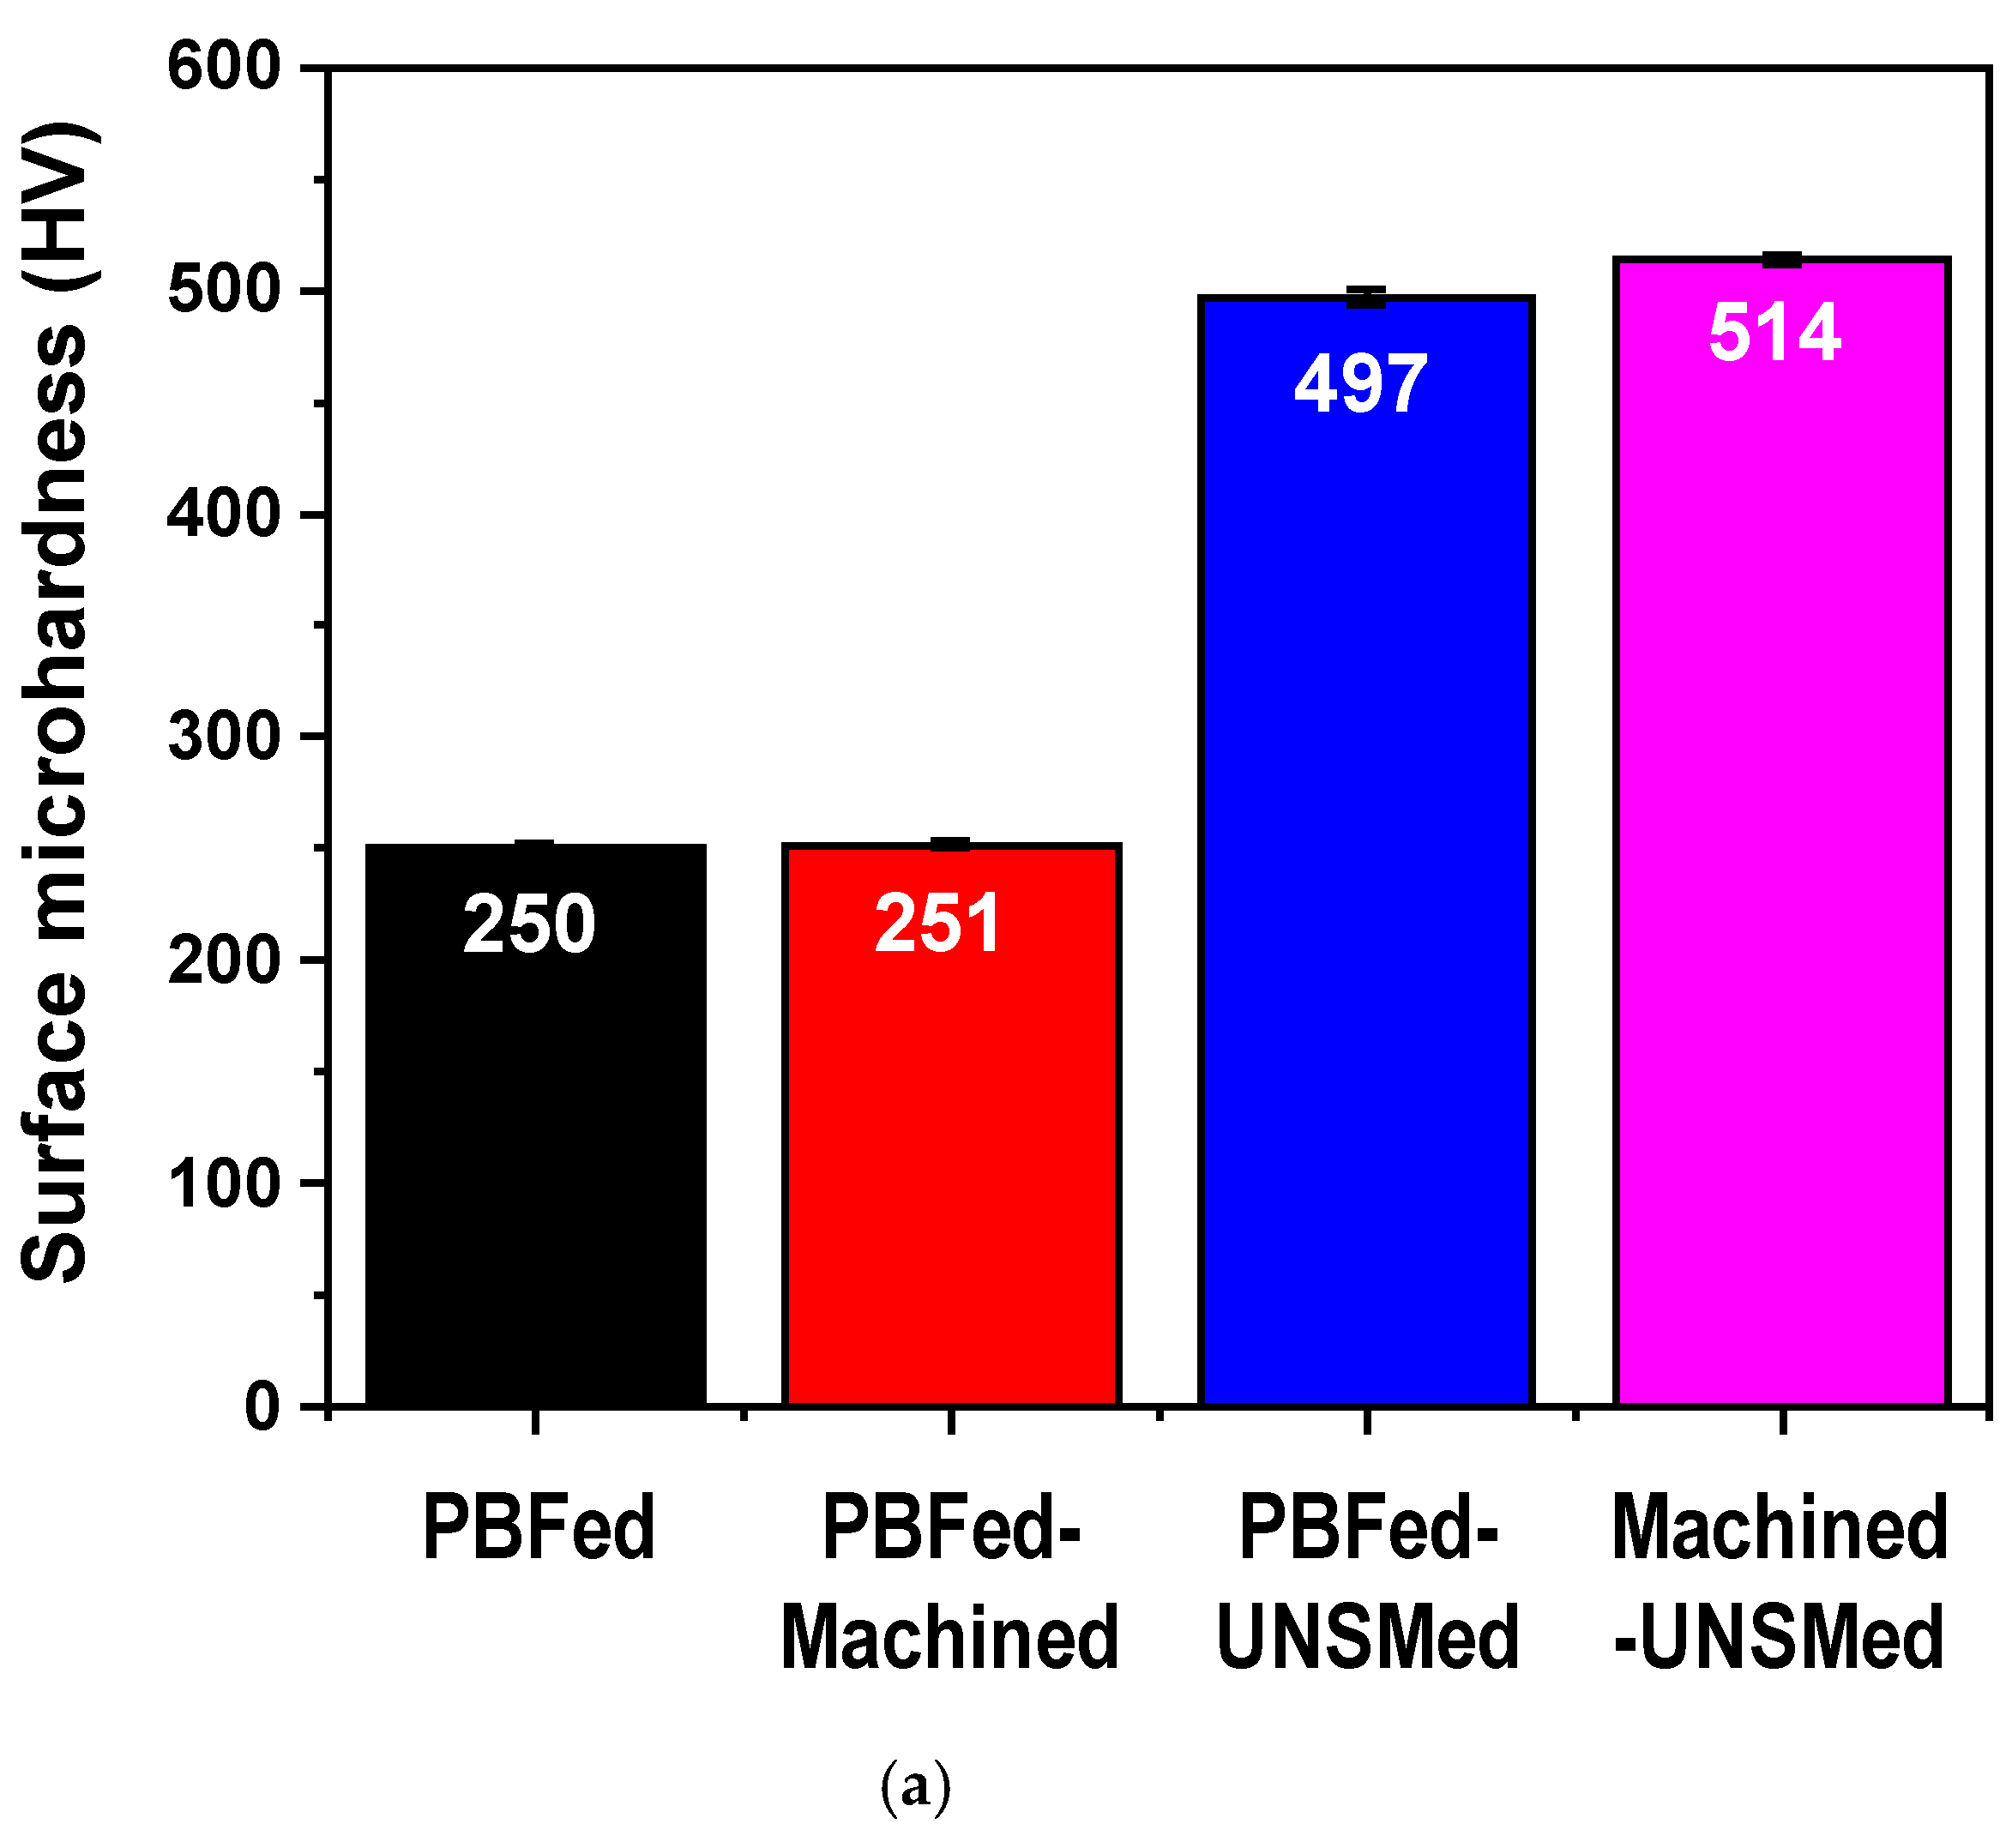
3.5.2. Hardness
3.5.3. Scratch Test
4. Discussion
5. Conclusions
Author Contributions
Funding
Institutional Review Board Statement
Informed Consent Statement
Data Availability Statement
Acknowledgments
Conflicts of Interest
References
- 3D Printing Scales up. The Economist, 5 September 2013. Available online: https://www.economist.com/technology-quarterly/2013/09/05/3d-printing-scales-up (accessed on 4 April 2021).
- Most Used 3D Printing Technologies 2017–2018|Statistic. Statista. Available online: https://www.statista.com/statistics/560304/worldwide-survey-3d-printing-top-technologies/ (accessed on 2 December 2018).
- Wang, J.; Lin, Y.; Yan, J.; Zen, D.; Zhang, Q.; Huang, R.; Fan, H. Influence of time on the microstructure of AISI 321 austenitic stainless steel in salt bath nitriding. Surf. Coat. Technol. 2012, 206, 3399–3404. [Google Scholar] [CrossRef]
- Lee, I.-S. The Influence of Treatment Condition during Low Temperature Plasma Carburizing of AISI304L Stainless Steel. J. Ocean Eng. Technol. 2011, 25, 56–60. [Google Scholar] [CrossRef][Green Version]
- Kim, Y.S.; Nam, K.W.; Kim, H.S.; Oh, M.S.; Kim, K.S. Mechanical properties of metal/ceramic FGM made by thermal spraying method. J. Power Syst. Eng. 1998, 2, 41–48. [Google Scholar]
- Song, S.H.; Choi, B.H. A study on the characteristics and the prediction of the fatigue strength of the induction surface hardened steel. J. Kor. Soc. Precis. Eng. 2001, 18, 122–130. [Google Scholar]
- Kim, J.-C.; Cheong, S.-K. Microscopic Analysis of Effect of Shot Peening on Corrosion Fatigue Behavior of Aluminum Alloy. Trans. Korean Soc. Mech. Eng. A 2012, 36, 1381–1389. [Google Scholar] [CrossRef]
- Han, M.-S.; Hyun, K.-Y.; Kim, S.-J. Effects of Shot Peening Time on Microstructure and Electrochemical Characteristics for Cu Alloy. J. Korean Soc. Mar. Environ. Saf. 2013, 19, 545–551. [Google Scholar] [CrossRef]
- Wu, J.; Liu, H.; Wei, P.; Zhu, C.; Lin, Q. Effect of shot peening coverage on hardness, residual stress and surface morphology of carburized rollers. Surf. Coat. Technol. 2020, 384, 125273. [Google Scholar] [CrossRef]
- Kim, J.-H.; Lee, W.-R.; Kim, T.-G.; Cheong, S.-K. Micro-Shockwave Measurement and Evaluation of Laser Shock Peening. Trans. Korean Soc. Mech. Eng. B 2011, 35, 1041–1046. [Google Scholar] [CrossRef]
- Kang, H.; Lee, S. Residual compressive stress characteristic using electromagnetic peening of AL6061-O. In Proceedings of the Society of Asian Scientists and Engineers (SASE) 2019 Spring Conference, Pittsburgh, PA, USA, 5–6 March 2019. [Google Scholar]
- Lee, S.-C.; Kim, J.-H.; Kim, H.-D.; Choi, G.-S.; Amanov, A.; Pyun, Y.-S. Changes in Mechanical Properties of WC-Co by Ultrasonic Nanocrystal Surface Modification Technique. J. Korean Soc. Tribol. Lubr. Eng. 2015, 31, 157–162. [Google Scholar] [CrossRef]
- Cho, I.-S.; Lee, C.-S.; Choi, C.-H.; Lee, H.-G.; Lee, M.G.; Jeon, Y. Effect of the Ultrasonic Nanocrystalline Surface Modification (UNSM) on Bulk and 3D-Printed AISI H13 Tool Steels. Metals 2017, 7, 510. [Google Scholar] [CrossRef]
- Kheradmandfard, M.; Kashani-Bozorg, S.F.; Kim, C.L.; Hanzaki, A.Z.; Pyoun, Y.S.; Kim, J.H.; Amanov, A.; Kim, D.E. Nanostructured β-type titanium alloy fabricated by ultrasonic nanocrystal surface modification. Ultrason. Sonochem. 2017, 39, 698–706. [Google Scholar] [CrossRef] [PubMed]
- Lim, T.-H.; Lee, C.-S.; Cho, I.-S.; Amanov, A. Better Surface Integrity and Tribological Properties of Steel Sintered by Powder Metallurgy. Materials 2020, 13, 3172. [Google Scholar] [CrossRef] [PubMed]
- Cao, X.; Xu, X.; Wang, C.; Pyoun, Y.; Wang, Q. Effect of Ultrasonic Surface Impact on the Fatigue Behavior of Ti-6Al-4V Subject to Simulated Body Fluid. Metals 2017, 7, 440. [Google Scholar] [CrossRef]
- Ma, C.; Dong, Y.; Ye, C. Improving surface finish of 3D-printed metals by ultrasonic nanocrystal surface modification. Proc. CIRP 2016, 45, 319–322. [Google Scholar] [CrossRef]
- Amanov, A.; Kim, J.H.; Pyun, Y.S. Microstructure and friction behavior of AISI 52100 and D2 steels subjected to ultrasonic nanocrystalline surface modification (UNSM) technique at a high temperature. Mater. Sci. Forum 2016, 879, 164–168. [Google Scholar] [CrossRef]
- Pyun, S.; Kim, H.S.; Son, K.G.; Song, G.H.; Kim, M.K.; Kang, J.H.; Choi, B.U.; Park, J.; Cho, I.H.; Kim, C.S.; et al. Development of D2 tool steel trimming knives with nanoscale microstructure. Proc. Conf. Mater. Sci. Technol. 2005, 2, 465. [Google Scholar]
- Zhang, H.; Zhao, J.; Liu, J.; Qin, H.; Ren, Z.; Doll, G.; Dong, Y.; Ye, C. The effects of electrically-assisted ultrasonic nanocrystal surface modification on 3D-printed Ti-6Al-4V alloy. Addit. Manuf. 2018, 22, 60–68. [Google Scholar] [CrossRef]
- Kim, M.S.; Oh, W.J.; Baek, G.Y.; Jo, Y.K.; Lee, K.Y.; Park, S.H.; Shim, D.S. Ultrasonic nanocrystal surface modification of high-speed tool steel (AISIM4) layered via direct energy deposition. J. Mater. Process. Technol. 2020, 277, 116420. [Google Scholar] [CrossRef]
- Sanseong, C.H.; Ro, J.S.; Pyoun, Y.S.; Amanov, A. Effects of High-temperature UNSM Treatment on Wear Resistance of Ti-6Al-4V Alloy Prepared by Selective Laser Melting. Tribol. Lubr. 2020, 36, 47–54. [Google Scholar]
- Amanov, A. A promising post-additive manufacturing surface modification for tailoring gradient nanostructure and harmonic structure in Co–Cr–Mo alloy. Vacuum 2020, 182, 109702. [Google Scholar] [CrossRef]
- Box, G.E.P.; Wilson, K.B. On the Experimental Attainment of Optimum Conditions. J. R. Stat. Soc. Ser. B (Stat. Methodol.) 1951, 13, 1–38. [Google Scholar] [CrossRef]
- Box, G.E.P.; Draper, N.R. Response Surfaces, Mixtures, and Ridge Analyses; Wiley: Hoboken, NJ, USA, 2007. [Google Scholar]
- Karmoker, J.R.; Hasan, I.; Ahmed, N.; Saifuddin, M.; Reza, S. Development and Optimization of Acyclovir Loaded Mucoadhesive Microspheres by Box—Behnken Design. Dhaka Univ. J. Pharm. Sci. 2019, 18, 1–12. [Google Scholar] [CrossRef]
- Asadi, N.; Zilouei, H. Optimization of organosolv pretreatment of rice straw for enhanced biohydrogen production using Enterobacter aerogenes. Bioresour. Technol. 2017, 227, 335–344. [Google Scholar] [CrossRef] [PubMed]
- Maran, J.P.; Sivakumar, V.; Sridhar, R.; Immanuel, V.P. Development of model for mechanical properties of tapioca starch based edible films. Ind. Crop. Prod. 2013, 42, 159–168. [Google Scholar] [CrossRef]
- Maran, J.P.; Manikandan, S. Response surface modeling and optimization of process parameters for aqueous extraction of pigments from prickly pear (Opuntia ficusindica) fruit. Dye. Pigment. 2012, 95, 465–472. [Google Scholar] [CrossRef]
- Khairallah, S.A.; Anderson, A.T.; Rubenchik, A.; King, W.E. Laser powder-bed fusion additive manufacturing: Physics of complex melt flow and formation mechanisms of pores, spatter, and denudation zones. Acta Mater. 2016, 108, 36–45. [Google Scholar] [CrossRef]
- Li, Y.; Gu, D. Thermal behavior during selective laser melting of commercially pure titanium powder: Numerical simulation and experimental study. Addit. Manuf. 2014, 1-4, 99–109. [Google Scholar] [CrossRef]
- Zheng, L.; Zhang, Q.; Cao, H.; Wu, W.; Ma, H.; Ding, X.; Yang, J.; Duan, X.; Fan, S. Melt pool boundary extraction and its width prediction from infrared images in selective laser melting. Mater. Des. 2019, 183, 108110. [Google Scholar] [CrossRef]
- Li, C.; Guo, Y.; Zhao, J. Interfacial phenomena and characteristics between the deposited material and substrate in selective laser melting Inconel. J. Mater. Process. Technol. 2017, 243, 269–281. [Google Scholar] [CrossRef]
- Umemoto, M. Nanocrystallization of Steels by Severe Plastic Deformation. Mater. Trans. 2003, 44, 1900–1911. [Google Scholar] [CrossRef]
- Tao, N.; Wang, Z.; Tong, W.; Sui, M.; Lu, J.; Lu, K. An investigation of surface nanocrystallization mechanism in Fe induced by surface mechanical attrition treatment. Acta Mater. 2002, 50, 4603–4616. [Google Scholar] [CrossRef]
- Zhang, H.W.; Hei, Z.K.; Liu, G.; Lu, J.; Lu, K. Formation of nanostructured surface layer on AISI 304 stainless steel by means of surface mechanical attrition treatment. Acta Mater. 2003, 51, 1871–1881. [Google Scholar] [CrossRef]
- Roland, T.; Retraint, D.; Lu, K.; Lu, J. Fatigue life improvement through surface nanostructuring of stainless steel by means of surface mechanical attrition treatment. Scr. Mater. 2006, 54, 1949–1954. [Google Scholar] [CrossRef]
- Carlson, R.R.; Lomax, R.G.; Freed, M.N.; Ryan, J.M.; Hess, R.K. Statistical Concepts: A Second Course for Education and the Behavioral Sciences. Am. Stat. 1993, 47, 308. [Google Scholar] [CrossRef]
- Khuri, A.I.; Cornell, J.A. Response Surfaces: Designs and Analyses; Marcel Dekker, Inc.: New York, NY, USA, 1996. [Google Scholar]
- Dunkler, D.; Plischke, M.; Leffondré, K.; Heinze, G. Augmented backward elimination: A pragmatic and purposeful way to develop statistical models. PLoS ONE 2014, 9, e113677. [Google Scholar] [CrossRef]
- Derringer, G.; Suich, R. Simultaneous Optimization of Several Response Variables. J. Qual. Technol. 1980, 12, 214–219. [Google Scholar] [CrossRef]
- Oh, W.J.; Lee, W.J.; Kim, M.S.; Jeon, J.B.; Shim, D.S. Repairing additive-manufactured 316L stainless steel using direct energy deposition. Opt. Laser Technol. 2019, 117, 6–17. [Google Scholar] [CrossRef]
- Ye, C.; Telang, A.; Gill, A.S.; Suslov, S.; Idell, Y.; Zweiacker, K.; Wiezorek, J.M.; Zhou, Z.; Qian, D.; Mannava, S.R.; et al. Gradient nanostructure and residual stresses induced by Ultrasonic Nano-crystal Surface Modification in 304 austenitic stainless steel for high strength and high ductility. Mater. Sci. Eng. A 2014, 613, 274–288. [Google Scholar] [CrossRef]
- Hall, E.O. The deformation and ageing of mild steel: Ⅲ discussion of results. Proc. Phys. Soc. Sect. B 1951, 64, 747. [Google Scholar] [CrossRef]


| Material | C | Si | Mn | P | S | Cr | Ni | Mo | Cu | N |
|---|---|---|---|---|---|---|---|---|---|---|
| 316 L stainless-steel | 0.019 | 0.68 | 1.23 | 0.013 | 0.004 | 17.8 | 12.8 | 2.36 | 0.05 | 0.1 |
| Parameters | Symbol | Unit | Coded Process Parameters and Level | ||
|---|---|---|---|---|---|
| Low (−1) | Medium (0) | High (1) | |||
| Ball tip | BT | mm | 2.38 | 4 | 6 |
| Interval | IN | μm | 10 | 50 | 90 |
| Load | SL | N | 10 | 30 | 50 |
| Standard Order | Run Order | Ball Tip | Interval | Load | |||
|---|---|---|---|---|---|---|---|
| Unit | Symbol | Unit | Symbol | Unit | Symbol | ||
| mm | BT | μm | IN | N | SL | ||
| 1 | 4 | 2.38 | −1 | 10 | −1 | 30 | 0 |
| 2 | 6 | 6 | 1 | 10 | −1 | 30 | 0 |
| 3 | 7 | 2.38 | −1 | 90 | 1 | 30 | 0 |
| 4 | 9 | 6 | 1 | 90 | 1 | 30 | 0 |
| 5 | 3 | 2.38 | −1 | 50 | 0 | 10 | −1 |
| 6 | 15 | 6 | 1 | 50 | 0 | 10 | −1 |
| 7 | 1 | 2.38 | −1 | 50 | 0 | 50 | 1 |
| 8 | 12 | 6 | 1 | 50 | 0 | 50 | 1 |
| 9 | 5 | 4 | 0 | 10 | −1 | 10 | −1 |
| 10 | 2 | 4 | 0 | 90 | 1 | 10 | −1 |
| 11 | 14 | 4 | 0 | 10 | −1 | 50 | 1 |
| 12 | 8 | 4 | 0 | 90 | 1 | 50 | 1 |
| 13 | 11 | 4 | 0 | 50 | 0 | 30 | 0 |
| 14 | 13 | 4 | 0 | 50 | 0 | 30 | 0 |
| 15 | 10 | 4 | 0 | 50 | 0 | 30 | 0 |
| Standard Order | Run Order | Ball Tip | Interval | Load | Surface Roughness (Ra) | Surface Hardness (SH) |
|---|---|---|---|---|---|---|
| BT | IN | SL | um | Hv | ||
| 1 | 4 | −1 | −1 | 0 | 1.19 | 473 |
| 2 | 6 | 1 | −1 | 0 | 2.46 | 441 |
| 3 | 7 | −1 | 1 | 0 | 1.88 | 422 |
| 4 | 9 | 1 | 1 | 0 | 3.17 | 422 |
| 5 | 3 | −1 | 0 | −1 | 3.61 | 417 |
| 6 | 15 | 1 | 0 | −1 | 4.11 | 424 |
| 7 | 1 | −1 | 0 | 1 | 1.63 | 473 |
| 8 | 12 | 1 | 0 | 1 | 2.51 | 434 |
| 9 | 5 | 0 | −1 | −1 | 4.43 | 431 |
| 10 | 2 | 0 | 1 | −1 | 4.75 | 409 |
| 11 | 14 | 0 | −1 | 1 | 3.19 | 469 |
| 12 | 8 | 0 | 1 | 1 | 2.59 | 432 |
| 13 | 11 | 0 | 0 | 0 | 3.15 | 429 |
| 14 | 13 | 0 | 0 | 0 | 3.34 | 431 |
| 15 | 10 | 0 | 0 | 0 | 2.33 | 430 |
| Source | Degrees of Freedom (DF) | Sum of Squares (Adj SS) | Mean Square (Adj MS) | F-Value | p-Value (Prob > F) | Significance |
|---|---|---|---|---|---|---|
| Model | 9 | 13.3490 | 1.48322 | 6.70 | 0.025 | significant |
| Linear | 3 | 8.1818 | 2.72727 | 12.31 | 0.010 | significant |
| BT | 1 | 1.9375 | 1.93750 | 8.75 | 0.032 | significant |
| IN | 1 | 0.1609 | 0.16092 | 0.73 | 0.433 | |
| SL | 1 | 6.0834 | 6.08340 | 27.46 | 0.003 | significant |
| Square | 3 | 4.9165 | 1.63882 | 7.40 | 0.028 | significant |
| BT × BT | 1 | 2.1814 | 2.18139 | 9.85 | 0.026 | significant |
| IN × IN | 1 | 0.0002 | 0.00022 | 0.00 | 0.976 | |
| SL × SL | 1 | 2.3570 | 2.35701 | 10.64 | 0.022 | significant |
| Interaction | 3 | 0.2507 | 0.08356 | 0.38 | 0.774 | |
| BT × IN | 1 | 0.0002 | 0.00017 | 0.00 | 0.979 | |
| BT × SL | 1 | 0.0361 | 0.03614 | 0.16 | 0.703 | |
| IN × SL | 1 | 0.2144 | 0.21437 | 0.97 | 0.370 | |
| Residual error | 5 | 1.1076 | 0.22152 | |||
| Lack-of-fit | 3 | 0.5304 | 0.17681 | 0.61 | 0.669 | Not significant |
| Pure error | 2 | 0.5772 | 0.28859 | |||
| Cor total | 14 | 14.4566 | ||||
| S = 0.470662 | R-sq = 92.34% | R-sq (adj) = 78.55% | ||||
| Source | Degrees of Freedom (DF) | Sum of Squares (Adj SS) | Mean Square (Adj MS) | F-Value | p-Value (Prob > F) | Significance | |
|---|---|---|---|---|---|---|---|
| Model | 9 | 5622.59 | 624.73 | 204.89 | 0.000 | significant | |
| Linear | 3 | 4601.40 | 1533.80 | 503.03 | 0.000 | significant | |
| BT | 1 | 519.16 | 519.16 | 170.26 | 0.000 | significant | |
| IN | 1 | 2083.02 | 2083.02 | 683.15 | 0.000 | significant | |
| SL | 1 | 1999.22 | 1999.22 | 655.66 | 0.000 | significant | |
| Square | 3 | 167.00 | 55.67 | 18.26 | 0.004 | significant | |
| BT × BT | 1 | 121.11 | 121.11 | 39.72 | 0.001 | significant | |
| IN × IN | 1 | 54.20 | 54.20 | 17.78 | 0.008 | significant | |
| SL × SL | 1 | 9.52 | 9.52 | 3.12 | 0.138 | ||
| Interaction | 3 | 854.19 | 284.73 | 93.38 | 0.000 | significant | |
| BT × IN | 1 | 253.84 | 253.84 | 83.25 | 0.000 | significant | |
| BT × SL | 1 | 544.51 | 544.51 | 178.58 | 0.000 | significant | |
| IN × SL | 1 | 55.83 | 55.83 | 18.31 | 0.008 | significant | |
| Residual error | 5 | 15.25 | 3.05 | ||||
| Lack- of-fit | 3 | 13.09 | 4.36 | 4.05 | 0.204 | Not significant | |
| Pure error | 2 | 2.16 | 1.08 | ||||
| Cor total | 14 | 5637.84 | |||||
| S = 1.74618 | R-sq = 99.73% | R-sq (adj) = 99.24% | |||||
Publisher’s Note: MDPI stays neutral with regard to jurisdictional claims in published maps and institutional affiliations. |
© 2021 by the authors. Licensee MDPI, Basel, Switzerland. This article is an open access article distributed under the terms and conditions of the Creative Commons Attribution (CC BY) license (https://creativecommons.org/licenses/by/4.0/).
Share and Cite
Cho, S.-Y.; Kim, M.-S.; Pyun, Y.-S.; Shim, D.-S. Strategy for Surface Post-Processing of AISI 316L Additively Manufactured by Powder Bed Fusion Using Ultrasonic Nanocrystal Surface Modification. Metals 2021, 11, 843. https://doi.org/10.3390/met11050843
Cho S-Y, Kim M-S, Pyun Y-S, Shim D-S. Strategy for Surface Post-Processing of AISI 316L Additively Manufactured by Powder Bed Fusion Using Ultrasonic Nanocrystal Surface Modification. Metals. 2021; 11(5):843. https://doi.org/10.3390/met11050843
Chicago/Turabian StyleCho, Seung-Young, Min-Seob Kim, Young-Sik Pyun, and Do-Sik Shim. 2021. "Strategy for Surface Post-Processing of AISI 316L Additively Manufactured by Powder Bed Fusion Using Ultrasonic Nanocrystal Surface Modification" Metals 11, no. 5: 843. https://doi.org/10.3390/met11050843
APA StyleCho, S.-Y., Kim, M.-S., Pyun, Y.-S., & Shim, D.-S. (2021). Strategy for Surface Post-Processing of AISI 316L Additively Manufactured by Powder Bed Fusion Using Ultrasonic Nanocrystal Surface Modification. Metals, 11(5), 843. https://doi.org/10.3390/met11050843