Article

Hot Deformation Behavior and Hot Rolling Properties of a Nano-Y2O3 Addition Near-α Titanium Alloy

1
State Key Laboratory of Advanced Welding and Joining, Harbin Institute of Technology, Harbin 150001, China
2
School of Materials Science and Engineering, Harbin Institute of Technology, Harbin 150001, China
3
College Vanadium and Titanium, Panzhihua University, Panzhihua 617000, China
*
Author to whom correspondence should be addressed.
Metals 2021, 11(5), 837; https://doi.org/10.3390/met11050837
Submission received: 20 April 2021 / Revised: 15 May 2021 / Accepted: 17 May 2021 / Published: 19 May 2021
(This article belongs to the Special Issue Casting and Rolling of Alloys)

Abstract

:
The hot deformation behavior and hot rolling based on the hot processing map of a nano-Y2O3 addition near-α titanium alloy were investigated. The isothermal compression tests were conducted at various deformation temperatures (950–1070 °C) and strain rates (0.001–1 s−1), up to a true strain of 1.2. The flow stress was strongly dependent on deformation temperature and strain rate, decreasing with increased temperature and decreased strain rate. The average activation energy was 657.8 kJ/mol and 405.9 kJ/mol in (α + β) and β region, respectively. The high activation energy and peak stress were contributed to the Y2O3 particles and refractory elements comparing with other alloys and composites. The deformation mechanisms in the (α + β) region were dynamic recovery and spheroidization of α phase, while the β phase field was mainly controlled by the dynamic recrystallization and dynamic recovery of β grains. Moreover, the constitutive equation based on Norton–Hoff equation and hot processing map were also obtained. Through the optimal processing window determined by the hot processing map at true strains of 0.2, 0.4 and 0.6, the alloy sheet with multi-pass hot rolling (1050 °C/0.03–1 s−1) was received directly from the as-cast alloy. The ultimate tensile strength and yield strength of the alloy sheet were 1168 MPa and 1091 MPa at room temperature, and 642 MPa and 535 MPa at 650 °C, respectively, which performs some advantages in current research.

1. Introduction

Due to the low density and high strength-to-weight ratio, titanium and titanium alloys have been widely used in the aerospace field [1,2]. As for the high-temperature titanium alloys, their outstanding high-temperature properties, such as creep-strength-to-weight ratio and fatigue-strength-to-weight ratio, has a unique advantage on the elevated parts of the aircraft engine [3]. Replacing nickel-based high-temperature alloys with Ti alloys around 600 °C can largely reduce the component weights under the same strength without affecting its serviceability [4]. Hence, titanium alloys have considerable application potential in the high-temperature components of aerospace fields.
However, the defects of the as-cast alloys are inherent problems, which can affect the high-temperature operating properties. Fortunately, thermomechanical processing (TMP) is an effective way to control the evolution of microstructure and eliminate the inherent defects, thereby greatly improving the mechanical properties [5,6,7]. Gaisin [5] reported that yield strength increases by 30% at 700 °C, and creep performance significantly improves over a near-α Ti alloy, when the forged alloy is compared with the casting one. Su [8] also indicated that the elongation of the as-forged alloy at room temperature is nearly 13%, and the UTS at room temperature and high temperature have both obviously improved. Zhang [9] found that DRX takes place in the matrix microstructure of multistep rolling processing of the as-cast composite. The tensile strength of the as-rolled composites is significantly enhanced compared with the as-cast composites, both at RT and over 873 K. Microstructure refinement and the load-sharing effect of uniformly distributed reinforcement are the main strengthening factors.
During TMP for specific alloys, microstructure character is a function of deformation parameters, such as temperature, strain rate and strain, and the systematic research of the effect of deformation parameters on the flow behavior and the microstructure evolution has been done extensively using an effective method of high-temperature compression tests [10,11,12]. By this means, the flow stress-strain behavior is related to the dynamic recovery (DRV) and dynamic recrystallization (DRX) that determined by the different compression parameters. Based on the thermo-physical simulation, Prasad [13] proposed the dynamic material model (DMM) to describe the inner-relationship between microstructure and thermomechanical processing parameters, after that Murty [14] revised this model. With the superimposition of the instability map on the power dissipation map, a hot processing map can be obtained, which has been used to predict the workability conditions for developing the optimum processing parameters. Sun [10] developed a hot processing map according to the microstructure evolution of titanium matrix composite. The softening mechanisms in the stable zone during deformation were determined: DRX at 900 °C/0.01–0.1 s−1, while the periodic competition of DRV and DRX is at 950–1100 °C/0.1 s−1. This difference is attributed to the decreasing of activation energy at elevated temperatures. Based on the hot processing maps obtained by the hot compression tests, the forging billet of titanium alloy with good quality is obtained [8]. Wang [15] found that globularization of α phase tends to occur preferentially at junctions of lamellae or inside certain colonies, showing significant orientation correlations under uniaxial compression. Chen [16] investigated Ti60 alloy with the initial lamellar microstructure, the results show that the flow softening is attributed to the spheroidization of α lath at low strain rate or elevated temperature. The optimum deformation parameters for the spheroidization are also obtained for avoiding the local flow region. As mentioned above, the hot deformation behavior and hot processing map determined by high-temperature compression can effectively guide the materials processing.
At present, 0.5 wt.% nano-Y2O3 particles added to a near-α Ti alloy in casting have been studied before in [17], which exhibits that ultimate tensile strength (UTS) and yield strength (YS) are enhanced both at room temperature and elevated temperature as compared with the matrix. In this work, the hot deformation behavior of the near-α titanium alloy with nano-Y2O3 addition in casting is conducted for the purpose of eliminating casting defects and improving the high-temperature service properties. Therefore, the objective of the present work is to explore the influence of deformation parameters on the flow behavior and establish a hot processing map that can provide the optimum parameters for the subsequent hot rolling, which demonstrates the practicality of the hot processing map.

2. Materials and Experimental Procedure

2.1. Materials

A near-α titanium alloy with 0.5 wt.% nano-Y2O3 (~0.4 vol.%) powders (~30 nm) addition is used as experimental material, whose nominal composition is Ti-6Al-4Sn-7Zr-0.8Mo-1Nb-1W-0.25Si (wt.%). The temperature of β→α is about 1010 °C. The microstructure of the as-cast alloy is typical Widmanstatten with parallel lamellar α/β structure (shown in Figure 1), and the detailed analysis of microstructure is described in a previous work [17]. The hot compression cylindrical specimens with 12 mm in height and 8 mm in diameter were cut from the as-cast ingot, keeping the specimen axis parallel to the ingot axis. Before compression, the cylindrical specimens were mechanically polished with 60–1200 grids of SiC paper in water.

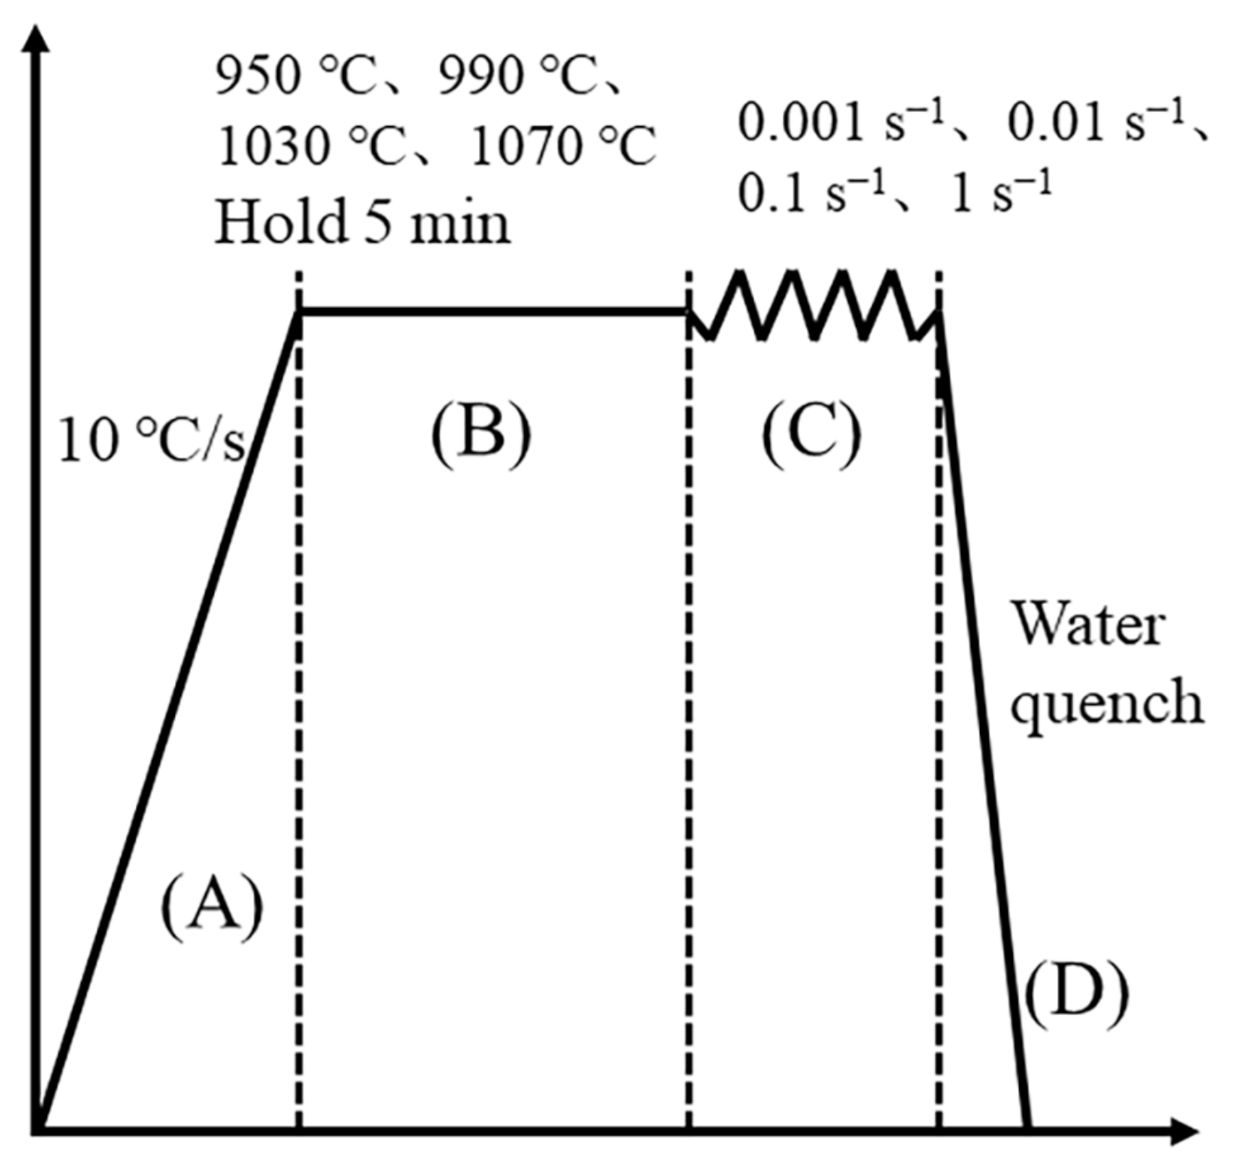
2.2. Hot Compression Test

The hot compression test was conducted at the Gleeble 1500D thermal simulation testing machine (DSI, INC. St. Paul, MN, USA). To minimize the friction between specimens and indenter, Tantalum flakes were used at the end of the specimens. Therefore, the obtained true stress-true strain curves were not friction corrected.
The specific hot working process simulates the corresponding real deformation conditions, with β forging related to the ingot crushing process and the (α + β) forging related to the final shape. Each specimen was heated at a rate of 10 °C/s to deformation temperature (950 °C, 990 °C, 1030 °C, and 1070 °C), then held at each deformation temperature for 5 min. After that, they can be compressed at different strain rates (0.001 s−1, 0.01 s−1, 0.1 s−1, and 1 s−1) with a total strain of 1.2 (deformation reduction is 70%), as depicted in Figure 2. After the compression, the specimens were put out of the machine rapidly and put into the water immediately for the purpose of preserving the high-temperature deformed microstructure. For the cylindrical specimens, their surfaces should be ground smooth with metallographic sandpaper of different meshes. It is necessary to maintain the cylindricity of the side face and the parallelism of the two bottoms.

2.3. Microstructural Characterization

After hot compression, the specimens were cut parallel to the compression direction by a wire cut electro discharge machine. The microstructural observation for the hot compression specimens and hot rolling alloy sheet were performed on OLYMPUS BH2-UMA (OLYMPUS, Tokyo, Japan) for optical microscope (OM) and Quanta 200FEG (FEI, Hillsboro, OR, USA) field emission scanning electron microscope (SEM). The specimens for microstructure observation were initially mechanically polished with 60–2000 grid SiC paper in water. Then, they were electropolished by using an electrolyte containing 600 mL methanol + 300 mL butoxyethanol + 100 mL perchloric acid. Finally, the specimens were etched in the Kroll’s reagent (10 mL HF, 30 mL HNO3, and 500 mL H2O).

2.4. Tensile Testing

The tensile tests were conducted at room temperature at an initial deformation speed of 0.5 mm/min by Instron 5569 (Instron Corporation, Canton, NY, USA) testing machine. The high-temperature tensile tests were conducted at 650 °C with 1 mm/min by Instron 5500R (Instron Corporation, Canton, NY, USA) testing machine, and the tensile specimen was held at 650 °C for 5 min before tensile.

3. Results and Discussion

3.1. Deformation Characteristics

Figure 3 shows the stress-strain curves of Y2O3/Ti alloy in the β region (1070 °C and 1030 °C) and α + β region (990 °C and 950 °C) with different strain rates (1 s−1, 0.1 s−1, 0.01 s−1, and 0.001 s−1). The flow stress curves show a dependence on strain rate and temperature. The flow curves in the α + β region exhibit peak stress, and then gradually fall towards a lower level and have a steady-state stage at the strain increase, while in the β region, relatively steady-state stages, but no maximum stress, are obtained. Those curves are called the type of “DRX” and “DRV” in the α + β and β region, respectively. According to previous results, the flow softening may be associated with the adiabatic shear bands, dynamic recovery, dynamic recrystallization, microcracking or spheroidization of α phase, and so on [18,19]. However, the hot deformation of a Ti-6Al-4V alloy with initial lamellar microstructure suggests that the softening is related to the change of dislocation substructure and crystallographic texture during deformation processing [20]. A sharp drop after reaching peak stress at a very small strain is shown at 1030 °C/0.1 s−1 and 1070 °C/1 s−1 in Figure 3c,d, which is attributed to the competition of work hardening of high-density dislocations during the initial deformation processing and the softening by the dislocation annihilation and deformation heat at high strain rate; moreover, the dynamic spheroidization may be also a non-negligible factor [21]. In addition, this phenomenon was also found in TC11 [22] and Ti600 [23] at high strain rate, which can be explained by the static and dynamic theory: the static theory involving dislocation locking and unlocking, and the dynamic theory including the sudden increase of new mobile dislocations generated from the grain boundary sources [24].
According to the stress-strain curves in Figure 3, the relationship between peak stress and temperature or strain rate is shown in Figure 4. The flow peak stress sharply decreases not only with the increase in deformation temperature in a certain strain rate, which is associated with the thermal activation and diffusion process at the high temperature [25]; but also with the decrease in strain rate in a certain deformation temperature, which can be explained by the following equation [26]:
ε ˙ = ρ v b   and   v = A σ m
where ε ˙ is strain rate, ρ is mobile dislocation density, b is Burgers vector of a perfect dislocation, and ν is average dislocation velocity. This circumstance is consistent with previous works [27,28]. Furthermore, comparing the peak stress with other similar alloys, the value in the present work is apparently larger, such as 1070 °C/1 s−1 of this work vs. 1050 °C/1 s−1 of Ti600, 1030 °C/1 s−1 vs. 1000 °C/1 s−1 of Ti600 and 950 °C/1 s−1 of Ti600 [29], and some conditions in Ti1100 [30]. The high peak stress may be attributed to the refractory elements of Zr, Nb and W, which have the strongly solution-strength effect. The 2 wt.% Zr addition has the significantly solution-strength effect owing to a misfit of the atomic radius [31], as for this alloy, the 7 wt.% Zr content is an important factor for the high peak stress. The addition of nano-Y2O3 particles can also have a beneficial effect on suppressing the movement of dislocations or grain boundaries during deformation and increasing the peak stress, which can also be demonstrated by the high deformation activation energy as compared with other alloys and composites in the next section.

3.2. Kinetic Analysis

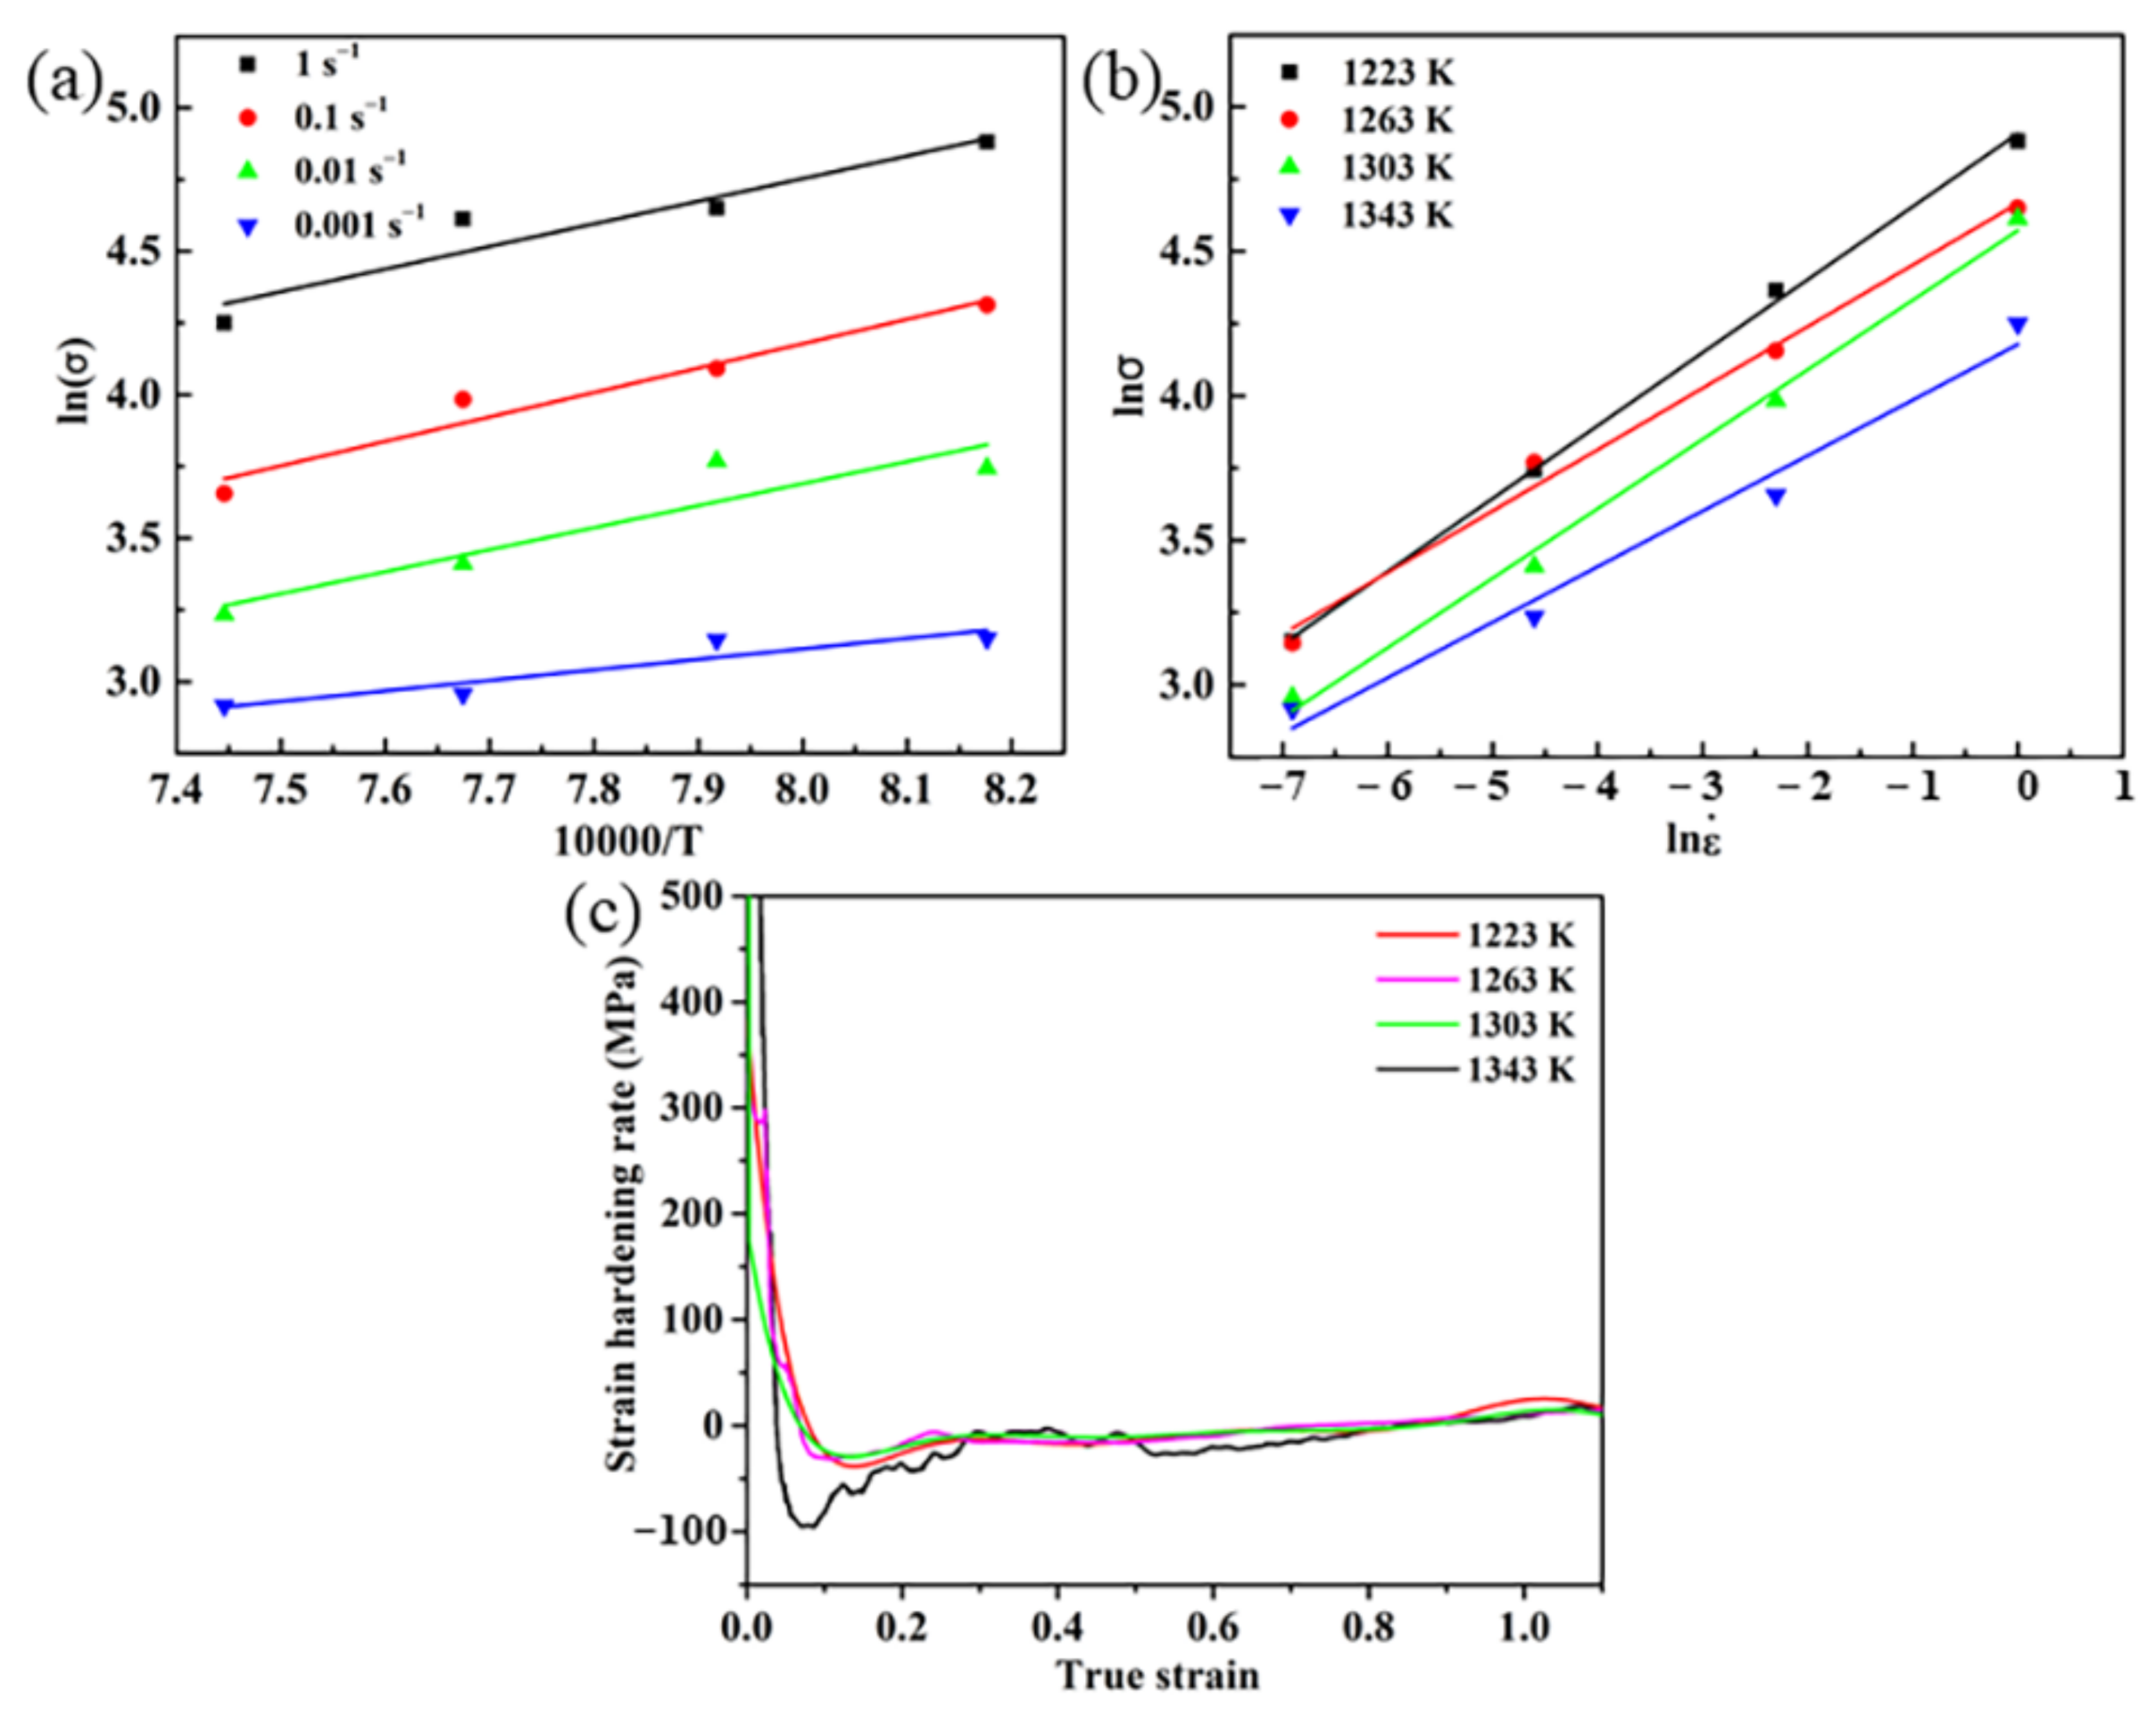
3.2.1. Deformation Activation Energy

The Arrhenius-type equation is a comprehensive consideration of the effect of deformation temperature and strain rate on the flow stress of Y2O3/Ti alloy in thermomechanical processing. It can be given as follows [32]:
ε ˙ = A f ( σ ) e x p Q R T
where ε ˙ is the strain rate (s−1), σ is the flow stress (MPa), Q is the apparent activation energy for hot deformation (kJ/mol), R is the gas constant (8.314 J/mol · K), T is the deformation temperature (K), A is the material constants. Hence, the function f ( σ ) can be described in three forms as follows:
f ( σ ) = σ n 1   ( α σ   <   0.8 )
f ( σ ) = e x p β σ   ( α σ   >   1.2 )
f ( σ ) = s i n h α σ n   ( for   all   α σ )
where n1, n, β and α are the material constants, and α = β/n1. Under the premise of temperature has no effect on the activation energy, taking Equations (3)–(5) into Equation (2) and then taking the natural logarithm of both sides of the new equations:
l n   ε ˙ = l n A 1 Q R T + n 1 l n σ
l n   ε ˙ = l n A 2 Q R T + β σ
l n   ε ˙ = l n A Q R T + n l n s i n h σ α
where A1, A2 and A are the constants of each equation.
In other words, the parameters n1, β, n, and Q can be calculated as follows:
n 1 = l n ε ˙ l n σ T
β = l n ε ˙ σ T
n = l n ε ˙ l n s i n h α σ T
Q = R n l n s i n h α σ 1 / T ε ˙
Therefore, according to the above derivation process, the curves plotted in Figure 5 can obtain the corresponding parameters in Equations (9)–(12).
The value of stress exponent n is 3.6 and 3.9 in (α + β) and β phase region, respectively, which is consistent with the dislocation creep behavior [33], and this processing is controlled by dislocation climb [33,34,35]. The average activation energies of Y2O3/Ti alloy were calculated, the Q is 657.8 kJ/mol and 405.9 kJ/mol in (α + β) and β phase region, respectively. The difference in the activation energies stems from the various deformation mechanisms in various regions. The activation energies compared with other alloys is illustrated in Table 1, the results in the present work are larger than the self-diffusion activation energies of Ti [36,37], but close to some alloys [10,38], which gives a remarkable conclusion that the hot deformation is controlled by the thermal activation process and the deformation mechanism is DRX but not diffusion in β single phase field like in an earlier study [39]. Meanwhile, the Y2O3 particles may also hinder the dislocation motion to improve the activation energy, similar to the research of TiB/Ti60 [39] and TiBw/TA15 [40], indicating that the addition of ceramic particles makes an increase in flow stress, then a high deformation temperature is necessary. In addition, as mentioned above, the high content of Zr and other refractory elements, Mo, Nb, and W, make the interaction with dislocations, which is an important factor for the increase in Q. The high activation energy makes it more difficult to deform, so it is meaningful to determine the suitable hot deformation parameters through establishing the hot processing map.

3.2.2. Constitutive Equation

As depicted in the above stress-strain curves, it is obvious that the flow stress of the Y2O3/Ti alloy is related to the deformation conditions, strain rate, temperature and strain. However, the Arrhenius-type equation also has limitations due to the lack of strain. In order to better establish the relationship between flow stress and deformation parameters, the modified Norton–Hoff (NH) model may be a suitable choice for the accurate prediction [41], and the model obtained strain correction factor, b, is shown as follows:
σ ε , ε ˙ , T = K ε + b n T ε ˙ m T e x p ( β T )
n T = n 0 · e x p c n T T 0
m T = m 0 · e x p c m T T 0
where K is the material constant, m is the strain rate sensitivity coefficient, n is the strain hardening exponent, β is the temperature parameter. n0, m0, cn (K−1), and cm (K−1) are the material constants, and T(K) and T0(K) are the absolute temperature and reference temperature, respectively.
The following model is the transformed constitutive equation format by making the natural logarithm for both sides of Equation (13):
l n σ = l n K + n l n ε + b + m l n ε ˙ + β T
From Equation (16), a series of mathematical fittings have been done for the parameters K, b, n, m and β. The relationship between ln σ and deformation temperature (T) is linear at a constant strain of −0.5, as shown in Figure 6a. The linear relationship between flow stress and strain rate in double logarithm coordination is plotted at a constant strain of −0.5 in Figure 6b. In order to simplify the equation, the strain rate sensitivity coefficient and the strain hardening exponent are all considered as constant, as a result, the constitutional equation of the Y2O3/Ti alloy at elevated temperature is determined as follows:
σ ε , ε ˙ , T = 0.562 ε + 0.08 0.268 ε ˙ 0.23 e x p ( 6936.6 T )
Figure 6c shows the strain hardening rates of Y2O3/Ti alloy at a constant strain rate of 0.001 s−1. What can be seen is the strain hardening rates drop rapidly with the increasing strain during the hot deformation. It is believed that this process is associated with the competition of flow softening and work hardening. Because of the motion of dislocations by climb, the high-density dislocations decrease by the rearrangement of dislocations, which can result in the cancel with each other, and eventually, the strain hardening rate drops. With the increase in strain combined with the spheroidization or DRX, the softening process will increase and exceed the level of work hardening, and a negative strain hardening rate will be obtained simultaneously. Finally, the strain hardening rate reaches relative stability around zero at the strain of −0.3 in this work; this is due to the dynamic equilibrium between work hardening and dynamic softening process.

3.3. Hot Processing Map

A processing map is an effective approach to optimizing the thermal processing parameters, based on the dynamic materials model (DMM) proposed by Prasad [13]. In addition, depending on the fundamental principles of continuum mechanics of large plastic deformation, physical systems modeling and irreversible thermodynamics, it is a very suitable model for distinct materials [42]. The DMM describes the two complementary functions G and J constituted to P, which is the total power absorbed by the work piece during deformation. G represents the dissipation energy value arising from plastic deformation, much of which converts to heat, and the rest is reserved in the form of distortion energy. Only J is associated with the microstructure evolution, such as dynamic recrystallization, inner cracks, and adiabatic shear bands. The relationship between P, G, and J can be described by the following equation [42,43]:
P = σ ¯   ε ˙ ¯ = G + J = 0 ε ˙ ¯ σ ¯   d ε ˙ ¯ + 0 σ ¯ ε ˙ ¯   d   σ ¯
where σ ¯ is equivalent stress and ε ˙ ¯ is equivalent strain rate. The partitioning of power between J and G is given as follows:
J G ε ¯ , T = ε ˙ ¯ σ ¯ σ ¯ ε ˙ ¯ ε ¯ , T = l n σ ¯ l n ε ˙ ¯ ε ¯ , T = m
where m is the strain rate sensitivity coefficient and ε ¯ is equivalent strain. When it satisfies the ideal liner dissipator (m = 1), the maximum value of J can be received as follows:
J m a x = P 2
Therefore, the efficiency of power dissipation ( η ) can be defined as follows:
η = J J m a x = 2 m m + 1
where η is a function of ε ˙ and T. The contour line in the power dissipation map is relevant to the relative entropy yield in respect to the microstructure evolution. Generally, a higher η represents the suitable condition for thermomechanical processing. Because a high η may also occur in the unstable zone, microstructure observation is necessary. As for the evaluation of unstable flow, instability maps based on the principles of irreversible thermodynamics on large plastic deformation is also introduced by Prasad, which is always related to dynamic strain aging, adiabatic shear bands, flow localization, mechanical twinning, kinking or flow rotations, and so on [44]. So, a dimensionless parameter ξ ε ˙ ¯ about instability criterion can be defined as follows:
ξ ( ε ˙ ¯ ) = l n m 1 + m l n ε ˙ ¯ + m < 0
Based on the discussion above, the processing map can be established by the integration of the power dissipation map (by Equation (21)) and the instability map (by Equation (22)). Given a specific strain, the power dissipation value and instability region are a function of temperature and strain rate in the hot processing map. Figure 7 exhibits the hot processing maps with various strains of 0.2, 0.4 and 0.6, respectively. The number in the maps represents the value of power dissipation, while the gridlines region corresponds to unstable zones. According to the power dissipation theory [45], the maximum efficiency of the high stacking fault energy (SFE) materials is about 0.5–0.55, 0.53 in the strain of 0.4 was obtained in Figure 7b. Moreover, the value of η in the range of 0.3–0.55 is the typical dynamic recrystallization zones and below 0.3 is always the unstable zones. The area with η value greater than 0.55 is usually cracked or superplastic. As for the lamellar α/β microstructure, spheroidization of α phase at elevated temperature, caused by the shearing of lamellar, is considered to be a type of DRX behavior [44]. The hot processing map can be divided into three parts except the unstable zones under the strain of 0.2, 0.4 and 0.6, as shown in Figure 7c. Apparently, regions Ⅰ and Ⅱ are in the (α + β) region, but the power dissipation values in region Ⅰ is larger than region Ⅱ, which indicates that the deformation mechanism is distinctly different from each other. A spheroidization of α lath in region Ⅰ, and dynamic recovery (DRV) accompanied by a small amount of DRX in region Ⅱ have been found in the following part. Specimens in different phase regions are expected to deform by different deformation mechanisms, hence, this may result in variation in the deformed microstructures. The maximum power dissipation value in region Ⅲ reaches to 0.45, which is consistent with the occurrence of DRX β grain in the next section. As a result, considering the above analysis comprehensively, the optimum deformation parameters are 950–1010 °C/0.03–0.4 s−1 in (α + β) region, and 1010–1070 °C/0.03–1 s−1 in β region.

3.4. Microstructural Evolution

In order to explore the deformation characteristics of the hot deformation behavior, the microstructure evolution of Y2O3/Ti alloy after hot compression has been investigated. Figure 8 illustrates the longitudinal section microstructure of the Y2O3/Ti alloy deformed at different conditions in the (α + β) phase field, while Figure 9 is in the β phase field. The distribution of Y2O3 particles is perpendicular to the compression direction. In the (α + β) phase field, kinking of α lamellas can be found when deformation at 950 °C/1 s−1 (Figure 8a). This may be the blocked α/β boundary caused by the interface hardening due to the dislocation accumulation at low temperature and the Y2O3 particles distributed in the inner grain, which contribute to hinderance of the dislocation. The fracture of Y2O3 may be the coordinated deformation with the matrix during hot deformation. However, the bending α colonies are beneficial to the spheroidization of α phase no matter what deformation conditions is. When the strain rate below 1 s−1 (Figure 8b,c,e), the spheroidization of α phase can be found, and the mechanism of this process is attributed to the fracture of α phase; subsequently β phase inserts an α lamellar by the combined effect of local shearing and boundary tension, which is named as “boundary splitting model” [46]. The schematic diagram of this process is also shown in previous work [23], dislocations arrangement in the early stage provides the driving force for the globularization, which causes the dislocation pile-ups at the intersections of intraphase. Therefore, for the sake of interface balance, β phase penetrates into α lath and diffusion will occur, eventually makes the migration of the interface driven by interfacial energy. At 950 °C/0.001 s−1 in Figure 8f, the hardening rate caused by dislocation accumulation may be too slow to make the fracture of α phase occurred, so the DRV with grain boundary bowed out can take place. Moreover, DRV and DRX can be seen at 990 °C/0.001 s−1 in Figure 8f. However, the content of DRX grains is so small that it is not regarded as occurring DRX when the ratio is below 5%, thereby demonstrating that the deformation mechanism may be DRV and spheroidization of α phase. In the β single phase field, DRX may be the main characteristic. As a result, the deformation mechanism is DRV and spheroidization of α phase in (α + β) region.
With the β→α transformation has been finished thoroughly, the microstructure evolution mainly concentrates on the β phase where more and more DRV grains appear. Form the deformed samples at 1030 °C/(0.001 s−1 and 0.1 s−1) and 1070 °C /(0.01 s−1 and 1 s−1) in Figure 9, the elongated original β grains and limited DRX grains mainly distributed in GB can be found. The size of the DRX grains significantly increases with the decreasing strain rate, no matter what temperature reaches; this is because the lower strain rate provides sufficient time for the prior β phase to grow up at elevated temperatures [40]. As combined with the DRX and the bow-out grain boundary phenomenon, the deformation mechanism is mainly DRX accompanied by DRV in β single region. In order to improve the DRX abilities and refine the microstructure, a heat treatment is needed after hot deformation [47]. Above discussion is consistent with the prediction of the hot processing map in the stable zones, which indicates the reliability of the hot processing map.

3.5. As-Rolled Alloy Sheet and Properties

According to the above discussion, the application of the hot processing map to prepare hot-rolling Y2O3/Ti alloy sheet through the as-cast material without forging can be a very meaningful work. Taking the hot processing map at different strains into consideration, the reduction is 30–50% per pass with a total reduction of more than 80% can be determined in multi-pass rolling. The hot-rolling conditions may be conducted at 1050 °C/0.03–1 s−1, and the thin sheet with good deformation performance and no cracks has been obtained. In addition, an annealing treatment was conducted at 950 °C/1 h/FC after hot-rolling. Figure 10 shows the microstructure of the as-rolled Y2O3/Ti alloy sheet, a hybrid microstructure with α/β lamellar and basket-weave feature can be clearly seen, and a large amount of α phase distributes in grain boundary. The grain size is smaller than the as-cast alloy after deformation and annealing. The grown Y2O3 particles during melting are distributed in the lamellar α/β interface and grain boundary, which will affect the tensile properties of the sheet. Simultaneously, there are some spheroidization α phases distributed in the inner-grain, which may form at the static recrystallization stage.
Tensile properties of the as-rolled Y2O3/Ti alloy sheet at different temperature are illustrated in Figure 11, showing a significant improvement when compared with the as-cast properties [17]. The UTS and YS of the as-rolled Y2O3/Ti alloy sheet at room temperature is 1168 MPa and 1091 MPa, about 23.2% and 35.5% higher than the as-cast Y2O3/Ti alloy, respectively. Corresponding UTS and YS properties at 650 °C is 642 MPa and 535 MPa, with increased by 15% and 29.2%, respectively, which is also outstanding strength when take DsTi700 and BTi-6431S into consideration [8]. When it comes to the mechanical properties of metal materials, it is impossible to neglect the deformation history and the final microstructure. Therefore, the increased strength of the sheet may be attributed to the refined grain by the recrystallization during the deformation and subsequent annealing, and the mobile dislocations impeded by the Y2O3 particles. In Figure 10, the basket-weave microstructure constituted with interlocked α plates has the feature of short dislocations slip distance and hard to transmit slip, which is beneficial to the interaction between dislocations that may result in the dislocations’ strength effect. However, it is well-known that the slip of dislocations is the dominant mechanism of plastic deformation in crystallization materials. Therefore, the ductility in this alloy sheet may be associated with the competition between the short dislocation slip distance due to the lamellar α/β and the coordinated deformation abilities of equiaxial α phase [48]. However, the lower ductility may be associated with the grain boundary α. As deformation proceeds, numbers of dislocations accumulate at the grain boundary, and it is difficult for them to further movement. Therefore, the pile-up of the dislocations leads to the high stress concentration, which strongly hinders the dislocation motion. Though a litter amount of globularization α in inner-grain can undertake deformation caused by the accumulated dislocations, the content is too small to make the effect limited. As a result, it will make the occurrence of pores and cracks at grain boundaries [49]. Therefore, the ductility in room temperature of the as-rolled sheet needs further improvement by heat treatment.

4. Conclusions

In the present work, the deformation behavior during isothermal compression and tensile properties after hot-rolling of a near-α Ti-6Al-4Sn-7Zr-0.8Mo-1Nb-1W-0.25Si alloy with 0.5 wt.% nano-Y2O3 addition were investigated. The conclusions can be summarized as follows:
  • Y2O3/Ti alloy shows a remarkable sensitivity to temperature and strain rate. The flow stress decreases with increase in temperature and decrease in strain rate. The average activation energy is 657.8 kJ/mol and 405.9 kJ/mol in (α + β) and β phase region, respectively. The high activation energy and peak stress are contributed to the Y2O3 particles and refractory elements as compared with other alloys and composites. Meanwhile, the constitutive equation based on Norton–Hoff (NH) model is established as follows:
σ ε , ε ˙ , T = 0.562 ε + 0.08 0.268 ε ˙ 0.225 e x p ( 6936.6 T )
2.
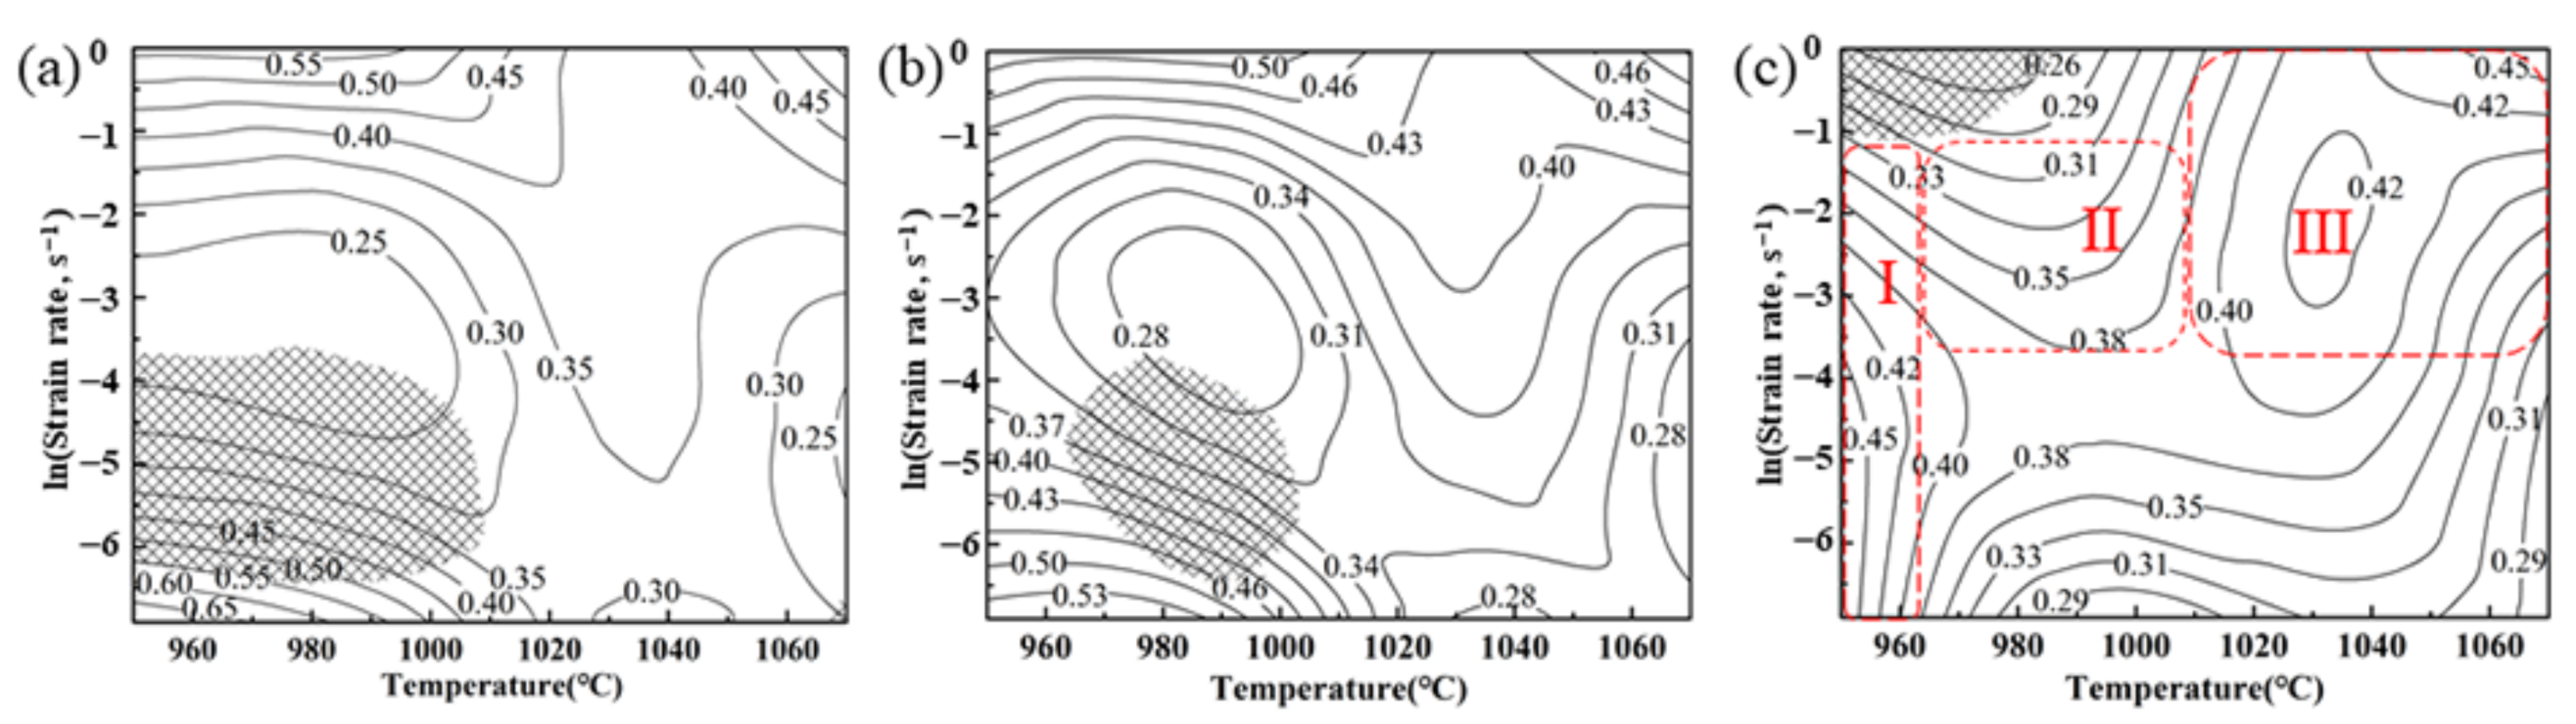
Hot processing maps are developed at 0.2, 0.4 and 0.6 true strain with clear deformation stable and unstable domains at different deformation parameters. The optimal deformation windows are 950–1010 °C/0.03–0.4 s−1 in (α + β) region, and 1010–1070 °C/0.03–1 s−1 in β region, respectively.
3.
As for the deformation mechanism, the (α + β) region is DRV and spheroidization of α phase, while β region is mainly controlled by the DRX and DRV of β grains.
4.
According to the hot processing map, the Y2O3/Ti alloy sheet with good deformation ability is obtained directly from the as-cast alloy. The ultimate tensile strength and yield strength of the sheet are 1168 MPa and 1091 MPa at room temperature, and are 642 MPa and 535 MPa at 650 °C.

Author Contributions

Conceptualization, Z.Z., Y.C. and F.K.; methodology, Z.Z.; validation, X.W., Y.Y. and Z.Z.; formal analysis, Z.Z.; investigation, Z.Z.; resources, Y.C. and F.K.; data curation, Z.Z. and X.W.; writing—original draft preparation, Z.Z.; writing—review and editing, Z.Z., Y.C. and Y.Y.; visualization, Y.Y.; supervision, Y.C., F.K. and X.W.; project administration, Y.C. and X.W.; funding acquisition, Y.C. All authors have read and agreed to the published version of the manuscript.

Funding

This research was funded by the National Key R&D Project of China, grant number 2017YFE0123500 and the Sichuan Science and Technology Program, grant number 2019YFG0082.

Data Availability Statement

The data that support the findings of this study are available from the corresponding author, Yuyong Chen, upon reasonable request.

Conflicts of Interest

The authors declare that they have no conflict of interest.

References

  1. Zhang, C.J.; Guo, C.X.; Zhang, S.Z.; Feng, H.; Chen, C.Y.; Zhang, H.Z.; Cao, P. Microstructural manipulation and improved mechanical properties of a near α titanium alloy. Mater. Sci. Eng. A 2020, 771, 138569. [Google Scholar] [CrossRef]
  2. Xiao, S.; Chen, Y.; Li, M.; Xu, L.; Tian, J.; Zhang, D.; Yang, J. The improved properties and microstructure of β-solidify TiAl alloys by boron addition and multi steps forging process. Sci. Rep. 2019, 9, 12393. [Google Scholar] [CrossRef] [Green Version]
  3. Zheng, Z.; Xiao, S.; Wang, X.; Guo, Y.; Yang, J.; Xu, L.; Chen, Y. High temperature creep behavior of an as-cast near-α Ti–6Al–4Sn–4Zr–0.8Mo–1Nb–1W–0.25Si alloy. Mater. Sci. Eng. A 2021, 803, 140487. [Google Scholar] [CrossRef]
  4. Banerjee, D.; Williams, J.C. Perspectives on Titanium Science and Technology. Acta Mater. 2013, 61, 844–879. [Google Scholar] [CrossRef]
  5. Gaisin, R.A.; Imayev, V.M.; Imayev, R.M. Effect of hot forging on microstructure and mechanical properties of near α titanium alloy/TiB composites produced by casting. J. Alloy. Compd. 2017, 723, 385–394. [Google Scholar] [CrossRef]
  6. Sun, S.; Zhao, E.; Hu, C.; An, Y.; Chen, W. Precipitation behavior of silicide and synergetic strengthening mechanisms in TiB-reinforced high-temperature titanium matrix composites during multi-directional forging. J. Alloy. Compd. 2021, 867, 159051. [Google Scholar] [CrossRef]
  7. Wang, S.; Huang, L.; Jiang, S.; Zhang, R.; Liu, B.; Sun, F.; An, Q.; Jiao, Y.; Geng, L. Microstructure evolution and tensile properties of as-rolled TiB/TA15 composites with network microstructure. Mater. Sci. Eng. A 2021, 804, 140783. [Google Scholar] [CrossRef]
  8. Su, Y.; Kong, F.; You, F.; Wang, X.; Chen, Y. The high-temperature deformation behavior of a novel near-α titanium alloy and hot-forging based on the processing map. Vacuum 2020, 173, 109135. [Google Scholar] [CrossRef]
  9. Zhang, C.; Guo, C.; Zhang, S.; Feng, H.; Han, J.; Kong, F.; Chen, Y. The Effect of Rolling Temperature on the Microstructure and Mechanical Properties of 5vol.% (TiBw+TiCp)/Ti Composites. JOM 2020, 72, 1376–1383. [Google Scholar] [CrossRef]
  10. Sun, S.; Zhao, E.; Hu, C.; Tian, Y.; Chen, W.; Cui, H.; Chen, R. Deformation behavior and softening mechanism of TiB reinforced near-α titanium matrix composite during hot compression. J. Mater. Res. Technol. 2020, 9, 13250–13263. [Google Scholar] [CrossRef]
  11. Li, C.; Huang, L.; Zhao, M.; Guo, S.; Li, J. Hot deformation behavior and mechanism of a new metastable β titanium alloy Ti–6Cr–5Mo–5V–4Al in single phase region. Mater. Sci. Eng. A 2021, 814, 141231. [Google Scholar] [CrossRef]
  12. Zhang, Z.; Fan, J.; Tang, B.; Kou, H.; Wang, J.; Chen, Z.; Li, J. Microstructure/texture evolution maps to optimize hot deformation process of near-α titanium alloy. Prog. Nat. Sci. Mater. Int. 2020, 30, 86–93. [Google Scholar] [CrossRef]
  13. Prasad, Y.V.R.K.; Gegel, H.L.; Doraivelu, S.M.; Malas, J.C.; Morgan, J.T.; Lark, K.A.; Barker, D.R. Modeling of dynamic material behavior in hot deformation: Forging of Ti-6242. Metall. Trans. A 1984, 15, 1883–1892. [Google Scholar] [CrossRef]
  14. Murty, S.V.S.N.; Rao, B.N. On the development of instability criteria during hotworking with reference to IN718. Mater. Sci. Eng. A 1998, 254, 76–82. [Google Scholar] [CrossRef]
  15. Wang, L.; Fan, X.G.; Zhan, M.; Jiang, X.Q.; Liang, Y.F.; Zheng, H.J.; Liang, W.J. Revisiting the lamellar globularization behavior of a two-phase titanium alloy from the perspective of deformation modes. J. Mater. Process. Technol. 2021, 289, 116963. [Google Scholar] [CrossRef]
  16. Chen, W.; Zeng, W.; Xu, J.; Zhou, D.; Wang, S.; He, S. Deformation behavior and microstructure evolution during hot working of Ti60 alloy with lamellar starting microstructure. J. Alloy. Compd. 2019, 792, 389–398. [Google Scholar] [CrossRef]
  17. Yang, J.; Xiao, S.; Yuyong, C.; Xu, L.; Wang, X.; Zhang, D.; Li, M. Effects of nano-Y2O3 addition on the microstructure evolution and tensile properties of a near-α titanium alloy. Mater. Sci. Eng. A 2019, 761, 137977. [Google Scholar] [CrossRef]
  18. Liu, P.; Han, Y.; Qiu, P.; Xu, F.; Chen, Y.; Du, L.; Huang, G.; Mao, J.; Lu, W. Isothermal deformation and spheroidization mechanism of (TiB + La2O3)/Ti composites with different initial structures. Mater. Charact. 2018, 146, 15–24. [Google Scholar] [CrossRef]
  19. Zeng, W.D.; Shu, Y.; Zhang, X.M.; Zhou, Y.G.; Zhao, Y.Q.; Wu, H.; Dai, Y.; Yang, J.; Zhou, L. Hot workability and microstructure evolution of highly β stabilised Ti-25V-15Cr-0·3Si alloy. Mater. Sci. Technol. 2013, 24, 1222–1229. [Google Scholar] [CrossRef]
  20. Park, C.H.; Kim, J.H.; Hyun, Y.T.; Yeom, J.T.; Reddy, N.S. The origins of flow softening during high-temperature deformation of a Ti-6Al-4V alloy with a lamellar microstructure. J. Alloy. Compd. 2014, 582, 126–129. [Google Scholar] [CrossRef]
  21. Doherty, R.D.; Hughes, D.A.; Humphreys, F.J.; Jonas, J.J.; Jensen, D.J.; Kassner, M.E.; King, W.E.; McNelley, T.R.; McQueen, H.J.; Rollett, A.D. Current issues in recrystallization: A review. Mater. Sci. Eng. A 1997, 238, 219–274. [Google Scholar] [CrossRef] [Green Version]
  22. Jing, L.; Fu, R.D.; Wang, Y.P.; Qiu, L.; Yan, B. Discontinuous yielding behavior and microstructure evolution during hot deformation of TC11 alloy. Mater. Sci. Eng. A 2017, 704, 434–439. [Google Scholar] [CrossRef]
  23. Han, Y.; Zeng, W.; Qi, Y.; Zhao, Y. The influence of thermomechanical processing on microstructural evolution of Ti600 titanium alloy. Mater. Sci. Eng. A 2011, 528, 8410–8416. [Google Scholar] [CrossRef]
  24. Jia, W.; Zeng, W.; Zhou, Y.; Liu, J.; Wang, Q. High-temperature deformation behavior of Ti60 titanium alloy. Mater. Sci. Eng. A 2011, 528, 4068–4074. [Google Scholar] [CrossRef]
  25. Zhao, Q.Y.; Yang, F.; Torrens, R.; Bolzoni, L. Evaluation of the hot workability and deformation mechanisms for a metastable beta titanium alloy prepared from powder. Mater. Charact. 2019, 149, 226–238. [Google Scholar] [CrossRef]
  26. Mitchell, T.E.; Hirth, J.P.; Misra, A. Apparent activation energy and stress exponent in materials with a high Peierls stress. Acta Mater. 2002, 50, 1087–1093. [Google Scholar] [CrossRef]
  27. He, D.; Zhu, J.C.; Lai, Z.H.; Liu, Y.; Yang, X.W. An experimental study of deformation mechanism and microstructure evolution during hot deformation of Ti-6Al-2Zr-1Mo-1V alloy. Mater. Des. 2013, 46, 38–48. [Google Scholar] [CrossRef] [Green Version]
  28. Huang, L.J.; Geng, L.; Li, A.B.; Cui, X.P.; Li, H.Z.; Wang, G.S. Characteristics of hot compression behavior of Ti-6.5Al-3.5Mo-1.5Zr-0.3Si alloy with an equiaxed microstructure. Mater. Sci. Eng. A 2009, 505, 136–143. [Google Scholar] [CrossRef]
  29. Han, Y.; Zeng, W.; Qi, Y.; Zhao, Y. Optimization of forging process parameters of Ti600 alloy by using processing map. Mater. Sci. Eng. A 2011, 529, 393–400. [Google Scholar] [CrossRef]
  30. Ma, F.; Shi, Z.; Liu, P.; Li, W.; Liu, X.; Chen, X.; He, D.; Zhang, K.; Pan, D.; Zhang, D. Strengthening effect of in situ TiC particles in Ti matrix composite at temperature range for hot working. Mater. Charact. 2016, 120, 304–310. [Google Scholar] [CrossRef]
  31. Shimagami, K.; Ito, T.; Toda, Y.; Yumoto, A.; Yamabe-Mitarai, Y. Effects of Zr and Si addition on high-temperature mechanical properties and microstructure in Ti-10Al-2Nb-based alloys. Mater. Sci. Eng. A 2019, 756, 46–53. [Google Scholar] [CrossRef]
  32. Cheng, C.; Chen, Z.; Li, H.E.; Wang, X.; Zhu, S.; Wang, Q. Vacuum superplastic deformation behavior of a near-α titanium alloy TA32 sheet. Mater. Sci. Eng. A 2021, 800, 140362. [Google Scholar] [CrossRef]
  33. Zhang, Z.; Fan, J.; Li, R.; Kou, H.; Chen, Z.; Wang, Q.; Zhang, H.; Wang, J.; Gao, Q.; Li, J. Orientation dependent behavior of tensile-creep deformation of hot rolled Ti65 titanium alloy sheet. J. Mater. Sci. Technol. 2021, 75, 265–275. [Google Scholar] [CrossRef]
  34. Hosseini, R.; Morakabati, M.; Abbasi, S.M.; Hajari, A. Development of a trimodal microstructure with superior combined strength, ductility and creep-rupture properties in a near alpha titanium alloy. Mater. Sci. Eng. A 2017, 696, 155–165. [Google Scholar] [CrossRef]
  35. Nie, X.; Liu, H.; Zhou, X.; Yi, D.; Huang, B.; Hu, Z.; Xu, Y.; Yang, Q.; Wang, D.; Gao, Q. Creep of Ti-5Al-5Mo-5V-1Fe-1Cr alloy with equiaxed and lamellar microstructures. Mater. Sci. Eng. A 2016, 651, 37–44. [Google Scholar] [CrossRef]
  36. Li, M.; Pan, H.; Lin, Y.; Luo, J. High temperature deformation behavior of near alpha Ti-5.6Al-4.8Sn-2.0Zr alloy. J. Mater. Process. Technol. 2007, 183, 71–76. [Google Scholar] [CrossRef]
  37. Liu, Y.; Baker, T.N. Deformation characteristics of IMI685 titanium alloy under β isothermal forging solutions. Mater. Sci. Eng. A 1995, 197, 125–131. [Google Scholar] [CrossRef]
  38. Zhang, C.J.; Sun, Y.G.; Chen, Y.F.; Lian, Y.Z.; Zhang, S.Z.; Feng, H.; Zhou, Y.W.; Kong, F.T.; Chen, Y.Y. Deformation behavior and microstructure evolution mechanism of 5vol.%(TiBw + TiCp)/Ti composites during isothermal compression. Mater. Charact. 2019, 154, 212–221. [Google Scholar] [CrossRef]
  39. Wang, B.; Huang, L.J.; Geng, L.; Rong, X.D. Compressive behaviors and mechanisms of TiB whiskers reinforced high temperature Ti60 alloy matrix composites. Mater. Sci. Eng. A 2015, 648, 443–451. [Google Scholar] [CrossRef]
  40. Zhang, R.; Wang, D.; Huang, L.; Yuan, S.; Geng, L. Deformation behaviors and microstructure evolution of TiBw/TA15 composite with novel network architecture. J. Alloy. Compd. 2017, 722, 970–980. [Google Scholar] [CrossRef]
  41. Zhang, S.; Feng, D.; Huang, Y.; Wei, S.; Mohrbacher, H.; Zhang, Y. Constitutive Modeling of High-Temperature Flow Behavior of an Nb Micro-alloyed Hot Stamping Steel. J. Mater. Eng. Perform. 2016, 25, 948–959. [Google Scholar] [CrossRef]
  42. Kumar, B.; Saxena, K.K.; Dey, S.R.; Pancholi, V.; Bhattacharjee, A. Processing map-microstructure evolution correlation of hot compressed near alpha titanium alloy (TiHy 600). J. Alloy. Compd. 2017, 691, 906–913. [Google Scholar]
  43. Wan, Z.; Hu, L.; Sun, Y.; Wang, T.; Li, Z. Hot deformation behavior and processing workability of a Ni-based alloy. J. Alloy. Compd. 2018, 769, 367–375. [Google Scholar] [CrossRef]
  44. Prasad, Y.V.R.K.; Seshacharyulu, T. Processing maps for hot working of titanium alloys. Mater. Sci. Eng. A 1998, 243, 82–88. [Google Scholar] [CrossRef]
  45. Prasad, Y.V.R.K.; Seshacharyulu, T. Modelling of hot deformation for microstructural control. Int. Mater. Rev. 1998, 43, 243–258. [Google Scholar] [CrossRef]
  46. Yang, J.; Xiao, S.; Chen, Y.; Xu, L.; Wang, X.; Tian, J.; Zhang, D.; Zheng, Z. Microstructure evolution during forging deformation of (TiB + TiC + Y2O3)/α-Ti composite: DRX and globularization behavior. J. Alloy. Compd. 2020, 827, 154170. [Google Scholar] [CrossRef]
  47. Wang, K.; Wu, M.; Yan, Z.; Li, D.; Xin, R.; Liu, Q. Microstructure evolution and static recrystallization during hot rolling and annealing of an equiaxed-structure TC21 titanium alloy. J. Alloy. Compd. 2018, 752, 14–22. [Google Scholar] [CrossRef]
  48. Li, D.; Wang, K.; Yan, Z.; Cao, Y.; Misra, R.D.K.; Xin, R.; Liu, Q. Evolution of microstructure and tensile properties during the three-stage heat treatment of TA19 titanium alloy. Mater. Sci. Eng. A 2018, 716, 157–164. [Google Scholar] [CrossRef]
  49. Liu, C.; Lu, Y.; Tian, X.; Liu, D. Influence of continuous grain boundary α on ductility of laser melting deposited titanium alloys. Mater. Sci. Eng. A 2016, 661, 145–151. [Google Scholar] [CrossRef]
Figure 1. As-cast near-α titanium alloy with 0.5 wt.% nano-Y2O3 addition, (a) low magnify and (b) high magnify.
Metals 11 00837 g001
Figure 2. The schedule of hot working process in different conditions.
Metals 11 00837 g002
Figure 3. Flow behavior of Y2O3/near-α-Ti alloy in the α + β and β phase region at different strain rate, (a) 950 °C, (b) 990 °C, (c) 1030 °C, (d) 1070 °C.
Metals 11 00837 g003
Figure 4. The relationship of peak stress vs. temperature and strain rate.
Metals 11 00837 g004
Figure 5. Variation of peak stress with strain rate and deformation temperature, (a) l n σ vs. l n ε ˙ , (b) σ vs.   l n ε ˙ , (c) l n s i n h σ α vs.   l n ε ˙ , (d) l n s i n h α σ vs. 1000/T.
Metals 11 00837 g005
Figure 6. The relationship of flow stress and different deformation conditions: (a) deformation temperature at strain of −0.5, (b) strain rate at strain of −0.5 and (c) strain.
Metals 11 00837 g006
Figure 7. The process map with various strain, (a) 0.2, (b) 0.4 and (c) 0.6, respectively. Contour numbers represent efficiency of power dissipation. Shaded region corresponds to flow instability.
Metals 11 00837 g007
Figure 8. Deformed microstructure of the Y2O3/Ti alloy at (α + β) region: (a) 950 °C/1 s−1, (b) 950 °C/0.1 s−1, (c) 950 °C/0.01 s−1, (d) 950 °C/0.001 s−1, (e) 990 °C/0.1 s−1, (f) 990 °C/0.001 s−1.
Metals 11 00837 g008
Figure 9. Deformed microstructure of the Y2O3/Ti alloy at β region: (a) 1030 °C/0.001 s−1, (b) 1030 °C/0.01 s−1, (c) 1070 °C/0.01 s−1, (d) 1070 °C/1 s−1.
Metals 11 00837 g009
Figure 10. Microstructure of the as-rolled Y2O3/Ti alloy sheet: (a) OM and (b) SEM.
Metals 11 00837 g010
Figure 11. Tensile properties of the as-rolled Y2O3/Ti alloy sheet at different temperature.
Metals 11 00837 g011
Table 1. Activation energies in high-temperature deformation of different titanium alloy.
MaterialsTβ (°C)Phase RegionQ (kJ/mol)References
α-Ti Self-diffusion150[36,37]
β-Ti153
IMI8341000α + β768[10]
β221
5 vol.% (TiBw + TiCp)/Ti-6Al-2.5Sn-4Zr-0.7Mo-0.3Si1106α + β608.3[38]
0.4 vol.% Y2O3/Ti-6Al-4Sn-7Zr-0.8Mo-1Nb-1W-0.25Si1010α + β657.8In present works
β405.9
Publisher’s Note: MDPI stays neutral with regard to jurisdictional claims in published maps and institutional affiliations.

