Abstract
This paper addresses the metallurgical and mechanical characterization of dissimilar joints made by laser autogenous welding between thin sheets of low-carbon steel (CS) and austenitic stainless steel (SS). The welding technology applied, previously optimized to produce sound dissimilar joints, is based on the heat source displacement from the weld gap centerline towards CS, in order to reduce the SS overheating. The research includes optical microscopy observations, energy dispersive X-ray analysis (EDX) to assess the wt% of Cr, Ni, and Fe in all regions of the dissimilar welded joint, hardness measurements, and tensile tests of transverse-welded flat specimens. In comparison with classical determination of the joint overall mechanical characteristics, the novelty of this research consists of experimental assessment of the local mechanical behavior of the fusion and heat affected zones by using a digital image correlation technique (VIC-2D). This is an efficient tool for determining the constitutive properties of the joint, useful for modelling the mechanical behavior of materials and for verifying the engineering predictions. The results show that the positive difference in yielding between the weld metal and the base materials protects the joint from being plastically deformed. As a consequence, the tensile loading of flat transverse specimens generates the strain localization and failure in CS, far away from the weld.
1. Introduction
Joining of dissimilar metals is generally more challenging than joining similar ones because of the differences in the physical, mechanical, and metallurgical properties of the base materials [1,2,3,4]. From such a point of view, welding of low-carbon steels to austenitic stainless grades is still considered a major issue, despite continuous development of welding technologies, especially those related to laser usage. The microstructure transformation in the solid-state phase, such as austenite to martensite or ferrite during cooling and the distinct thermal expansion coefficients of base metals, produces a significant residual stress field in the joint area. This, together with the expected formation of hard zones close to the weld interface adjacent to relatively softer ones, may lead to in-service cracking, with consequences such as leakage and even structural failure [5]. However, dissimilar welding of low-carbon steel (CS) and stainless steel (SS) is still highly demanded in many industries, including construction, the automotive sector, oil and gas, nuclear power plants, and shipbuilding [6,7,8,9,10,11,12,13,14,15]. This demand, together with the need to increase welding productivity, leads to dissimilar metals joining with special techniques like laser beam welding (LBW) and electron beam welding (EBM), which, in addition to the productivity advantages, allow joining with narrower heat-affected zones (HAZs), deep penetrations, and low distortions by controlling the beam focus and location with respect to the joint [16,17,18,19,20,21,22,23,24].
In recent decades, many researchers have studied dissimilar metal joining by LBW [25,26,27,28]. Published research sought to determine the effects of processing parameters (laser power and, among others, welding speed) on mechanical and metallurgical properties of the welded joint, thermal history, and welding-induced deformations. Pankaj et al. in [25] conducted experimental research for determining the influence of laser power and welding speed on mechanical properties, temperature distribution, and deformation in laser-welded joints made between thin sheets of mild-carbon steel and stainless steel. The results showed that a faster cooling rate is achieved in the mild-carbon steel side of the joint when compared with the stainless steel side due to distinct thermophysical properties. The inherent phase transformations that occurred during welding were also explained through hardness measurements of maximum values located in the fusion zone of the dissimilar weld. The research carried out by Wu et al. in [26] addressed the microstructure, mechanical properties, hardness distribution, and corrosion behavior of dissimilar welded joints made by LBW with ferritic stainless steel and carbon steel base metals. It was found that the increase of welding speed leads to the decrease in width of the weld bead and of the base metals’ HAZs. The tensile properties of the joint were similar to those of the carbon steel, and the increase in welding speed positively influences the joint elongation. Prabakaran et al. [27] addressed the dissimilar welding between austenitic stainless steel (AISI316) and low-carbon steel (AISI1018) by CO2 4 kW laser welding. The results showed that the mechanical properties of the joints improve by applying a post-weld heat treatment at 960 °C for 2 h, followed by air cooling at room temperature. Cao et al. [28] conducted research into fiber laser welding (FLW) of dissimilar austenitic stainless steel and carbon steels for shipbuilding applications, in order to determine the effects of welding speed on microstructure and mechanical proprieties of the welded joint. It showed that welding speed, together with the heat input and cooling rate, substantially influence the microstructure of the welded joint and play an important role in determining the productivity of the process. Another important conclusion of [28] examines the mechanical properties of the weld, which exceeds those of the carbon steel employed as a base metal in the absence of welding-induced defects.
The present paper addresses the metallurgical and mechanical characterization of dissimilar joints made by laser autogenous welding between thin sheets of low-carbon steel (CS) and austenitic stainless steel (SS). The applied welding technology, previously optimized to produce sound joints [10], is based on the heat source displacement from the weld gap centerline towards CS in order to reduce SS overheating. The research includes optical microscopy observations, hardness measurements, energy dispersive X-ray analysis (EDX) to assess the wt% of Cr, Ni, and Fe in all regions of the dissimilar welded joint, and tensile tests of transverse-welded flat specimens. In comparison with classical determination of the joint overall mechanical characteristics, the novelty of this research consists of experimental assessment of the local mechanical behavior of the fusion and heat-affected zones by using a digital image correlation technique (VIC-2D). This is an efficient tool for determining the constitutive properties of the joint, useful for modeling the mechanical behavior of materials and for verifying the engineering predictions.
2. Materials and Methods
The dissimilar joints analyzed in this study were made by laser autogenous welding (LW) between thin low-carbon steel (AISI 1010) and austenitic stainless steel (AISI 304L) plates of 200 × 300 mm, 3 mm thick, with the nominal chemical composition (in weight percent) given in Table 1. Figure 1a illustrates the plate welding in a continuous wave, keyhole mode with the laser equipment (Nd: YAG DY033–3300 W) of Laser Centre, Polytechnic University of Madrid. The process was performed with the parameters given in Table 2, in a single pass, by shifting the laser beam 0.25 mm from the center line of the weld gap towards CS. The shielding gas was helium, with a constant flow rate of 10 l/min. Prior to welding, the plates, cleaned and ground down along the weld line, were fixed into the clamping device shown in Figure 1b. One of the laser-welded dissimilar-joint panels is illustrated in Figure 1c.

Table 1.
Base metals chemical composition (wt%).
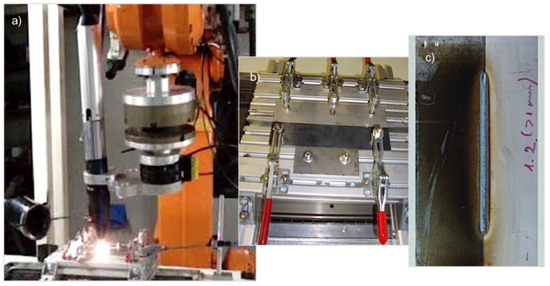
Figure 1.
System setup. (a) General view acquired during autogenous laser welding; (b) clamping device used for the plates fixing; (c) dissimilar but welded joint.
Table 2.
Autogenous laser welding parameters.
As illustrated in the sketch given in Figure 2a, transverse-welded flat tensile specimens, with a gauge length of 60 mm and a gauge width of 12.5 mm, were machined according to ASTM E8 [29] from the LW panels and, for comparison purposes, from the CS and SS plates (Figure 2b).
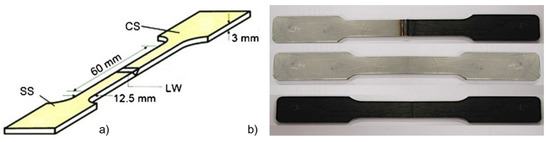
Figure 2.
Tensile testing specimen. (a) Sketch of the transverse-welded flat tensile specimen; (b) image of tensile specimens (from top to bottom: containing the dissimilar joint, from SS, and CS).
The specimens prepared were tensile tested at room temperature on 200 kN servo-hydraulic testing equipment at a constant crosshead speed of 1 mm/min. In addition to the conventional, resistive clip-on extensometer, VIC-2D was used to assess the strain and displacement fields during the tensile loading of specimens. VIC-2D is a displacement and strain measurement technique able to analyze the digital image sequence acquired during testing at every 0.5 s. VIC-2D practically tracks a speckle pattern movement, previously applied on the specimen surface, through an iterative spatial cross-correlation algorithm. Its error is typically less than 1%. Thus, average strains obtained during tensile testing on gauge lengths capturing distinct weld regions could be correlated with the applied, overall stresses, assuming that the transversely loaded specimens were in iso-stress configuration.
The optical and differential interference contrast microscopy (DIC), as well as scanning electron microscopy (SEM) observations were made on samples containing the dissimilar joint cross-section, prepared by grinding and polishing as per ASTM E3 and selective etched under ASTM E407. Aqua regia (HCl and HNO3 in a mixing ratio of 1:3) or Beraha II were used as etchants in the SS side of the joint and the weld, and Nital 2% in the CS side [30,31].
The energy dispersive X-ray analysis (EDX) was used for the assessment of chemical elements, such as Cr, Ni, and Fe, that determine the weld microstructure.
Microhardness determinations were used as an alternative and efficient means of assessing the changes in mechanical properties of the dissimilar joint. In this view, Vickers HV0.5 hardness measurements were made according to EN ISO 6507, the distance between two consecutive indentations being set to 0.2 mm [32].
3. Results and Discussions
3.1. Dissimilar Welded Joint Microstructure
As revealed in Figure 3a, the macroscopic appearance of the analyzed dissimilar joint is typical for a keyhole mode welding, with the only peculiarity visible at this scale being related to the HAZ on the CS side, much larger than that formed on the SS side. This is due to the higher thermal conductivity of CS when compared with that of SS, and to the laser beam shifting toward the CS side by 0.25 mm during welding.
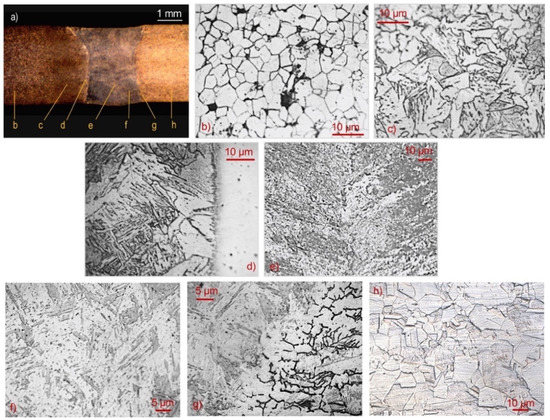
Figure 3.
Typical features of the analyzed CS–SS welded joint: (a) macrostructure containing indications regarding the positions of the acquired microstructural details; (b) as-received CS; (c) refined grain region of HAZ on CS side; (d) fusion line and coarse grains of HAZ on CS side; (e) weld center; (f) martensitic structure of the weld; (g) fusion line and HAZ on SS side; (h) as-received SS.
Figure 3b illustrates the typical ferrite pearlite microstructure of CS. The HAZ formed in the CS side of the joint is a gradual transition from the grain refined region (Figure 3c) to the coarse grain microstructure region of Widmanstätten ferrite, bainite, and acicular ferrite (Figure 3d) resulted from the partial solid-state transformation of ferrite. This ends at the weld bead solidification front, clearly delimited by the decarburized narrow band shown in Figure 3d. Then, as revealed by the SEM image (Figure 4a) on the CS side, the solidification structure of the weld is fully martensitic, Widmanstätten austenite platelets nucleate and grow from the fusion line limits. Figure 3e illustrates the central region of the weld in which the V-shape joint of the two lateral solidification fronts took place. It comprises columnar grains, consisting of acicular martensite and, together with its interlaced arrays, form the basket-weave structure of martensite shown Figure 3f and the SEM detail from Figure 4b. Its formation by rapid cooling is caused by the high speed of laser welding and the small thickness of the plates. According to [5], this martensitic microstructure might reduce the overall weld-induced distortions in large, but thin welded panels. The SEM image, given in Figure 4c, reveals the martensitic structure solidified from the fusion line boundaries of SS, less visible in the optical micrograph illustrated in Figure 3g. Through this, its etching allowed the detection of vermicular ferrite dendrites and lacy ferrite into the coarse grains of austenite from the SS side HAZ. Lastly, Figure 3h illustrates the typical SS microstructure which consists of equiaxed grains with disperse annealing twins.
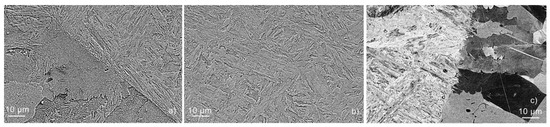
Figure 4.
SEM images illustrating the: (a) CS side HAZ, the fusion line and the adjacent martensitic structure of the weld; (b) weld central region; (c) martensite weld structure, fusion line and the HAZ on the SS side.
In view of these results, it can be concluded that the joint overall microstructure is strongly heterogenous, mainly due to the laser welding characteristics, i.e., fast welding speed and low heat input, which propitiate distinct dilution degrees of CS and SS participant metals, elsewhere discussed [10,11].
The EDX maps, the central line analysis, and the SEM image of the welded joint are shown in Figure 5. The overall mapping of Kα peaks of Cr, Ni, and Fe, given in Figure 5a, illustrates a homogeneous distribution into the weld. This is better revealed in the corresponding single-element maps presented in Figure 5c–e. The results of the line scan quantitative analysis of Cr K, Ni K, and Fe K, given in Figure 5f, show each element variation in wt%, along the joint central line plotted in Figure 5a. Accordingly, Cr and Ni decrease in both HAZs, and Fe increases from SS to CS, but the quasi-stable wt% corresponds to the weld region (Figure 5f). In the fusion zone, the wt% averages of Cr K, Ni K, and Fe K were respectively 12.0, 3.6, and 77.5, and substantially differ from the corresponding wt% detected into the 304L SS, of 18.1, 9.2, and 72.2. These data confirm the fully martensitic stainless-steel structure of the weld. As a consequence, it can be anticipated that, if loaded in tension, the weld will remain in an elastic regime during the base metals yielding, and the weakest, in this case CS, will determine the breaking load of the joint.
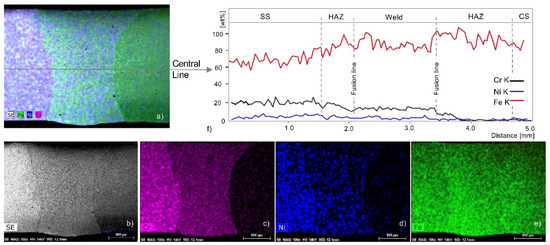
Figure 5.
EDX mapping and line analysis of the CS–SS laser-welded joint: (a) overall mapping of Cr, Ni, and Fe; (b) SEM image; (c) Cr map; (d) Ni map; (e) Fe map; (f) central line scan analysis of Cr, Ni, and Fe.
3.2. Hardness Analysis
The two analyzed hardness field profiles of the dissimilar CS–SS joint are presented in Figure 6. These were determined along the horizontal line L1 located at 1.5 mm from the top of the plates. The hardness average of 500 HV0.5 in the weld zone (Figure 6b) is 2.4 and 2 times higher than that of CS and SS base metals because of formation by rapid cooling of the considerable harder martensitic stainless steel (Figure 4b). In the HAZ from the CS side of the joint, the hardness gradually decreases from the fusion line (230 HV0.5) up to the refined grain region (200 HV0.5). On the other side of the weld zone, namely in the HAZ from the SS side of the joint, the microhardness decreases from 460 HV0.5 in the fusion line up 240 HV0.5 into the unaffected SS.
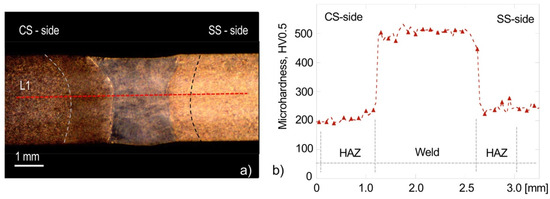
Figure 6.
Hardness analysis. (a) Location of the microhardness imprint line L1 on the joint section; (b) microhardness profile along the analyzed line.
According to the results presented in Figure 6b, distinct mechanical behavior of each of the joint regions are expected in tension.
3.3. Local and Overall Mechanical Performance of Dissimilar Welded Joints
Figure 7a illustrates the first image of the sequence acquired every 0.5 s during the tensile test of the flat transverse-welded specimen. This was used as a benchmark in the VIC-2D postprocessing analysis, which entailed the following stages: the first, the configuration of the area of interest (in light violet) for determining the strain field; and the second, the set-up of the gauge lengths for six virtual extensometers (E1–E6) capturing distinct joint areas. For each one of the extensometers, the strains were obtained by averaging the displacement field on the corresponding virtual gauge lengths, while the stresses were conventionally computed from the load data registered by the acquisition system of the servo-hydraulic testing equipment, by assuming that the transversely loaded specimens were in iso-stress configuration.
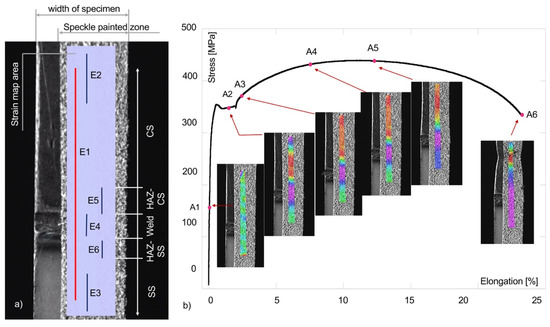
Figure 7.
Overall stress–percentage elongation curve of the LW joint. (a) Flat specimen detail on which are indicated the speckle-painted zone and the generic positions of the six virtual extensometers (E1–E6) with respect to the LW-joint zones, and the strain field analysis area; (b) overall stress vs. percentage elongation of the LW joint; the images are the strain maps corresponding to the points A1–A6.
Figure 7b presents the overall stress–percentage elongation curve of the analyzed LW joint; the elongation data correspond to the virtual extensometer E1, of 6.5 mm gage length, which captured the joint as a whole. In addition, Figure 7b contains some of the strain maps as a result of postprocessing the image sequence data in the area of interest (Figure 7a). These are related to A1–A5 points and show the strain distribution maps at distinct specimen elongations: during yielding (A1), within the yielding plateau (A2), during the plastic flow (A3 and A4), and at maximum load (A5). The strain map corresponding to A6 shows that the maximum strains are located in CS, while the other joint areas are almost free of deformation. This explains the failure of the specimen in CS, occurring far away from the weld at an overall elongation of 23.3%.
Figure 8 shows the plots of the strain–stress curves obtained by tensile testing of a full-CS flat specimen with the aid of a conventional clip-on extensometer (1) and from the virtual extensometer E2 (2) mounted on the CS region of the flat, transverse-welded specimen. Figure 8 also contains, as a benchmark, the overall strain–stress curve of the LW joint (3), previously presented in Figure 7b. From the comparison of the curves (1) and (2), the results show that that VIC-2D provide accurate information from the plastic instabilities region of CS, with the virtual extensometer being able to capture the strain field until the specimen failure. The overall strain–stress curve (3) provides only limited information regarding the local properties of the joint, because its corresponding gauge length captures the joint as a whole. The presence of a small yielding plateau in the (3) curve is due to CS participation at joint formation. In addition, the specimen failure in the CS region indicates, as tensile strength for the dissimilar joint, the CS tensile strength.
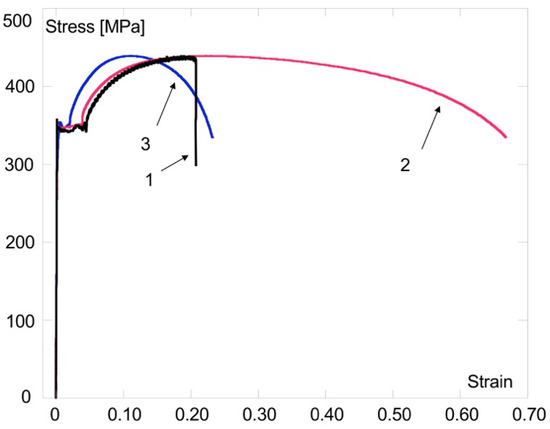
Figure 8.
Engineering stress–strain curves of: 1, full CS flat specimen (clip-on extensometer data); 2, CS region of the LW joint (E2 virtual extensometer data); 3, CS-SS joint (E1 virtual extensometer data).
Figure 9 illustrates the strain–stress curves obtained by tensile testing of a full-SS flat specimen through a conventional clip-on extensometer (1) and from the virtual extensometer E3 (2) mounted on the SS region of the flat specimen containing the dissimilar LW joint. For comparison reasons, Figure 9 also contains the overall strain–stress curve of the LW joint (3), provided in Figure 7b. According to the curve (2), at joint failure, the SS region experiences some degree of deformation that is considerably smaller than the deformation at maximum load determined and registered with a conventional extensometer by testing a full-SS flat specimen. In this case, VIC-2D could not provide information beyond the dissimilar joint failure in the CS region.
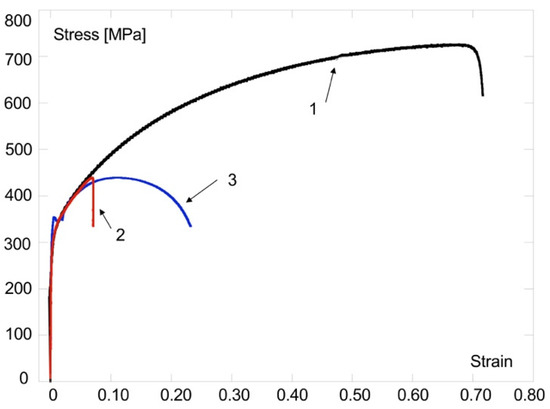
Figure 9.
Engineering stress–strain curves of: 1, full SS flat specimen (clip-on extensometer data); 2, SS region of the LW joint (E3 virtual extensometer data); 3, CS–SS joint (E1 virtual extensometer data).
The local strain–stress curves acquired with the virtual extensometers E4–E6 from the weld zone (2), the HAZ from the SS side (3), and the HAZ from the CS side (4) of the joint are presented in Figure 10, together with the overall one of the dissimilar LW joint (1). The complex, heterogeneous microstructure of the joint explains the distinct tensile behavior of these regions. Thus, the maximum strain of 0.005 registered in the weld at specimen failure was attributed to the drastic decrease in the plastic flow capacity of this zone, propitiated by the Widmanstätten ferrite formation as a consequence of high laser-welding speed, and of plate thickness. The strain–stress curve (2) of the weld zone indicates a positive difference in yield, which gradually decreases into both HAZs, relatively to the correspondent yield of SS and CS base metals. Figure 10 shows that the higher strain values characterize the HAZ on the CS side (0.06) when comparing it with that found in the HAZ from the SS side (0.045) at joint failure (0.24). Thus, based on VIC-2D information, it may be concluded that the positive difference in yield between the weld metal and the base materials protects the joint from being plastically deformed.
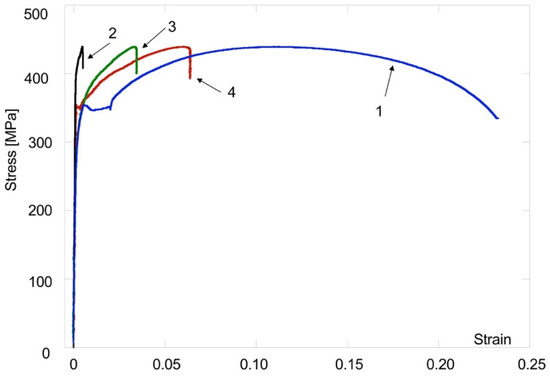
Figure 10.
Engineering stress–strain curves of: 1, dissimilar joint (E1 virtual extensometer data); 2, weld zone (E4 virtual extensometer data); 3, HAZ on SS side of the joint (E6 virtual extensometer data); 4, HAZ on CS side of the joint (E5 virtual extensometer data).
The local and overall mechanical properties of the dissimilar laser-welded joint, as well as the strength overmatch coefficient M (M = Rp0.2-weld zones/Rp0.2-CS), are given in Table 3. It shows that the weld zone, the HAZ on the CS side, and the HAZ on the SS side of the joint overmatches the yield strength of CS for, respectively, >24%, 12%, and 19%. These data agree with the hardness field profile shown in Figure 6b and the detected microstructure heterogeneities of the joint.
Table 3.
Local and overall mechanical performance of the analyzed dissimilar laser-welded joint.
4. Conclusions
The CS–SS welded joint produced by shifting the laser beam towards the CS side showed a complex microstructure that induced distinct mechanical performance in the weld regions. The VIC technique was proved as being efficient for assessing the constitutive properties of the joint, which is useful for mechanical modeling, and for verifying the engineering predictions. Based on the analysis of the research results, several significant conclusions have been drawn, as follows:
- The assessed local tensile behavior in the weld zone, the HAZ on the CS side, and the HAZ on the SS side of the joint overmatches the yield strength of CS for, respectively, >24%, 12%, and 19%. These data agree with the hardness profile and the detected microstructure heterogeneities of the joint.
- The EDX analysis, employed to assess the wt% of Cr, Ni, and Fe in all regions of the dissimilar welded joint, explicitly demonstrates the fully martensitic stainless steel structure of the weld. As a consequence, it could be anticipated and then demonstrated by tensile testing of welded specimens that the weld remains in an elastic regime during the base metals yielding, and the weakest, in this case CS, determine the breaking load of the joint.
- The detected positive difference in yield between the generated martensitic stainless steel into the weld and the base materials protects the joint from being plastically deformed. As a consequence, the tensile loading of flat transverse specimens produces the strain localization and failure in CS, far away from the weld, which is favorable for dissimilar welded structures subjected to transverse tensile loads.
Author Contributions
Conceptualization, E.S.; methodology, E.S. and C.C.R.; software, M.I.; validation, M.I.; formal analysis, D.M.; investigation, E.S., M.I., J.L.O. and D.M.; resources, M.I. and J.L.O.; writing—original draft preparation, C.C.R.; writing—review and editing, C.C.R. All authors have read and agreed to the published version of the manuscript.
Funding
This research received no external funding.
Institutional Review Board Statement
Not applicable.
Informed Consent Statement
Not applicable.
Data Availability Statement
Not applicable.
Acknowledgments
The authors gratefully acknowledge the support received from “Dunarea de Jos” University of Galati, Romania and from Ministry of Science and Innovation in Spain (RTI2018-097221-B-I00).
Conflicts of Interest
The authors declare no conflict of interest.
References
- Xin, D.; Cai, Y.; Hua, X. Pivotal microstructural characteristics to determine the cryogenic impact toughness of dissimilar joint between SA645 and AISI304L made by autogenous fiber laser welding. Mater. Charact. 2020, 165, 110399. [Google Scholar] [CrossRef]
- Jiang, Z.; Chen, X.; Yu, K.; Lei, Z.; Chen, Y.; Wu, S.; Li, Z. Improving fusion zone microstructure inhomogeneity in dissimilar-metal welding by laser welding with oscillation. Mater. Lett. 2020, 260, 126995. [Google Scholar] [CrossRef]
- Narsimhachary, D.; Dutta, K.; Shariff, S.M.; Padmanabham, G.; Basu, A. Mechanical and microstructural characterization of laser weld-brazed AA6082-galvanized steel joint. J. Mater. Process Technol. 2019, 263, 21–32. [Google Scholar] [CrossRef]
- Iordachescu, M.; Ruiz-Hervias, J.; Luzin, V.; Scutelnicu, E.; Valiente, A.; Ocaña, J.L. Residual Stress Distributions in Ferritic to Austenitic Steel Joints Made by LASER Welding. Ann. Dunarea Jos Univ. Galati. Fascicle XII Weld. Equip. Technol. 2013, 24, 45–49. [Google Scholar]
- Reynolds, A.P.; Tang, W.; Gnaupel-Herold, T.; Prask, H. Structure, properties and residual stress of 304L stainless steel friction stir Weld. Scr. Mater. 2003, 48, 1289–1294. [Google Scholar] [CrossRef]
- De, A.; DebRoy, T. A perspective on residual stresses in welding. Sci. Technol. Weld. Join. 2011, 16, 204–208. [Google Scholar] [CrossRef]
- Arivazhagan, N.; Singh, S.; Prakash, S.; Reddy, G.M. Investigation on AISI 304 austenitic stainless steel to AISI 4140 low alloy steel dissimilar joints by gas tungsten arc, electron beam and friction welding. Mater. Des. 2011, 32, 3036–3050. [Google Scholar] [CrossRef]
- Wang, H.; Wagner, S.; Sekol, R.; Chen, N.; Perry, T.; Schroth, J. Resistive joining—a novel dissimilar welding method for thin sheet metals. Procedia Manuf. 2020, 48, 141–146. [Google Scholar] [CrossRef]
- Huang, W.; Wang, H.; Rinker, T.; Tan, W. Investigation of metal mixing in laser keyhole welding of dissimilar metals. Mater. Des. 2020, 195, 109056. [Google Scholar] [CrossRef]
- Iordachescu, M.; Iordachescu, D.; Scutelnicu, E.; Ruiz-Hervias, J.; Valiente, A.; Caballero, L. Influence of heating source position and dilution rate in achieving overmatched dissimilar welded joints. Sci. Technol. Weld. Join. 2010, 15, 378–385. [Google Scholar] [CrossRef]
- Iordachescu, M.; Valiente, A.; Caballero, L.; Iordachescu, D.; Torres, E.; Cuesta, A. Structural Heterogeneities vs. Overall Mechanical Performance of Dissimilar Laser Hybrid Welded Joints. Metal. Int. 2011, 16, 141–144. [Google Scholar]
- Madhankumar, S.; Ashwin, S.; Ajai Robert, J.; Clifford Francis, J.; Bavan Kalyan, R.; Krithik Raj, A.; Joel Anton, W. Experimental investigation on ultimate tensile strength of laser butt welded inconel 718 alloy and 2205 duplex stainless steel. Mater. Today Proc. 2021, 106117. [Google Scholar] [CrossRef]
- Du, C.C.; Wang, X.; Hu, L. Microstructure, mechanical properties and residual stress of a 2205DSS/Q235 rapidly formed LBW joint. J. Mater. Process Technol. 2018, 256, 78–86. [Google Scholar] [CrossRef]
- Wu, S.; Shi, Y.; Liao, H.; Wang, X. Microstructure and mechanical properties of LBW and EBW weld joints of CLF-1 steel: A comparative analysis. J. Nucl. Mat. 2021, 549, 152914. [Google Scholar] [CrossRef]
- Parkes, D.; Xu, W.; Westerbaan, D.; Nayak, S.S.; Zhou, Y.; Goodwin, F.; Bhole, S.; Chen, D.L. Microstructure and fatigue properties of fiber laser welded dissimilar joints between high strength low alloy and dual-phase steels. Mater. Des. 2013, 51, 665–675. [Google Scholar] [CrossRef]
- Woo, W.; Feng, Z.; Wang, X.-L.; David, S.A. Neutron diffraction measurements of residual stresses in friction stir welding: A review. Sci. Technol. Weld. Join. 2011, 16, 23–32. [Google Scholar] [CrossRef]
- Altenkirch, J.; Steuwer, A.; Withers, P.J.; Wiliams, S.W.; Poad, M.; Wen, S.W. Residual stress engineering in friction stir welds by roller tensioning. Sci. Technol. Weld. Join. 2009, 14, 185–192. [Google Scholar] [CrossRef]
- Richards, J.G.; Pragnell, P.B.; Withers, P.I.; Wiliams, S.W.; Nagy, T.; Morgan, S. Efficacy of active cooling for controlling residual stresses in friction stir welds. Sci. Technol. Weld. Join. 2010, 15, 156–165. [Google Scholar] [CrossRef]
- Bhadeshia, H.K.D.H. Developments in Martensitic and Bainitic Steels: Role of the Shape Deformation. Mater. Sci. Eng. A 2004, A378, 34–49. [Google Scholar] [CrossRef]
- Berretta, J.R.; Rossi, W.; Neves, M.D.M.; Almeida, I.A.; Vieira Junior, N.D. Pulsed Nd: YAG laser welding of AISI 304 to AISI 420 stainless steels. Opt. Lasers Eng. 2007, 45, 960–966. [Google Scholar] [CrossRef]
- Fuerschbach, P.W.; Eisler, G.R. Effect of laser spot weld energy and duration on melting and absorption. Sci. Technol. Weld. Join. 2002, 7, 241–246. [Google Scholar] [CrossRef]
- Withers, P.J. Mapping residual and internal stress in materials by neutron diffraction. Comptes Rendus Phys. 2007, 8, 806–820. [Google Scholar] [CrossRef]
- Shirzadi, A.A.; Bhadeshia, H.K.D.H.; Karlson, L.; Withers, P.J. Stainless steel weld metal designed to mitigate residual stresses. Sci. Technol. Weld. Join. 2009, 14, 559–565. [Google Scholar] [CrossRef]
- Cao, F.; Zhang, Y.; Shen, Y.; Jin, Y.; Li, J.; Hou, W. Effects of beam offset on the macro defects, microstructure and mechanical behaviors in dissimilar laser beam welds of SDSS2507 and Q235. J. Manuf. Process 2020, 55, 335–347. [Google Scholar] [CrossRef]
- Pankaj, P.; Tiwari, A.; Bhadra, R.; Biswas, P. Experimental investigation on CO2 laser butt welding of AISI 304 stainless steel and mild steel thin sheets. Opt. Laser Technol. 2019, 119, 105633. [Google Scholar] [CrossRef]
- Wu, W.; Hu, S.; Shen, J. Microstructure, mechanical properties and corrosion behavior of laser welded dissimilar joints between ferritic stainless steel and carbon steel. Mater. Des. 2015, 65, 855–861. [Google Scholar] [CrossRef]
- Prabakaran, M.P.; Kannan, G.R. Effects of post-weld heat treatment on dissimilar laser welded joints of austenitic stainless steel to low carbon steel. Intl. J. Pres. Ves. Pip. 2021, 191, 104322. [Google Scholar] [CrossRef]
- Cao, L.; Xinyu, S.; Ping, J.; Qi, Z.; Youmin, R.; Shaoning, G.; Gaoyang, M. Effects of Welding Speed on Microstructure and Mechanical Property of Fiber Laser Welded Dissimilar Butt Joints between AISI316L and EH36. Metals 2017, 7, 270. [Google Scholar] [CrossRef]
- ASTM International. ASTM E8/E8M-21. Standard Test Methods for Tension Testing of Metallic Materials; ASTM International: West Conshohocken, PA, USA, 2021. [Google Scholar]
- ASTM International. ASTM E3-11(2017). Standard Guide for Preparation of Metallographic Specimens; ASTM International: West Conshohocken, PA, USA, 2017. [Google Scholar]
- ASTM International. ASTM E407-07(2015)e1. Standard Practice for Microetching Metals and Alloys; ASTM International: West Conshohocken, PA, USA, 2015. [Google Scholar]
- ISO. ISO 6507-1:2018. Metallic Materials—Vickers Hardness Test—Part 1: Test Method; ISO: Geneva, Switzerland, 2018. [Google Scholar]
Publisher’s Note: MDPI stays neutral with regard to jurisdictional claims in published maps and institutional affiliations. |
© 2021 by the authors. Licensee MDPI, Basel, Switzerland. This article is an open access article distributed under the terms and conditions of the Creative Commons Attribution (CC BY) license (https://creativecommons.org/licenses/by/4.0/).