Abstract
Ultrasonic metal welding is an energy-efficient, fast and clean joining technology without the need of additional filler materials. Single spot ultrasonic metal welding of aluminum to steel sheets using automotive materials has already been investigated. Up to now, further studies to close the gap to application-relevant multi-metal structures with multiple weld spots generated are still missed. In this work, two different spot arrangements are presented, each consisting of two weld spots, joined 0.9 mm thick sheets of wrought aluminum alloy AA6005A-T4 with 1 mm sheets of galvannealed (galvanized and annealed) dual-phase steel HCT980X. An anvil equipped with variable additional clamping punches was used for the first time. The tensile shear forces reached 4076 ± 277 N for parallel connection and 3888 ± 308 N for series connection. Temperature measurements by thermocouples at the interface and through thermal imaging presented peak temperatures above 400 °C at the multi-metal interface. Microscopic investigations of fractured surfaces identified the Zn layer of the steel sheets as the strength-limiting factor. Energy-dispersive X-ray spectroscopy (EDX) indicated intermetallic phases of Fe and Zn in the border areas of the weld spots as well as the separation of the zinc layer from the steel within these areas.
1. Introduction
Ultrasonic welding is an established joining method in the industry. Ultrasonic plastic welding is used for fast and clean assembly of claddings and shells, whereas ultrasonic metal welding enables the joining of cable harnesses and is used in battery applications. An increasing need for electrical control of components alongside the growing demand for batteries in the automotive sector are good growth prospects for the solid state technique. The advantages of ultrasonic metal welding include energy efficiency, short cycle times as well as low and local heat exposure without the need for welding consumables [1]. The ability to join materials with very different melting temperatures, since the process takes place in the solid state, is another essential feature [2]. Due to the desired reduction in the weight of vehicle bodies in mass production, there is a trend towards a combination of steel, aluminum and other lightweight materials for the body in white [3].
Adhesive bonding is a standard joining technique in car body construction, especially for dissimilar materials. It seals the contact areas and insulates the materials to prevent electrochemical corrosion. Normally, adhesive bonding is used in combination with other joining techniques as hybrid joints. Since conventional resistance spot welding (RSW) cannot simply join aluminum and steel, processes have been developed that usually work with additional components. In resistance element welding, an easily meltable steel rivet is stamped into the aluminum sheet as an auxiliary joining element during the pressing process. The rivet is subsequently joined to a steel sheet by resistance spot welding. Friction element welding uses a friction drilling element that pierces the soft aluminum and creates a rotary friction weld in contact with the steel plate [4]. Blind riveting requires a previous process step to create a hole and can be used when the joint is only available from one side. Self-piercing riveting (SPR) does not require a pre-drilled hole. The rivet pierces the punch-side sheet and penetrates the die-side sheet. In solid punch riveting, the rivet cuts both sheets and fills the resulting hole. The process is particularly suitable for joining high-strength materials with low ductility [5]. Screws can also be used for structural connections with single-sided accessibility. Flow drill screws (FDS) do not require prefabricated holes, since they cut the hole and thread themselves [6]. Friction stir spot welding (FSSW) takes place in solid state, a pin mixes the plasticized materials. When the tool is retracted, an undesirable keyhole is created by default [7]. The process time is usually longer than for ultrasonic metal welding.
Since the joining of aluminum and steel by ultrasonic metal welding requires no additional elements and no special pre-treatment, the process is interesting for industrial applications due to potential time and cost savings. The production of primary structures of a car body requires the ability to join several adjacent spots one after the other. In ultrasonic welding, oscillations generate the joints, but can also loosen them again. Therefore, the investigation of multi-spot welds is necessary to support the transition from laboratory to component level.
Published studies on ultrasonic welding of aluminum and steel sheets mainly use automotive related materials, but usually, only a single spot connects the sheets. One focus of the investigations is the occurrence of intermetallic phases or compounds (IMC) at the weld spot, which can weaken the strength of the joint due to their brittleness [8]. Munoz-Guijosa et al. [9] welded cold-rolled high tensile strength steel to AA6061-T4 using a perpendicular ultrasonic joining method. Investigations by scanning electron microscopy and auger electron spectroscopy could not detect any intermetallic layer. Watanabe et al. [10] revealed that the occurrence of the intermetallic phase Fe2Al5 was dependent on the welding time when welding AA5052-H24 with SS400 mild steel. Xu et al. [11] welded AA6111 as well as AA7055 to low-carbon steel DC04 and found that Fe2Al5 was the first IMC phase to constitute. FeAl3 followed as the second phase at longer welding times. Mirza et al. [12] created joints of AA6061-T6 and AISI 304 as well as ASTM A36 and discovered FeAl3 as the main intermetallic phase in both joints. Additional phases Fe2Al5 for AA6061-T6/AISI 304 joints and Fe3Al for AA6061-T6/ASTM A36 joints were identified. Furthermore, increasing welding energy or time resulted in a growing IMC layer.
Macwan et al. [13] joined AA6111-T4 to hot-dip galvanized high-strength low-alloy (HSLA) steel and detected the formation of an Al-Zn eutectoid/eutectic interface layer due to accelerated diffusion. High welding energy resulted in a very thin intermetallic layer of FeAl3. Patel et al. [14] joined AA5754-O to cold-rolled hot-dip galvanized HSLA steel. They confirmed eutectic Al-Zn film at the weld interface and the intermetallic phases Fe2Al5 as well as FeAl3 by X-ray diffraction (XRD). At the same time, they could not detect intermetallic phases of Fe-Zn. Mirza et al. [8] had nearly the same results when welding AA6061-T6 and galvanized HSLA steel. The only difference was that they could not detect the phase Fe2Al5.
Haddadi et al. [15] investigated ultrasonic spot welding of AA6111-T4 to hot dipped zinc coated DX56-Z steel and galvannealed (galvanized and annealed) DX53-ZF steel. For both steel sheets, melting of the zinc layer was observed during welding, whereby the galvannealed layer only melts at higher temperatures due to the intermetallic phases. The galvannealed zinc coating was composed of a thin layer with Fe3Zn10 (Γ) as well as Fe5Zn21 (Γ1) at the steel-zinc interface and overlying layers with FeZn10 (δ) and FeZn13 (ζ). Haddadi and Abu-Farha [16], as well as Haddadi [17], reported further investigations of these joints. The brittleness of the lower intermetallic layers Fe5Zn21 and Fe3Zn10 appears to determine the strength of the joint.
No results on multi-spot aluminum to steel joints have been published so far to the authors’ knowledge. In this work, joints are studied with two weld spots created one after the other. The focus is on the arrangement of the weld spots and their effect on the process properties. For the first time, additional clamping punches are used in ultrasonic welding of aluminum to steel sheets and their influence on the joining process is investigated. The joints are optimized for the highest possible and at the same time reliable tensile shear forces. The welding energy, the oscillation amplitude and the welding force are determined by a specific design of experiments. The combination of soft aluminum and hard steel as well as the corrosion-protective zinc layer of the steel sheet limit the performance potential of the process.
2. Materials and Methods
The materials used in this investigation originate from the production of Toyota car bodies. Table 1 displays maximum values or ranges of alloying elements in mass percentage provided by manufacturers, and Table 2 shows the tensile test results. Constellium (Neuf-Brisach, France) delivered the aluminum wrought alloy AA6005A in form of 0.9 mm thick sheets in condition T4 (solution annealed and cold aged), with Vickers Hardness rating of 80 HV1. This alloy is typically used for outer sheets, doors, hoods as well as inner sheets due to its surface quality. Voestalpine (Linz, Austria) contributed 1 mm thick sheets of dual-phase HCT980X steel. The ferritic matrix of this steel contains martensitic islands at grain boundaries while a galvannealed coating protects the surfaces against corrosion. This galvannealed coating is applied using a standard galvanizing process followed by annealing, allowing inter-diffusion between iron and zinc, as described by Wienströer et al. [18]. A multi-layer coating with intermetallic Fe-Zn phases is created through this process, and a Vickers hardness of 304 HV10 is achieved. The thickness of the Zn coating is approx. 10 µm and has also been verified by electron microscopy in the delivery condition. HCT980X is used for reinforcement or support in crash relevant parts that are susceptible to corrosion, e.g., A-/B- or C-pillar reinforcements.

Table 1.
Chemical composition of the chosen aluminum and steel sheets in mass % (provided by Constellium and Voestalpine).
Table 2.
The results of tensile tests according to the DIN EN ISO 6892-1 Process A and tensile specimen H 20 × 80 in the rolling direction according to the DIN 50125: yield strength (σy), ultimate tensile strength (UTS), Young’s modulus (E) and elongation at fracture (A80mm).
The spot welding system consists of a commercially available Branson (Emerson Electric, St. Louis, MO, USA) Ultraweld L20 with a maximum output of 4000 W, equipped with a custom-made anvil, as shown in Figure 1a. Figure 1c shows the schematic layout of the ultrasonic metal welding machine with components oscillating at 20 kHz in the direction of their symmetry axis. An exchangeable tip with two coupling surfaces, carrier sonotrode and nut make up the multi-part sonotrode of the system. The square coupling surface of the tip, measuring 8.86 × 8.86 mm2, is shaped with a wave profile as shown in Figure 1a,b. The alignment of the wave profile is perpendicular to the oscillation direction to ensure better transmission of the ultrasonic oscillation and reduce relative movement between the sonotrode and the sheet on the tool side. The welding force FUS is generated pneumatically up to 3500 N and presses the sonotrode onto the sheets placed on the anvil during welding. The anvil offers the possibility to move the specimen support along the x and y-axes and provides an additional clamping force up to 3000 N using various clamping punches. An integrated force measurement system monitors the welding force FUS and the additional clamping force FCL. To avoid any movement between the joining partner on the anvil side and the anvil itself, a pyramidal profile (Figure 1a) covers the entire contact surface of the anvil.
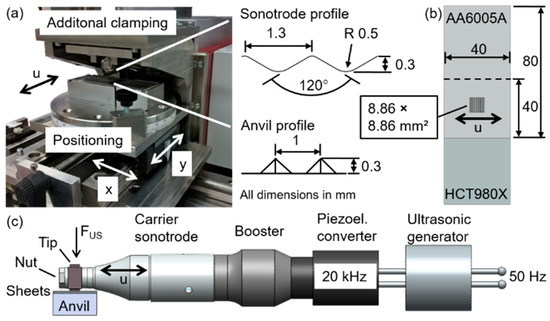
Figure 1.
(a) Branson Ultraweld L20 with anvil; (b) geometry of overlapping specimens; and (c) schematic representation of main principle and setup, oscillation direction (u). All dimensions in mm.
AA6005A was used as the upper sheet for all experiments, since this leads to less wear at the coupling surface compared to when steel is used on the tool side. The short cantilever length of the multi-part sonotrode limited the sample width to 40 mm, so that welding of spots exactly in the middle of the sample was enabled. Both sheets were 80 mm long (in rolling direction), the overlap length was 40 mm (marked by a dotted line in Figure 1b), resulting in a square overlap area of 40 × 40 mm2. Complex pre-treatments of the materials were avoided to emulate the testing conditions as close as possible to the application. The sheets were only wiped with ethanol prior to welding to ensure removal of dirt or grease.
During specific welding tests, a Micro-Epsilon (Ortenburg, Germany) TIM infrared camera (32 frames per second) recorded the temperature profile at the edge of the interface between the sonotrode tip and the aluminum surface. As described by Patel et al. [14], tensile shear tests were performed at a constant speed of 1 mm/min in the air at room temperature using a ZwickRoell (Ulm, Germany) Z020 universal testing machine. The samples were prepared as described by Haddadi and Abu-Farha [19] and microscopically examined using the Zeiss (Oberkochen, Germany) Smartzoom 5 digital optical microscope and characterized in the Zeiss EVO 15 scanning electron microscope (SEM) equipped with energy-dispersive X-ray spectroscopy (EDX).
3. Results and Discussion
3.1. Process Development
Figure 2 shows two investigated spot arrangements, named with reference to electrical circuits: parallel connection (PC) and series connection (SC). The critical factor was the arrangement of the spots in relation to the specimen’s longitudinal axis, i.e., the direction of the force during tensile shear testing. Preliminary tests showed that an existing joint came loose without additional clamping, when a subsequent spot was welded. This was independent of the geometrical spot arrangement and the welding parameters used. At least one additional clamping punch was deemed necessary to protect previously welded joints in this process. In both cases, illustrated in Figure 2, Spot A is welded before B. For PC, a flat punch with a contact surface of 10 × 8 mm2 clamped both sheets in front of the tool in the direction of oscillation (Figure 2a). The punch was kept in place next to the sonotrode regardless of whether it covered a joint or not, which was the case when welding the first Spot A. For SC, punches with a pyramidal profiled contact surface of 9 × 36 mm2 clamped the sheets laterally to the tool with a center-to-center distance of 16 mm each (Figure 2b). While welding Spot A, only one punch was used in the overlap area, whereas during welding of Spot B, two punches were applied on both sides of the tool. In the latter case, one of the punches partially covered the Spot A, while the other lied on the aluminum sheet outside the overlap area.

Figure 2.
The spot arrangements and schematic illustrations of the sonotrode and the clamping punches being used to weld Spots A and B, in (a) parallel and (b) series configuration. All dimensions in mm.
In the energy-controlled approach shown in this investigation, the main welding parameters were the welding energy (WUS), the oscillation amplitude (u), the welding force (FUS) and the additional clamping force (FCL). Tensile shear force (FTS) represented the main quality criterion for the overlapping Al/steel joints, with the aim being quantitatively reliable reproduction of weld quality and strength. Due to the high hardness of the HCT980X, a sufficient combination of oscillation amplitude and welding force was required to flatten its surface roughness on the microscopic scale. This enabled large surface area of contact at the aluminum and steel interface, which is a key factor in ultrasonic metal welding. Since AA6005A was the joining partner on the tool side, the sonotrode had to transmit both the oscillations and the welding force via the aluminum to the interface. The sonotrode surface pattern sometimes caused deep imprints on the low-hardness aluminum sheets depending on the experimental parameters. These deep indentations often led to cracks in the Al sheet at the edges and were sometimes seen to grow into the adjacent material as well. These cracks were seen to fail prematurely during tensile testing, resulting in a significant increase in the scatter of the tensile shear strength across all samples.
The optimization of the weld parameters to obtain joints with a reliable strength was the main challenge of this work. Initial tests defined general parameter ranges for both spot arrangements and provided the basis for design of experiments (DoE). The software MODDE® Version 12.1 (Sartorious Stedim Data Analytics AB, Umeå, Sweden) was used to set up a quadratic model and a central composite circumscribed (ccc) design including star points to set up a test plan. The DoE was based around three parameters, namely, welding energy, oscillation amplitude and welding force. The test plan included 108 welds for each of the two spot arrangements, with a total of 336 welds for PC and 410 for SC. Table 3 shows the parameter sets for PC and SC with the highest tensile shear forces FTS and best reproducibility. The additional clamping forces FCL were determined in preliminary tests and the possibility of using different parameter sets for the Spots A and B. For PC, positions of Spot A and B are mirrored in reference to the longitudinal axis of the specimen. From a geometric point of view, the use of the same parameters was reasonable. The parameters were kept unaltered for first and subsequently welded spots. Although welding of Spot A of SC employed only one additional clamping punch, which was loaded with 800 N and placed with a center-to-center distance of 16 mm, welding of Spot B was also performed with the same parameters. In this case, the additional clamping force was split between the two punches, and the position of Spot B was not geometrically equivalent to Spot A. However, when Spot B was welded, the sheets were already joined at Spot A with a center-to-center distance of 20 mm. Tests revealed best results when choosing the same parameters for A and B for both spot arrangements.
Table 3.
Parameter sets for ultrasonic spot welding of PC and SC with the highest tensile shear forces FTS and best reproducibility: welding energy (WUS), oscillation amplitude (u), welding force (FUS), additional clamping force (FCL) and tensile shear force (FTS).
Based on the results of DoE, the MODDE® software calculated predictions for the tensile shear forces in the entire experimental space. Figure 3 shows the effect of the welding energy WUS and the oscillation amplitude u on the tensile shear force FTS. For the parameters shown in Figure 3, welding force FUS kept constant at 1485 N for PC and at 2700 N for SC. It can be seen that the parameters shown in Table 3 lie within the displayed maxima. This was further confirmed by validation experiments performed at different FUS values. The average tensile shear forces of 4076 ± 277 N for PC and 3888 ± 308 N for SC confirmed these models.

Figure 3.
Statistical predictions of the tensile shear forces for corresponding welding forces (a) PC: FUS = 1485 N and (b) SC: FUS = 2700 N based on 108 experiments each.
Although the tensile shear forces are in a close range, the process parameters show considerable differences. The values of the welding energy, the oscillation amplitude as well as the welding force are significantly higher for the series configuration than for the parallel configuration. This can be attributed to the fundamentally different positions of the weld spots and clamping punches as well as the variation of the clamping punch geometry. Large-area clamping punches at the sides of the sonotrode cause improved restrictions on the freedom of movement of the aluminum sheet. This results in a higher oscillation amplitude and welding force to enable sufficient relative movement between the sheets to form a joint in the solid state. Simultaneously, the energy input into the areas of the clamping punches appears to be so large that the welding energy for the series configuration must be significantly increased compared to the parallel configuration to conduct sufficient energy at the interfacial area.
All further experiments used the parameters in Table 3 as the baseline. Figure 4 shows welded and tensile shear tested samples for both spot configurations. The joints failed at the interface and did not reveal any significant visual differences between the first and second spot. Mechanical testing caused slight plastic deformation of the aluminum sheets in the area of the weld spots, resulting in small bulges towards the steel sheets. To examine the mechanical performance of the individual spots, eight PC specimen cross-sections were cut along their longitudinal axis and tested for their tensile shear forces. These tests revealed almost equal results (2143 ± 180 N for Spot A and 2241 ± 272 N for Spot B). This confirmed the identical quality of both spots and their even load distribution in uncut samples.

Figure 4.
Welded and tensile shear tested samples for (a) parallel configuration and (b) series configuration.
3.2. Process Analysis
The temperature characteristics of the welds were investigated using a thermal/infrared camera and NiCr-Ni thermocouples in separate tests. The thermocouples were placed at the center of each weld spot at the interface of the two materials, as shown in Figure 5a–c. The thermocouples were introduced into the setup by removing a minimal amount of material from the steel sheets. Since the presence of the thermocouples could adversely affect the results, experiments were performed both with and without the thermocouples. Infrared imaging was carried out, however, for all the tests. Figure 5d and e show the measurement spots of the thermography for PC and SC respectively. Due to the position of additional clamping punches, thermal data of the sonotrode tip could only be collected in the direction perpendicular to that of the oscillation for PC and in the direction of the oscillation for SC. For both PC and SC, three spots were evaluated between the tip and the aluminum sheet, shown as T1, T2 and T3 in Figure 5. For each test, the temperatures observed at these three spots were averaged.

Figure 5.
Schematics illustrating the temperature measurement setup. Thermocouple placements for (a) parallel configuration; (b) series configuration and (c) inside the weld cross-section, as well as thermal imaging spots for (d) parallel and (e) series configuration.
Figure 6 shows four characteristic diagrams with the generator power and the thermocouple temperatures for ultrasonic welding of both spots of both connection types. For both parallel and series configuration (shown in Figure 6a–d respectively), the peak temperature values observed at the spots being welded were comparable (around 450 °C for PC and 510 °C for SC). This can be attributed to the use of identical welding parameters. Higher welding energies, amplitudes and forces used for the series configuration resulted in higher peak values for generator power and temperatures as compared to those of the parallel configuration. Prangnell et al. [20] observed temperatures exceeding 500 °C at the interface of AA6111-T4/DC04 joints for welding times longer than 1.5 s. They explained the long welding times for aluminum/steel joints with delayed welding due to interfacial locking caused by very high clamping pressures. For both configurations, it was seen that the slope at the beginning and the peak value of the temperature at the open Spot B was higher during the welding of Spot A, compared to the temperature at the welded Spot A as Spot B was being welded. The heat was generated by conduction from the welding spot and friction between the clamping punch and the aluminum sheet. Furthermore, if the sheets were not joined at Spot B during the welding of Spot A, friction between the sheets at Spot B could occur, leading to the measurement of a higher temperature. Table 4 also reflects this, presenting the average results of the measurements. The distribution of the measured values could be caused by the thermocouples in particular, as deviations in shape and position could occur.

Figure 6.
Characteristic curves of the generator powers and thermocouple temperatures over time for the (a) first and (b) second PC welding, as well as (c) first and (d) second SC welding.
Table 4.
Results from the thermal analysis in relation to welding times and peak generator powers during ultrasonic spot welding of AA6005A to HCT980X.
Although the parameters used for both spots were identical, their welding times differed considerably for both connection types. The standard deviation of the welding times was low, albeit with a longer second weld for PC and a longer first weld for SC. For SC, the shorter welding time of Spot B is due to the clamping punches on both sides and the Spot A already welded. Increased power is required to achieve the nominal oscillation amplitude due to the limited movement of the aluminum sheet. Compared to Spot A, the same amount of energy at high power input results in a shorter welding time for Spot B. In the case of PC, the increased power required to weld the first spot can be attributed to the needed energy input in the additional clamping area. The joining partners are able to move against each other, which is no longer possible during welding of the second spot. This results in the opposite development of the welding times for the two spot arrangements. Based on these results, the presence of a previously welded spot did not allow a general prediction of the welding time of a second spot. The specific configuration is crucial. The peak temperatures generated at a weld spot were independent of the welding time and the power-time curve of the generator. The amount of welding energy, which was the same for both weld spots of the two configurations, ultimately determined the peak temperature in the joining zone.
Table 4 shows a comparison of the simultaneously taken thermocouple and infrared camera readings. For PC welds, an average temperature difference of 177.5 °C for Spot A and 178.5 °C for Spot B were observed, whereas in the series configuration these temperature differences were seen to be 214 °C and 196.4 °C, respectively.
Compared to tests performed with the infrared camera only, the measurements with thermocouples showed slightly lower peak temperatures for PC and higher for SC. Due to the position of the weld spots at the edges of the sheet, the parallel configuration means that the steel sheet is only machined within the joining zone for the thermocouple placement without significant effects on the measured temperature. For the SC configuration, the steel sheets were machined to incorporate the thermocouples. Therefore the initial material volume underneath the interface area was reduced and is no longer available for dissipating the process heat. A simplified calculation could support this assessment. Consequently, a higher peak temperature could be measured in the joining zone.
In general, the thermocouple measurements can be considered as representative with increased temperatures for SC. For all weld spots, the average peak temperature was above 400 °C and thus above the eutectic temperature of 381 °C of the Al-Zn system, enabling the formation of a liquid Al-Zn phase at the welding site [21].
3.3. Microscopic Analysis
Further investigations included analyses by optical and scanning electron microscopy (SEM). Figure 7a,b show optical micrographs of cross-sections of the Spot A of the parallel and series configuration. The Zn layer is clearly visible in both images. However, inhomogeneities can be seen at the contact surface of the steel and Zn layer. These inhomogeneities increasingly occur at the edges of the weld spots. EDX mappings (Figure 7c,d) revealed incorporation of zinc into the aluminum. Haddadi et al. [15] observed similar conditions in AA6111-T4/DX53-ZF welds and attributed this to diffusion as well as the formation of a liquid Al-Zn film at a temperature above 400 °C. They described a limited stepwise melting of the galvannealed coating during a short ultrasonic welding cycle due to the layers of intermetallic Fe-Zn phases with different individual melting temperatures. Compared to the AA6111-T4/DX53-ZF welds, the AA6005A/HCT980X joints did not show an extensive penetration of Zn along grain boundaries into the aluminum sheet. The initial thickness of the Zn layer prior to welding is approx. 10 µm and was not significantly reduced by the ultrasonic welding process.

Figure 7.
Optical micrographs and superimposed SEM/EDX maps of the Al/steel interfaces at welding spots for (a,c) parallel layout as well as (b,d) series layout.
The fractured surfaces were characterized post-failure using EDX spot measurements. Figure 8 shows SEM images for (a) PC and (b) SC from the aluminum and steel sides, respectively. The results of EDX spot measurements are displayed in atomic percentage for the three main elements in the order Al/Fe/Zn beside the spots. The elemental distributions may indicate intermetallic phases. However, this is inconclusive at present and can be treated as an indicator. All images in Figure 8 show borders of the weld spots. In both spot configurations, either very little or no aluminum was observed in the area of the weld spot on the aluminum side. Iron and especially zinc are the predominant elements in this area. According to Haddadi [17], a stoichiometric analysis of the two spots 1.74/25.56/71.05 and −/23.94/74.77 suggests that it could be the intermetallic phase Fe3Zn10. At the edges of weld spots, the compositions −/17.98/81.44 and −/12.05/87.56 indicate Fe5Zn21 and FeZn10, respectively. On the steel side of the weld spots, iron is predominant with zinc also present in smaller quantities. At the borders are several areas which mainly contain aluminum. −/11.8/88.2 indicates the presence of the intermetallic phase FeZn10.

Figure 8.
SEM images including EDX spot measurements of the fractured surfaces after tensile shear tests for (a) parallel and (b) series configuration.
EDX mapping provided a detailed overview of the fractured surfaces of the sheets. Figure 9 shows two superimposed images for the parallel configuration, where the elements are illustrated in different colors. The aluminum side exhibits Zn and Fe in the area of the weld spot and an adjacent transition zone mostly composed of Zn. There is also a transition zone on the steel side, and white circles highlight aluminum spots. The area of the weld spot contains Fe almost exclusively.

Figure 9.
Superimposed SEM/EDX maps of the fractured surfaces after tensile shear tests for the parallel configuration (white circles mark an improved Al concentration).
The fracture surface analysis findings indicate that the aluminum joined well with the Zn layer as this layer mostly remained on the Al sheet. After welding, the connection between Al and Zn seems to be better than the connection between steel and its Zn layer. Figure 10 schematically illustrates the surface conditions of the sheets after tensile shear testing. As measurements detected aluminum spots on the steel side, breaking off the Zn layer seems not to be the only failure mode. This indicates partial failure in the cohesion of the Al sheet. Haddadi and Abu-Farha [16] investigated the ultrasonic welding of AA6111-T4/DX53-ZF and concluded that the ultrasonic oscillation could damage the brittle intermetallic phases Fe3Zn10 and Fe5Zn21 of the Zn layer. These were possible starting points for cracks. They discovered that the phases were present in the hard galvannealed zinc layer when the steel sheet was in its delivery condition. EDX measurements on cross-sections of HCT980X in delivery condition could also indicate the existence of intermetallic phases.

Figure 10.
Side-view schematic of the fractured surfaces after tensile shear testing.
3.4. Classification and Assessment
Since all weld spots at the interface are approximately 9 mm × 9 mm, the tensile shear strengths are calculated to approx. 25 MPa for PC and 24 MPa for SC. Compared to publications on welding 6000 series aluminum alloys to galvanized steels by other techniques, these strengths are in some cases significantly lower. However, it should be noted that often steels with different mechanical properties and other galvanizing processes were used. Cao et al. [22] welded 1 mm thick AA6061-T6 to 1 mm thick galvanized steel using cold metal transfer (CMT) spot plug joining and achieved a tensile shear strength of approx. 50 MPa. Chen et al. [23] joined a 1.2 mm thick AA6022-T4 sheet and a 2.0 mm thick hot-dip galvanized low carbon steel sheet (HDG LCS) by resistance spot welding (RSW) and obtained a tensile shear strength of 105 MPa. Yuce et al. [24] joined 1 mm thick AA6082-T6 and 0.8 mm thick DP600 steel with a zinc coating by laser welding and reported a tensile shear strength of approx. 109 MPa. Liyanage et al. [25] used friction stir spot welding (FSSW) to join 1.15 mm thick AA6111-F and 1.8 mm thick zinc coated low carbon steel. They achieved a tensile shear strength of approx. 127 MPa.
To assess the influence of the Zn coating on the performance of the AA6005A-T4/HCT980X joints, some welding trials were done without Zn coating. The Zn layer was removed with 220 grit SiC paper, and the tensile shear forces increased by 76% using the same process parameters. Nevertheless, due to corrosion issues, the protective Zn layer is mandatory for a long-term automotive application of the welded joints. Even local avoidance of the Zn layer at a weld spot is not an option for robust industrial applications. Since ultrasonic oscillations can damage the brittle intermetallic Fe-Zn phases of a galvannealed steel, a coating with a decreased proportion of intermetallic phases can positively influence the mechanical performance of a joint. Therefore, galvanizing without subsequent annealing can be advantageous for the joining process, regardless of possible disadvantages in shaping the steel. The galvannealed HCT980X was replaced by the low alloyed and galvanized steel HX340LAD + Z100 for some SC configuration trials. AA6005A/HX340LAD + Z100 joints showed an average tensile shear force of 5990 ± 30 N and thus an increase of 54% compared to AA6005A/HCT980X joints with an average tensile shear force of 3888 ± 308 N.
4. Conclusions
Multi-spot ultrasonic metal welding enabled the successful joining of AA6005A-T4 and HCT980X sheets in two configurations, parallel (PC) and series (SC). The spots were welded one after the other, and the previously welded spots had to be protected from the ultrasonic oscillations of subsequent welds. This was achieved by using additional clamping punches that covered the pre-existing welds. The following conclusions will help to develop future applications of multi-spot welded structures:
- Both spot configurations exhibited tensile shear forces in a comparable range (4076 ± 277 N for PC and 3888 ± 308 N for SC), but significantly different process parameters (PC: WUS = 2000 Ws, u = 22.5 µm, FUS = 1485 N, FCL = 1000 N; SC: WUS = 2900 Ws, u = 27.5 µm, FUS = 2700 N, FCL = 800 N). This resulted from different positions of the weld spots and clamping punches as well as the variation of the clamping punch geometry.
- The required power of the generator was dependent on the specific geometric conditions for each spot. Therefore, the welding times differed considerably for the first and second spot, despite identical welding parameters.
- The peak temperature values observed at the spots being welded, around 450 °C for PC and 510 °C for SC, were comparable for the first and second spot, due to the application of the same amount of welding energy.
- Microscopic investigations of cross-sections revealed an incorporation of zinc into the aluminum but no significant reduction of the initial thickness of the Zn layer (approx. 10 µm).
- EDX measurements of fractured surfaces after tensile shear testing revealed the separation of the zinc layer from the steel sheet in the areas of the weld spots. These measurements additionally pointed to the existence of intermetallic phases of Fe and Zn. The zinc layer seemed to be the weakest structural link of the multi-metal structures.
Author Contributions
Conceptualization, F.B.; investigation, M.B.; data curation, M.B.; writing—original draft preparation, M.B.; writing—review and editing, F.B.; visualization, M.B.; supervision, F.B.; project administration, M.B. All authors have read and agreed to the published version of the manuscript.
Funding
The article processing charge was funded by the Baden-Wuerttemberg Ministry of Science, Research and Art and the University of Freiburg in the funding program Open Access Publishing.
Institutional Review Board Statement
Not applicable.
Informed Consent Statement
Not applicable.
Data Availability Statement
The data presented in this study are available in the article.
Acknowledgments
The authors would like to thank Toyota Motor Europe (Zaventem, Belgium), Constellium (Neuf-Brisach, France) and Voestalpine (Linz, Austria) for providing the sheet materials. Further thanks to Branson Ultraschall/Emerson Technologies (Dietzenbach, Germany) for their support concerning the ultrasonic welding equipment. Many thanks to Bilal Khatri, Aravind Premanand and Ramiz Qussous for proofreading.
Conflicts of Interest
The authors declare no conflict of interest.
References
- Ni, Z.L.; Ye, F.X. Ultrasonic spot welding of aluminum alloys: A review. J. Manuf. Process. 2018, 35, 580–594. [Google Scholar] [CrossRef]
- Shakil, M.; Tariq, N.H.; Ahmad, M.; Choudhary, M.A.; Akhter, J.I.; Babu, S.S. Effect of ultrasonic welding parameters on microstructure and mechanical properties of dissimilar joints. Mater. Des. 2014, 55, 263–273. [Google Scholar] [CrossRef]
- Macwan, A.; Jiang, X.Q.; Chen, D.L. Interfacial Characterization of Dissimilar Joints between Al/Mg/Al-Trilayered Clad Sheet to High-Strength Low-Alloy Steel. JOM 2015, 67, 1468–1477. [Google Scholar] [CrossRef]
- Gullino, A.; Matteis, P.; D’Aiuto, F. Review of Aluminum-To-Steel Welding Technologies for Car-Body Applications. Metals 2019, 9, 315. [Google Scholar] [CrossRef]
- Martinsen, K.; Hu, S.J.; Carlson, B.E. Joining of dissimilar materials. CIRP Ann. 2015, 64, 679–699. [Google Scholar] [CrossRef]
- Urbikain, G.; Perez, J.M.; López de Lacalle, L.N.; Andueza, A. Combination of friction drilling and form tapping processes on dissimilar materials for making nutless joints. Proc. Inst. Mech. Eng. Part B J. Eng. Manuf. 2018, 232, 1007–1020. [Google Scholar] [CrossRef]
- Cai, W.; Daehn, G.; Vivek, A.; Li, J.; Khan, H.; Mishra, R.S.; Komarasamy, M. A State-of-the-Art Review on Solid-State Metal Joining. J. Manuf. Sci. Eng. 2019, 141. [Google Scholar] [CrossRef]
- Mirza, F.A.; Macwan, A.; Bhole, S.D.; Chen, D.L.; Chen, X.-G. Microstructure, tensile and fatigue properties of ultrasonic spot welded aluminum to galvanized high-strength-low-alloy and low-carbon steel sheets. Mater. Sci. Eng. A 2017, 690, 323–336. [Google Scholar] [CrossRef]
- Munoz-Guijosa, J.M.; Nanaumi, G.; Ohtani, K.; Ohtake, N. Perpendicular ultrasonic joining of steel to aluminium alloy plates. J. Mater. Process. Technol. 2017, 243, 112–122. [Google Scholar] [CrossRef]
- Watanabe, T.; Sakuyama, H.; Yanagisawa, A. Ultrasonic welding between mild steel sheet and Al–Mg alloy sheet. J. Mater. Process. Technol. 2009, 209, 5475–5480. [Google Scholar] [CrossRef]
- Xu, L.; Wang, L.; Chen, Y.-C.; Robson, J.D.; Prangnell, P.B. Effect of Interfacial Reaction on the Mechanical Performance of Steel to Aluminum Dissimilar Ultrasonic Spot Welds. Metall. Mater. Trans. A 2016, 47, 334–346. [Google Scholar] [CrossRef]
- Mirza, F.A.; Macwan, A.; Bhole, S.D.; Chen, D.L.; Chen, X.-G. Effect of welding energy on microstructure and strength of ultrasonic spot welded dissimilar joints of aluminum to steel sheets. Mater. Sci. Eng. A 2016, 668, 73–85. [Google Scholar] [CrossRef]
- Macwan, A.; Kumar, A.; Chen, D.L. Ultrasonic spot welded 6111-T4 aluminum alloy to galvanized high-strength low-alloy steel: Microstructure and mechanical properties. Mater. Des. 2017, 113, 284–296. [Google Scholar] [CrossRef]
- Patel, V.K.; Bhole, S.D.; Chen, D.L. Ultrasonic Spot Welding of Aluminum to High-Strength Low-Alloy Steel: Microstructure, Tensile and Fatigue Properties. Metall. Mater. Trans. A 2014, 45, 2055–2066. [Google Scholar] [CrossRef]
- Haddadi, F.; Strong, D.; Prangnell, P.B. Effect of Zinc Coatings on Joint Properties and Interfacial Reactions in Aluminum to Steel Ultrasonic Spot Welding. JOM 2012, 64, 407–413. [Google Scholar] [CrossRef]
- Haddadi, F.; Abu-Farha, F. Microstructural and mechanical performance of aluminium to steel high power ultrasonic spot welding. J. Mater. Process. Technol. 2015, 225, 262–274. [Google Scholar] [CrossRef]
- Haddadi, F. Microstructure reaction control of dissimilar automotive aluminium to galvanized steel sheets ultrasonic spot welding. Mater. Sci. Eng. A 2016, 678, 72–84. [Google Scholar] [CrossRef]
- Wienströer, S.; Fransen, M.; Mittelstädt, H.; Nazikkol, C.; Völker, M. Zinc/Iron phase transformation studies on galvannealed steel coatings by X-ray diffraction. Adv. X-ray Anal. 2003, 46, 291–296. [Google Scholar]
- Haddadi, F.; Abu-Farha, F. The effect of interface reaction on vibration evolution and performance of aluminium to steel high power ultrasonic spot joints. Mater. Des. 2016, 89, 50–57. [Google Scholar] [CrossRef]
- Prangnell, P.; Haddadi, F.; Chen, Y.C. Ultrasonic spot welding of aluminium to steel for automotive applications—microstructure and optimisation. Mater. Sci. Technol. 2011, 27, 617–624. [Google Scholar] [CrossRef]
- Murray, J.L. The Al−Zn (Aluminum-Zinc) system. J. Phase Equilibria 1983, 4, 55–73. [Google Scholar] [CrossRef]
- Cao, R.; Huang, Q.; Chen, J.H.; Wang, P.-C. Cold metal transfer spot plug welding of AA6061-T6-to-galvanized steel for automotive applications. J. Alloys Compd. 2014, 585, 622–632. [Google Scholar] [CrossRef]
- Chen, N.; Wang, H.-P.; Carlson, B.E.; Sigler, D.R.; Wang, M. Fracture mechanisms of Al/steel resistance spot welds in lap shear test. J. Mater. Process. Technol. 2017, 243, 347–354. [Google Scholar] [CrossRef]
- Yuce, C.; Karpat, F.; Yavuz, N. Investigations on the microstructure and mechanical properties of laser welded dissimilar galvanized steel–aluminum joints. Int. J. Adv. Manuf. Technol. 2019, 104, 2693–2704. [Google Scholar] [CrossRef]
- Liyanage, T.; Kilbourne, J.; Gerlich, A.P.; North, T.H. Joint formation in dissimilar Al alloy/steel and Mg alloy/steel friction stir spot welds. Sci. Technol. Weld. Join. 2009, 14, 500–508. [Google Scholar] [CrossRef]
Publisher’s Note: MDPI stays neutral with regard to jurisdictional claims in published maps and institutional affiliations. |
© 2021 by the authors. Licensee MDPI, Basel, Switzerland. This article is an open access article distributed under the terms and conditions of the Creative Commons Attribution (CC BY) license (https://creativecommons.org/licenses/by/4.0/).