Article

Heat Treatment and Austenitization Temperature Effect on Microstructure and Impact Toughness of an Ultra-High Strength Steel

U.S. Army Combat Capability Development Command Army Research Laboratory, 6300 Rodman Rd., Aberdeen Proving Ground, MD 21005, USA
*
Author to whom correspondence should be addressed.
Metals 2021, 11(5), 723; https://doi.org/10.3390/met11050723
Submission received: 14 April 2021 / Revised: 26 April 2021 / Accepted: 27 April 2021 / Published: 28 April 2021

Abstract

:
Heat treatment parameters were varied to determine the effect of normalizing and austenitizing temperature on the properties of an ultra-high strength wrought steel. Normalizing temperature did not have a significant effect on strength and ductility. Higher normalizing temperatures led to an increase in final prior austenite grain size and a slight loss in toughness. Austenitizing temperature of 825 °C was insufficient to produce a fully austenitic structure prior to quenching and led to sub-par impact behavior. The best properties were obtained after austenitizing at 915 °C followed by water quenching; the resulting quasi static properties were shown to be a yield strength of 1380 MPa with an ultimate tensile strength of 1670 MPa and 12.5% total ductility. Charpy V-notch impact properties as high as 52 J at −40 °C and 75 J at 25 °C and the behavior were achieved using higher austenitizing temperatures as well.

1. Introduction

Ultra-high strength steels are of increasing interest for utilization in space restricted applications requiring strengths in excess of 1500 MPa. A combination of alloying and processing are utilized to obtain these strengths and retain toughness as measured by Charpy V-notch testing. Two factors that contribute to toughness are high angle grain boundaries (HAGB) and retained austenite [1,2]. While HAGB have been reported to be of utility in arresting crack growth, the effect of retained austenite is convoluted [3,4,5]. In new third generation advanced high strength sheet steels, retained austenite is considered necessary to obtain the elevated ductility and work hardening rates measured through quasi-static tensile testing. Toughness of these sheet steels is typically determined as the product of ultimate strength and fracture strain. Plate steel toughness however is measured directly by Charpy impact testing. For ultra-high strength plate steels, the retained austenite must be sufficiently stable. It has been identified that metastable high-carbon austenite behaves in a brittle fashion when it transforms to untempered martensite during impact testing as was shown by Chen et al. [6] and the seminal work by Holloman and Jaffe [7].
Grain size is another avenue to improve both toughness and strength. Grain refinement through heat treatment and/or micro-alloying has previously been pursued to achieve elevated strength and toughness goals. Depending on the alloy, however, the methods to obtain prior austenite grain size refinement can vary significantly. Van Aken et al. [8] showed that a sub-critical temper was necessary to produce grain refinement in cast ultra-high strength steels. This methodology was effective in destabilizing the retained austenite into carbides, thereby preventing agglomeration of inter-lath austenite of identical orientations re-forming the parent austenite upon thermal cycling. This processing route was also shown recently in the work of Field et al. [3] on a wrought modified Eglin steel and produced an 11% reduction in prior austenite grain size, by a combination of thermal cycling and sub-critical tempering. A secondary means to obtain grain refinement on a modified Eglin steel was performed by Hidalgo and Santofimia; [8] they showed that by rapidly austenitizing and quenching and cyclically repeating the process a prior austenite grain size of <1 μm could be obtained. It should be noted however, the mechanical properties of those microstructures were not evaluated due to the limited sample size needed to obtain the rapid heating and cooling rates. With these rapid heating rates, partial austenitization of high hardenability steels must be avoided. Work by Grydin et al. [9] noted that partially austenitized hot forming steel exhibited lowered strengths and ductility compared to completely austenitized hot formed steels. They note that this change in properties is due to the incompletely dissolved ferrite, and undissolved carbides within the microstructure during the partial austenitization treatment.
The technique of prior austenite reconstruction provides a means to observe the effects of processing on high-strength steel microstructures comprised primarily of lath martensite [10]. This technique utilizes electron back-scatter diffraction (EBSD) data of room-temperature steel microstructure to computationally reconstruct parent austenite grains. This is enabled by the orientation relationships that exists between the parent austenite and daughter martensite grains—each austenite grain can transform into a discrete number of possible martensite orientations. Martensite grains can thus be “grouped” through a neighbor-to-neighbor comparison process that determines if two martensite laths could have come from the same parent [11]. Prior austenite reconstruction provides a wealth of information about austenite microstructure that includes austenite grain size, morphology, texture, etc. This information is valuable for the comparison of steels that were processed differently within the austenite regime, as the γ—α’ transformation often erases or obscures the changes in in the resulting austenite microstructure. A primary advantage of prior austenite reconstruction over other methods of exposing prior austenite boundaries is the back-calculation of austenite grain orientations. Austenite orientation information allows for the further differentiation of types of grain boundaries within the martensite microstructure. Prior austenite reconstructions are used in this study to observe the effects of various processing schemes.
When optimizing heat treatments for parent austenite grain size, care must be taken to avoid chemical segregation. Segregation is a significant concern for highly alloyed steels with high hardenability. Refractory elements like molybdenum, chromium, tungsten, and vanadium are prone to segregate during solidification. Through thickness hardenability in heavy plate and the dissolution of persistent carbides in segregated regions must also be considered. Webb et al. [12] showed a methodology for modeling the segregation of Eglin steel castings that contain tungsten, using standard thermodynamic software (FactSage) to model the final 15% solidified using a Scheil–Gulliver solidification model. Through this simplified model they were able to predict the segregation of tungsten and compared the predicted values to measurements made on the density of inter-dendritic refractory-carbides. Poirier and Flemings [13] also reported that Mo has a segregation ratio 5 times higher than Mn, Ni, and Cr in a medium carbon low alloy steel. Heat treatments should be designed to anticipate segregation to obtain the superior performance needed for advanced ultra-high strength steels. The purpose of this work is to assess the effect of different heat treatment combinations to obtain an ultra-high strength wrought steel (>1600 MPa) with toughness exceeding 40 J at −40 °C. A 4-step heat treatment as described by previous works [3] will be performed. The temperatures selected are based on either the bulk composition or the solute rich regimes according to the last 15% to solidify

2. Materials and Methods

The alloy under investigation was vacuum induction melted into an ingot measuring 400 × 460 × 75 mm3. Hot rolling was performed by heating the ingot to 1260 °C with a total thickness reduction of 73% to produce plates 20 mm thick (Sophisticated Alloys Inc., Butler, PA, USA). The composition of the alloy was 0.26C-0.60Mn-1.0Si-1.0Ni-2.8Cr-0.92Mo-0.1V-balFe (in wt. %) according to optical emission spectroscopy (Element Materials Technology, Daleville, IN, USA) and gas combustion analysis to measure carbon content. It is noted that the alloy contains significant concentrations of carbide stabilizing elements such as vanadium, molybdenum, and chromium. The measured composition was modeled using ThermoCalc 2018a with the TCFE9 database to determine carbide stability of the bulk alloy and the A1 and A3 temperatures. Due to the high partitioning coefficient for certain elements the segregation associated with casting was modeled. The composition of the last 15% to solidify was modeled using the Scheil module assuming all elements are slow to diffuse with the exception of carbon. The first 85% to solidify was determined by calculating a mass balance. Paraequilibrium, assuming an equivalent activity in austenite of two compositions (the first 85% and the last 15%) was used to calculate the carbon concentration of the last 15% composition according to Equation (1) as described in previous works by Field et al. [3] and Athavale et al. [14]. In this manner the carbon content of the last 15% is determined by the difference in alloy content (e.g., ΔNi) between the first 85% and last 15% in weight percent, and the carbon contained in the first 85% was then calculated by mass balance. The composition of the bulk alloy, and the first 85% and last 15% to solidify are shown in Table 1. It should be noted that Mo and V have the highest ratio of increase from the bulk to solute rich composition. The Mo increases by 81.5% and the V increases in concentration by 130%. The martensite start temperatures were calculated using Equation (2) from De Cooman and Speer [15].
C 15 % = C B u l k 1 0.05 Δ N i 0.23 Δ S i + 0.07 Δ Cr + 0.03 Δ Mn + 0.04 Δ Mo + 0.17 Δ V
M s = 499 308 C 30.6 M n 14.5 S i 16.6 N i 8.9 C r + 2.4 M o
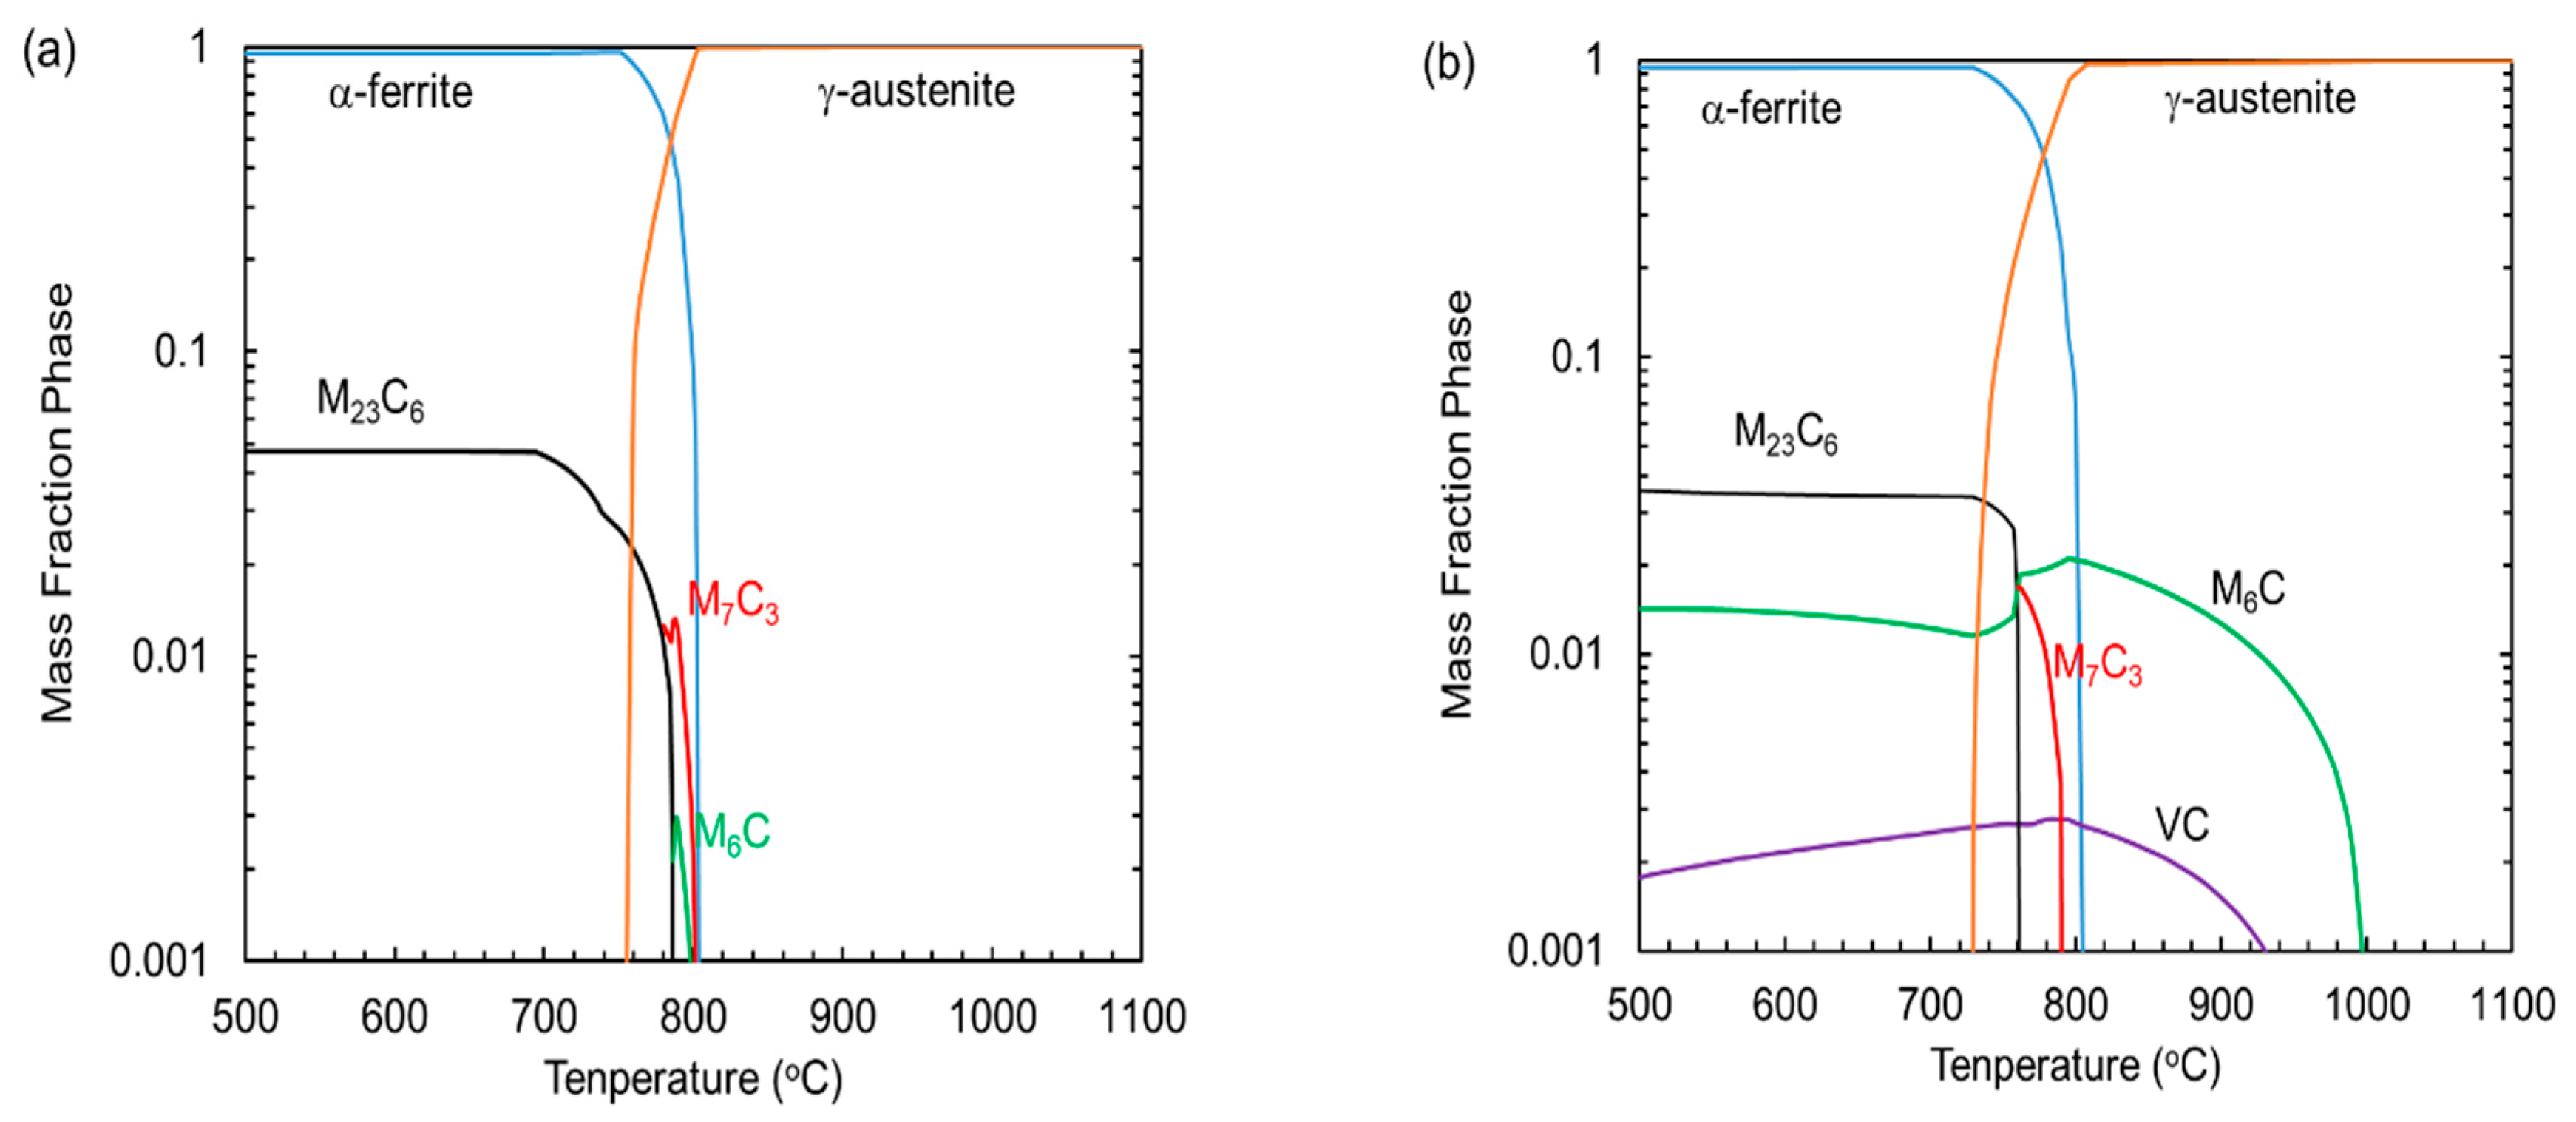
ThermoCalc 2018a energy minimization simulations were performed on both the bulk and solute rich compositions and are shown in Figure 1. It should be noted that the A1 and A3 temperatures are not significantly shifted using the bulk or solute rich composition. The A1 is decreased in the solute rich region from 750 °C to 730 °C due to the increase in austenite stabilizing elements like Ni and Mn. It is surprising however that the A3 is not lowered, but increases by 10 °C. In the bulk composition calculations, α-ferrite and all stable carbides are fully dissolved at 800 °C, whereas in the solute rich region the α-ferrite is stabilized up to 810 °C. The increase in concentration of Mo, Si, and Cr appear to stabilize the carbides to higher temperatures. The M6C, a Mo-Si rich carbide, is stabilized up to 1000 °C from the bulk composition of 800 °C. VC is stable up to 970 °C which is significant to note due to the lack of stability of VC in the bulk alloy entirely.
The wrought steel was subjected to four different heat treatment cycles to elucidate the effects of normalization temperature and austenitizing temperature on mechanical performance. Heat treatments were performed in cycles to both refine the microstructure and reduce elemental segregation. The components of each treatment step used in this study are shown in Table 2. During heat treatment, samples were placed in 321-type stainless steel bags for oxidation protection. Sample temperature was tracked with secondary thermocouples on the surface of the material and heat treatment times were initiated when the surface temperature reached ±5 °C of the target temperature. For processing steps that required quenching, samples were removed from the stainless bags and quenched to room temperature in agitated room temperature water.
Heat treatments were performed using a sequence of temper normalize—air cool, temper, and concluded with an austenitize and quench. All alloys were finalized with a stage I temper of 204 °C for 4 h. A schematic of the heat treatment temperature is shown in Figure 2. This 4-step heat treatment was based on the results from the work of Field et al. [3] that showed both sub-critical temper (T) and a high temperature normalization was of necessity to obtain superior strength and toughness from these types of highly alloyed steels. Two levels of normalizing temperatures and austenitizing temperatures were examined. The lower normalization temperature (NL) was based on the bulk composition to homogenize the austenite to remove chemical segregation, the higher normalization temperature (NH) was derived from the segregated composition that showed M6C, and VC to be stable at temperatures exceeding 1000 °C. The lower austenitizing temperature (QL) was based on the A3 + 25 °C of the bulk composition, and the higher austenitizing temperature (QH) was derived from the solute rich composition to solubilize the VC before quenching. For simplicity, samples will be labeled using a combination of the normalizing and austenitizing temperatures, excluding the consistent intermediate sub-critical temper steps in the nomenclature for simplicity.
To quantify the microstructure, samples in the longitudinal-short (LS) orientation were mechanically polished to 0.02 μm finish using colloidal silica. Electron backscattered diffraction using orientation image mapping (EBSD-OIM) was performed to measure misorientation and identify prior austenite grain size. EBSD was carried out using an FEI NovaNanolab 600i (Thermo Fisher Scientific, Waltham, MA, USA) dual beam Focused Ion beam microscope (FIB) at an accelerating voltage of 20 kV, emission current of 2.7 nA and a working distance of 7–8 mm.
EBSD data was used to reconstruct the parent austenite microstructure for samples having undergone each processing scheme. Reconstructions were performed in MATLAB (Mathworks, Natick, MA, USA) using the method as outlined in [11]. Grouping of martensite laths into their parent austenite grains was accomplished via a seed-growth type clustering algorithm that checks for neighboring laths that could have come from the same parent grain. The Kurdjumov–Sachs (KS) orientation relationship was assumed for all samples in this study. Additionally, the relationship between reconstructed austenite grains was used to identify the possibility of partial austenitization in some samples.
Secondary electron imaging was also performed on samples following etching using a modified Marbles Reagent comprised of 50 vol. % Marbles Reagent and 50 vol. % glycerin. Fracture surfaces were analyzed with a Phenom XL (Thermo Fisher Scientific, Waltham, MA, USA) operating at 15 kV in backscatter mode. Tensile testing was performed with the loading axis parallel to the rolling direction according to ASTM E8 [16] using a sub-sized flat tensile bar with gauge width of 6.0 mm, and gauge length of 25.0 mm and a strain rate of 10-4 s-1. The toughness of the alloy was determined through Charpy V-notch (CVN) impact testing using standard full-sized V-notch samples according to ASTM E23 [17]. Testing temperatures ranged from −40 °C to ambient (measured to be 25 °C) in increments of 20 °C. CVN bars were in the transverse-longitudinal (T-L) orientation, with the notch direction parallel to the rolling direction.

3. Results and Discussion

Representative EBSD-OIM micrographs of the heat-treated samples are shown in Figure 4. Misorientation angles between 15 and 45° are highlighted in yellow to identify the prior austenite grain size as has been shown from the work of Sinha et al. [18]. It is noted that in the NHQL (Figure 3a) and NLQL (Figure 3b) there is a high volume of the 15–45° boundaries and the prior austenite grain shape is highly irregular. This is further observed by the reconstructions of the parent austenite grains depicted in Figure 4. There are instances where austenite grains are formed within larger parent austenite grains. These microstructures would imply that the QL step at 825 °C was insufficient to fully austenitize the alloy. The A3 temperature for the bulk composition is calculated to be 800 °C according to Figure 1a. The QL temperature was 825 °C which provides an excess 25 °C to be fully in the austenite phase field. Using a Kernal Average Misorientation (KAM) map for the QL processed steels regions of highly recrystallized α-ferrite with extremely low internal misorientation are identified as shown in Figure 5. This implies that during QL step, at 825 °C, the microstructure was a mixture of undissolved α-ferrite and fresh austenite. This implication is further supported by the reconstructed prior austenite regions for the samples that underwent the QL step. Figure 4a identifies several small prior austenite grains that are contained within a single larger austenite region. Each small austenite region shares a KS variant with the surrounding region (within a tolerance of 5° misorientation). This suggests that the small austenite regions nucleated from existing martensite/ferrite laths and did not grow sufficiently to fully erase the austenite grains in place after normalization.
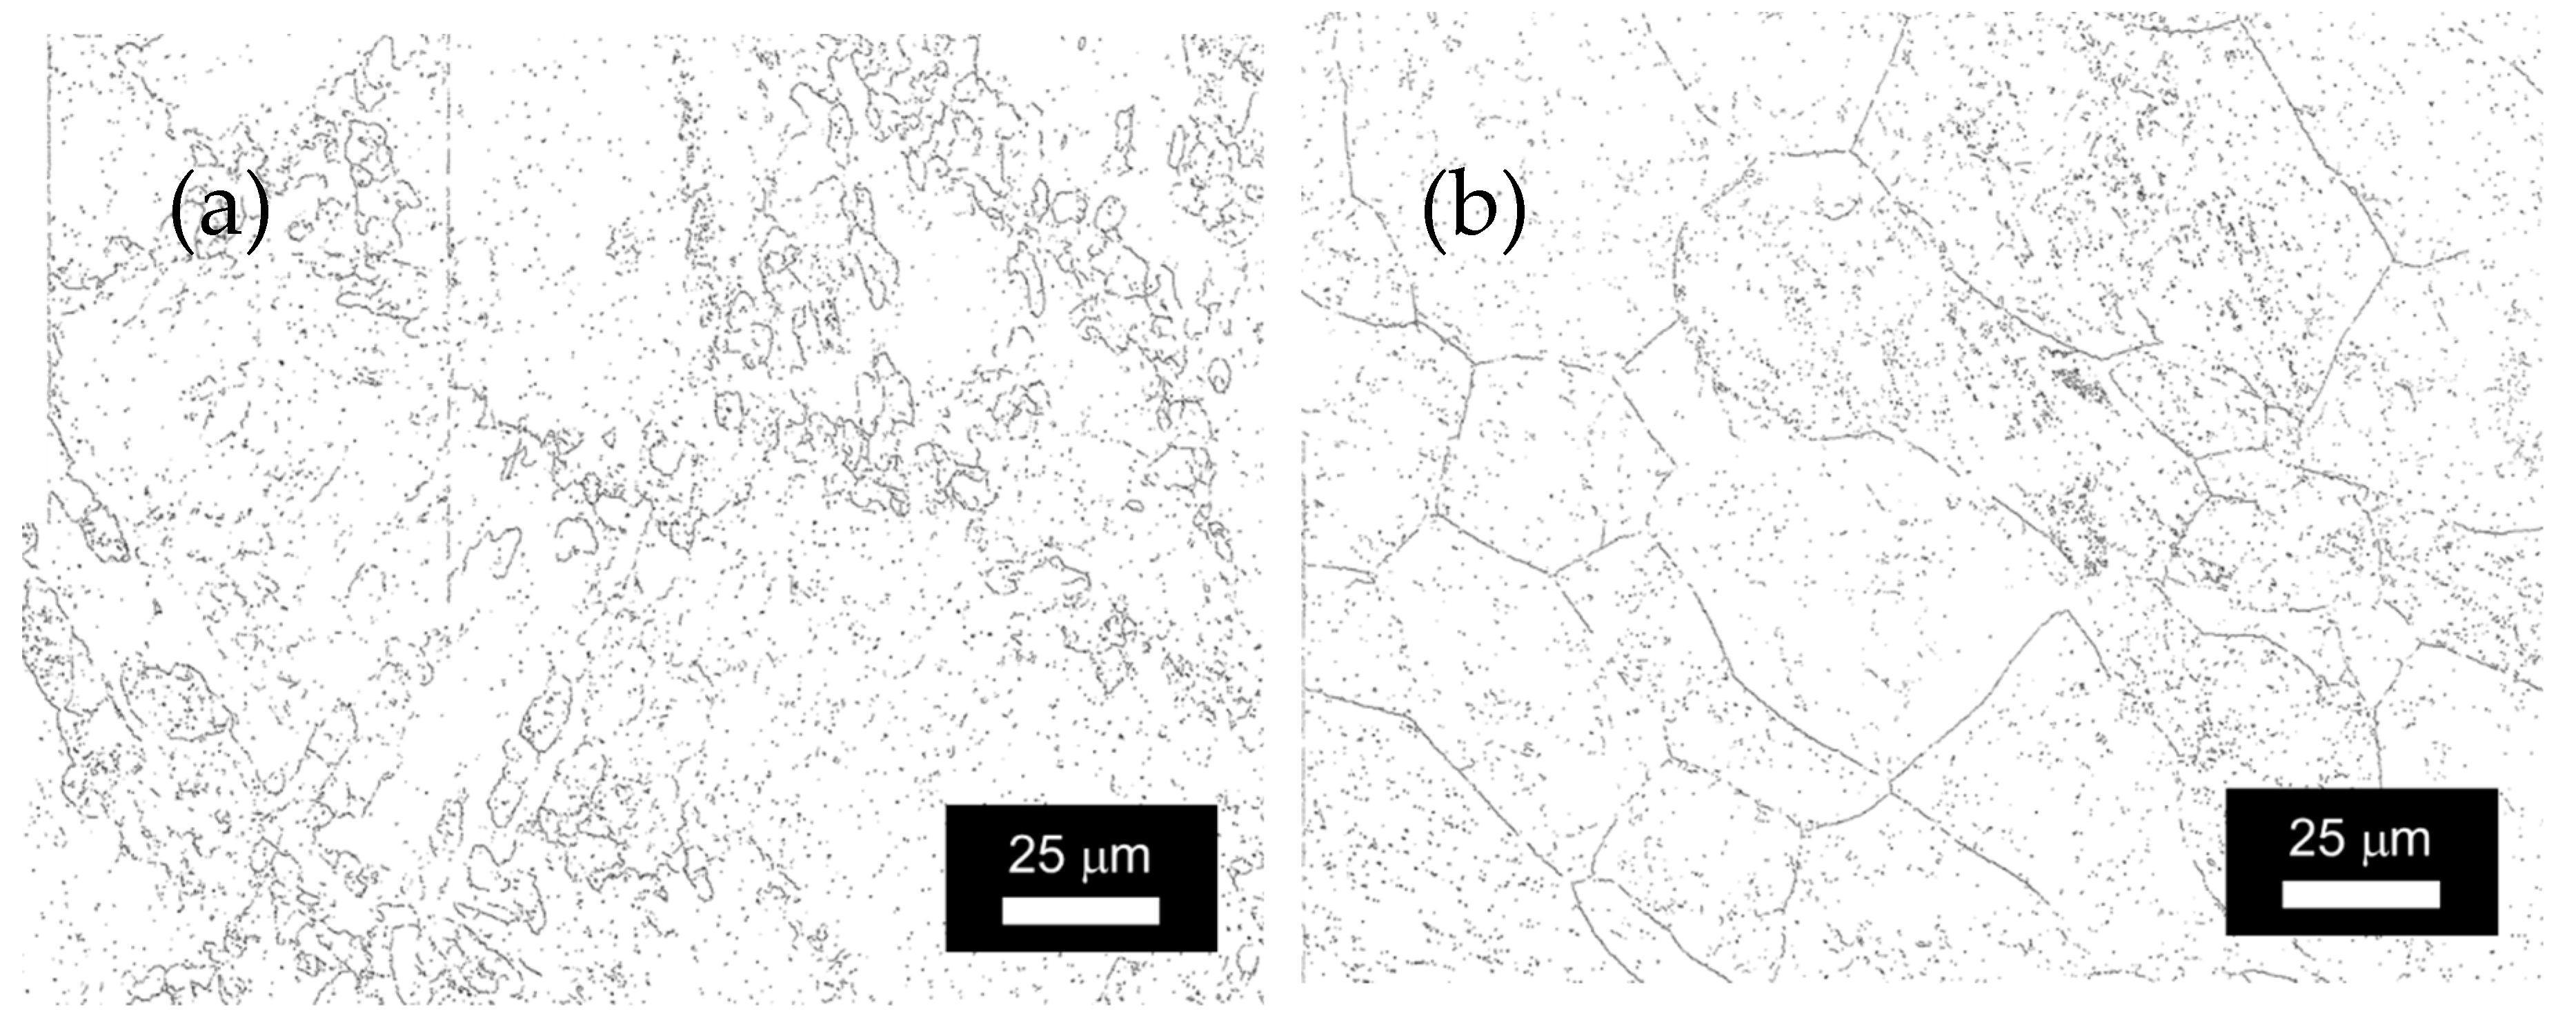
The NHQH (Figure 4c) and NLQH (Figure 4d) both exhibit typical equiaxed prior austenite grains in the range of 70 to 50 μm and is consistent with previous work [3] on these alloys. The NHQH microstructure appears to have slightly larger prior austenite grain size compared to the NLQH and is rationalized by the higher normalizing temperature which would have led to grain growth. In addition to the prior austenite reconstructions, a map of the 15–45° boundaries is shown in Figure 6 for NLQL and NLQH and it can be seen both in Figure 4b and Figure 6a that within the NLQL condition there is a large dispersion of fine grains surrounding a set of larger grains. Some of the fine grain regions are depicted in black in Figure 4b, where they were unable to be reconstructed due to an insufficient number of martensite variants to back-calculate a parent austenite orientation. Some of these fine grain regions were only comprised of a single martensite or ferrite variant. It is further noted that these finer grains all contain a radius of curvature pointing to the interior of said grains implying that during the austenitizing heat treatment the grains were being devoured by the larger surrounding grains. In both Figure 4b and Figure 6b the NLQH exhibits a uniform equiaxed grain structure.
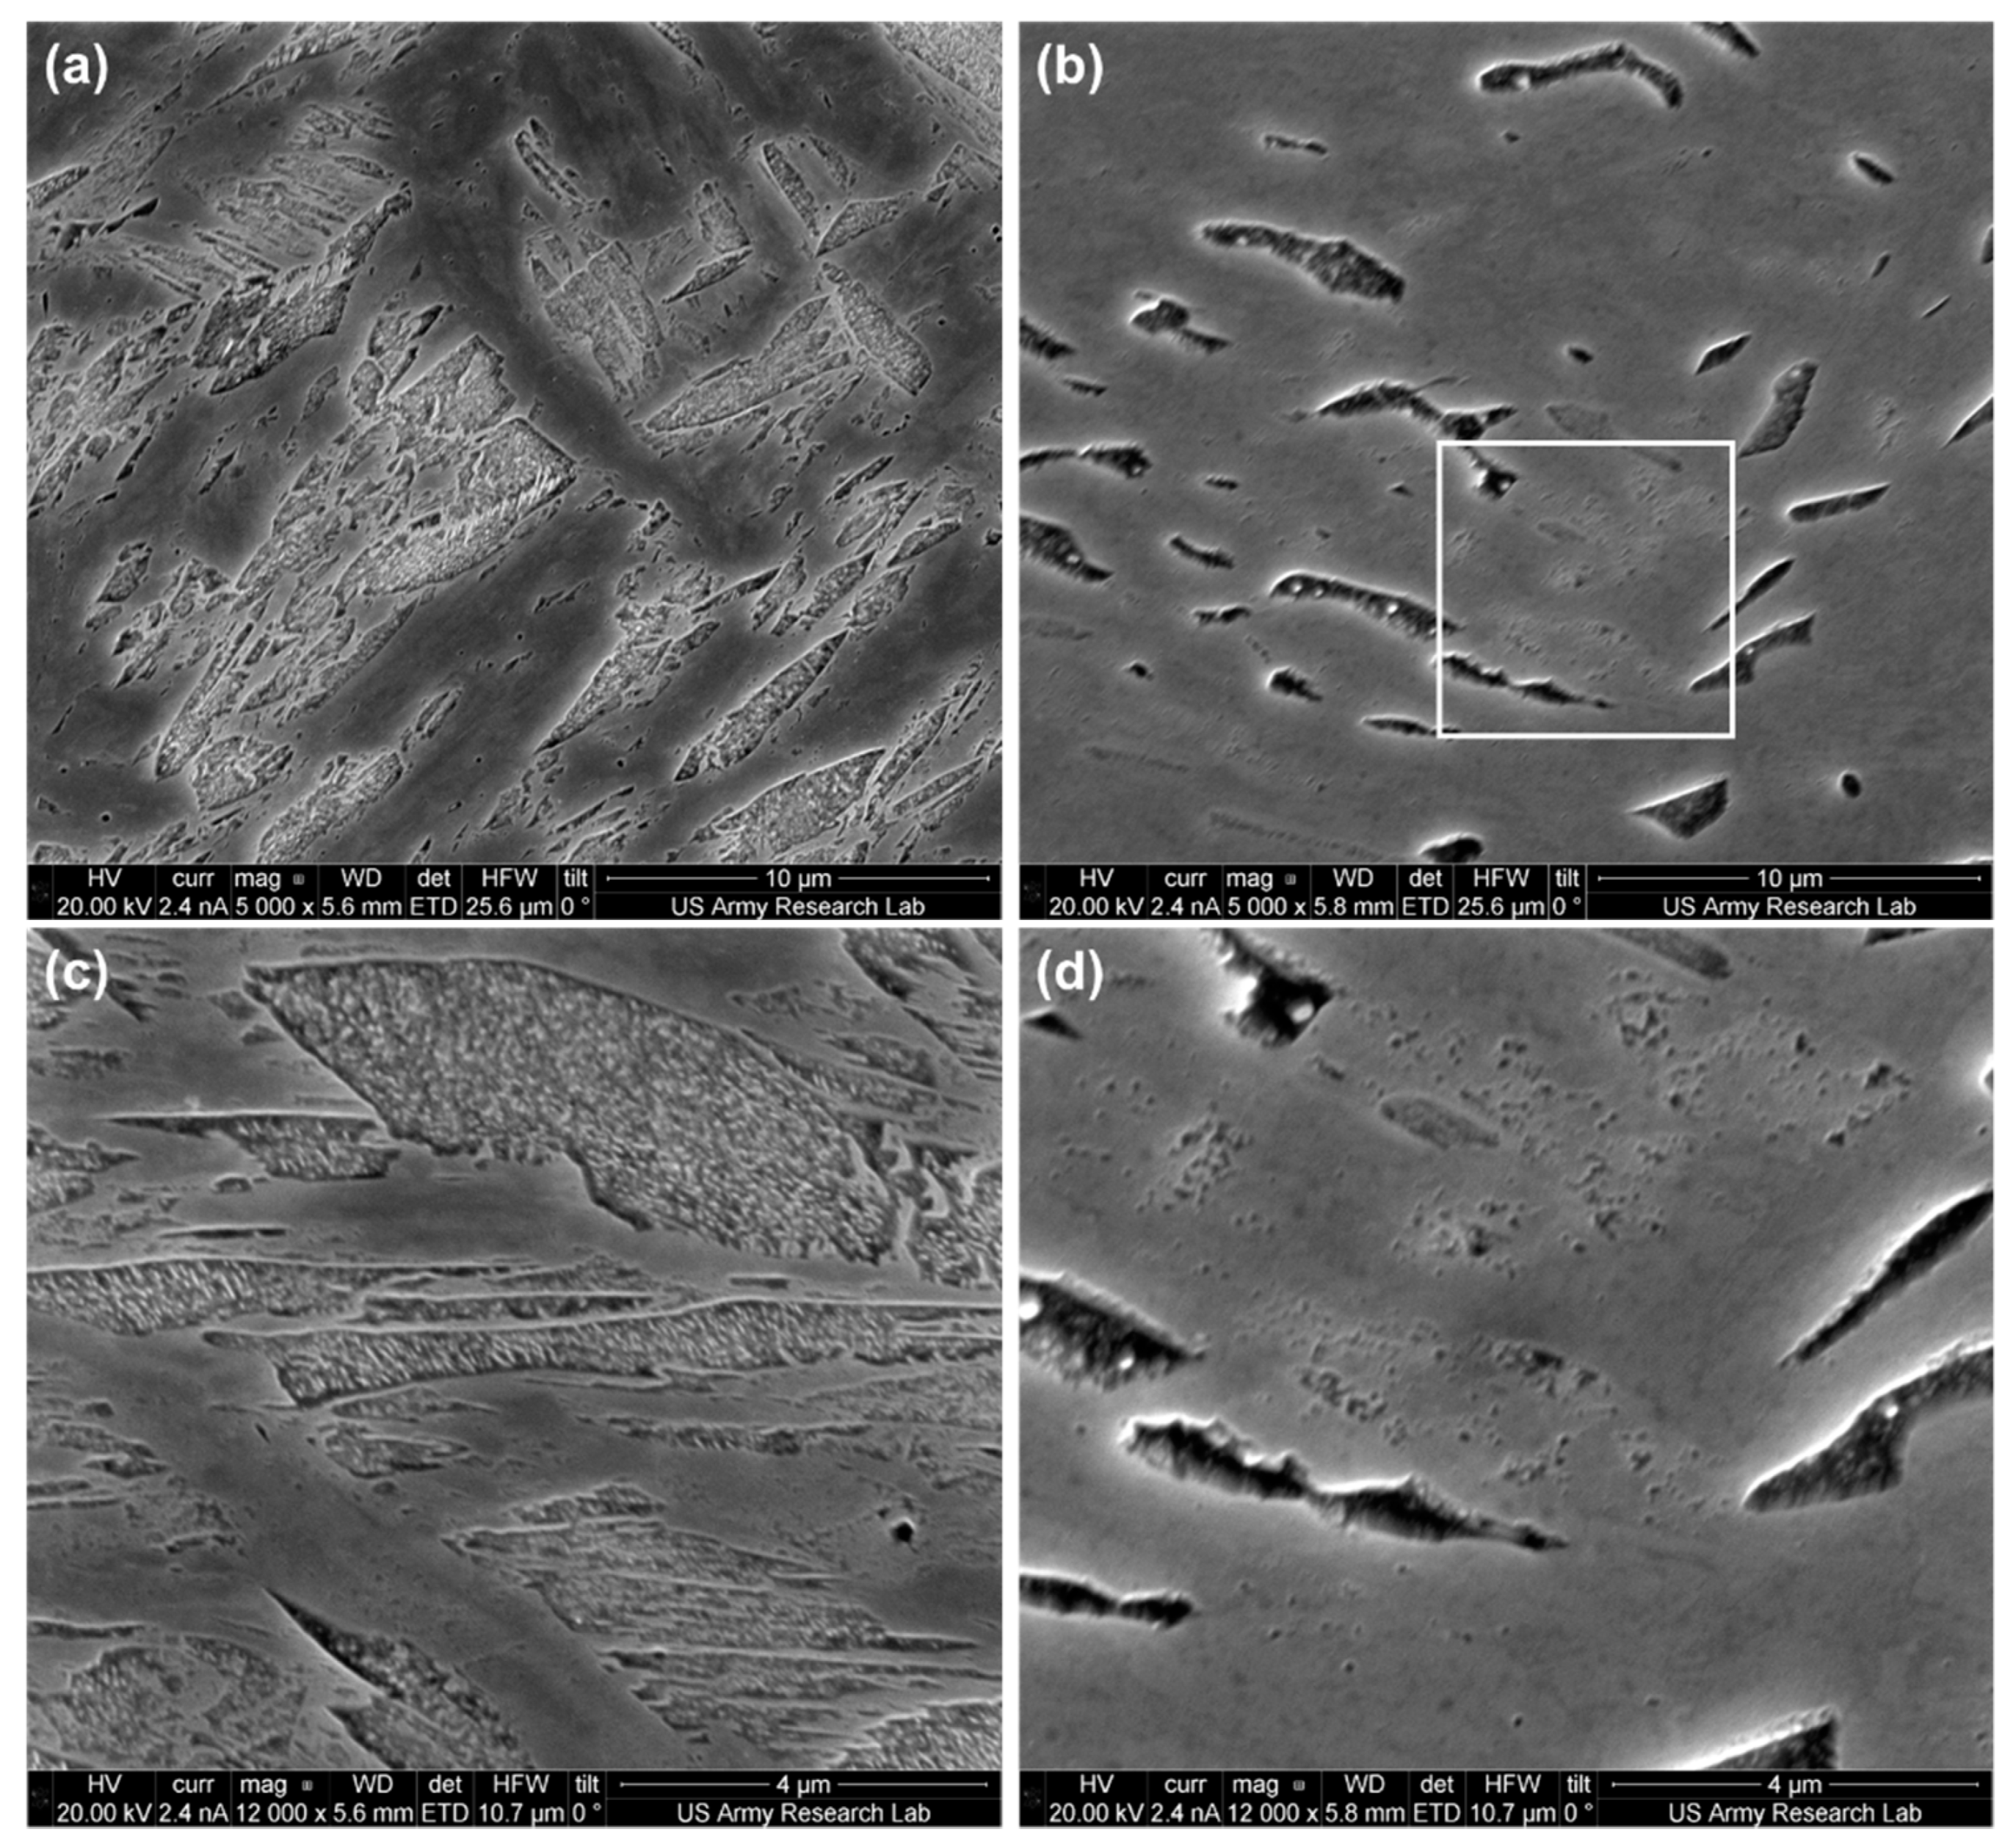
The structure of the alloy is shown Figure 7 after etching. The NHQH and NHQL etched micrographs appear to corroborate the effect of incomplete austenitization. In Figure 7a,c the NHQH structure clearly reveals a fine carbidic structure within the martensite laths as would be expected from a Stage I tempered martensitic steel. In Figure 7b,d however, the NHQL a very different structure is revealed. Firstly, there is a poor etching region which according to Figure 3a and Figure 5 is identified as a highly recovered ferrite. Secondly, it is noted at higher magnification (denoted by the white box) that there lacks a distinctive carbidic structure of tempered martensite. This effect is anticipated to be from a lack of supersaturated carbon during the austenitization quench-hardening process within those highly recovered grains. During austenitization of the low temperature austenitized samples (NH/LQL) a dual-phase structure of austenite and ferrite is created. Carbon, being a small interstitial element is able to quickly diffuse into the austenite and is locked in place during quenching. The retained ferrite is denuded of carbon and dislocations; upon tempering the ferrite does not precipitate any carbides. Coarse carbides are however noted within the martensite between the ferrite crystals and they are significantly coarser compared to the NHQH condition.
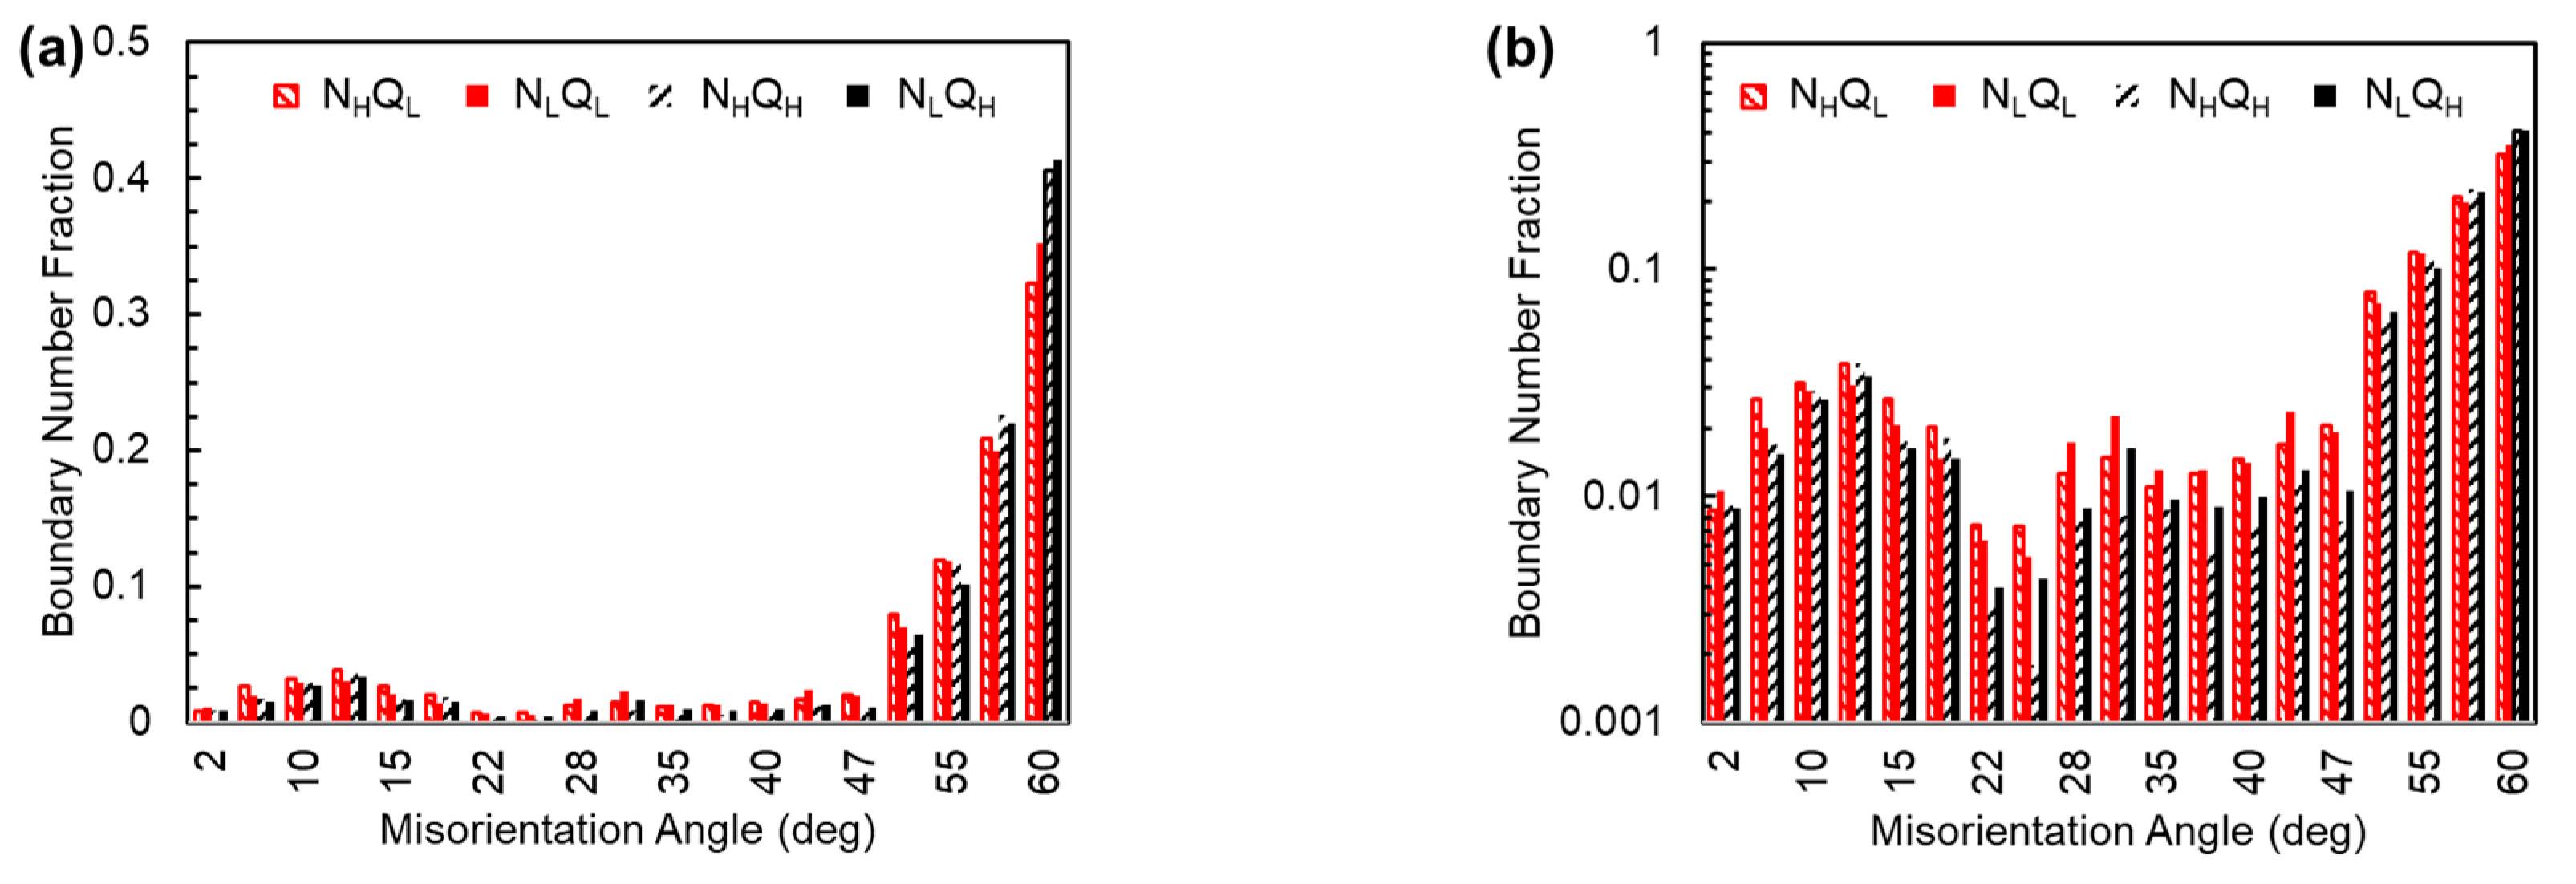
Many authors [3,4,5,19] have investigated the effect of martensite misorientation on mechanical properties, and it has been shown that misorientations >45° are representative of the internal misorientation of the martensite. This misorientation is considered of significant utility to improve mechanical properties. From EBSD-OIM mapping the misorientation number fractions are shown for the four different heat treatment conditions in Figure 8. It is noted that the QH alloys exhibit significantly more misorientations greater than 50° as compared to the QL condition. Figure 8b is included using a log10 scale to highlight the increased misorientation of 15–45° within the QL condition. As noted by previous authors [3,18] this would imply a higher density of prior austenite grain boundaries and was previously confirmed within this work (see Figure 6). A tabulated sum of misorientations is also provided in Table 3. The QH conditions have the highest sum of angles >46°. From previously reported works, this implies that the QH should have superior properties compared to the QL heat treated alloys.
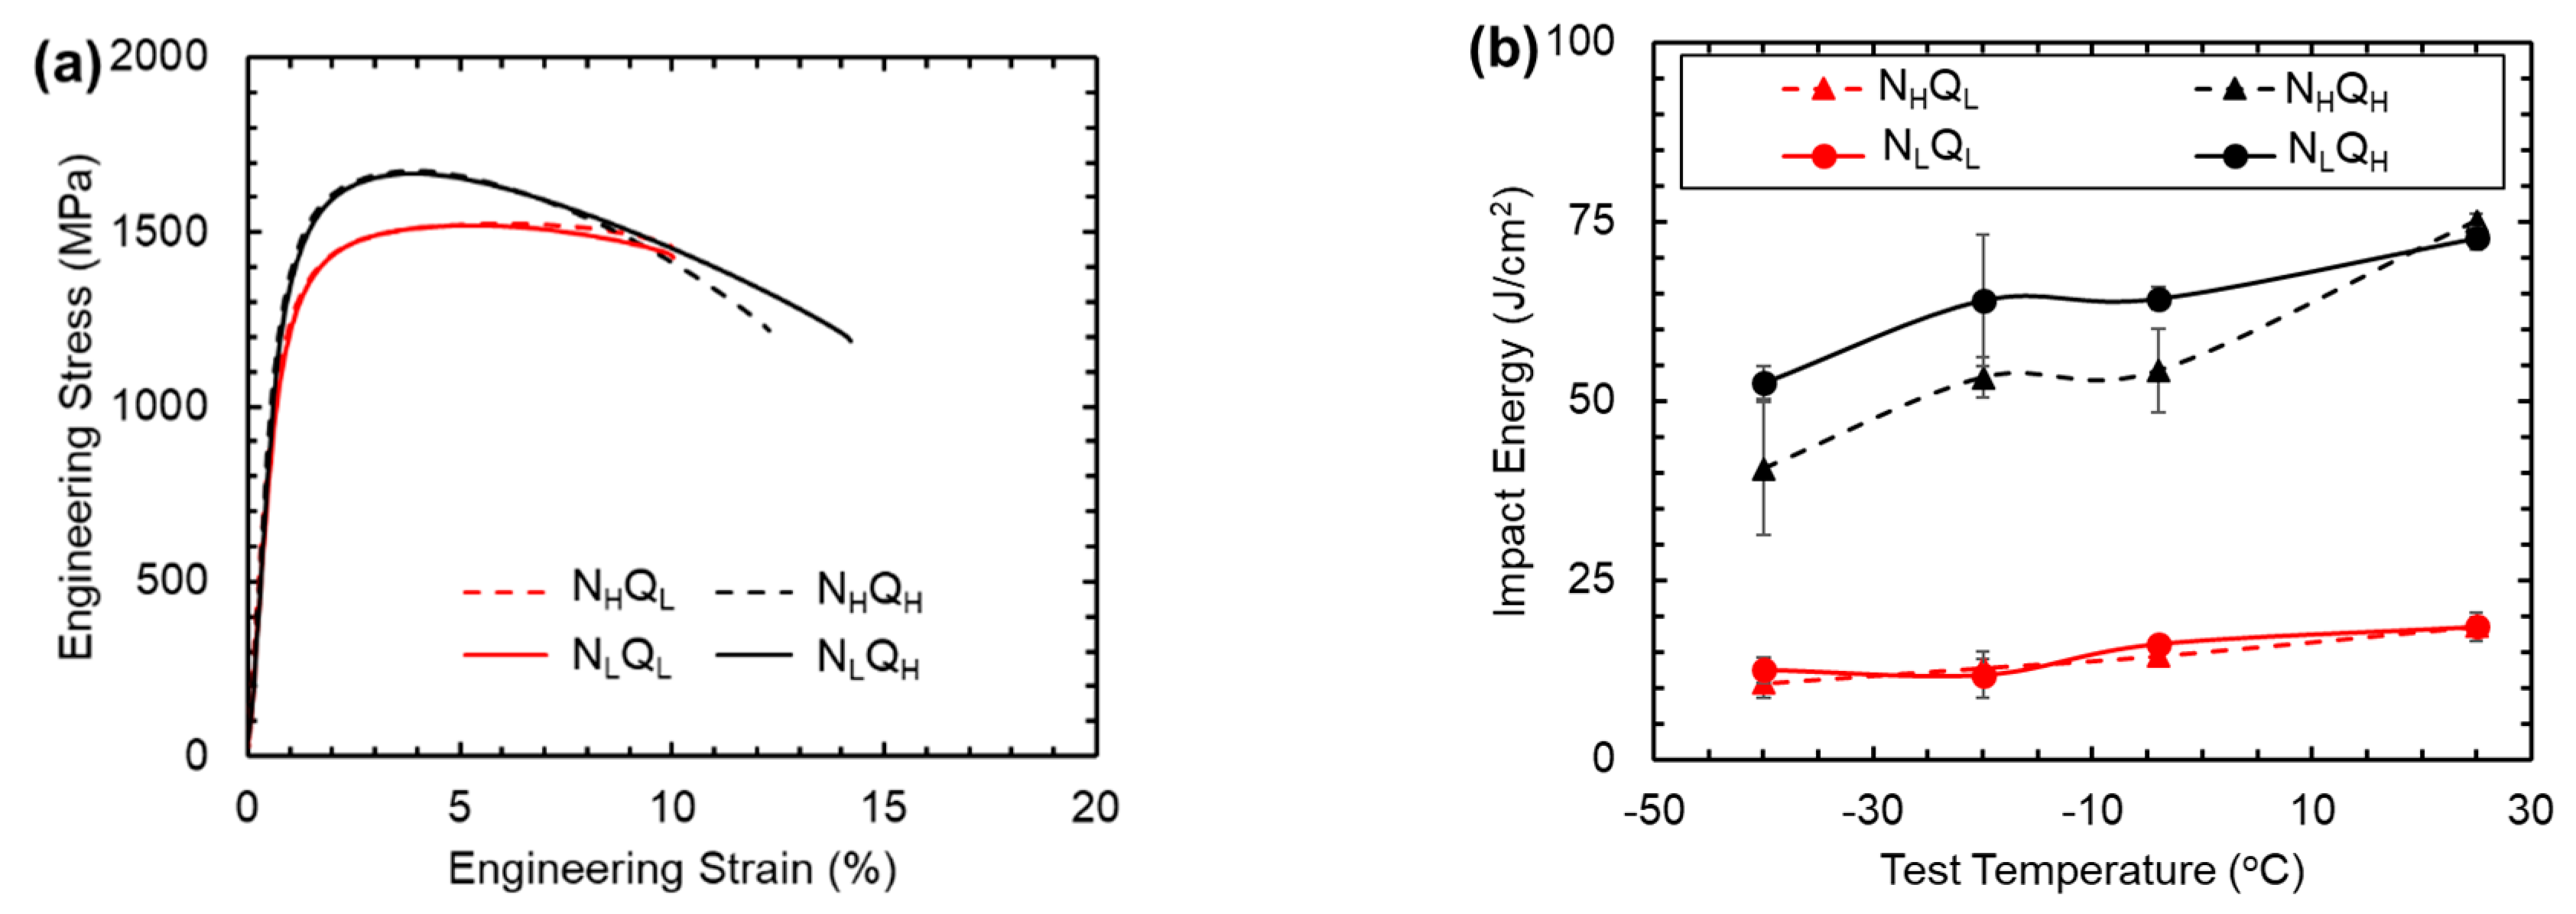
Representative stress–strain plots of the heat-treated alloys are shown in Figure 9a and a summary of the properties is provided in Table 4. Both the NHQL and NLQL samples exhibit lower strengths and ductility compared to the heat treatments that concluded with the QH processing step. It should be noted that Grydin et al. [9] demonstrated that when a steel is not fully austenitized the strength was significantly reduced as compared to the fully austenitized and quenched steel. They report a loss of ~30% of the strength according to Vickers hardness. The loss of yield strength between the QL and QH processed alloy ranged from 11 to 18%. It is interesting to note that the QL processed steels provide slightly higher uniform elongation compared to the QH condition (6.6% vs. 5.6%) however the amount of post-necking deformation is significantly increased in the QH processed steel. It can be inferred that the QH processing imparts significantly higher plasticity to the alloy leading to a greater reduction in area which is considered a true measure of plasticity compared to total engineering strain. The QH condition produces an additional 120% increase in elongation after necking while the QL processed steels only provide an increase of 50–40% beyond necking.
The CVN toughness as a function of test temperature is shown in Figure 9b. The NLQH condition exhibits the best toughness at all test temperatures, except ambient. This is potentially due to the finer prior austenite grain size as noted in Figure 3 and the higher sum of misorientation angles >46°; it should be noted however that the higher misorientation is within a standard deviation of the NHQH condition. The NHQH has a similar breaking energy at room temperature however the breaking energy is reduced as the temperature decreases. These results are consistent to what has been reported in literature for quenched and tempered martensite. The combination of grain refinement and increased internal misorientation are of the highest utility at a fixed strength. Unsurprisingly the two low austenitized (QL) samples behave statistically similar and are brittle at all temperatures, which is consistent with the quasi-static tensile results as well as the presence of recrystallized ferrite as discussed previously.
The higher normalization processing yields a reduction in properties. There is a slight loss of 1% strain in total ductility for both the QL and QH processed steels during quasi-static testing as well as a loss in toughness at the −40 °C CVN testing. The root cause of this can be related to the misorientation structure of the alloy. As shown in Table 3 the sum of misorientations >46° is always higher during the NL processing route regardless of the post quench hardening process. This would identify that the lower normalization processing is beneficial for these wrought alloys, it is possible that the high temperature rolling process (1260 °C) was effective as a normalization that was not utilized on previously investigated cast steels with a similar composition. From the prior austenite reconstruction results, the packet boundaries can be identified by their relationship to the austenite orientations and plotted alongside the parent austenite boundaries. Figure 8 demonstrates the packet/austenite boundary structures that result for the NHQH and NLQH samples.
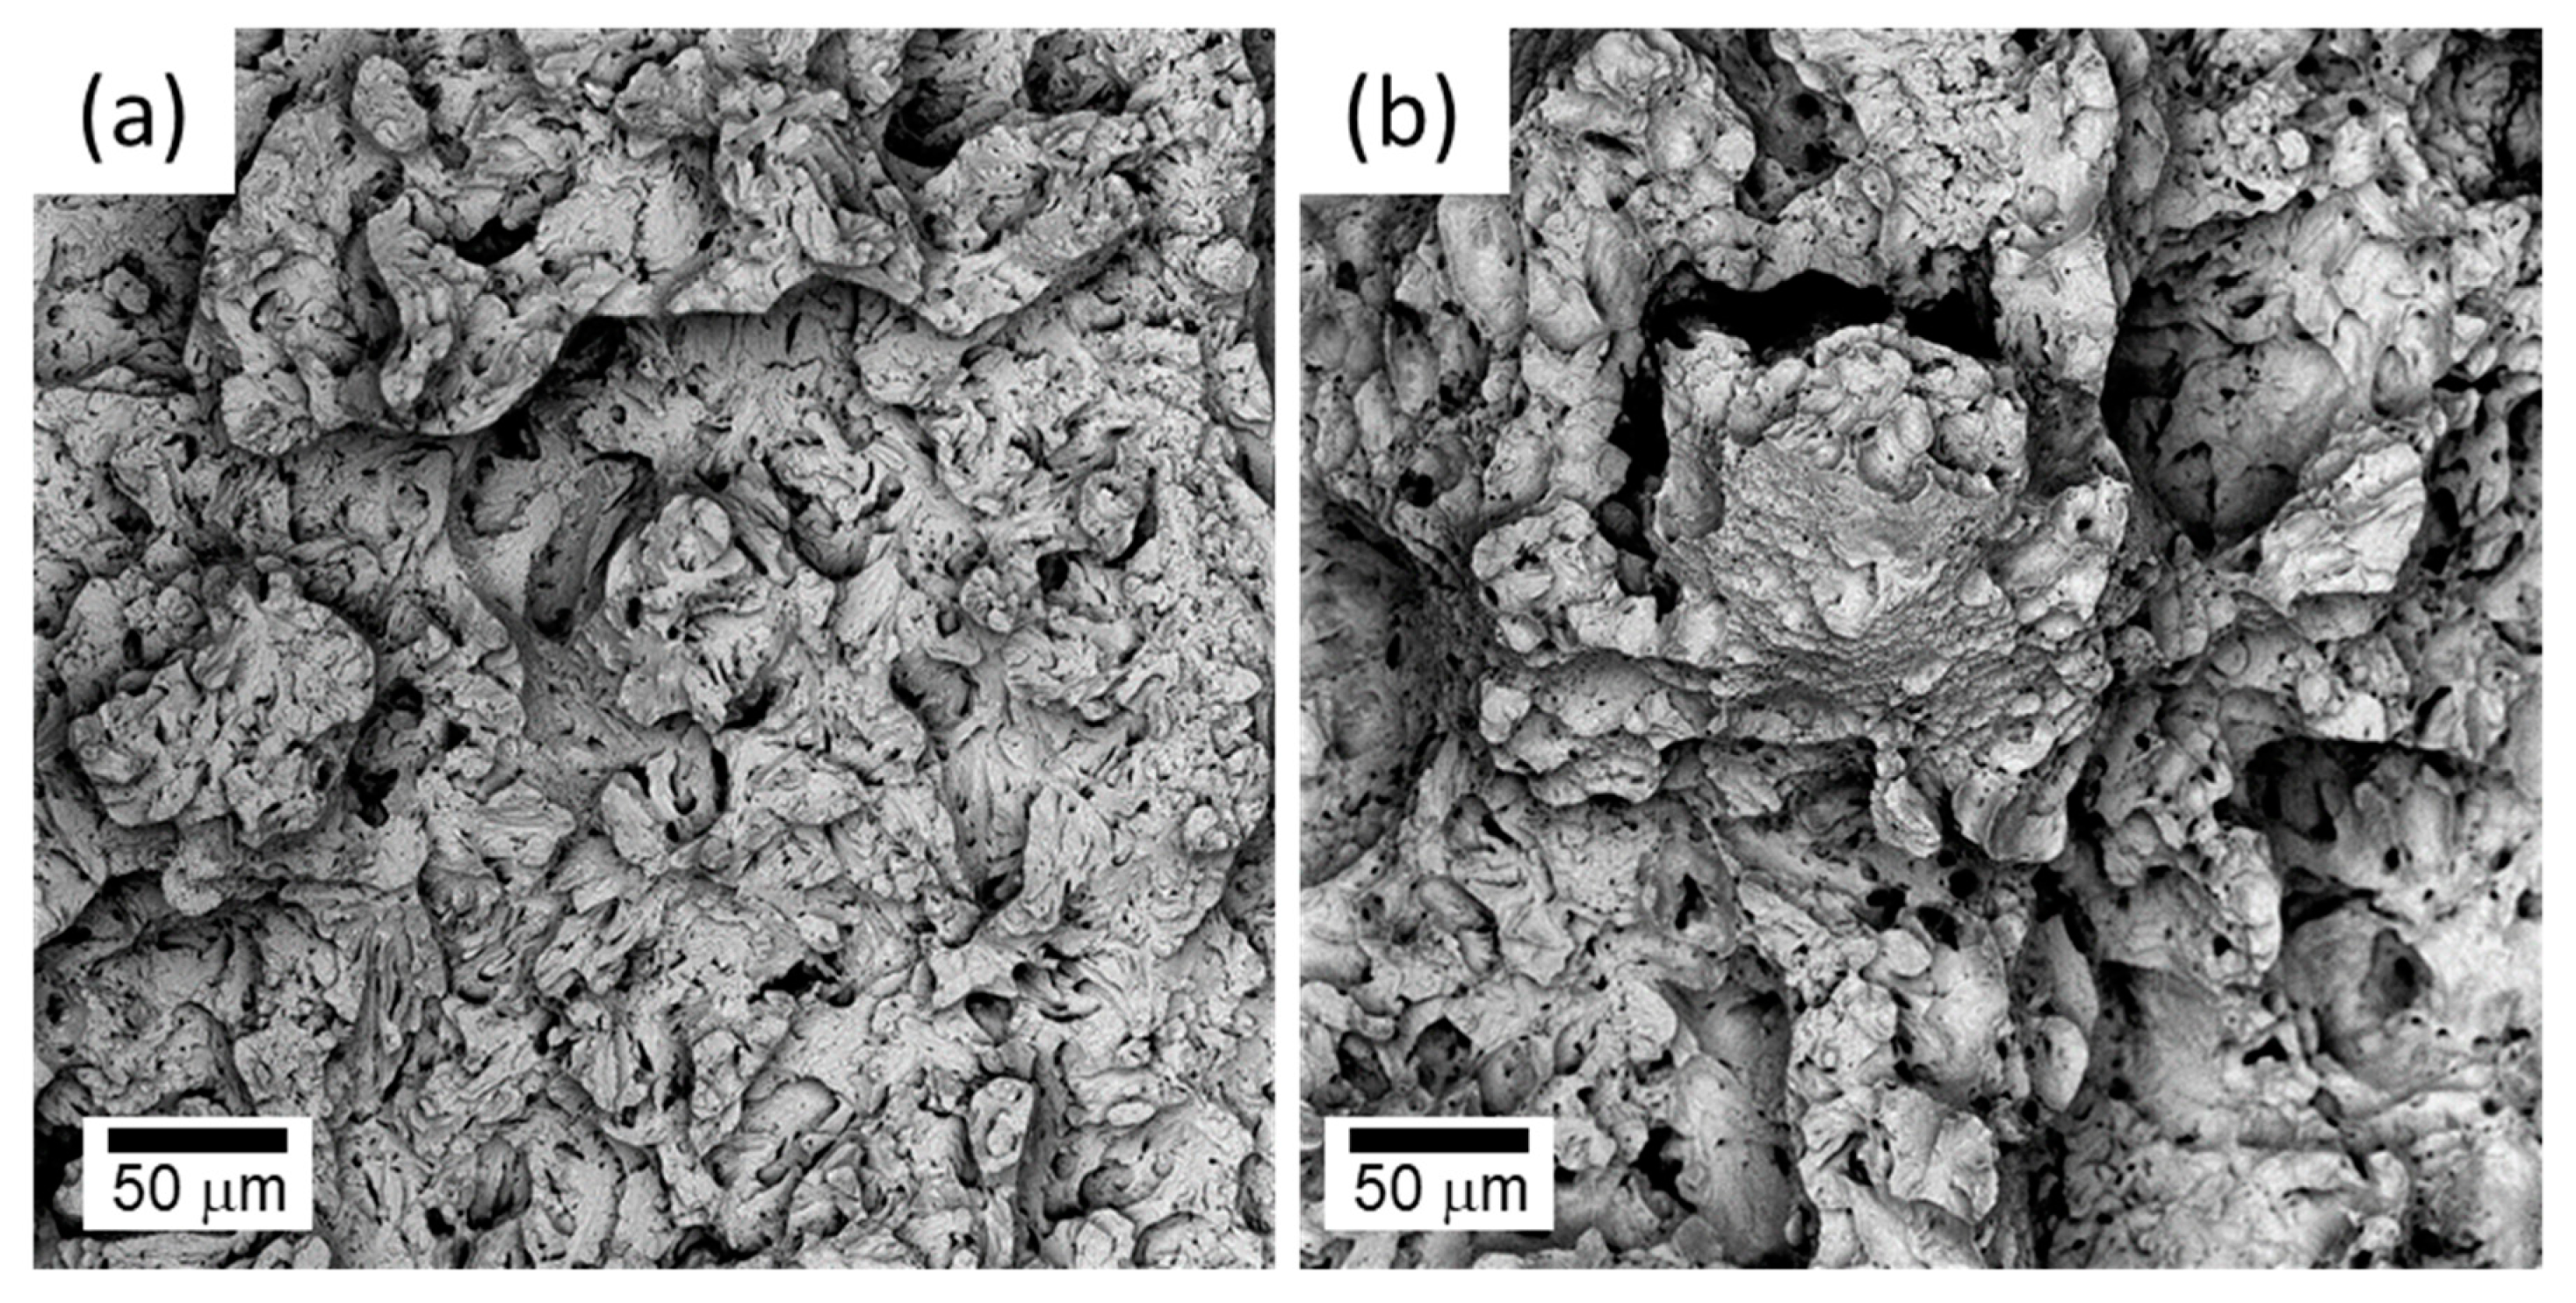
Representative fracture surfaces of the CVN bars tested at −40 °C are shown in Figure 10. It can be seen that the NLQL exhibits significant cleavage fracture, dimple rupture behavior was not observed on the fracture surface and is consistent with the impact energies recorded. The NLQH fracture is dominated by dimple rupture, as expected based on the measured impact energy of 52.6 ± 2.3 J.
4. Conclusions

The properties of a high toughness alloy were investigated as a function of heat treatment, and it was found that the austenitizing temperature had the most significant effect on toughness. The lower austenitizing temperature was not sufficient to fully transform the microstructure and lead to a mixed structure of highly recovered ferrite and fresh martensite that was later tempered. This lower austenitizing temperature, based on the bulk composition was inadequate, further validating the need to calculate phase fractions as a function of segregation as has been shown in previous works. When properly heat-treated this high strength high toughness steel obtains an ultimate strength in excess 1670 MPa, and a CVN toughness greater than 40 J at −40 °C.

Author Contributions

Conceptualization, D.M.F. and K.R.L.; formal analysis, D.J.M. and S.R.C.; writing—original draft preparation, D.M.F.; writing—review and editing, J.S.M.; funding acquisition, K.C.C. All authors have read and agreed to the published version of the manuscript.

Funding

This research received no external funding.

Institutional Review Board Statement

Not applicable

Informed Consent Statement

Not applicable

Data Availability Statement

Not applicable.

Acknowledgments

The authors would like to thank Micah Gallagher, Steven Marsh, and Mike Aniska for their assistance in this project with preparing samples. The authors would also like to acknowledge Clara Mock and her assistance in preparing samples for microstructural analysis.

Conflicts of Interest

The authors declare no conflict of interest.

References

  1. You, Y.; Shang, C.J.; Nie, W.J.; Subramanian, S.V. Investigation on the microstructure and toughness of coarse grained heat affected zone in X-100 multi-phase pipeline steel with high Nb content. Mater. Sci. Eng. A 2012, 558, 692–701. [Google Scholar] [CrossRef]
  2. Lan, L.Y.; Qiu, C.L.; Zhao, D.W.; Guo, X.H.; Du, L.X. Microstructural characteristics and toughness of the simulated coarse grained heat affected zone of high strength low carbon bainitic steel. Mater. Sci. Eng. A 2011, 529, 192–200. [Google Scholar] [CrossRef]
  3. Field, D.M.; Montgomery, J.S.; Limmer, K.R.; Cho, K.C. Heat Treatment Design to Modify the Martensite Misorientation and Obtain Superior Strength–Toughness Combinations. Met. Trans. A 2020, 51, 1038–1043. [Google Scholar] [CrossRef]
  4. Wu, B.B.; Wang, X.L.; Wang, Z.Q.; Zhao, J.X.; Jin, Y.H.; Wang, C.S.; Shang, C.J.; Misra, R.D.K. New insights from crystallography into the effect of refining prior austenite grain size on transformation phenomenon and consequent mechanical properties of ultra-high strength low alloy steel. Mater. Sci. Eng. A 2019, 745, 126–136. [Google Scholar] [CrossRef]
  5. Takayama, N.; Miyamoto, G.; Furuhara, T. Effects of transformation temperature on variant pairing of bainitic ferrite in low carbon steel. Acta Mat. 2012, 60, 2387–2396. [Google Scholar] [CrossRef]
  6. Chen, J.; Li, C.; Ren, J.; Tu, X.; Chen, L. Strength and toughness of Fe-1.2Mn-0.3Cr-1.4Ni-0.4Mo-C tempered steel plate in three cooling processes. Mater. Sci. Eng. A 2019, 754, 178–189. [Google Scholar] [CrossRef]
  7. Holloman, J.H.; Jaffe, L.D. The Metallurgical Design of Steels for Optimum Mechanical Properties; WAL 320/28 (ADa951095); Watertown Arsenal Laboratories: Watertown, MA, USA, 1945. [Google Scholar]
  8. Garcia, J.H.; Navarro, M.J.S. Effect of Prior Austenite Grain Size Refinement by Thermal Cycling on the Microstructural Features of As-Quenched Lath Martensite. Met. Trans. A 2016, 47, 5288–5301. [Google Scholar]
  9. Grydin, O.; Andreiev, A.; Holzweißig, M.J.; Rüsing, C.J.; Duschik, K.; Frolov, Y.; Schaper, M. Short austenitization treatment with subsequent press hardening: Correlation between process parameters, microstructure and mechanical properties. Mater. Sci. Eng. A 2019, 749, 176–195. [Google Scholar] [CrossRef]
  10. Ranger, C.; Tari, V.; Farjami, S.; Merwin, M.J.; Germain, L.; Rollett, A. Austenite Reconstruction Elucidates Prior Grain Size Dependence of Toughness in a Low Alloy Steel. Met. Trans. A 2018, 49, 4521–4535. [Google Scholar] [CrossRef]
  11. Cluff, S.; Homer, E.; Nelson, T.; Song, R.; Fullwood, D. Crystallographic Reconstruction of Parent Austenite Twin Boundaries in a Lath Martensitic Steel. IOP Conf. Ser. Mater. Sci. Eng. 2018, 375, 012012. [Google Scholar] [CrossRef] [Green Version]
  12. Webb, T.O.; van Aken, D.C.; Lekakh, S.N. Evaluating Chemical Homogeneity in the Performance of Eglin Steel. AFS Trans. 2014, 122, 317–333. [Google Scholar]
  13. Poirer, D.R.; Flemings, M.C. Investigation of Solidification of High.-Strength Steel Castings; Watertown Arsenal Laboratories: Watertown, MA, USA, 1967. [Google Scholar]
  14. Athavale, V.A.; Yaniak, T.; Xu, M.; van Aken, D.C. Mechanical Properties and Impact Wear Resistance of 540 Brinell Hardness Mn-Si-Mo-V steel. In Proceedings of the AFS Proceedings of the 123rd Metal Casting Congress, Milwaukee, WI, USA, 25–27 April 2019; pp. 17–58. [Google Scholar]
  15. De Cooman, B.C.; Speer, J.G. Austenite Decomposition in Fe-C-X Alloy Systems. In Fundamentals of Steel Product Physical Metallurgy, 1st ed.; ASM International: Materials Park, OH, USA, 2011; p. 173. [Google Scholar]
  16. ASTM STandard E8-16a, Standard Test. Methods for Notched Bar Impact Testing of Metallic Materials; ASTM International: West Conshohocken, PA, USA, 2016. [Google Scholar] [CrossRef]
  17. ASTM STandard E23-18, Standard Test Methods for Tension Testing Metallic Materials; ASTM International: West Conshohocken, PA, USA, 2018. [CrossRef]
  18. Sinha, V.; Gonzales, M.; Abrahams, R.A.; Song, B.S.; Payton, E.J. Correlative microscopy for quantification of prior austenite grain size in AF9628 steel. Mater. Charact. 2020, 159. [Google Scholar] [CrossRef]
  19. Wu, B.B.; Qang, Z.Q.; Wang, X.L.; Xu, W.S.; Shang, C.J.; Misra, R.D.K. Toughening of martensite matrix in high strength low alloy steel: Regulation of variant pairs. Mater. Sci. Eng. A 2019, 759, 430–436. [Google Scholar] [CrossRef]
Figure 1. Equilibrium phase stability of the (a) bulk and (b) solute rich composition.
Metals 11 00723 g001
Figure 2. Schematic diagram of the heat treatments applied to the alloy investigated.
Metals 11 00723 g002
Figure 3. Representative electron Backscattered diffraction orientation image mapping (EBSD-OIM) of the (a) NHQL, (b) NLQL, (c) NHQH, (d) NLQH.
Metals 11 00723 g003
Figure 4. Reconstruction results depicting austenite grains and their orientations for (a) NHQL, (b) NLQL, (c) NHQH, (d) NLQH samples. The austenite regions in (a) indicated by yellow arrows have KS variants in common with the surrounding austenite region, to within 5° misorientation.
Metals 11 00723 g004
Figure 5. Kernel Average Misorientation of the NHQL showing regions of recrystallized α-ferrite shown in blue.
Metals 11 00723 g005
Figure 6. Misorientation boundary angles of 15–45° shown for the (a) NLQL and (b) NLQH conditions.
Metals 11 00723 g006
Figure 7. Secondary Electron images of the (a,c) NHQH and (b,d) NHQL at low and high magnification, respectively, carbides are highlighted with arrows.
Metals 11 00723 g007
Figure 8. Distribution of misorientation angles of the quenched and tempered alloy using (a) linear and (b) log scale.
Metals 11 00723 g008
Figure 9. The effect of heat treatment of the alloy on (a) quasi-static tensile behavior, (b) CVN impact properties as a function of temperature.
Metals 11 00723 g009
Figure 10. Charpy V-Notch fracture surfaces of the processed alloy tested at −40 °C (a) NLQL, (b) NLQH.
Metals 11 00723 g010
Table 1. Composition (in wt. %) of the bulk, solute rich (Last 15%) and solute lean (First 85%) regions as modeled.
SegmentComposition in wt. %Ms (°C)
CMnSiNiCrMoV
Bulk0.260.601.001.002.750.920.10340
Solute Lean0.260.520.910.942.670.790.08345
Solute Rich0.251.031.531.343.221.670.23315
Table 2. Heat treatment designation, temperature and times.
DesignationNameTemperatureTime (hrs)Cooling
NLNormalization945 °C2Air
NH1050 °C
QLQuench Hardening/
austenitization
825 °C1Water
QH915 °C
T0Sub-critical temper645 °C3.75Air
T1Stage I Temper204 °C4Air
Table 3. Sum of misorientations of the 15–45° angle and the 46–60° angles.
SampleMisorientation (Number Fraction)
15–45°46–60°
NHQL0.144 ± 0.0020.750 ± 0.005
NLQL0.150 ± 0.0070.759 ± 0.011
NHQH0.106 ± 0.0010.809 ± 0.006
NLQH0.091 ± 0.0020.816 ± 0.001
Table 4. Mechanical properties of the alloy after the various heat treatments.
SampleYS
(MPa)
UTS
(MPa)
euniform
%
etotal
%
CVN (J)
−40 °C25 °C
NHQL1150 ± 41520 ± 86.8 ± 0.19.5 ± 0.710.6 ± 1.918.5 ± 1.4
NLQL1210 ± 181510 ± 96.5 ± 0.110.2 ± 0.212.5 ± 1.818.5 ± 1.9
NHQH1385 ± 351670 ± 35.0 ± 0.212.3 ± 0.140.6 ± 9.475.1 ± 1.1
NLQH1370 ± 421680 ± 136.2 ± 0.313.8 ± 0.652.6 ± 2.372.7 ± 1.5
Publisher’s Note: MDPI stays neutral with regard to jurisdictional claims in published maps and institutional affiliations.