Abstract
The size evolution of niobium carbonitrides Nb(C,N) and the evolution of the composition of an austenitic matrix in 316Nb stainless steel were simulated using DICTRA software. For the first time, the complete nine-element composition of steel was taken into account during isothermal and even anisothermal heat treatments. A reduced model was then proposed to optimize the calculation time for complex heat treatments. The change in the mean Nb content in austenite due to Nb(C,N) evolution during different heat treatments was studied. It qualitatively agrees with experimental data as obtained by electron probe microanalysis. Furthermore, the model was successfully applied to explain the effect of heat treatments on the recrystallization behavior of 316Nb steel during hot torsion tests. Moreover, the effect of the thermodynamic database and the number of alloying elements chosen was discussed. We showed that taking into account seven or even nine elements greatly improves the accuracy compared to usual simplified compositions. The proposed method can be useful in designing heat treatments promoting or conversely hindering recrystallization for a wide variety of Nb-bearing steels.
1. Introduction
Thermokinetic modelling is a powerful tool used to understand the mechanisms of different phenomena occurring in metallic materials during heat treatments and to predict, optimize, and control their stability and, thus, their properties during service life. However, the complexity of chemical compositions and elaboration processes of real alloys often renders such simulations difficult or even impossible. Moreover, for reliable modelling of multi-component diffusion and associated phase transformations, the influence of local chemical composition on atomic mobilities has to be taken into account [1,2]. This can theoretically be performed by using DICTRA software, where in principle, any heat cycle can be modeled [3,4]. However, simulations using DICTRA, although not limited to a specific number of alloying elements taken into account, often require simplification of the chemical composition to obtain convergence [5,6,7,8] and are rarely carried out for anisothermal heat treatments [9,10], especially, for the case of evolution of ordered or other particular phases such as carbides and/or carbonitrides. These phases, however, if intentionally added to the alloy microstructure, often play a particular, well-defined role and have an important effect on material properties.
For example, in the case of recrystallization, one of the key phenomena during high-temperature processing of metallic materials, the chemical composition of the alloys is carefully chosen to obtain the required and well-controlled material response. The present study focuses on a niobium-stabilized austenitic stainless steel of the 316 family (Fe–Cr–Ni–Mo basis, further denoted as 316Nb). This steel contains high Nb amounts (>0.5 wt.%) and moderate C and N amounts (maximum 0.1 and 0.06 wt.%, respectively). Niobium is well known for delaying or hindering recrystallization via different effects: (i) it can form fine precipitates leading to pinning of grain boundaries [11,12,13], (ii) it can dramatically slow down grain boundary migration via the solute drag effect [11,12,13,14], and (iii) it may enhance the recovery process by changing the stacking fault energy in austenite [15]. These different effects were indirectly revealed by Hermant et al. [16], who showed that heat treatments prior to high-temperature deformation of 316Nb steel were critical for subsequent recrystallization. More precisely, in contrast to isothermal holding at 1373 K (1100 °C) during 1 h, isothermal treatment at 1473 K (1200 °C) for 1 h hindered further post-dynamic and static recrystallization. This effect disappeared when the treatment at 1473 K was immediately followed by slow cooling down to 1373 K and holding for 1 h at that temperature. The authors suggested that such an effect of heat treatment on the recrystallization behavior of 316Nb steel was associated with some dissolution of primary Nb(C,N) carbonitrides during holding at elevated temperatures. Moreover, some Nb segregation at austenite grain boundaries was observed using energy-dispersive X-ray spectroscopy (EDS) in the transmission electron microscope (TEM), thus indicating that solute drag effect due to Nb atoms might be the main retarding mechanism of recrystallization. However, no quantitative study, either of the Nb content in austenite after different heat treatments or of the dissolution of Nb(C,N) and their effect on further recrystallisation, was carried out.
As Nb is usually added in small amounts in steels (typically, less than 0.2 wt.%), quantitative measurements of Nb content in austenite are very tedious, especially for low Nb-bearing steels [11,17]. Owing to the rather large amount of Nb in 316Nb steel considered in the present study (>0.5 wt.%), measurements of Nb content in austenite using electron microprobe microanalysis (EPMA) could be carried out in a reliable manner. However, the same analysis for C and N, which is even more challenging, was not attempted. Therefore, a robust and reliable thermokinetic modelling of Nb(C,N) evolution in austenite would almost be a unique tool to obtain information about carbonitride fraction as well as about austenite composition as a function of temperature.
Thermokinetic simulations of Nb(C,N) growth or dissolution have never been reported for 316Nb steel, whereas some data are available for other Nb-bearing grades [18,19]. Moreover, the chemical composition of steel used for such simulations often had to be strongly simplified for convergence reasons. Tao et al. [18] used Thermo-Calc (TCFE6 database) and DICTRA softwares to simulate the growth of NbC in EQ70 steel but without giving the exact composition used for the numerical simulation. Erneman et al. [19] modelled the evolution of primary and secondary Nb(C,N) using DICTRA for a simplified 304Nb composition. To perform a simulation for full composition, a home-made thermokinetic model was applied accounting for Nb diffusion and assuming local equilibrium at the austenite-carbonitride interface and instantaneous homogenization of C and N in the austenitic matrix. This simulation showed that the radius of primary Nb(C,N) increased during processing at high temperatures (not higher than 1373 K).
The evolution of Nb(C,N) in austenite is a diffusion-controlled moving boundary problem (the so-called Stefan problem). The solution of such a problem has been widely investigated both theoretically and numerically [20]: it is known to be increasingly difficult to solve when the number of chemical species taken into account increases due to the difficulty in finding the local equilibrium at the moving boundary [2]. This is the reason for which, until very recently, in simulations for different steel compositions using DICTRA often no more than four elements (often Fe, Cr, Ni, and C) were used to replace the substitutional elements not taken into account by Fe and to replace interstitials by C [7] or using metallurgical equivalents such as Cr and Ni equivalents instead of the full composition [21].
The objectives of the present work were threefold: (i) quantitatively estimating the impact of the considered chemical composition and calculation conditions on the predicted results, (ii) calibrating a simplified model based on these more realistic themokinetic calculations, and (iii) comparing model predictions with experimental measurements of Nb content in austenite after various heat treatments. To do so, four-element (Fe–Nb–C–N), seven-element (Fe–Cr–Ni–Mo–Nb–C–N), and nine-element (full composition, Fe–Cr–Ni–Mo–Mn–Si–Nb–C–N) simulations were carried out using Thermo-Calc and DICTRA and the high-temperature evolution of primary Nb(C,N), and austenite was addressed. Isothermal and anisothermal simulations were carried out for transformations occurring in the temperature range between 1373 and 1473 K used for the experimental study in Reference [16]. The role of the thermodynamic database was also studied through the comparison of results obtained using the TCFE7 and TCFE9 databases. While being feasible and bringing more accurate results, calculations involving seven or nine chemical species are time-consuming and involve convergence issues. In order to speed up calculations and to enable simulation of heat treatments on various steel compositions, a reduced-order model of evolutions with average Nb, C, and N contents in austenite was also set up and calibrated on full-scale DICTRA simulations. The model was then applied to simulate various heat treatments used in experimental hot torsion tests coupled to EPMA analyses. The calculated change in Nb content in austenite during the heat treatments was compared to the experimental data obtained by EPMA. Such comparisons are very rare in the literature. Moreover, it was successfully used to explain the recrystallization behavior of the studied 316Nb steel after different treatments.
2. 316Nb Stainless Steel Used
The chemical composition of the studied 316Nb steel is given in Table 1. Even if only typical values are reporterd in Table 1, the actual chemical composition of the material used in the experiments was taken into account in all calculations. The samples for the experimental study were taken at mid-depth of a forged billet. The billet came from a remelted ingot forged to a section greater than 500 mm in several steps and air quenched. The final temperature experienced by the forging was around 1323–1373 K before the air quench. After processing, the microstructure consisted of austenitic grains, about 1 vol.% of residual ferrite and two populations of Nb(C,N) carbonitrides (Figure 1). Coarse primary Nb(C,N) was formed at the end of the solidification process and revealed as not well-resolved dots in Figure 1; fine secondary Nb(C,N) can readily precipitate and dissolve during subsequent heat treatments (not resolved in Figure 1). Here, we only considered the heat treatments carried out at temperatures above 1373 K for which grains are initially fully recrystallized and secondary Nb(C,N) remained completely dissolved [16], and therefore, only the evolution of primary Nb(C,N) was taken into account. In the initial as-processed state, primary Nb(C,N) were nonuniformly spaced and their size ranged from 500 nm to 5 µm. The grain size of austenite was measured to be between 180 and 250 µm.

Table 1.
Nominal composition (wt.%) of the 316Nb stainless steel used.
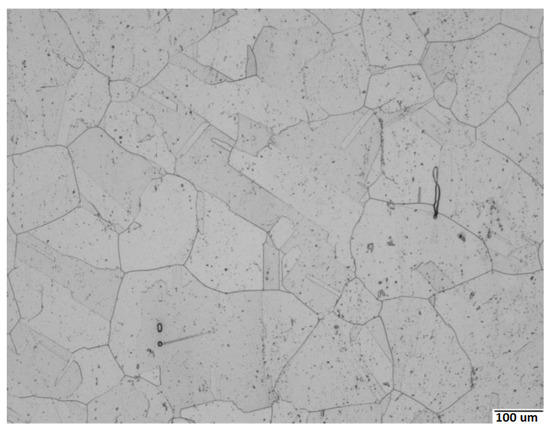
Figure 1.
Microstructure of the studied 316Nb steel observed using optical microscopy: austenite grains, residual ferrite (elongated particles), and primary Nb(C,N) carbonitrides (dots, not well resolved) can be seen (electrolytical etching using 60 mL of HNO and 40 mL of water (1 V, 120 s)).
3. Modelling Approach
Accurate thermokinetic modelling requires reliable thermodynamic and kinetic description of the system to be investigated. The former gives the equilibrium state of the system for the given conditions, while the latter allows an estimation of the time required for the system to go from its current state to the equilibrium one.
3.1. Thermodynamic Modelling
For thermodynamic modelling of Nb(C,N) evolution in austenite during high-temper-ature exposure of 316Nb steel, two different thermodynamic databases for Fe-based alloys, TCFE7 [22] and the more recent TCFE9 [23], were used. In the present work, for several heat treatment conditions, it was possible to carry out thermokinetic modelling using the complete nine-element chemical composition of 316Nb steel (Table 1). Nevertheless, for some particular cases, the composition still had to be simplified to ensure numerical convergence, as detailed below. For the simulations carried out using the TCFE9 database, four-element (Fe–Nb–C–N), seven-element (Fe–Cr–Ni–Mo–Nb–C–N), and nine-element (full composition, Fe–Cr–Ni–Mo–Mn–Si–Nb–C–N) systems were considered, where the elements not taken into account were substituted with Fe. For the comparison, a seven-element system was used as well for modelling using the TCFE7 database.
The equilibrium composition and phase fractions for Nb(C,N) and austenite at 1373 and 1473 K, the minimum and maximum temperatures considered in the present work, as calculated using both the TCFE7 and TCFE9 databases for the different number of elements are respectively given in Table 2 and Table 3. At equilibrium, the Nb(C,N) carbonitride mainly contains Nb, C and N but a small amount of Cr and Mo is present as well (Table 2). The amounts of Fe, Ni, Mn and Si in Nb(C,N) are negligible (<0.01 wt.% for Fe, <0.001 wt.% for Ni and Mn, and <10 wt.% for Si). When temperature increases from 1373 to 1473 K, Nb(C,N) loses Cr, Nb and C and gains Mo and N. Moreover, the Nb(C,N) volume fraction decreases with increasing temperature. The Nb and C contents in austenite significantly increase with temperature, mainly because of decreases in the Nb(C,N) volume fraction. The N content in austenite increases a lot due to the volume fraction change and despite the slight N enrichment of Nb(C,N).
Table 2.
Equilibrium contents (wt.%) of the main elements in Nb(C,N) as well as Nb(C,N) volume fraction and atomic ratios at 1373 and 1473 K obtained using the TCFE7 and TCFE9 databases for different numbers of elements considered in the composition of 316Nb steel.
Table 3.
Equilibrium contents of Nb (wt.%), C and N (wt. ppm) in austenite as well as austenite volume fraction at 1373 and 1473 K obtained using the TCFE7 and TCFE9 databases for different numbers of elements considered in the composition of 316Nb steel. (The contents for other elements were close to the actual steel composition.)
As for the seven- and nine-element calculations, the composition of the steel taken into account has little impact on the predicted composition of Nb(C,N) but modifies its volume fraction. Therefore, the Nb, C and N contents in austenite can vary significantly with temperature change. Using nine elements instead of seven or using TCFE9 instead of TCFE7 increases the volume fraction of Nb(C,N) and therefore decreases the Nb, C and N contents in austenite. For the four-element simulation, the volume fraction of Nb(C,N) is remarkably higher and their C and N contents evolve significantly. This leads to a rather low amount of Nb in austenite. Therefore, one can conclude that the number of elements as well as the database considered for thermodynamic modelling (and thus for thermokinetic modelling) have direct effects on the predicted equilibrium state. This is especially the case of Nb in austenite for which a small change in the Nb(C,N) volume fraction has a great impact.
3.2. Thermokinetic Modelling
The DICTRA software (2017, Thermo-Calc Software AB, Solna, Sweden) was used for thermokinetic modelling. A spherical symmetry was considered to represent one Nb(C,N) precipitate embedded in an austenitic matrix. The real shape, size and spatial distributions of Nb(C,N) were therefore not accounted for. Moreover, the Gibbs–Thomson effect was neglected. Due to its small volume fraction, the residual -ferrite was also neglected. The local equilibrium at the interface between precipitate and matrix was assumed. The initial radius of Nb(C,N) () was taken equal to 1 µm, which is a size representative of the primary precipitates in the steel. The simulation cell size was then determined in order to respect the initial equilibrium volume fraction of Nb(C,N) in the system, as calculated using Thermo-Calc. For example, it led to a cell radius () of 6.67 µm according to the simulation carried out for 1373 K with the TCFE9 database and nine elements taken into account. It is worth noting that the grain boundary or pipe diffusion along dislocation cores are not considered in DICTRA simulations, and we thus assumed that lattice diffusion controlled the overall kinetics of Nb(C,N) evolution. This assumption appears reasonable because of the coarse grain size (between 180 and 250 µm) and low dislocation density (fully recrystallized state as the starting point) that prevailed during the investigated heat treatments.
The DICTRA software solves diffusion equations in multicomponent systems [3,4], and the diffusion coefficients were obtained using both thermodynamic factors from the thermodynamic database (TCFE7 or TCFE9 in the present work) and atomic mobilities available from the kinetic database (MOBFE4 [24] in the present work). The diffusion coefficients used can be represented in a full non-symmetric matrix depending on the local concentrations. As an example, the diagonal diffusion coefficients of different elements in Nb(C,N) and austenite calculated at 1373 and 1473 K for the respective equilibrium compositions of the phases (nine-element simulation and TCFE9 database) are shown in Table 4.
Table 4.
Diagonal diffusion coefficients (m s) of different elements in Nb(C,N) and austenite at 1373 and 1473 K obtained from reduced diffusion matrices calculated using the TCFE9 and MOBFE4 databases (nine-element simulation) and for the respective equilibrium phase compositions given in Table 2 and Table 3.
According to Table 4, Ni is the slowest diffusing element in austenite at both 1373 and 1473 K while C and N are very fast diffusers (interstitial elements). The diffusion coefficient of Nb in austenite is consistent with the literature data for diffusion in a face-centered cubic (fcc) iron matrix (3.15 × 10 m s at 1473 K [25], 6.72 × 10 m s at 1373 K, 3.23 × 10 m s at 1473 K [26], 5.97 × 10 m s at 1373 K, and 2.92 × 10 m s at 1473 K [27]). Nevertheless, diffusion coefficients in the ordered Nb(C,N) phase seems greatly overestimated: they are treated by DICTRA as if they were in a fictitious fcc Nb-based solid solution. Data for diffusion in Nb(C,N) are not available from open literature, but the diffusion coefficient of C in TiC given by van Loo [28] varies between 1.22 × 10 m s and 1.21 × 10 m s at 1373 K and between 2.43 × 10 m s and 2.42 × 10 m s at 1473 K. These values are several orders of magnitude lower than those given in Table 4 for C in Nb(C,N). Moreover, the diffusion coefficients of different elements in Nb(C,N) should have a small effect on Nb(C,N) evolution since its composition remains almost constant between 1373 and 1473 K (Table 2), and Nb(C,N) evolution should be thus mainly controlled by the diffusion in austenite within this temperature range.
In the moving boundary problem, the main difficulty is finding the concentration of each element at the two sides of the interface at every timestep. For binary systems, this is directly given by the tie-lines in a phase diagram, but for higher order systems, atomic mobilities affect the interface compositions and it is more difficult to find the operating tie-lines [2]. Therefore, for the high number of elements considered here, fine numerical tuning relatively to time and to the spatial discretization depending on the database chosen (TCFE7 or TCFE9) was requested to successfully run the simulations. The two regions of the simulated cell (the one for Nb(C,N) and the other one for austenite) were discretized with a linear grid. An initial grid of 20 to 30 elements in each region was taken, and DICTRA was allowed to dynamically adapt it. Geometric and double-geometric meshes were tested as well, but the initial interface composition could then not be found with such meshes. The initial timestep was adapted for each simulation between 10 and 10 s. The minimum allowed timestep was taken identical to the initial timestep. The maximum allowed timestep was chosen to be large enough to achieve reasonable overall simulation times and small enough to avoid unfruitful increments, which take a very long time for DICTRA to solve. The typical maximum timestep was therefore taken between 1 and 10 s.
For the simulation, the starting composition of Nb(C,N) and that of austenite was given by the thermodynamic equilibrium at the initial temperature and the system was then assigned a given thermal cycle. Two conditions were considered: (i) an isothermal holding at 1473 K with initial equilibrium corresponding to 1373 K and (ii) an anisothermal cycle starting at equilibrium at 1373 K, staying at 1473 K for 1 hour after a short heating ramp, then slowly cooling down to 1373 K for 5 hours, and finally holding at 1373 K for 1 h (Figure 2). For the sake of simplicity, the anisothermal cycle is further denoted as the “1473–1373 cycle”. These cycles are representative of the T2 and T21 cycles of [16], respectively. They lead to strong differences in recrystallization behaviour.
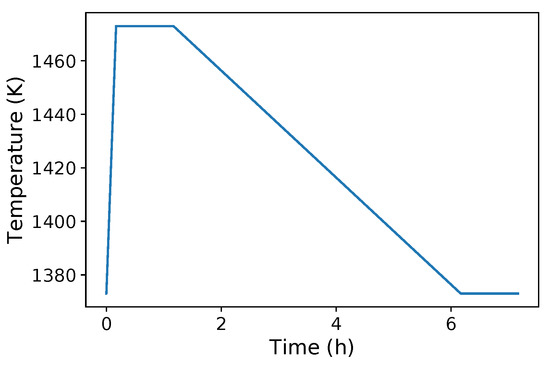
Figure 2.
Anisothermal cycle called the “1473–1373 cycle” in simulations using DICTRA: stay at 1473 K for 1 h after a short heating ramp from 1373 K, slow cooling down to 1373 K for 5 h, and final stay at 1373 K for 1 h.
4. Results of the Thermokinetic Calculations
First, thermokinetic simulations were carried out for the different numbers of elements taken into account and for the different thermodynamic databases used for both isothermal holding and the 1473–1373 cycle. Based on these results, a reduced model was then proposed to perform simulations for complex chemical compositions and thermal conditions in a reasonable calculation time while catching essential physical effects.
4.1. Isothermal Holding at 1473 K
The simulations of isothermal holding at 1473 K were successfully carried out for all chemical compositions and databases considered. Using TCFE9 instead of TCFE7 greatly improves the finding with DICTRA of the operating tie-line for the first time increment. This may be because the mobility database MOBFE4 has its thermodynamic coefficients especially optimized to work with the TCFE9 database. First, the results obtained for a nine-element TCFE9 simulation are presented to describe the phenomena. This simulation is taken as a reference. Then, the four- and seven-element simulations are discussed to analyze the effect of simplified compositions on the final results.
The evolution of Nb(C,N) radius with time at 1473 K is shown in Figure 3: a continuous decrease is observed and an almost constant value is reached after 2 h of holding.
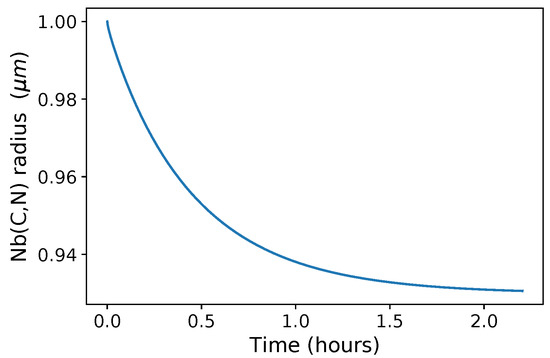
Figure 3.
Nb(C,N) radius as a function of time during holding at 1473 K (nine-element calculation (full composition) using the TCFE9 database).
The Nb concentration profile in austenite is given in Figure 4a. Nb atoms diffused away from the Nb(C,N)/austenite interface and Nb content in austenite were homogenized progressively. After about a 30-min holding at 1473 K, the Nb content in austenite was almost homogeneous and thus close to the mean value in the austenite (given by dashed lines) except when close to the interface. Since only holdings of 30 min or longer were mainly considered in the experiments discussed hereafter, the chemical heterogeneity of Nb in austenite was no longer explicitly taken into account. Instead, the average Nb content in austenite, denoted as [Nb] hereafter, was considered to further discuss the recrystallisation processes occurring in 316Nb steel. The carbon (Figure 4b) and the nitrogen concentration profiles (Figure 4c) were already flat after a few minutes of holding at 1473 K due to their high diffusion rates in austenite.
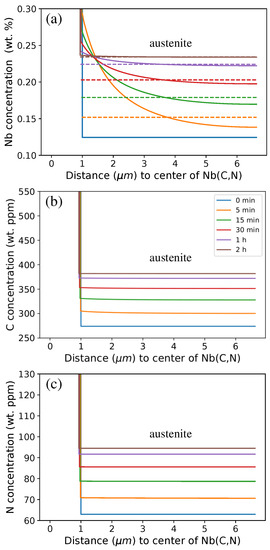
Figure 4.
Concentration profiles during isothermal holding at 1473 K obtained using DICTRA where the Nb(C,N) region is on the left-hand side (0 µm corresponds to the center of spherical Nb(C,N) precipitate) and austenite is on the right-hand side: (a) Nb (mean Nb concentrations in austenite are given by dashed lines), (b) C, and (c) N (nine-element calculation (full composition) using the TCFE9 database). The starting point (0 min) corresponds to equilibrium at 1373 K.
The comparison of average Nb content in austenite as a function of holding time at 1473 K, calculated for different compositions and databases, is shown in Figure 5. The Nb content in austenite at equilibrium is shown as well for comparison. It is worth noting that the seven-element simulation using TCFE7 was only performed for slightly more than 1 h due to convergence difficulties. Nevertheless, the time required for each simulation configuration to reach equilibrium can be readily discussed. First, different initial and final values were obtained depending on both thermodynamic database and chemical composition used in coherence with equilibrium data (Table 3). For the TCFE9 database and considering seven- and nine elements, the absolute difference in Nb content in austenite can reach 0.05 wt.% The same trend was found for seven-element calculations using the TCFE7 and TCFE9 databases. However, the results of the four-element calculation using TCFE9 significantly differ from other results (Figure 5), emphasizing the roles of Ni, Cr, and Mo in thermodynamic equilibrium. Adding these elements significantly changes the volume fraction of precipitate (Table 2). Moreover, Cr and Mo slightly enter the precipitate composition and therefore change the ratio between metallic elements and (C + N) (Table 2). The time to reach equilibrium was more or less the same in all simulations except for the four-element simulation, where the equilibrium was even not reached after 5 h of holding. The time to reach equilibrium is greater with the four-element calculation because this calculation implies greater precipitate composition evolutions during heat treatments (see the C/N ratios in Table 2). Therefore, extensive, slow diffusion inside the precipitate (and not only in the matrix) is needed to reach apparent equilibrium in the four-element calculation.
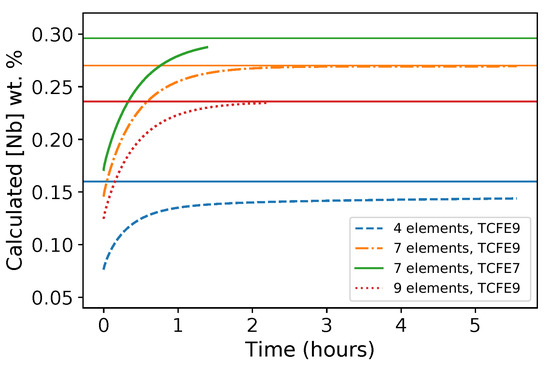
Figure 5.
Average Nb content in austenite due to Nb(C,N) evolution as a function of holding time at 1473 K calculated using DICTRA software with the MOBFE4 kinetic database and the TCFE7 and TCFE9 thermodynamic databases for different numbers of elements taken into account. The starting point (0 min) corresponds to equilibrium at 1373 K; the horizontal solid lines give the Nb content in austenite at equilibrium at 1473 K, according to Table 3.
4.2. Anisothermal 1473–1373 Cycle
For the anisothermal conditions of the 1473–1373 cycle (Figure 2), only the seven-element simulation with TCFE9 was fully successful (the nine-element simulation using TCFE9 no longer converged after 4 h of simulated treatment, and the seven-element simulation using TCFE7 did not converge at all). Figure 6b gives the evolution of the average Nb content in austenite as a function of time for the conditions of the 1473–1373 cycle. First, it increases rapidly corresponding to partial Nb(C,N) dissolution and then it slowly decreases with temperature decrease (growth of Nb(C,N)) during cooling from 1473 K. After the complete thermal cycle, the Nb content in austenite approached the value at equilibrium at 1373 K, i.e., the initial value.
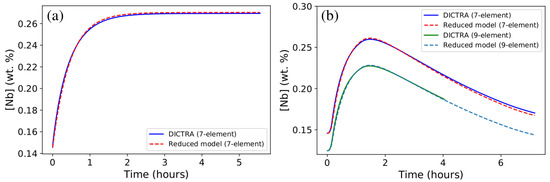
Figure 6.
Comparison of mean Nb content in austenite, [Nb], calculated using DICTRA, and that obtained from the reduced model (Equation (1)) for (a) isothermal holding at 1473 K with the characteristic time s (seven-element calculation using TCFE9) and (b) the anisothermal 1473–1373 cycle (7- and 9-element calculations using TCFE9).
4.3. Reduced Model
The simulations presented in the previous section can last for several days or even weeks for a given thermal cycle on a desktop computer. However, tailoring final mechanical properties through the control of recrystallization phenomena and, thus, of the Nb content in austenite involves the analysis of a wide range of conditions for various steel compositions. To this aim, a reduced phenomenological model was also developed based on results obtained with the above physically based simulations. The average Nb, C and N contents in austenite ([Nb], [C] and [N] hereafter) were taken as key parameters to describe the evolution of the whole system with time.
As shown below, a simple, exponential-like description was found to represent the time evolution of [Nb] determined using DICTRA calculations in isothermal conditions. This evolution was thus represented by a first-order linear differential equation regardless of thermal history (Equation (1)):
where is the equilibrium Nb content in austenite at temperature T; is the current mean Nb content in austenite; and is a characteristic time depending on temperature and on the ratio between the chosen Nb(C,N) radius, , and a reference radius, . For a direct comparison with the above DICTRA simulations, a ratio of unity can be chosen (assigning therefore µm). To determine their dependency on , characteristic times were evaluated with DICTRA simulations for the same isothermal holding at 1473 K starting from equilibrium at 1373 K, with initial radius varying from 10 nm up to 10 µm. A square function was found to describe the observed dependency. Therefore, the characteristic time was taken according to Equation (2):
with being a proportionality coefficient fitted using the results of isothermal simulations (Figure 6a) and being the lattice diffusivity of Nb in austenite. The values of and were adjusted using values of diffusivities taken at different temperatures from the MOBFE4 kinetic database. From a physical point of view, the exponent 2 on the radius ratio may be explained by the fact that the atom flux is proportional to the area of carbide/matrix interface, which is proportional to the square of the Nb(C,N) radius. It is worth noting that such a model could also be directly derived from the Zener theory of precipitate dissolution or growth [29]. In order to get a closed-form equation, was modelled as a continuous function of temperature in the range 1373–1473 K as expressed in Equation (3):
with K and with a, b, and c being dimensionless parameters depending on the thermodynamic conditions (number of elements taken into account and the database used; see Table 5). The results for the seven-element simulation using the TCFE9 database are further discussed in detail since both isothermal and complete anisothermal DICTRA simulations were successfully simulated for this configuration. Nevertheless, the parameters a, b, and c of the reduced model for the nine-element simulation were adjusted as well using the thermodynamic data for [ and taking the kinetic parameters , , and as the same as those for seven-element simulation, since the number of alloying elements taken into account has a very minor effect on and , according to the MOBFE4 database.
Table 5.
Parameters used in the reduced model for themokinetic simulations of Nb(C,N) evolution in austenite (7- and 9-element simulations using the TCFE9 database).
One can see from Figure 6 that a very good agreement was found between results obtained from DICTRA simulations and those obtained using the reduced model for both isothermal and anisothermal conditions. It is recalled that anisothermal results were not used to fit the parameters of the reduced model. The nine-element simulation gives the same kinetics of Nb content evolution in austenite as that obtained using seven-element simulation (Figure 6b). This is consistent with the similarity in isothermal evolution kinetics displayed in Figure 5. The absolute Nb contents are different since equilibrium conditions predicted using seven- and nine-element simulations differ from each other (Table 2 and Table 3).
As for C and N, their average contents in austenite are mainly controlled by Nb diffusion in austenite for an almost constant ratio between metallic elements dominated by Nb and atomic fractions of (C + N) (see the ratio in Table 2). Consequently, and were approximated using the same reduced model and the same time constant (Equations (4) and (5)):
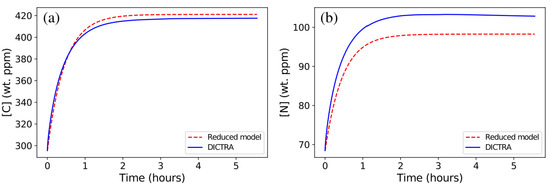
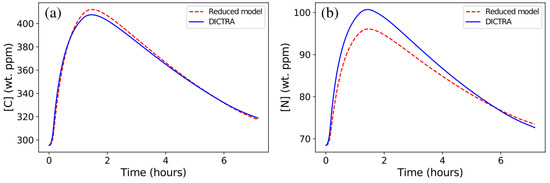
As for the isothermal holding at 1473 K, the agreement between predictions from the DICTRA simulation and those from the reduced model is good, yet the reduced model slightly overestimates the final C content in austenite (Figure 7a) and underestimates the final N content (Figure 7b). This is due to the change in C/N ratio in the precipitate (see Table 2), which involves a slower diffusion rate in Nb(C,N), with increasing time in the DICTRA simulation. Such an effect should be emphasized for more realistic diffusion coefficients in Nb(C,N). Experimental evidence of a C/N change in Nb(C,N) precipitates during heat treatments can be found in [30] for a Super304H austenitic stainless steel close to 316Nb, where the C/N ratio changes from 1.151 to 0.902 during long-term aging. For the anisothermal 1473–1373 cycle, the same effect is observed but the overall evolution remains very satisfactorily predicted (Figure 8).
Interestingly, the sum [C]+[N] remarkably well followed the DICTRA model prediction both for the isothermal and anisothermal conditions (Figure 9a,b), emphasizing the role of the balance between C and N to explain the aforementioned discrepancy. Indeed, in the investigated temperature range, the so-called Nb(C,N) carbonitride exhibits constant stoichiometry of 1.09 with (and minor additions of and ) and or (see Table 2). This is coherent with the abovementioned experimental study on Super304H [30] where the metal to non-metal atomic ratio of Nb(C,N) remains merely constant (it changes from 1.023 to 1.026) during long-term aging.
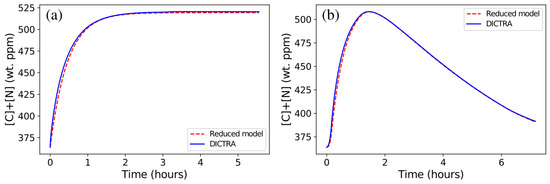
Figure 9.
Comparison of the sum of the mean C and N contents in austenite ([C]+[N]) calculated using DICTRA (7-element calculation using TCFE9) and that obtained from corresponding reduced model for (a) isothermal holding at 1473 K and (b) the anisothermal 1473–1373 cycle.
In summary, compared to long-lasting DICTRA calculations, the reduced model provided a very good estimation of average Nb, C and N contents in austenite during Nb(C,N) evolution as a function of time during heat treatments between 1373 and 1473 K. It is worth noting that the calculation time using the reduced model was a few seconds for the considered thermal cycles on a modern personal computer, whereas a full DICTRA simulation lasted for days or weeks on the same computer for the same thermal cycles. Therefore, the reduced model was further applied to the analysis of various experimental heat treatments carried out in this temperature range. In the following, the reduced model obtained using nine-element simulations using TCFE9 was used because it should give a priori the most detailed thermokinetic description of the evolution of the Nb content in austenite with time.
4.4. Comparison of Model Predictions with EPMA Measurements
Several isothermal experimental heat treatments at 1373, 1423 and 1473 K for various durations were carried out using the abovementioned 316Nb steel to obtain different fractions of Nb(C,N) and thus different Nb, C and N contents in austenite. Isothermal holding was followed by water quenching to avoid the precipitation of secondary Nb(C,N). After the heat treatments, the samples were cut at mid-thickness and polished to a mirror-like quality using standard metallographic procedures. Measurements using a CAMECA SX100 electron probe microanalyzer (CAMECA, France) were carried out at an accelerating voltage of 15 kV and a beam current of 55 and 85 nA. Pure metallic standards were used for the seven elements of interest in the chemical composition. On the other hand, the low amounts of carbon and nitrogen were not addressed in the analysis. In order to measure the amounts of different elements, multiple dedicated line scans were performed. The line scans were set to a total length of 100 µm approximately with a step size of 1 µm.
Some concentration profiles went close to primary Nb(C,N), as can be seen from the peaks in Figure 10. Figure 10a emphasizes the effect of the isothermal holding treatment temperature: a treatment at 1473 K almost doubled the Nb content in austenite compared to that at 1373 K, and the heat treatment at 1423 K led to an intermediate value. Figure 10b emphasizes the effect of holding time at a given temperature: a longer holding time resulted in a higher amount of Nb atoms in austenite, but this increase in [Nb] stabilized after holding for about 30 min at 1473 K.
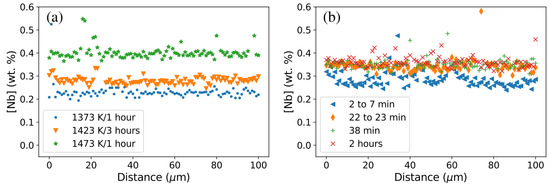
Figure 10.
Concentration profiles for Nb in austenite ([Nb]) obtained by EPMA after heat treatments: (a) at different temperatures for close time durations and (b) at 1473 K for different time durations.
The average Nb content in austenite was then obtained by averaging the data after removing the values corresponding to the primary Nb(C,N) (peaks in Figure 10). For each heat treatment condition, the values from several profiles were then averaged, and the results are shown in Table 6 together with the mean Nb content in austenite calculated using the reduced model (Equation (1)) for various initial Nb(C,N) radii. Small variations in the Nb content between specimens treated at the same temperature and for the same holding time were from the local variations in precipitate fraction, from small differences in average composition due to slight Nb macrosegregation, or from some variability in the experimental measurements. However, this variability is small compared to the overall variations between the various treatments.
Table 6.
Comparison of mean Nb contents in austenite due to Nb(C,N) evolution during different isothermal heat treatments obtained by EPMA measurements and predicted using the reduced model (Equation (1)) based on DICTRA simulation (nine-element simulation using TCFE9). Intervals represent the variability between different measurements for the same condition.
Figure 11 compares the experimentally measured and calculated average Nb contents in austenite (nine-element simulation using TCFE9). The ratio between experimental and predicted values ranges between 1.6 and 2. Nevertheless, a good linear correlation was observed between the measurements and model predictions. The correlation was slightly improved by setting the value of effective initial Nb(C,N) radius taken in the reduced model to µm instead of the previously used µm. This could indicate that the equilibrium was reached quicker than that expected from model prediction. Using seven or nine elements for the simulation is definitely more accurate than using only four elements because the Nb content in austenite being much more precisely estimated (Figure 5). In addition, the evolution of Nb content seems to experimentally stabilize after less than one hour, which is not reproduced in the four-element simulation that predicts a continuous, slow increase. TCFE9 enables simulations that were not possible to run with TCFE7 for numerical reasons. Moreover, TCFE9 gives results that are qualitatively similar to those obtained using TCFE7. On the basis of mean Nb content in austenite, TCFE7 with seven elements gives results closer to EPMA than TCFE9 with seven or nine elements (Figure 5).
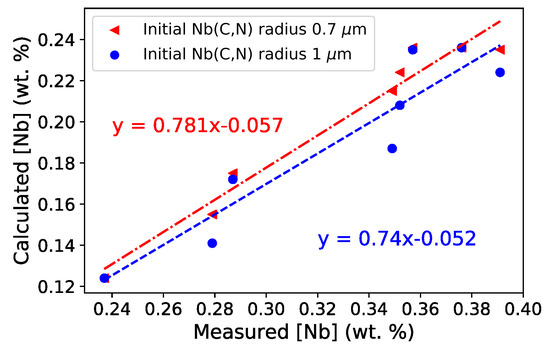
Figure 11.
Comparison of mean Nb contents in austenite for different heat treatments: experimental EPMA measurements and predictions from the reduced model based on results obtained by DICTRA (nine-element simulation using TCFE9) for two initial radii of Nb(C,N).
Several reasons can be invoked to interpret the differences in absolute values between experimental measurements and model predictions of the Nb content in austenite (Figure 11). First, the thermodynamic estimation of the volume fraction of Nb(C,N) by Thermo-Calc is assumed to be the main source of discrepancy. Then, the local volume fraction of primary Nb(C,N) precipitates may not be equal to the global equilibrium volume fraction. In addition, the ferrite was omitted in the thermokinetic simulations whereas it is enriched by Cr, Mo, and especially Nb. During the heat treatments used in the present work, the ferrite might dissolve, thus changing the chemical composition of the austenite. Therefore, neglecting the ferrite can lead to over- or underestimation of Nb content in austenite depending on the conditions considered. However, the fraction of -ferrite in the initial microstructure was close to 1 vol.% and it contained around 1 wt.% of Nb. Therefore, we believe that the evolution of ferrite should not strongly affect the amount of available Nb atoms. As a consequence, it should not result in a significant variation in Nb content of austenite. It is worth noting as well that including ferrite in the simulation would render it numerically complicated and difficult to run.
The reduced model provides a good correlation between measured and calculated Nb content in austenite. It can be easily readjusted once a new thermodynamic description of Nb containing austenitic stainless steels is available. Therefore, one can apply it to estimate an indicator of available Nb atoms in solid solution in austenite in order to interpret the recrystallization behavior of 316Nb steel studied in the present work (see next section). Such a correlation could also be verified for other Nb-bearing steels in order to generalize its application.
5. Application to Recrystallization
The calculated average Nb content in austenite was further used as an indicative parameter to explore the effect of the chemical composition of austenite on physical mechanisms operating during subsequent recrystallization of the considered 316Nb steel during hot torsion testing.
5.1. Experimental Determination of the Recrystallization Behavior
Four different microstructures were created by applying various heat treatments to blanks, followed by air cooling. The conditions of these heat treatments are listed below:
- T1: holding at 1373 K for 1 h (denoted as T1 in Reference [16]);
- T2: the anisothermal 1473–1373 cycle (analogous to T21 in Reference [16]);
- T3: holding at 1473 K for 30 min;
- T4: holding at 1473 K for 1 h (denoted as T2 in Reference [16]).
After each heat treatment, the mean Nb content in austenite [Nb] was evaluated using the above reduced model (Equation (1)) and the data are reported in Table 7. The heat-treated blanks were then machined into hot torsion specimens. Secondary Nb(C,N) precipitation could occur during cooling, but these precipitates were redissolved by a very short holding at 1373 K right before the hot torsion tests. After isothermal heat treatments T1, T3 and T4, hot torsion was applied at 1323 K with a strain rate to obtain a final amount of strain close to the specimen edge. After the anisothermal T2 heat treatment, the specimen was deformed at 1323 K with a strain rate to obtain the total amount of strain . In both cases, observations were made at local strain of 0.2 and 0.4; the strain rate differences were assumed not to significantly affect the recrystallized fraction. The duration of torsion tests was lower than a few minutes at 1323 K, so that long-range diffusion of Nb atoms was not expected to occur during hot torsion. After deformation, a slow cooling (average cooling rate lower than 10 K min) was applied. Finally, annealing at a unique temperature between 1323 and 1373 K followed by water quench was done. More details concerning hot torsion testing conditions and final annealing conditions can be found in Reference [16].
Table 7.
Mean Nb content in austenite after different heat treatments prior to hot torsion testing calculated using the reduced thermokinetic model (nine-element calculation using TCFE9 database) and recrystallized fractions determined using EBSD for intermediate strains of and after hot torsion testing followed by slow cooling and final annealing between 1323 and 1373 K.
Recrystallized fractions of austenite after high-temperature torsion tests and subsequent annealing were quantified using electron backscatter diffraction (EBSD). EBSD maps were much larger than those reported in [16]. They were recorded using a Nova NanoSEM 450 field emission gun scanning electron microscope operated at 20 kV with a specimen tilt at 70° and an EDAX TSL Hikari 320 EBSD camera (EDAX Inc., NJ, USA). In contrast to [16], the acquisition was performed in a transverse cross-section of samples using a step size of 5 µm. A series of EBSD maps were acquired along an entire diameter to follow microstructural evolution as a function of distance to specimen axis and, hence, of both strain and strain rate applied during hot torsion. The final EBSD maps were obtained by stitching a series of subsequent EBSD maps thus obtained (Figure 12). A grain orientation spread (GOS) criterion was used to distinguish between recrystallized and deformed grains [31]. Grains with a GOS lower than 1 or 2° were considered recrystallized ones [32]. The results of these characterisations at intermediate strains of and are given in Table 7.
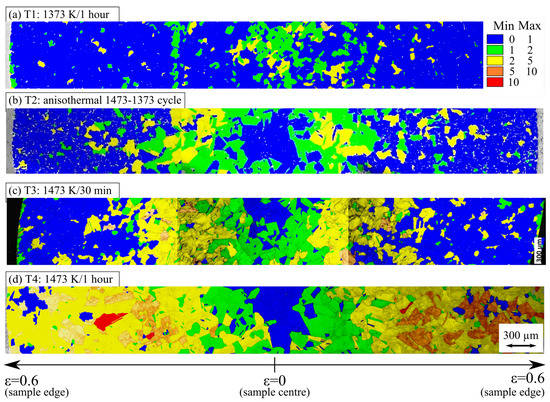
Figure 12.
Grain orientation spread (GOS) and image quality of EBSD patterns over one diameter of hot torsion samples after different heat treatments prior to deformation. The specimen axis is perpendicular to the figure.
5.2. Effect of Mean Nb Content in Austenite
Table 7 and Figure 12 indicate a clear effect of the heat treatment applied before deformation by hot torsion on the recrystallization behavior of 316Nb steel. First, as already shown in [16], no significant dynamic recrystallization occurred over the range of deformation conditions used in the present hot torsion tests. On the one hand, holding at the elevated temperature of 1473 K for 1 h (T4 heat treatment) almost completely hindered post-dynamic and static recrystallization. On the other hand, holding for 30 min at 1473 K (T3 heat treatment) hindered recrystallization compared to holding at 1373 K during 1 h (T1 heat treatment), but this hindering was far less significant than that induced by a 1 h holding at 1473 K. This indicates that, in this time interval, a kinetic contribution is involved in the effect of holding at 1473 K prior to hot torsion. The 1473–1373 cycle (T2 heat treatment) yielded the same behavior as the T1 heat treatment. This indicates that the slow cooling from 1473 K and the subsequent holding at 1373 K for 1 h suppressed the effect of the stay at 1473 K for 1 h.
By plotting recrystallized fractions of austenite as a function of the calculated mean Nb content in austenite (Figure 13), we show that increasing the mean Nb content in austenite prior to deformation is strongly correlated with hindering subsequent recrystallisation. This could be linked to a stronger solute drag effect when more Nb atoms are in solid solution [33,34]. This plot also allows us to rationalize the effects of the T2 and T4 treatments, respectively. It thus confirms that the mean Nb content in austenite before deformation is a relevant microstructural parameter in the description of the subsequent recrystallization behavior in the investigated conditions.
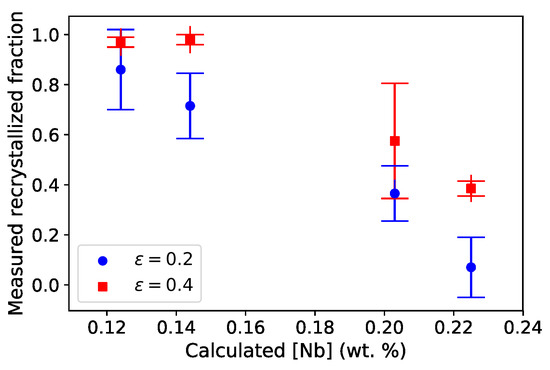
Figure 13.
Recrystallized fraction of austenite in 316Nb steel after hot torsion tests determined on EBSD (lower value: ° and upper value: °)) at strains of and as a function of mean Nb content in austenite after different heat treatments prior to deformation, as predicted using reduced thermokinetic model ( µm, complete 316Nb composition (nine-element simulation) and the TCFE9 database).
EPMA measurements carried out on samples without torsion indicated (Section 4.4) that equilibrium is reached at 1473 K in about 30 min, whereas hot torsion specimens indicated that a 30-min heat treatment is not equivalent to a 1 h heat treatment in hindering recrystallization. This discrepancy cannot be simply explained here. Nb is thought to delay recrystallization by segregating at austenite grain boundaries and thus slowing down grain boundary migration. Maybe for such heat treatment time durations, the average Nb content in austenite is not the only relevant microstructural parameter, possibly due to variations in segregation of solute atoms to moving grain boundaries. As a consequence, we cannot make the hypothesis of a homogeneous Nb in austenite. Alternatively, maybe the quicker kinetics evidenced with EPMA is linked to some local variation of precipitate volume fraction and is not fully representative of the torsion process. More extensive EPMA measurements of kinetic effects would be needed to conclude on this point. Nevertheless, the amount of Nb in austenite, calculated thanks to the thermokinetic and reduced models, seems to be a reliable indicator that could be used to link thermal-mechanical history and resulting microstructures to help control recrystallization and thus, the final properties.
6. Conclusions
Thermokinetic modelling of Nb(C,N) evolution in austenite during different isothermal and anisothermal heat treatments of 316Nb stainless steel was carried out using DICTRA software and applied to experimental measurements of austenite composition and the recrystallization behavior of 316Nb steel. The main conclusions can be summarized as follows:
- Isothermal and anisothermal simulations of dissolution and growth of primary Nb(C,N) precipitates at elevated temperatures with a realistic thermodynamic framework are now possible.
- Compared to TCFE7 thermodynamic database, using TCFE9 together with MOBFE4 enables us to run simulations with complete chemical compositions (nine elements for the 316Nb steel studied here). Nevertheless, the Nb contents predicted in austenite using TCFE7 and TCFE9 are very similar.
- Taking seven or nine elements into account strongly changes and greatly improves the predicted values of mean Nb content in austenite compared to those obtained using a simple four-element scheme.
- Nb, C and N evolution in austenite can be simply modelled by a reduced model developed on the basis of DICTRA results, enabling various heat treatment simulations for a wide variety of Nb-bearing steels.
- A good correlation between calculated mean Nb content in austenite and that measured by EPMA in 316Nb steel after different heat treatments was stated.
- The reduced model was successfully applied to interpret the recrystallization behavior of 316Nb steel during hot torsion tests preceded by different heat treatments on the basis of the amount of Nb atoms available in austenite.
Author Contributions
Conceptualization, N.C., A.-F.G.-L., and V.A.E.; methodology, N.C. and V.A.E.; investigation, N.C.; writing—original draft preparation, N.C.; writing—review and editing, N.C., A.-F.G.-L., and V.A.E.; supervision, S.R., P.P., J.B., E.G., F.C., and J.-L.H. All authors have read and agreed to the published version of the manuscript.
Funding
This research received no external funding.
Data Availability Statement
Data sharing is not applicable.
Acknowledgments
Lynh-Thy Tran-Hoang is gratefully acknowledged for carrying out the EPMA measurements.
Conflicts of Interest
The authors declare no conflict of interest.
Abbreviations
The following abbreviations are used in this manuscript:
| Symbol | Description |
| initial radius of carbonitride | |
| total radius of the simulation box (carbonitride and austenite) | |
| reference radius used in DICTRA simulations | |
| average Nb content in the austenite matrix (at time t) | |
| average C content in the austenite matrix (at time t) | |
| average N content in the austenite matrix (at time t) | |
| equilibrium Nb content in the austenite matrix at temperature T | |
| equilibrium C content in the austenite matrix at temperature T | |
| equilibrium N content in the austenite matrix at temperature T | |
| time constant to reach thermodynamic equilibrium at temperature T | |
| for a precipitate radius ratio | |
| T | current temperature |
| reference temperature | |
| proportionality constant in the reduced model | |
| R | gas constant |
| diffusion pre-exponential factor | |
| diffusion activation energy | |
| a, b, c | parameters of the modelling |
| GOS | grain orientation spread |
| local deformation | |
| local strain rate |
References
- Andersson, J.O.; Ågren, J. Models for numerical treatment of multicomponent diffusion in simple phases. J. Appl. Phys. 1992, 72, 1350–1355. [Google Scholar] [CrossRef]
- Larsson, H.; Reed, R. On the numerical simulation of diffusion-controlled reactions under local equilibrium conditions. Acta Mater. 2008, 56, 3754–3760. [Google Scholar] [CrossRef]
- Borgenstam, A.; Höglund, L.; Ågren, J.; Engström, A. DICTRA, a tool for simulation of diffusional transformations in alloys. J. Phase Equilib. 2000, 21, 269–280. [Google Scholar] [CrossRef]
- Andersson, J.O.; Helander, T.; Höglund, L.; Shi, P.; Sundman, B. Thermo-Calc & DICTRA, computational tools for materials science. Calphad 2002, 26, 273–312. [Google Scholar]
- Schneider, A.; Inden, G. Simulation of the kinetics of precipitation reactions in ferritic steels. Acta Mater. 2005, 53, 519–531. [Google Scholar] [CrossRef]
- Dmitrieva, O.; Ponge, D.; Inden, G.; Millán, J.; Choi, P.; Sietsma, J.; Raabe, D. Chemical gradients across phase boundaries between martensite and austenite in steel studied by atom probe tomography and simulation. Acta Mater. 2011, 59, 364–374. [Google Scholar] [CrossRef]
- Esin, V.; Denand, B.; Le Bihan, Q.; Dehmas, M.; Teixeira, J.; Geandier, G.; Denis, S.; Sourmail, T.; Aeby-Gautier, E. In situ synchrotron X-ray diffraction and dilatometric study of austenite formation in a multi-component steel: Influence of initial microstructure and heating rate. Acta Mater. 2014, 80, 118–131. [Google Scholar] [CrossRef]
- Enomoto, M.; Li, S.; Yang, Z.; Zhang, C.; Yang, Z. Partition and non-partition transition of austenite growth from a ferrite and cementite mixture in hypo- and hypereutectoid Fe-C-Mn alloys. Calphad 2018, 61, 116–125. [Google Scholar] [CrossRef]
- Eggbauer, A.; Lukas, M.; Ressel, G.; Prevedel, P.; Mendez-Martin, F.; Keckes, J.; Stark, A.; Ebner, R. In situ analysis of the effect of high heating rates and initial microstructure on the formation and homogeneity of austenite. J. Mater. Sci. 2019, 54. [Google Scholar] [CrossRef]
- Moreno, M.; Teixeira, J.; Ghanbaja, J.; Bonnet, F.; Allain, S. Evolution of cementite composition along the processing of cold-rolled and annealed Dual-Phase steels. Materialia 2019, 6, 100179. [Google Scholar] [CrossRef]
- Xiao, F.; Cao, Y.; Qiao, G.; Zhang, X.; Liao, B. Effect of Nb Solute and NbC Precipitates on Dynamic or Static Recrystallization in Nb Steels. J. Iron Steel Res. Int. 2012, 19, 52–56. [Google Scholar] [CrossRef]
- Zurob, H.; Hutchinson, C.; Brechet, Y.; Purdy, G. Modeling recrystallization of microalloyed austenite: Effect of coupling recovery, precipitation and recrystallization. Acta Mater. 2002, 50, 3077–3094. [Google Scholar] [CrossRef]
- Zurob, H.; Brechet, Y.; Purdy, G. A model for the competition of precipitation and recrystallization in deformed austenite. Acta Mater. 2001, 49, 4183–4190. [Google Scholar] [CrossRef]
- Bäcke, L. Modeling the Effect of Solute Drag on Recovery and Recrystallization during Hot Deformation of Nb Microalloyed Steels. ISIJ Int. 2010, 50, 239–247. [Google Scholar] [CrossRef]
- Lu, S.; Hu, Q.M.; Johansson, B.; Vitos, L. Stacking fault energies of Mn, Co and Nb alloyed austenitic stainless steels. Acta Mater. 2011, 59, 5728–5734. [Google Scholar] [CrossRef]
- Hermant, A.; Suzon, E.; Petit, P.; Bellus, J.; Georges, E.; Cortial, F.; Sennour, M.; Gourgues-Lorenzon, A.F. Hot Deformation and Recrystallization Mechanisms in a Coarse-Grained, Niobium Stabilized Austenitic Stainless Steel (316Nb). Metall. Mater. Trans. A 2019, 50, 1625–1642. [Google Scholar] [CrossRef]
- Rivas, A.; Matlock, D.; Speer, J. Quantitative analysis of Nb in solution in a microalloyed carburizing steel by electrochemical etching. Mater. Charact. 2008, 59, 571–577. [Google Scholar] [CrossRef]
- Tao, S.F.; Wang, F.M.; Sun, G.L.; Yang, Z.B.; Li, C.R. DICTRA Simulation of Holding Time Dependence of NbC Size and Experimental Study of Effect of NbC on Austenite Grain Growth. Metall. Mater. Trans. A 2015, 46, 3670–3678. [Google Scholar] [CrossRef]
- Erneman, J.; Schwind, M.; Andrén, H.O.; Nilsson, J.O.; Wilson, A.; Ågren, J. The evolution of primary and secondary niobium carbonitrides in AISI 347 stainless steel during manufacturing and long-term ageing. Acta Mater. 2006, 54, 67–76. [Google Scholar] [CrossRef]
- Gupta, S. The Classical Stefan Problem: Basic Concepts, Modelling and Analysis with Quasi-Analytical Solutions and Methods; Elsevier: Amsterdam, The Netherlands, 2017. [Google Scholar]
- Perron, A.; Toffolon-Masclet, C.; Ledoux, X.; Buy, F.; Guilbert, T.; Urvoy, S.; Bosonnet, S.; Marini, B.; Cortial, F.; Texier, G.; et al. Understanding sigma-phase precipitation in a stabilized austenitic stainless steel (316Nb) through complementary CALPHAD-based and experimental investigations. Acta Mater. 2014, 79, 16–29. [Google Scholar] [CrossRef]
- Thermo-Calc Software, TCFE7—TCS Steels/Fe-Alloys Database; Version 7.0. Available online: https://thermocalc.com/content/uploads/Documentation/Databases/TCFE_History/tcfe-historytcfe6totcfe7.pdf (accessed on 17 March 2020).
- Thermo-Calc Software, TCFE9—TCS Steels/Fe-Alloys Database, Version 9.0. Available online: https://thermocalc.com/content/uploads/Documentation/Databases/TCFE_History/tcfe-historytcfe8totcfe9.pdf (accessed on 17 March 2020).
- Thermo-Calc Software, MOBFE4: TCS Steels/Fe-Alloys Mobility Database. Available online: https://thermocalc.com/content/uploads/Documentation/Databases/Mobility/mobfe6-technical-info.pdf (accessed on 26 April 2021).
- Sparke, B.; James, D.W.; Leak, G.M. Lattice diffusion in gamma-iron. J. Iron Steel Inst. 1965, 203, 152. [Google Scholar]
- Kurokawa, S.; Ruzzante, J.E.; Hey, A.M.; Dyment, F. Diffusion of Nb in Fe and Fe alloys. Met. Sci. 1983, 17, 433–438. [Google Scholar] [CrossRef]
- Geise, J.; Herzig, C. Lattice and grain boundary diffusion of niobium in iron. Z. Metallkd. 1985, 76, 622–626. [Google Scholar]
- van Loo, F.; Bastin, G. On the diffusion of carbon in titanium carbide. Metall. Mater. Trans. A 1989, 20, 403–411. [Google Scholar]
- Zener, C. Theory of Growth of Spherical Precipitates from Solid Solution. J. Appl. Phys. 1949, 20, 950–953. [Google Scholar] [CrossRef]
- Ou, P.; Li, Z. Ordering of Primary Carbonitrides in an Austenitic Steel Revealed by Transmission Electron Microscopy and Atom Probe Tomography. Materials 2018, 11, 2321. [Google Scholar] [CrossRef] [PubMed]
- Wright, S.; Nowell, M.; Field, D. A Review of Strain Analysis Using Electron Backscatter Diffraction. Microsc. Microanal. 2011, 17, 316–329. [Google Scholar] [CrossRef] [PubMed]
- Fekiri, H.; Esin, V.; Maurel, V.; Köster, A.; Bienvenu, Y. Microstructure evolution of innovative thermal bridge composite (i-TBC) for power electronics during elaboration. Mater. Des. 2018, 137, 68–78. [Google Scholar] [CrossRef]
- Cahn, J.W. The impurity-drag effect in grain boundary motion. Acta Metall. 1962, 10, 789–798. [Google Scholar] [CrossRef]
- Hillert, M.; Sundman, B. A treatment of the solute drag on moving grain boundaries and phase interfaces in binary alloys. Acta Metall. 1976, 24, 731–743. [Google Scholar] [CrossRef]
Publisher’s Note: MDPI stays neutral with regard to jurisdictional claims in published maps and institutional affiliations. |
© 2021 by the authors. Licensee MDPI, Basel, Switzerland. This article is an open access article distributed under the terms and conditions of the Creative Commons Attribution (CC BY) license (https://creativecommons.org/licenses/by/4.0/).