Abstract
Laser surface alloying is one of the recent technologies used in the manufacturing sector for improving the surface properties of metals. Aluminum alloys are key materials in the manufacturing sector. This favors their high demand in many industries. In this study investigation, the surface alloying of pure aluminum was conducted using a CO laser. Four types of alloying powders were used with a 2:1:1 combination of copper, magnesium, and manganese. The hardness of the alloyed zones of Al-CuMgMn increased by 2 to 7 times at a 1.7 kW processing laser power. To assess the rate of wear for the alloyed samples, a modified Lancaster wear coefficient was considered. When the pin-on-disc wear test at 10 N and 20 N loads was analyzed with different sliding speeds, a reduction in wear by 30–50% appeared due to surface alloying. The result shows good insight into the wear behavior. In the same way, microstructure and surface morphology studies displayed a good metallurgical bonding without defects. In a statistical sense, the friction and wear behavior matched with an asperity-based model. The experimental results revealed that laser surface alloy has more wear resistance.
1. Introduction
Aluminum alloys are groups of nonferrous metals that find a wide range of applications. Among the engineering application areas for aluminum alloys, the aerospace and the automotive industry sectors are the forefront industries mainly due to the lightweight and high thermal conductivity of these materials in addition to their excellent workability. Other applications are electric, electronic, wind, and solar energy management components, due to the advantages of high specific strength, high processability, predominantly anti-erosion, and nature of recoverability. Furthermore, recycling of aluminum products is easier and environmentally friendly. However, aluminum alloys have poor surface hardness and wear characteristics. Degradation of parts made of aluminum starts mostly at the surface [1]. Recent extensive research in the field of surface engineering is driven by the progressive growth of the need for high wear-resistant surfaces that have enhanced physical properties using diverse techniques. Yuan et al. [2] improved the wear resistance of aluminum by reinforcing it with in situ AlB2 particles. Rao and Das [3] improved the wear resistance of AA2024 alloy by reinforcing it with SiC particles. The improvement of microstructure, microhardness, corrosion, wear resistance, and chemical composition of Mo-B, B-Si coatings and heat treatment of metal materials was attempted in [4,5,6]. The formation of metallurgical bonding of added materials with aluminum substrate through laser played a significant role in proving surface properties such as microhardness, wear, and corrosion resistance [5,7]. This feature makes laser a perfect device for obtaining specific properties in the metal surface layer due to microstructural modification or changes in chemical composition (if additional material is supplied to the molten pool).
One of the primary methods for obtaining materials with better mechanical properties is surface treatment technology. Among these processes is laser surface alloying, which can lead to obtaining good wear resistance on aluminum substrate [8,9,10]. Laser surface alloying by adding an external material is one of the effective methods among the three surface modification techniques, i.e., laser dispersing, laser cladding, and laser surface alloying. In laser dispersing, non-metallic materials, commonly particles of ceramic materials, are dispersed in the metal matrix to make a composite structure [11,12], while in cladding, overlay of identical or different material is deposited on the substrate surface to create strong bonds within the material [13]. In laser surface alloying, the external material is diffused into the metal substrate to form the beneficial alloys as shown in Figure 1. For material processing, CO, Nd:YAG, excimer, and diode lasers are mainly applied [14,15,16]. Take into account these methods, several researchers have attempted to employ laser surface alloying as well as dispersing in aluminum substrate. For instance, a 2000-W Nd:YAG laser was used to make an alloy of a powder whose composition is 96 wt.% WC, 2 wt.% Mg and 2 wt.% Ti [17]. In [18], it has been reported that 99.5% pure aluminum was alloyed with 6–40 wt.% Cu using CO laser surface modification. A laser surface alloying technique with FeCrMoMnWCB powder (Nano steel SHS717) in the aluminum alloy (A97075) was attempted in [19,20]. In the same way, the same techniques were reported in [21], with WC, CO, and NiCr (in 70:15:15 ratio) using a 5 kW continuous wave (CW) Nd:YAG laser with a beam diameter of 3 mm. As one of the recent technologies in surface engineering and improved microstructure and mechanical properties, a high power CO laser was used to disperse tungsten carbide (WC) ceramic powder in the surface treated Al-Si-Cu cast aluminum alloy [22,23]. High surface microhardness was achieved by remelting the surface of an aluminum–copper alloy (Al-15 wt.% Cu) using a continuous 1-kW CO laser [24].
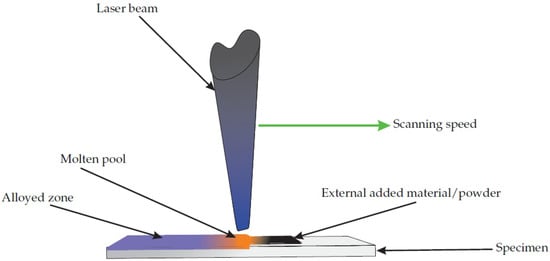
Figure 1.
Schematic of laser alloying.
There are several ways of carrying out laser surface alloying [25]. While processing, the material enters the substrate surface below the laser beam using different methods such as powder blowing, pre-placed powder coating, wire feeding, etc. [26]. In one method, the alloying element is pre-placed on the surface of the substrate in the form of powder or the powder can be injected either co-axially with the laser beam or from the side, followed by melting and solidification. In the other method, a binder is employed to pre-place the alloying material, and it is also possible to deliver the wire form of the alloying materials into the melt pool [27]. Laser surface alloying involves simultaneously melting and mixing of the alloying material containing the alloyed additions with the treated material (base material) [28]. Changing the chemical composition of the aluminum alloy causes changes in the properties of the material. The addition of 40% wt.% Cu, 40 wt.% Mo and 20 wt.% Mg on the aluminum surface aids the analysis of the wear resistance [29]. The hardness and compression strength increased with the addition of magnesium [30]. The addition of manganese in aluminum alloys increases the strength without decreasing ductility and also improves corrosion resistance [29,31]. Al-CuMgMn films are used in micro-electro-mechanical systems [32]. Furthermore, laser heat treatment is one of the possibilities to improve the wear properties of the materials that were analyzed [33].
Aluminium alloy qualities are highly affected by laser beam parameters such as laser power laser scan speed and beam diameter. For example, alloy depth increased when laser beam power was increased from 1.7 to 1.9 kW power [34]. Similarly, when the laser scan speed was increased by 300 to 500 mm, both alloy depth alloy widths were decreased [35]. The effect of the beam diameter was also observed in [36,37], where there is an optimum beam diameter for the best performance. During laser alloying, the phenomena occurring are slightly more complicated due to the input of additional elements or compounds to the substrate material with other laser parameters. That is why research and development are still focused on this area. In this paper, surface alloying of commercially available pure aluminum with a combined powder of copper, magnesium and manganese in the ratio of 2:1:1 was proposed, employing a continuous wave of CO laser of 1.7 kW power, where the beam diameter ranged from 5.8 to 9.8 mm. To achieve the desired properties, it is important to make appropriate selection and control of processing parameters such as power density, travel speed and diameter of the laser beam at the workpiece surface.
In the work reported in this paper, surface alloying of a commercially available pure aluminum substrate was conducted with 99.7% pure metal powders of copper, magnesium and manganese as well as their combinations. The pre-placing of the powder was performed by making a slurry of adhesive and powder. The melting was conducted by a continuous wave of CO laser powers of 1700 W, 1800 W and 1900 W. After laser surface alloying, the alloy microstructure, surface hardness and tribological properties were studied. Thus, the result allows us to study the behavior of the aluminum alloyed material in depth and better understand the complexity of wear resistance and metallurgical phenomena.
2. Materials and Methods
Aluminum blocks of dimension 120 mm × 30 mm × 10 mm were prepared. The average particle size of each metal powders was 10 μm. Each metal powder was separately mixed with a low temperature polymer based binder (Fevigum, Make: Hira Industries) and pre-placed on aluminum plate surface (area 120 mm × 10 mm) up to 0.3 mm thickness. In the same way, copper, magnesium and manganese metal powders were mixed in 2:1:1 ratio to make the fourth sample. Energy Dispersive X-ray Spectroscopy (EDS) was used to make analysis of the composition of aluminum substrate containing 0.6 wt.% Si, 0.3 wt.% Fe, 0.1 wt.% Cu and balanced aluminum. A flexible Orion 4 kW CO laser machine (Model:, Make: LVD, Orion R3015, Germany) was used, where the experiment parameters are given in Table 1. The standoff distance of a laser of 30 mm was also considered.

Table 1.
Laser parameters of the experiment.
The heat input value Q was calculated from the laser power and the laser scanning speed
where Q is heat input (J/mm), P is laser power (W), and V is laser beam scan speed (mm/s).
On the surface, metallographic analysis was carried out following etching and polishing of the surface with Keller, standard reagent, comprising a solution of HF, HNO3, HCl and distilled water with volumes of 2 mL, 5 mL, 3 mL and 190 mL, respectively. Etching at room temperature was then carried out for 10 min. To analyze the hardness of the alloyed region, microhardness tests were performed on the Vickers hardness test with 0.5 kg load after sectioning and rough polishing in the thickness direction. Analysis of wear and friction were conducted on pin-on-disc tribometer (Friction and Wear Monitor TR201, make DUCOM Instruments). The pin samples were prepared from CO laser surface alloyed region with the size 30 mm × 6 mm × 6 mm as shown in Figure 2a. As already mentioned, the laser spot diameter of 5.8 mm was used. Consequently, the entire surface of 6 mm × 6 mm has almost uniform concentration of the alloying elements. However, the concentration gradually dropped to zero along the alloying depth (along the length direction, i.e., 30 mm).
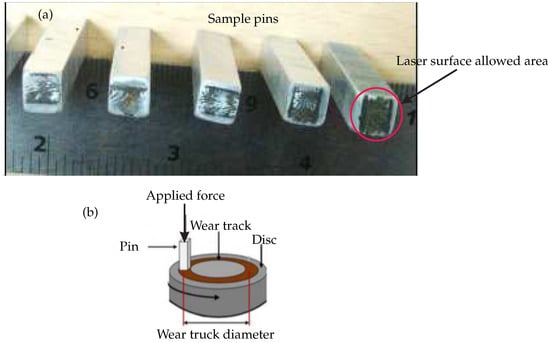
Figure 2.
Photograph of laser-surface-alloyed sample and pin used for the tribology test. (a) Pin samples prepared for wear testing, (b) schematic diagram of the pin-on-disk assembly.
Following the perpared samples, a wear test was performed against a contacting hardened steel disc (84 HRB) of 10 mm thickness and 100 mm diameter using a 70 mm mean diameter track as shown in Figure 2b. The result indicates that the variation of the relative sliding velocity was ±4% with respect to the sliding mean velocity. Considering this variation as a small, average sliding velocity is recorded based on the mean diameter. The wear tests were carried out with a pin-on-disc tribometer sliding in a dry condition for 30 min at room temperature, following the ASTM G99-95a standard [38]. Table 2 shows the test parameters used during the wear test. The effect of friction force on the pin wear was monitored, based on the data system connected to the machine with the computer. Upon completing the test, the worn sample pin was cleaned by acetone, weighed and dried by a digital electronic machine (model/make: Sartorius, BSA224S-CW, Germany) with 0.0001 g accuracy.

Table 2.
Experimental parameters for pin-on-disc test.
3. Modified Lancaster Wear Coefficient
Most of the researchers use a measure of sliding wear rate based on a pin-on-disc test. Lancaster [34] used the following formula to estimate a wear coefficient
where s is the sliding distance, V is the volume of material removed and is the normal load. For cases where the wear volume does not have a linear sliding distance, a modified Lancaster wear coefficient can be expressed as follows
In a pin-on-disc test, instead of wear volume, wear mass is measured, which is divided by the density to obtain the wear volume. In the laser alloyed sample, density keeps changing with the depth since the concentration of the alloy elements are changed along the depth. This implies that it changes with the sliding distance. A simple way to estimate the density is explained as follows. A typical schematic of the surfaced-alloyed sample is shown in Figure 3. It was observed, through EDS, that the concentration of the alloying element changes almost linearly from top to bottom. At the same time, the alloyed width also keeps on reducing with depth. As an approximation, the concentration C at a given wear depth d can be estimated as
where is the concentration of the alloying element at the top surface and h is the alloying depth. Knowing the concentration, the density of the alloyed zone can be calculated as
where is the density of the added element and is the density of substrate material.
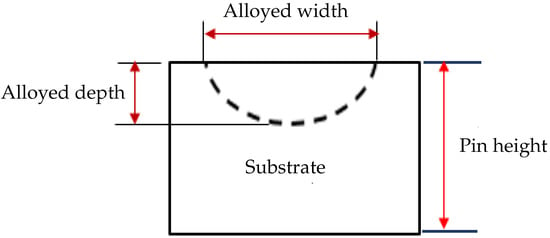
Figure 3.
Schematic of pin showing the profile of the alloyed zone.
As the wear depth is very small, instead of a variable density over the sliding distance, an average density can be used. This is obtained by calculating the initial and final densities using Equation (5). In that case, the modified Lancaster wear coefficient is given by
where is the wear mass as a function of sliding distance. In the present work, was obtained by curve fitting of the data.
4. Results and Discussions
This section comprises six subsections. Section 4.1 describes the effect laser power on alloyed depth. Section 4.2 describes the microstructure and surface morphology. Section 4.3 contains the results of micro-hardness test. Section 4.4, Section 4.5 and Section 4.6 present the worn surface morphology, wear and friction behavior, respectively.
4.1. Effect of the Laser Power on Alloying Depth
For all the samples, laser surface alloying was analyzed at different laser powers, 1900, 1800 and 1700 W, with laser beam diameter of 5.8 mm and constant laser scanning speed of 5 mm/s. The result shows that the alloyed depth linearly increases while the laser power increases as depicted in Figure 4. The lateral width of the alloyed region was measured with a result of 5.5 mm without changing the alloyed depth with respect to the laser power. The minimum alloyed depth of 1.73 mm, measured at 1700 W laser power, was used. In the same way, the maximum 2 mm of alloyed depth was measured at 1900 W laser power and was used. On the other hand, when the laser power increased from 1700 to 1900 W by 12%, the depth of alloying was increased by 15.6%. This shows that the heat generated from laser power has an effect on the mechanical properties such as hardness and wear resistances, which are discussed in other sections.
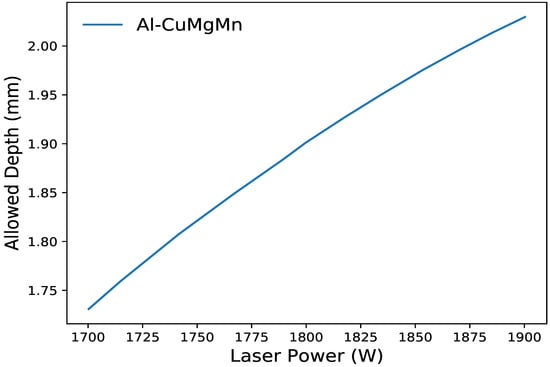
Figure 4.
The effect of laser power on alloyed depth with laser beam spot diameter of 5.8 mm and laser scan speed of 5 mm/s.
4.2. Microstructure Analysis
Metallurgical bonding of alloying elements with substrate materials is depicted in Figure 5. The formation of micro-segregation takes place due to variation in melting temperature. Small ball-like grains were formed as investigated using high magnification of 150 K by field-emission scanning electron microscopy (FESEM) as shown in Figure 5b. The formation of grain boundaries was analyzed in the optical micrograph for each grain region and denderitic structures as shown in Figure 5a. The general grain structure in each grain boundary region is formed due to diffusion rates of each elements and solidification effects. The composition of the Al-CuMgMn alloy id analyzed in Figure 6 using EDS analyzer. The result shows that 23.3 wt.% and 36.3 wt.% of copper were found in alloys. They depict the average chemical compositions of the specimens taken from various locations. Similarly, the result shows good metallurgical bonding within the aluminum substrate that is free from micro-cracks and porosity formation in the alloy morphology.
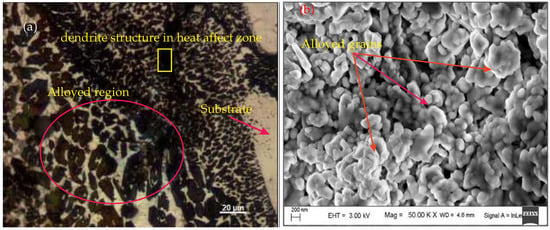
Figure 5.
Microstructure of alloyed region image (20×) at laser-surface-alloyed samples at a laser beam spot diameter of 5.8 mm, scan speed of 5 mm/s and laser power of 1700 W. (a) Optical image, (b) FESEM analyzed results (image).
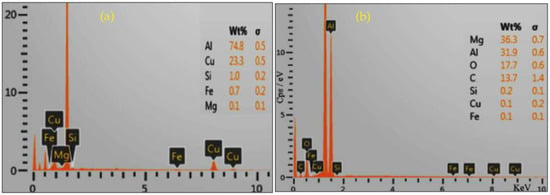
Figure 6.
Typical EDS spectrums of Al-CuMgMn sample. (a) Composition of spectrum 14 (alloy region); and (b) Composition of spectrum 18(substrate region).
4.3. Microhardness Analysis
The average microhardness of the Al substrate was 30 HV. The effect of laser power on microhardness was analyzed as shown in Figure 7. A maximum microhardness of 189 HV was measured for 1700 W, and a minimum of 118 HV for sample processed at 1900 W. The variation in hardness resulted due to change in laser parameters. When 12% of the laser power increased from 1700 W to 1900 W, the micro-hardness of the laser-surface-alloyed samples reduced by 35–38%. The reproducibility of the experiments was tested by taking the measurements six times. As discussed in Section 4.1, the maximum depth of alloying was observed at 1900 W laser power for all samples. However, the hardness of the alloyed material at 1900 W power is lower than 1700 W laser power. On the other hand, when the depth of alloying is increased, hardness decreases due to the concentration of alloying elements being less. Accordingly, the concentration of the alloying elements (magnesium and copper), intermetallic formation and element segregation can enhance the hardness of aluminum alloys.
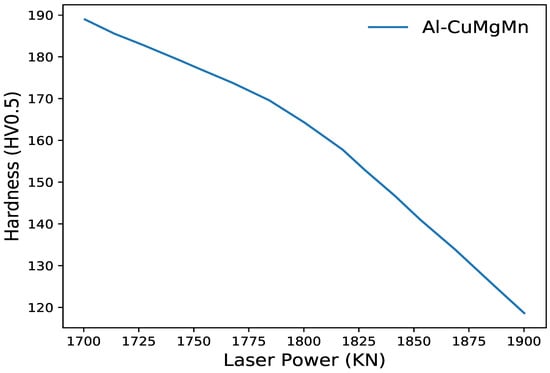
Figure 7.
Micro-hardness of laser alloy surface modified at different laser powers with laser spot diameter of 5.8 mm and laser scan speed of 5 mm/s.
4.4. Worn Surface Morphology
Pin-on-disc worm surface morphology was analyzed at a room temperature of 20–25 °C using the SRV®5 (Optimol Instruments) high-rotation system with power spectral density, where the other modules to control the worn parameters are as shown in Figure 8. The 3D surface mapping and worn morphology measurements were obtained by 3D optical surface profile as illustrated in Figure 9. This process takes the initial step of capturing the millions of data points in the surface morphology with high-precision objective lenses by the selection of rubbed surface region to analyze the worn surface morphology visualization, as depicted in Figure 9. The figure gives the information that wear scars were generated on the worn surfaces with debris adhering along the grooves under normal loads and sliding.
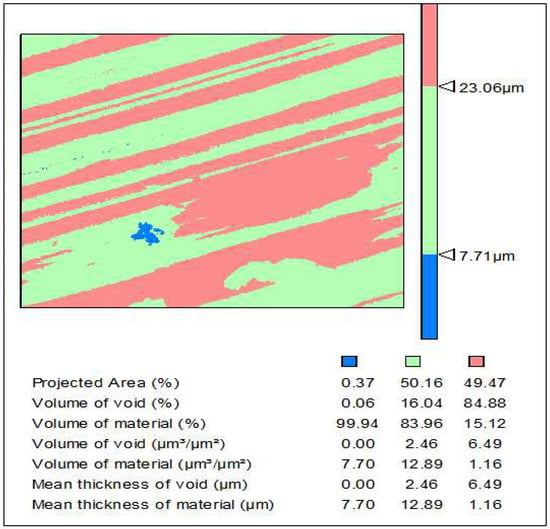
Figure 8.
Surface topology (×50) and wearing worn distribution of alloyed Al-CuMgMn with laser 1.9 kW.
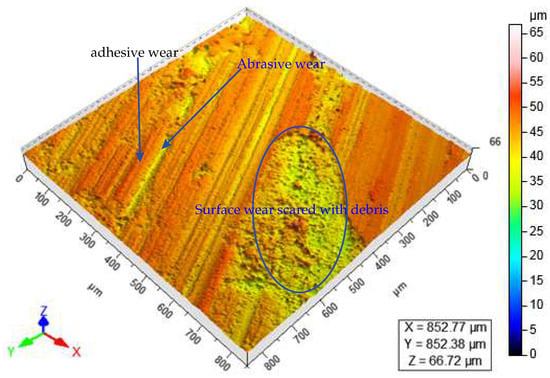
Figure 9.
Three-dimensional morphology-tested surface prepared by polishing.
4.5. Wear Analysis
The wear tests were performed for different samples that have high hardness, where the samples were analyzed at diffferent parameters such as laser beam spot diameter of 5.8 mm, laser power of 1700 W to 1900 W and scan speed of 5 mm/s. Figure 10 and Figure 11 depict the wear mass loss for different materials. The effects of normal load and sliding distance were observed on different wear values. The corresponding pressures, 0.28 MPa and 0.56 MPa, are considered for 10 N and 20 N loads, respecctively. These values are far less than the yield strength of aluminum. The results show that the loss of mass increases due to the wear in exponential ways as the distance of sliding increases from 600 m to 2400 m. Curve fittings were performed for different cases, and the coefficient of determination is close to 1, which indicates a good fitting. Fitted equations providing the loss of mass as a function of sliding distance, , are used to determine the modified Lancaster wear coefficient in Equation (6). As the sliding distance is of exponential form, the wear coefficient k also increases exponentially with the sliding distance. Interestingly, Mao et al. [39] did not observe that the exponential increment of mass loss corresponded to the sliding distance. However, the sliding distance limited to 180 m in their experiments. In the current analysis, a sliding distance up to 2400 m was considered. As the sliding distance increased, reducing the hardness due to the concentration of the alloying element decreased. Accordingly, the wear damage increases rapidly as the sliding distance increases.
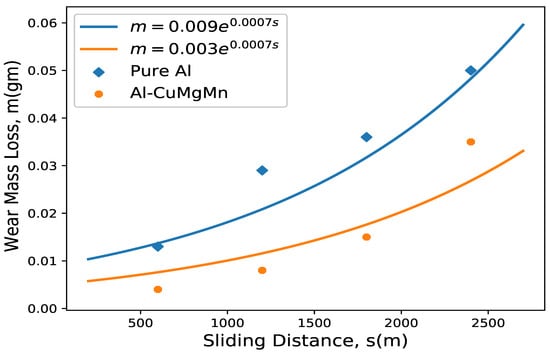
Figure 10.
Effect of sliding distance and normal load on wear mass loss for samples processed by laser power 1700 W at 10 N.
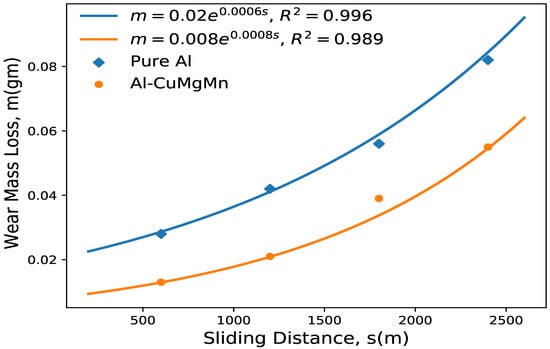
Figure 11.
Effect of sliding distance and normal load on wear mass loss for samples processed by laser power 1700 W at 20 N.
The maximum mass loss at 10 N load for pure aluminum is 0.05 gm as shown in Figure 10. For Al-CuMgMn alloy samples processed by 1700 W laser power, wear mass loss improved by 30% for 10 N normal load at 2 m/s sliding speed. A-CuMgMn alloy developed an excellent wear resistance due to the presence of copper and manganese. Doubling the normal load doubles the contact area and keeps the same pressure, as such, the wear doubles, as shown in Figure 11. On the other hand, increasing the normal load by twofold increases the wear mass loss by 1.4–3.2 times. This affirms that, in a statistical sense, the wear is proportional to normal load. Consequently, there are a number of noise factors, such as varying wear behaviors of material, surface topography, micro-hardness, etc. However, the asperity-based model is only able to make predictions about average behavior.
Table 3 shows the calculated modified Lancaster wear coefficient for different laser-surface-alloyed materials at 10 N and 20 N loads. The wear coefficient of the materials increases when the sliding distance is increased. However, the wear coefficient is reduced when the normal load is doubled. For pure aluminum, the wear coefficient increases from 3.59 × 10 to 12.66 × 10 mm/N.m for 10 N load when the sliding distance increases from 200 to 2400 m. When the load is doubled, the wear coefficient increases from 3.18 × 10 to 9.38 × 10 mm/N.m, as shown Figure 12.

Table 3.
The wear coefficient K (10 mm/N.m.) when compared with substrate material.
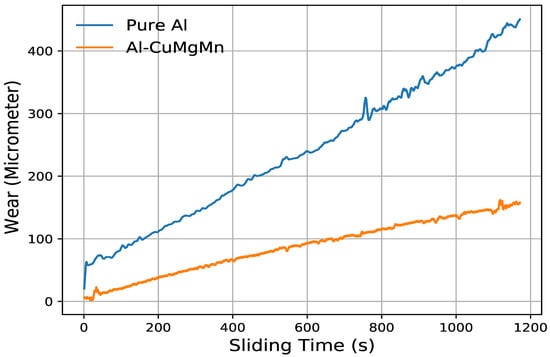
Figure 12.
Online wear values of laser-surface-alloyed samples and aluminum for 20 N normal load and 2 m/s sliding speed.
4.6. Analysis of the Coefficient of Friction
The coefficient of friction at a normal load of 20 N and sliding speed of 2 m/s is plotted in Figure 13. The plot shows initial peaks followed by stable zones. This is an indication of static coefficient of friction being more than dynamic coefficient of friction. The wavy nature of the coefficient of friction is an indication of the stick-slip phenomenon as well as the role played by the debris due to wear action. In some cases, the coefficient of friction reduced with an increase in sliding speed, but this is not always the case. Increase in the sliding speed increases the temperature and softens the material. Softening of the material helps to the reduce the coefficient of friction due to the heat and can provide lubrication behavior in the form of the oxidation film. Except for one experimental datum, the coefficient of friction is reduced with temperature at constant loads. The reproducibility of the experiments were tested by taking the measurements for the five cycles. An increment coefficient of friction was also observed by Nath et al. [40,41] as the result of the alloying of aluminum with NiCr+CO+WC+ (where the ratio of 15:70:70 by weight). The asperity model shows that softer materials have less frictional resistance; as the hardness decreases, the plasticity index increases causing a decrease in the coefficient of friction. However, at 1 m/s, the coefficient of friction is the highest for the Al-CuMgMn processed at 1900 W power. This anomalous behavior may be due to considerably more wear at this speed, producing more debris that gets entrapped in the softer pin and makes it harder. At the same time, lubricating oxide layers are also broken down, which contributes to the increase in friction. The asperity-based model predicts slight reduction in the coefficient of friction with increasing normal load. This may cause the reduction in wear coefficient too; however, at the range of applied loads, the reduction should be much smaller than what is observed here. The asperity-based model based on the assumption of homogeneity is not enough to model the coefficient friction.
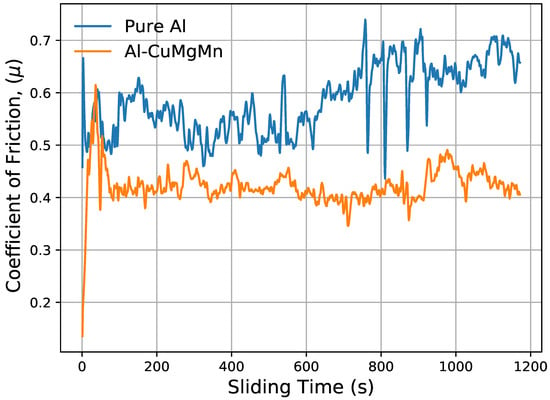
Figure 13.
Comparison of coefficient of friction for substrate material and laser-surface-alloyed samples when 20 N load and 2 m/s sliding speed are used.
5. Conclusions
Laser surface alloying of commercial pure aluminum with copper, magnesium, manganese and their combination was successfully carried out. The following concluding remarks are drawn from this research work:
- When the laser power is increased by 12%, the alloy depth increased by 15.6% for Al-CuMgMn alloy.
- When laser power was increased by 12%, the micro-hardness of the laser-surface-alloyed samples reduced by 35–38%.
- The hardness of the commercially pure aluminum was 30 HV. After laser surface alloying, maximum hardness was achieved for 1700 W laser power. The average micro-hardness value at this laser power was 189 HV for Al-CuMgMn alloy.
- It was observed that laser surface alloying increased the wear resistance. For laser-surface-alloyed samples processed by 1700 W laser power, wear mass loss improved by 30% for 10 N normal load at 2 m/s sliding speed.
- A twofold increase in the normal load increases the wear mass loss by 1.4–3.2 times. This affirms that, in a statistical sense, the wear is proportional to normal load.
Author Contributions
Conceptualization, M.A.T. and M.G.J.; methodology, M.A.T.; software, M.A.T.; validation, M.A.T., M.G.J. and H.G.L.; formal analysis, M.A.T.; investigation, M.A.T.; resources, M.A.T.; data creation, M.A.T.; writing-original draft preparation, M.A.T. and M.G.J.; writing-review and editing, M.A.T.; visualization, M.A.T.; supervision, M.A.T.; project administration, M.A.T.; funding acquisition, H.G.L. All authors have read and agreed to the published version of the manuscript.
Funding
This research was partly done through the NORHED II project INDMET grant (grant nr. 62862) cooperation whose grant support is highly acknowledged. The authors will also gratefully acknowledge the financial support provided by the Publication Fund of the University of Stavanger for open access publication.
Institutional Review Board Statement
Not applicable.
Informed Consent Statement
Not applicable.
Data Availability Statement
Not applicable.
Conflicts of Interest
The authors declare that there is no conflict of interests regarding the publication of this paper.
References
- Aboulkhair, N.; Simonelli, M.; Parry, L.; Ashcroft, L.; Tuck, C.; Hague, R. 3D printing of Aluminium alloys: Additive Manufacturing of Aluminium alloys using selective laser melting. J. Prog. Mater. Sci. 2019, 1018, 311–320. [Google Scholar] [CrossRef]
- Nimura, K.; Sugawara, T.; Jibiki, J.; Ito, S.; Shima, M. Surface modification of aluminum alloy to improve fretting wear properties. J. Tribol. Int. 2016, 93, 702–708. [Google Scholar] [CrossRef]
- Rao, N.; Das, S. Effect of applied pressure on the tribological behavior of SiCp reinforced AA2024 alloy. J. Tribol. Int. 2011, 44, 454–462. [Google Scholar] [CrossRef]
- Bartkowski, A.; Bartkowska, D.; Popławski, M.; Piasecki, A.; Przestacki, D.; Miklaszewski, A. Microstructure, Microhardness, Corrosion Resistance and Chemical Composition of Mo, B and Mo-B Coatings Produced Using Laser Processing. J. Mater. 2020, 13, 3249. [Google Scholar] [CrossRef] [PubMed]
- Kotlan, V.; Hamar, R.; Pánek, D. Combined heat treatment of metal materials. COMPEL 2018, 35, 1450–1459. [Google Scholar] [CrossRef]
- Bartkowski, D.; Bartkowska, A.; Popławski, M.; Przestacki, D. Microstructure, microhardness, corrosion and wear resistance of B, Si and B-Si coatings produced on C45 steel using laser processing. Metals 2020, 10, 792. [Google Scholar] [CrossRef]
- Przestacki, D.; Kukliński, M.; Bartkowska, A. Influence of laser heat treatment on microstructure and properties of surface layer of Waspaloy aimed for laser-assisted machining. Int. J. Adv. Manuf. Technol. 2017, 93, 3111–3123. [Google Scholar] [CrossRef]
- Sroka, M.; Onda, E.; Pakieła, W. Laser Surface Modification of Aluminium Alloy AlMg9 with B4C Powder. J. Mater. 2020, 13, 402. [Google Scholar] [CrossRef]
- Sahoo, K.; Sahu, J.; Masanta, M. Effect of Pulsed Nd: YAG Laser Parameters in Preplaced TiC Coating on Aluminum Substrate, Lasers Based Manufacturing; Joshi, N., Dixit, S., Eds.; Springer: New Delhi, India, 2015. [Google Scholar]
- Chwalczuk, T.; Przestack, D.; Szablewski, P.; Felusiak, A. Microstructure characterisation of Inconel 718 after laser assisted turning. MATEC Web Conf. 2018, 188, 1–5. [Google Scholar] [CrossRef]
- Majumdar, D.; Chandra, R.; Nath, K.; Manna, I. Compositionally graded SiC dispersed metal matrix composite coating on Al by laser surface Engineering. J. Mater. Sci. Eng. A 2006, 433, 241–250. [Google Scholar] [CrossRef]
- Hilgenberg, K.; Steinhoff, K. Texturing of skin-pass rolls by pulsed laser dispersing. J. Mater. Process Technol. 2015, 225, 84–92. [Google Scholar] [CrossRef]
- Vilar, R. Laser alloying and laser cladding. J. Mater. Sci. Forum 1999, 301, 229–252. [Google Scholar] [CrossRef]
- Wu, X. In situ formation by laser cladding of a TiC composite coating with a gradient distribution. J. Surf. Coat. Technol. 1999, 115, 111–115. [Google Scholar] [CrossRef]
- Masanta, M.; Ganesh, P.; Kaul, R.; Nath, K.; Choudhury, R. Development of a hard nano-structured multi-component ceramic coating by laser cladding. J. Mater. Process Technol. 2009, 508, 134–140. [Google Scholar] [CrossRef]
- Kukliski, M.; Bartkowska, A.; Przestacki, D. Microstructure and selected properties of Monel 400 alloy after laser heat treatment and laser boriding using diode laser. Int. J. Adv. Manuf. Technol. 2018, 98, 3005–3017. [Google Scholar] [CrossRef]
- Savalani, M.; Ng, C.; Li, Q.; Man, H. In situ formation of titanium carbide using titanium and carbon-nanotube powders by laser cladding. J. Appl. Surf. Sci. 2012, 258, 3173–3177. [Google Scholar] [CrossRef]
- Dubourg, L.; Pelletier, H.; Vaissiere, D.; Hlawka, F.; Cornet, A. Mechanical characterization of laser surface alloyed aluminium-copper systems. J. Wear 2002, 253, 1077–1085. [Google Scholar] [CrossRef]
- Popoola, A.; Pityana, S.; Popoola, O. Laser deposition of (Cu + Mo) alloying reinforcements on AA1200 substrate for corrosion improvement. Int. J. Electrochem. Sci. 2011, 6, 5038–5051. [Google Scholar]
- Tomida, S.; Nakata, K.; Saji, S.; Kubo, T. Formation of metal matrix composite layer on aluminum alloy with TiC-Cu powder by laser surface alloying process. J. Surf. Coat. Technol. 2001, 142, 585–589. [Google Scholar] [CrossRef]
- Rajamure, R.; Vora, H.; Gupta, N.; Karewar, S.; Srinivasan, G.; Dahotre, N. Laser surface alloying of molybdenum on aluminum for enhanced wear resistance. J. Surf. Coat. Technol. 2014, 258, 337–342. [Google Scholar] [CrossRef]
- Kim, J.; Peng, Y. Melt pool shape and dilution of laser cladding with wire feeding. J. Mater. Process Technol. 2000, 104, 284–293. [Google Scholar] [CrossRef]
- Wendt, U.; Settegast, S.; Grodrian, I. Laser alloying of aluminum with titanium wire. J. Mater. Science Lett. 2003, 22, 1319–1322. [Google Scholar] [CrossRef]
- Pinto, M.; Cheung, N.; Ierardi, M.; Garcia, A. Microstructural and Hardness Investigation of an Aluminum-Copper Alloy Processed by Laser Surface Melting. J. Mater. Charact. 2003, 50, 249–253. [Google Scholar] [CrossRef]
- Li, z.; Yan, H.; Zhang, B.; Guo, J.; Yu, Z.; Ringsberga, J. Improving surface resistance to wear and corrosion of nickel-aluminum bronze by laser-clad TaC/Co-based alloy composite coatings. J. Surf. Coat. Technol. 2021, 405, 1–15. [Google Scholar] [CrossRef]
- Ignat, S.; Salamander, P.; Grevey, G.; Lambert, M. Magnesium alloys Laser (Nd: YAG) cladding and alloying with side injection of aluminum powder. J. Appl. Surf. Sci. 2004, 225, 124–134. [Google Scholar] [CrossRef]
- Lesyk, D.; Martinez, S.; Dzhemelinskyy, V.; Lamikiz, A.; Mordyuk, B. Surface microrelief and hardness of laser hardened and ultrasonically peened AISI D2 tool steel. J. Surf. Coat. Technol. 2015, 278, 108–120. [Google Scholar] [CrossRef]
- Meka, R.; Chauhan, A.; Steiner, T.; Bischoff, E.; Ghosh, P.; Mittemeijer, J. Generating duplex microstructures by nitriding; nitriding of iron based Fe-Mn alloy. J. Surf. Coat. Technol. 2016, 32, 883–889. [Google Scholar] [CrossRef]
- Ravnikara, N.; Dahotreb, N.B.; Gruma, J. Laser coating of aluminum alloy EN AW 6082-T651 with TiB2 and TiC: Microstructure and mechanical properties. J. Appl. Surf. Sci. 2013, 282, 914–922. [Google Scholar] [CrossRef]
- Yang, Z.; Hao, H.; Gao, Q.; Hana, C.; Qi, H. Strengthening mechanism and high-temperature properties of H13 + WC/Y2O3 laser-cladding coatings. J. Surf. Coat. Technol. 2021, 405, 240–253. [Google Scholar] [CrossRef]
- Zhong, Z.; Liu, W. Laser surface cladding: The state of art and challenges. Proceeding of Institution of Mechanical Engineers. Part C. J. Mech. Eng. Sci. 2010, 224, 1041–1060. [Google Scholar] [CrossRef]
- Modlinski, R.; Puer, R.; Wolf, I. AlCuMgMn micro-tensile samples: Mechanical characterization of MEMS materials at micro-scale. J. Sens. Actuators A Phys. 2008, 143, 120–128. [Google Scholar] [CrossRef]
- Ogunlana, O.; Akinlabi, T. Surface Effect of Laser Power on Microstructural Evolution and Hardness Behaviour of Titanium Matrix Composites. In Proceedings of the World Congress on Engineering, London, UK, 29 June 2016; Volume 2, pp. 23–35. [Google Scholar]
- Lancaster, J. The influence of substrate hardness on the formation and endurance of molybdenum disulphide films. J. Wear 1967, 10, 103–117. [Google Scholar] [CrossRef]
- Labisz, K. Microstructure and mechanical properties of high power diode laser (HPDL) treated cast aluminium alloys. Materialwiss. Werkstofftech 2014, 45, 314–324. [Google Scholar] [CrossRef]
- Lee, H.; Choi, S.; Yoon, T.; Kang, C. Microstructure and hardness of surface melting hardened zone of mold steel, SM45C using Yb:YAG disk laser. J. Weld. Join. 2016, 34, 75–81. [Google Scholar] [CrossRef]
- ASTM Standard G 99. Standard Test Method for Wear Testing Using a Pin on Disk Apparatus; ASTM PK: Washington, DC, USA, 1995. [Google Scholar]
- Pirso, J.; Viljus, M.; Letunovits, S. Sliding wear of TiC-NiMocermets. J. Tribol. Int. 2004, 37, 817–824. [Google Scholar] [CrossRef]
- Mao, M.; Peng, L.; Yi, P.; Lai, X. Modeling of the friction behavior in metal forming process considering material hardening and junction growth. ASME J. Tribol. 2016, 138, 1–18. [Google Scholar] [CrossRef]
- Nath, S.; Pityana, S.; Majumdar, J. Laser surface alloying of aluminium with WC + Co + NiCr for improved wear resistance. J. Surf. Coat. Technol. 2012, 138, 323–334. [Google Scholar] [CrossRef]
- George, E. Handbook of Aluminum; Physical Metallurgy and Processes: Canberra, Australia, 2003. [Google Scholar]
Publisher’s Note: MDPI stays neutral with regard to jurisdictional claims in published maps and institutional affiliations. |
© 2021 by the authors. Licensee MDPI, Basel, Switzerland. This article is an open access article distributed under the terms and conditions of the Creative Commons Attribution (CC BY) license (https://creativecommons.org/licenses/by/4.0/).