Article

Effect of Cooling Rate on Hardness and Phase Transformation of a Pd-Ag-Based Metal–Ceramic Alloy with or without Ice-Quenching

Department of Dental Materials, Dental and Life Science Institute, School of Dentistry, Pusan National University, Beomeo-Ri, Mulgeum-Eup, Yangsan 626-814, Korea
*
Author to whom correspondence should be addressed.
Metals 2021, 11(5), 680; https://doi.org/10.3390/met11050680
Submission received: 1 April 2021 / Revised: 16 April 2021 / Accepted: 18 April 2021 / Published: 21 April 2021
(This article belongs to the Special Issue Heat Treatment and Mechanical Properties of Metals and Alloys)

Abstract

:
The aim of this study was to investigate the effect of cooling rate on the hardness and phase transformation of a Pd-Ag-based metal–ceramic alloy with or without ice-quenching. A total of 28 test specimens, in an as-cast state, were fabricated. A multiple firing simulation was performed on the randomly selected specimens (n = 3/group) in a porcelain furnace; each firing was followed by cooling at the relatively low or high cooling rate. In addition, ice-quenching after oxidation was introduced before the normal firing process (n = 3/group). Microhardness, microstructure, phase transformation and elemental distribution were observed. Oxidation followed by ice-quenching allowed the alloy to be in a homogenized state. On the other hand, the oxidation-treated specimens followed by cooling at relatively high or low cooling speeds showed much higher hardness than the ice-quenched specimen after oxidation, which was resulted from the formation of the metastable precipitates based on the InPd3 phase with tetragonal structure. The hardness of ice-quenched alloy after oxidation was recovered in the very next firing step at both the relatively high and low cooling rates. In all specimens, the Pd-rich matrix and the InPd3-based precipitates were observed. The hardness of a Pd-Ag-based metal–ceramic alloy with and without ice-quenching depended on the cooling rate during the firing process.

1. Introduction

Metal–ceramic alloy, used for the manufacture of dental prosthesis, functions as a substructure for porcelain to compensate for its fragile characteristics [1]. It is critical that the metal substructure does not sag or distort during repetitive porcelain firing at approximately 1000 °C. Pd-Ag-based alloy is a metal with a high melting range and is used as one of the metal–ceramic alloys for the fabrication of metal–ceramic prosthesis. Pd-Ag-based alloys, which are a substitute for Au-based metal–ceramic alloys, are generally composed of 50 to 60 wt% Pd, 30 to 40 wt% Ag, and some trace elements to facilitate bonding with porcelain. Pd-Ag-based alloys have a high modulus of elasticity, excellent bonding strength with porcelain, and stability against discoloration and corrosion [2,3,4,5].
Metal substructures for metal–ceramic prosthesis are subject to a trimming process after casting to enable fitting on a master model prior to layering porcelain on top. It has been reported that the hardness of Pd-based alloys decreases during the multiple porcelain firing process [6]. On the other hand, Pd-based alloys have a relatively high hardness after casting [7], which means more time is needed to trim them. Therefore, it is advantageous to temporarily reduce the hardness of the alloy.
The decrease in hardness can be achieved effectively by performing a heat treatment for the homogenization of the alloy. Prior to layering porcelain on the metal substructure, the cast metal is subjected to oxidation treatment at a temperature high enough to homogenize the alloy. Thus, if the alloy is rapidly quenched in ice brine (ice-quenching, IQ) in place of the normal cooling step after oxidation, the hardness can be lowered without performing an additional heat treatment. In previous studies, the hardness of Pd-based alloys was lowered by oxidation treatment followed by ice-quenching, and recovered thereafter as firing proceeded [8,9]. Therefore, ice-quenching after oxidation was thought to be effective in softening the alloy to enable easy trimming without sacrificing the final hardness. However, the previous studies on the hardness recovery of the ice-quenched alloy were conducted at a single controlled cooling rate during multiple firing. In clinical practice, it is difficult to continuously control the cooling rate. Hence, it is necessary to confirm the hardness recovery at various cooling rates during multiple firing.
Our previous study with a Pd-Ag-based alloy showed that the final hardness varies depending on the cooling rate during the firing process [10]. Based on these results, we hypothesize that the hardness recovery pattern of an ice-quenched specimen depends on the cooling rate during the subsequent firing process. For the ice-quenched Pd-Ag-based alloy, the pattern of hardness recovery according to the cooling rate during multiple firing has not yet been reported. The aim of this study was to investigate the effect of the cooling rate on hardness and the related phase transformation of a Pd-Ag-based metal–ceramic alloy with or without ice-quenching.

2. Materials and Methods

2.1. Specimen Preparation

For sample preparation, a Pd-Ag-In-Sn-Zn-Ga-Ru alloy was used (Aurolite 55, Aurium Research, San Diego, CA, USA; Table 1). The molten range of the alloy was 1170–1265 °C. The alloy casting was carried out at 1370 °C. Seven plate-like specimens (10 × 10 × 0.75 mm) were cast (10 g) by using a phosphate-based investment and an electronic centrifugal casting machine (Millennium R-HD, Reddish stone, Pinerolo, Italy). These plate-like specimens were polished using silicon carbide (SiC) sandpaper (800 and 1200 grit). The polished specimens were then cut using a diamond disc (thickness = 0.25 mm) to obtain 28 test specimens (4.8 × 4.8 × 0.55 mm).

2.2. Hardness Testing and Firing Simulation

The 28 test specimens, in an as-cast state, were subjected to a hardness test after mirror polishing. Thereafter, test specimens were arbitrarily selected to simulate porcelain firing (Figure 1). A Vickers microhardness tester (MVK-H1, Akashi, Japan) was used to obtain seven indents for each specimen. Vickers hardness values were obtained at 300 gf load, and the dwell time was 10 s.
Multiple firing simulation was performed on the specimen in a porcelain furnace (Multimat 2 torch, Dentsply, Bensheim, Germany) without porcelain, according to the firing schedule (Table 2) of the dental porcelain (Vintage MP, Shofu, Kyoto, Japan), with a coefficient of thermal expansion similar to that of the used specimen.
The test specimens were reused after each firing step (n = 3/group) during the firing simulation; each firing was followed by cooling to 650 °C at the relatively low (Stage 3; S3) or high (Stage 0; S0) cooling rate among the four cooling rates listed in Table 3. Then, the specimens were bench cooled naturally. In addition, the cooling rates of Stage 0′ and Stage 3′ (S0′ and S3′: ice-quenching after oxidation and then cooling at S0 and S3 during subsequent firing, respectively) were added (n = 3/group). The sample labels are provided in Table 4. The hardness of the ice-quenched specimens after the final step (glaze) was also measured (n = 1/group).

2.3. Field Emission Scanning Electron Microscopy (FE-SEM)

FE-SEM (JSM-6700F, JEOL, Akishima, Japan) observation was carried out (n = 3/group, n = 1/group for the ice-quenched sample after the final step) at 15 kV by reusing the hardness-measured specimens. For FE-SEM observation, the specimens were mirror polished and etched in an etchant containing 10% potassium cyanide (KCN) and 10% ammonium persulfate ((NH4)2S2O8).

2.4. X-ray Diffraction (XRD)

Phases in the firing-simulated specimens were analyzed (n = 3/group) using high-resolution X-ray diffraction (HRXRD, X’Pert3-powder, PANalytical, EA Almelo, Netherlands) at 40 kV and 30 mA, with a scanning step of 2θ = 0.013°. Cu Kα radiation and Ni-filter was used. All specimens were tested by reusing after FE-SEM observation.

2.5. Field Emission Electron Probe Microanalysis (FE-EPMA)

Element distribution was analyzed (n = 1/group) by both mapping and spot analysis (probe size = 0.1 μm) using a field emission electron probe microanalyzer (JXA-8530F, JEOL, Akishima, Japan). The accelerating voltage was 15 kV. All specimens were tested by reusing after FE-SEM observation.

2.6. Statistics

Variations in the obtained hardness values were evaluated by repeated measure ANOVA (RMANOVA) using SPSS 23.0 (Statistical Product and Service Solutions 23.0, IBM Co., Armonk, NY, USA) (α = 0.05). The normality was analyzed using the Shapiro–Wilk test, and the homogeneity of variance was analyzed using the Levene test. For multiple comparisons, the Tukey HSD test and tests of the within-subject contrasts were used [11]. RMANOVA was verified using Mauchly’s sphericity test [12].

3. Results

3.1. Hardness Measurement (HV0.3)

To investigate the influence of cooling rate on the hardness during firing simulation, S0 and S3, which are relatively high and low cooling rates, respectively, were used among the cooling rates (Table 3) programed in the porcelain furnace. In addition, cooling rates of S0′ and S3′ (quenching into ice-brine after oxidation and then cooling at S0 and S3 during subsequent firing, respectively) were added to determine whether the hardness of the ice-quenched specimen after oxidation can be recovered during multiple firing at relatively high or low cooling rates. Changes in hardness (Figure 2) were analyzed by RMANOVA (Table 5 and Table 6); the simulated firing step and the cooling rates (S0′, S0, S3′, S3) affected the hardness (Table 5, p < 0.001). Additionally, there was a two-factor (firing step, cooling rate) interaction on the hardness (p < 0.001). Even though there was a tendency for the hardness to decrease as the firing progressed, the S0 specimens showed higher hardness than those of S3 specimens through the glaze step (p < 0.05; Figure 2, Table 6). The ice-quenched (IQ) specimens at the oxidation step showed a remarkably low hardness; however, the hardness was recovered in the next step (wash) by cooling at S0 and S3, respectively; the same hardness as that of the S0 and S3 specimens, respectively, was maintained (S0′, S3′; p < 0.05).
The hardness of the ice-quenched specimens after the final step (glaze) was also measured (Figure 2; GL-(S0′, S0, S3)IQ). As a result, the introduction of ice-quenching after glaze did not cause an apparent decrease in final hardness.

3.2. Changes in Microstructure

Figure 3 shows the microstructure of the specimens after oxidation. The as-cast specimen (As-cast) showed an equiaxed structure and contained precipitates in the grain boundary (arrow mark) and grain interior (double arrow mark). In the OX-IQ specimen, which was ice-quenched after oxidation, precipitates disappeared due to homogenization. However, by cooling the oxidation-treated specimens at S0 and S3 (OX-S0, OX-S3), precipitates formed in the grain boundary (arrow mark) and grain interior (double arrow mark). The grain boundary precipitates were similar in both the specimens, but the grain interior precipitates were much finer (less than 30%) in the OX-S0 specimen than in the OX-S3 specimen.
Figure 4 shows the microstructure of the specimens after glaze. In the S0 and S3 specimens (GL-S0, GL-S3), the grain interior precipitates were further coarsened compared to those in the oxidation step (Figure 3, OX-S0, OX-S3). The GL-S3 specimen had slightly coarser precipitates than the GL-S0. The microstructure of GL-S0′, which was ice-quenched after oxidation and then cooled at S0 up to glaze, was similar to that of the GL-S0, even though the grain interior precipitates were slightly longer.
The firing-simulated specimens were exposed to controlled cooling rates (S0′, S0, S3) up to main bake step and ice-quenched after glazing (GL-(S0′, S0, S3)IQ). As a result, the microstructure was not homogenized, showing similar microstructure to that of the specimens in Figure 4. In addition, when the GL-(S0′)IQ specimen was further treated at the glaze temperature (880 °C) for 80 min, followed by ice-quenching, the homogenization did not proceed (Figure 5).

3.3. Phase Transformation

Figure 6 and Figure 7 show the XRD results at the oxidation and glaze steps, respectively. The α phase corresponds to the face centered cubic (f.c.c.) Pd-Ag-rich phase with a lattice constant of a = 3.994 Å; the β phase corresponds to the InPd3-based phase with a tetragonal structure and lattice constants of a = 4.119 Å and c = 3.673 Å [10]. The β′ phase corresponds to the metastable InPd3-based phase that has a c/a ratio larger than that of the stable InPd3 (β) phase. The OX-IQ specimen, which was ice-quenched after oxidation, showed a nearly single phase of a f.c.c. structure. In Figure 7, all the specimens at the glaze step [GL-(S0′, S0, S3′, S3)] consisted of the matrix (α) and precipitates (β). The β phase observed in the glaze step had (002) and (202) peaks in addition to the (200) and (220) peaks, as it had a tetragonal structure. The β phase was also observed in the oxidation-treated specimen cooled at S3 (Figure 6, OX-S3). However, in the XRD pattern of OX-S3, there were additional diffraction peaks (double arrows) in the lower diffraction angle region of the (002) and (202) β peaks, which corresponded to the diffraction peaks of the metastable phase (β′) having a slightly larger lattice constant, c, than the stable β phase. In the OX-S0 specimen, the XRD peaks of the β phase were not clear, and the intensity of the diffraction peaks of the metastable phase (double arrows) was stronger than that in the OX-S3 specimen.
Figure 8 shows the results of the FE-EPMA mapping of GL-S0′ specimen. Ag was more concentrated in the matrix than in the precipitates, and the remaining elements (Pd, In, Sn, Zn and Ga) were more concentrated in the precipitates than in the matrix. Trace element Ru was hardly observed in the matrix or precipitates. The surface oxide film was polished; therefore, there was little oxygen (O) in all specimens. Figure 9 and Table 7 show the results of the FE-EPMA spot analysis for the GL-S0′ and GL-S3 specimens. Even though Pd was abundant in both the matrix and precipitates, the Pd content was higher in the precipitates than in the matrix, as was that of the remaining elements except Ag.
From XRD (Figure 7) and FE-EPMA (Table 7) of the specimens at the glaze step, the matrix was confirmed to be the f.c.c. Pd-Ag-rich phase and a lattice constant of a = 3.994 Å; the precipitates were the InPd3-based phase with a tetragonal structure and lattice constants of a = 4.119 Å and c = 3.673 Å [10].

4. Discussion

To investigate the effect of cooling rate on the hardness of a Pd-Ag-based metal–ceramic alloy with or without ice-quenching, the hardness at each firing step was measured. The specimen in the as-cast state was homogenized by oxidation treatment, and the homogenized state was maintained at room temperature by ice-quenching (Figure 3 and Figure 6). On the other hand, by oxidation and then cooling at a relatively high (S0) or low (S3) cooling rate (OX-S0, OX-S3), hardening by precipitation occurred (Figure 2 and Figure 3). In particular, the rapidly cooled specimens (S0) showed an 8% higher hardness through the glaze step (p < 0.05), indicating that the optimum cooling rate to maintain a high hardness has a relatively high value (S0). Although the lowest hardness was obtained with the ice-quenched specimens after oxidation (p < 0.05), the hardness of the ice-quenched specimen was recovered in the very next firing step at both the relatively high and low cooling rates, with a greater increase in hardness observed at a higher cooling rate. The recovered hardness value did not exceed those of the non-quenched specimens at both cooling rates through the glaze step (p < 0.05). From the above, it can be determined that oxidation followed by ice-quenching reduced the hardness temporarily without sacrificing the final hardness at both, the relatively high and low cooling rates (p < 0.05). In previous studies that used a single cooling rate, such a recovery of hardness was observed in Pd−Au and Pd−Cu alloys, as well as in Pd-Ag alloy [8,9,13]. In particular, in Pd−Cu alloys, the final hardness far exceeded that of the non-quenched alloy [13].
XRD was performed to investigate the phase transformation according to the multiple firing simulation of each specimen. All the specimens at the glaze step (GL-(S0′, S0, S3′, S3)) consisted of the Pd-rich matrix (α) and InPd3-based precipitates (β) of tetragonal structure regardless of cooling rate and ice-quenching after oxidation (Figure 7). However, XRD patterns at the oxidation step (OX-(S0, S3)) show a metastable InPd3-based phase (β′) that has a c/a ratio larger than that of the stable InPd3 phase (Figure 6, double arrows). Particularly, in case of OX-S3, which was cooled at a lower cooling rate, the diffraction peaks for the metastable and stable InPd3 phases coexisted, indicating that the precipitated phase was transforming from the metastable phase to the stable phase (Figure 6). Such a precipitation of the metastable phase before the formation of a stable phase minimizes the gap in the lattice constant between the matrix and the precipitates with different crystal structures, and lowers the interphase boundary energy [14].
The oxidation-treated specimens that were then cooled at a relatively high or low cooling rate showed much higher hardness than the ice-quenched specimen after oxidation. In the OX-(S0, S3) specimens (Figure 6), the full width at half maximum (FWHM) of the diffraction peaks for the α phase (matrix) increased compared to that in the homogenized specimen by ice-quenching after oxidation (OX-IQ). This indicated that a coherency strain field was generated at the interface between the matrix and the metastable precipitates owing to the slight gap between their lattice constants [15], resulting in a significant increase in hardness (p < 0.05). Such hardening through the formation of a metastable phase has been reported in several Pd-Ag-based metal–ceramic alloys [10,16], as well as in dental Au-based alloys that form a tetragonal AuCu I phase [17,18]. The relatively lower hardness of OX-S3 than that of OX-S0 must be resulted from the fact that the coherency strain field was released to some extent as the precipitates composed of the stable phase grew at the expense of the fine precipitates composed of the metastable phase [19].
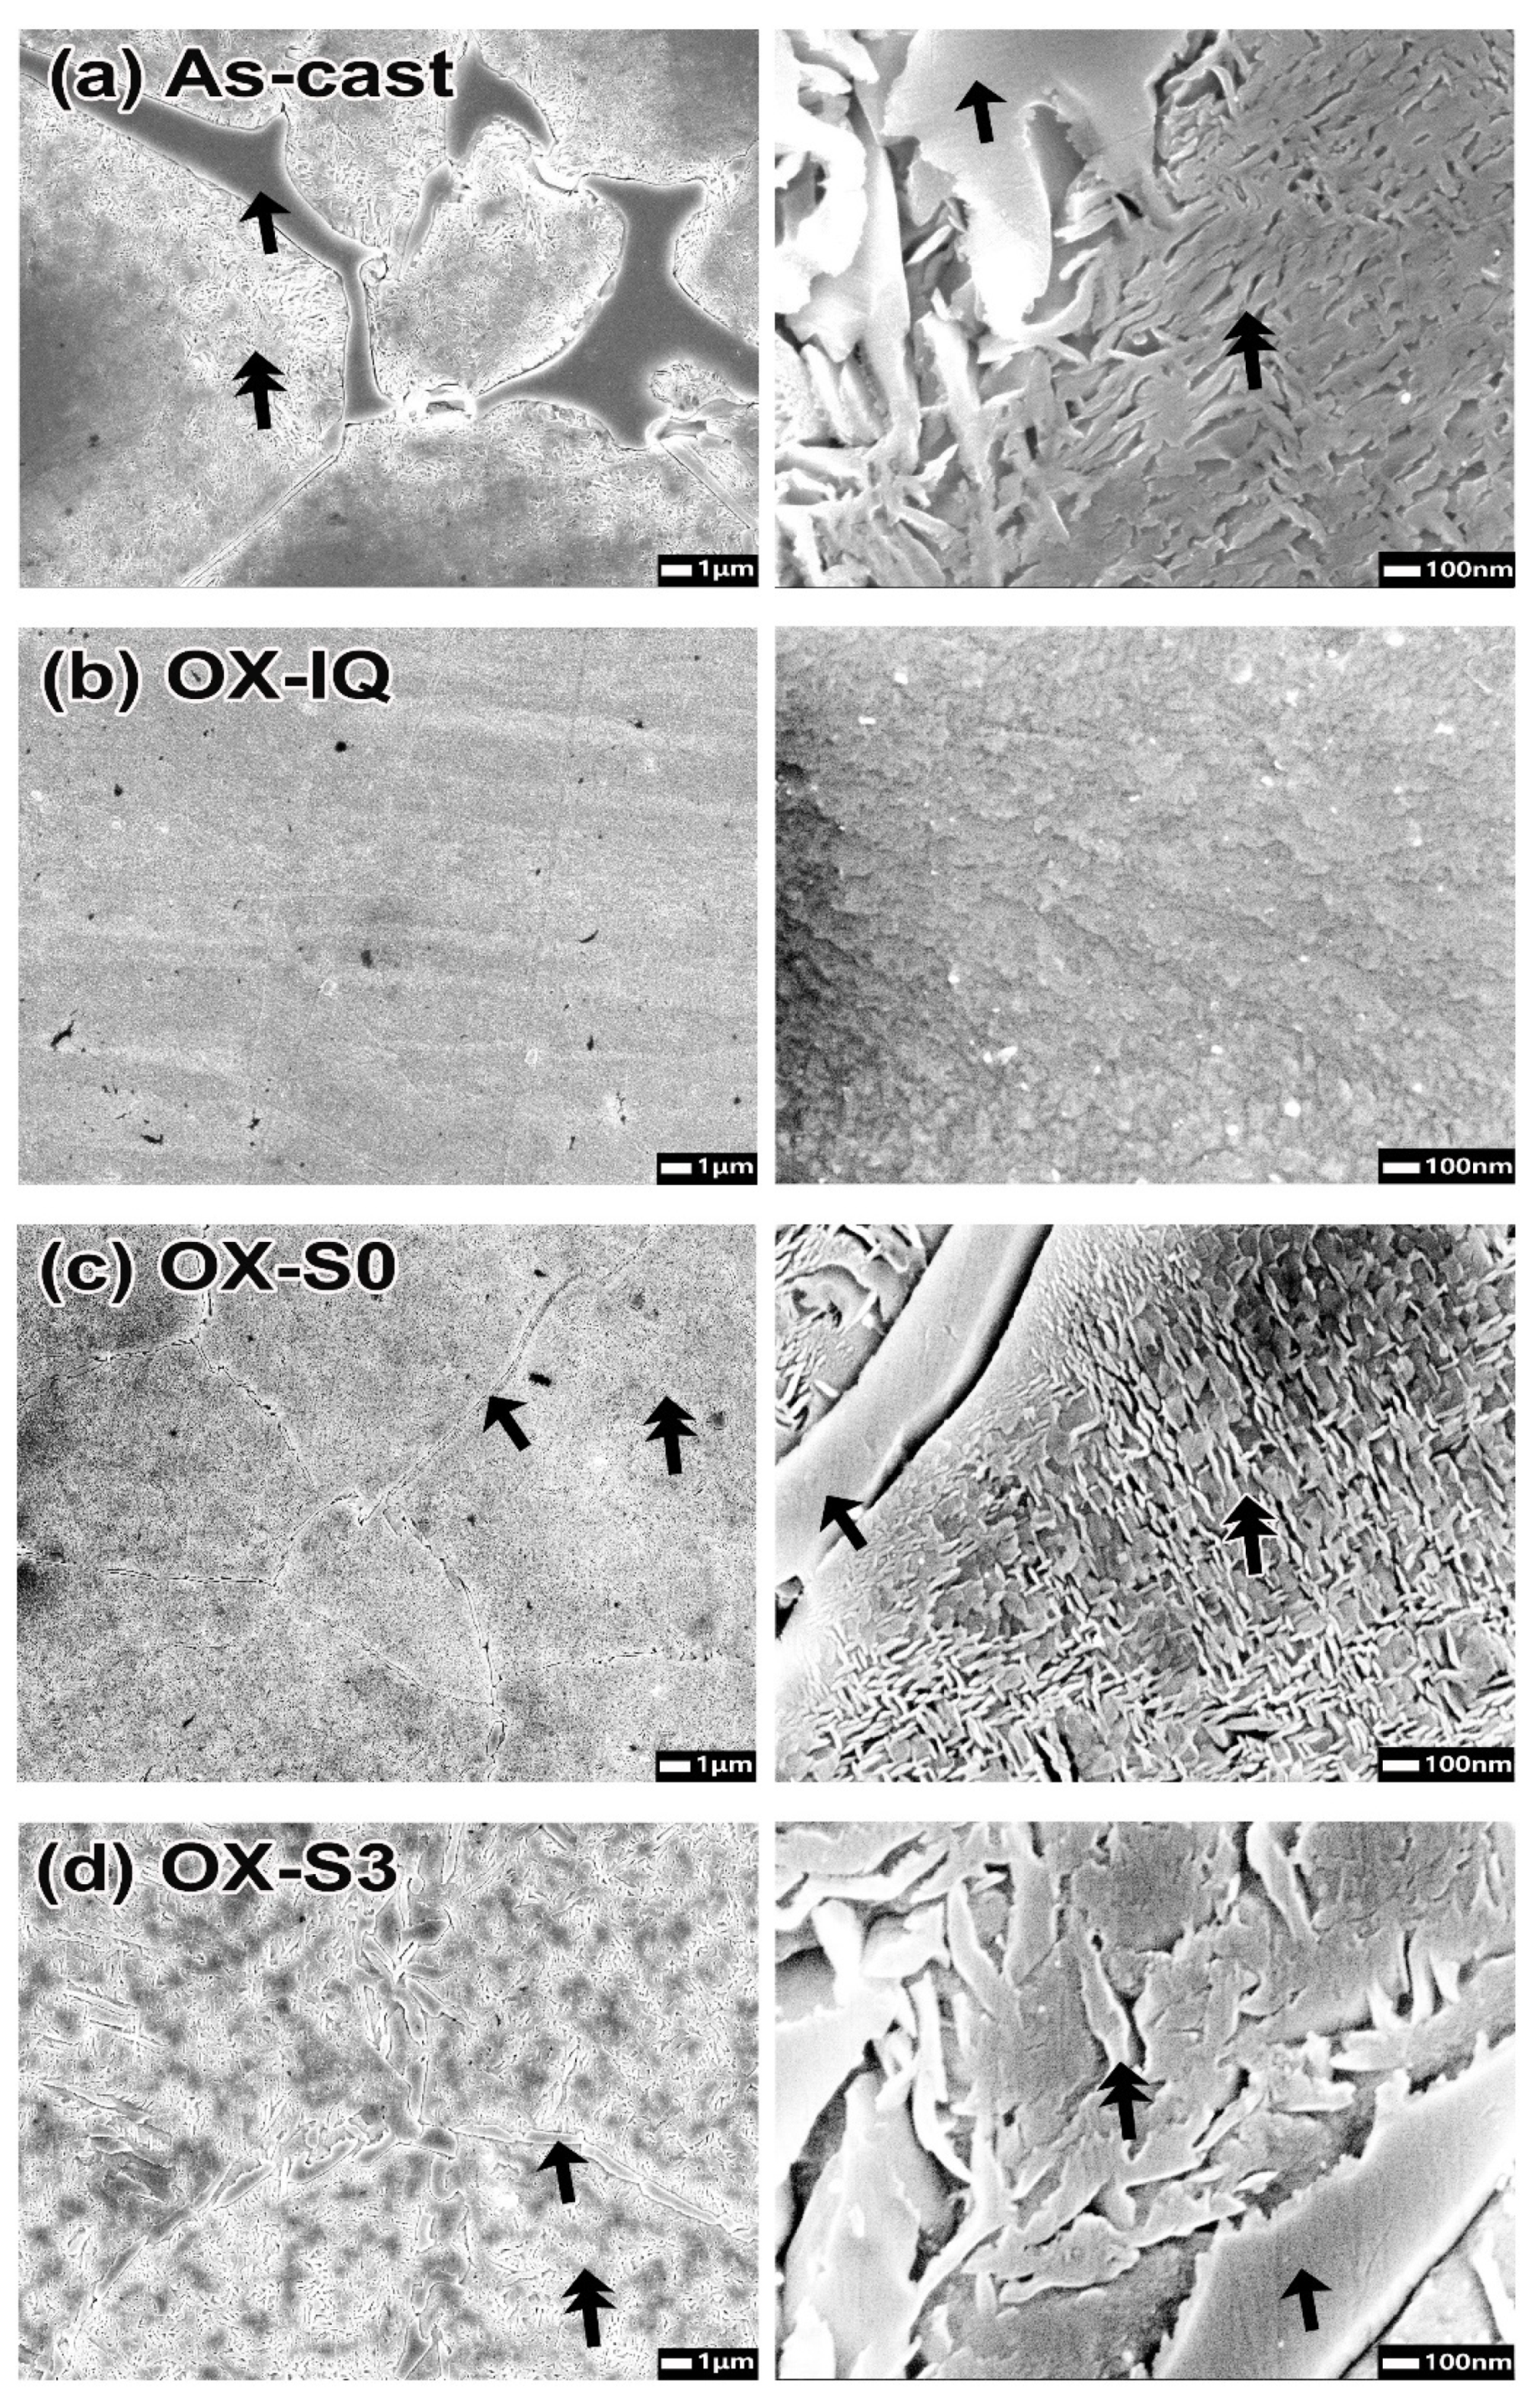
There was a tendency for the hardness to decrease as the firing progressed. In the microstructure of each specimen at the glaze step (Figure 4), the precipitates were coarser than those in the oxidation step. Among the specimens at the glaze step, the GL-S3 specimen, which exhibited a lower hardness, had slightly coarser precipitates than those of the GL-(S0′, S0) specimens. The XRD patterns at glaze step revealed that these precipitates consist of only the stable phase. Therefore, the increased gap between the c-axis lattice constant of the matrix and that of the precipitates composed of the stable phase led to a loss of coherency strain by introducing interface dislocations, which contributed to a decrease in hardness [19,20,21]. In addition, the progress of coarsening of the precipitates reduced the interface between the matrix and precipitates, reducing lattice distortion and lowering the hardness [20].
The general firing schedule for bonding porcelain starts at approximately 1000 °C and goes through several steps [22,23]. In order to prevent the deformation of the porcelain superstructure in the next firing step with a new porcelain layer, the firing temperature is gradually lowered for each step. The firing schedule implemented in this study was applied to porcelain powder with a coefficient of thermal expansion close to that of the used specimen, starting at 1040 °C for the oxidation step and ending at 880 °C in the final glaze step. In this study, the introduction of ice-quenching after glazing did not result in a significant decrease in hardness compared to that of the non-quenched specimens after glazing (Figure 2; GL-(S0′, S0, S3)IQ). This is possibly attributed to the fact that the temperature for the glaze step was not high enough to homogenize the specimen alloy. To validate this, the GL-(S0′)IQ specimen was further treated at the glaze temperature (880 °C) for 80 min, but homogenization did not occur (Figure 5). In previous study with 60.55 Pd-27.72 Ag-6.12 In-2.24 Sn-3.21 Ga-0.16 Ru (at%) alloy [10], the homogenization proceeded during glazing at 930 °C, showing apparent hardening while cooling after glazing, unlike the results of this study. Considering that the specimen alloy in this study showed remarkable hardening while cooling at the oxidation temperature (1040 °C), it can be said that the influence of the cooling rate on the hardness became stronger when the specimen was in a homogenized state before cooling.
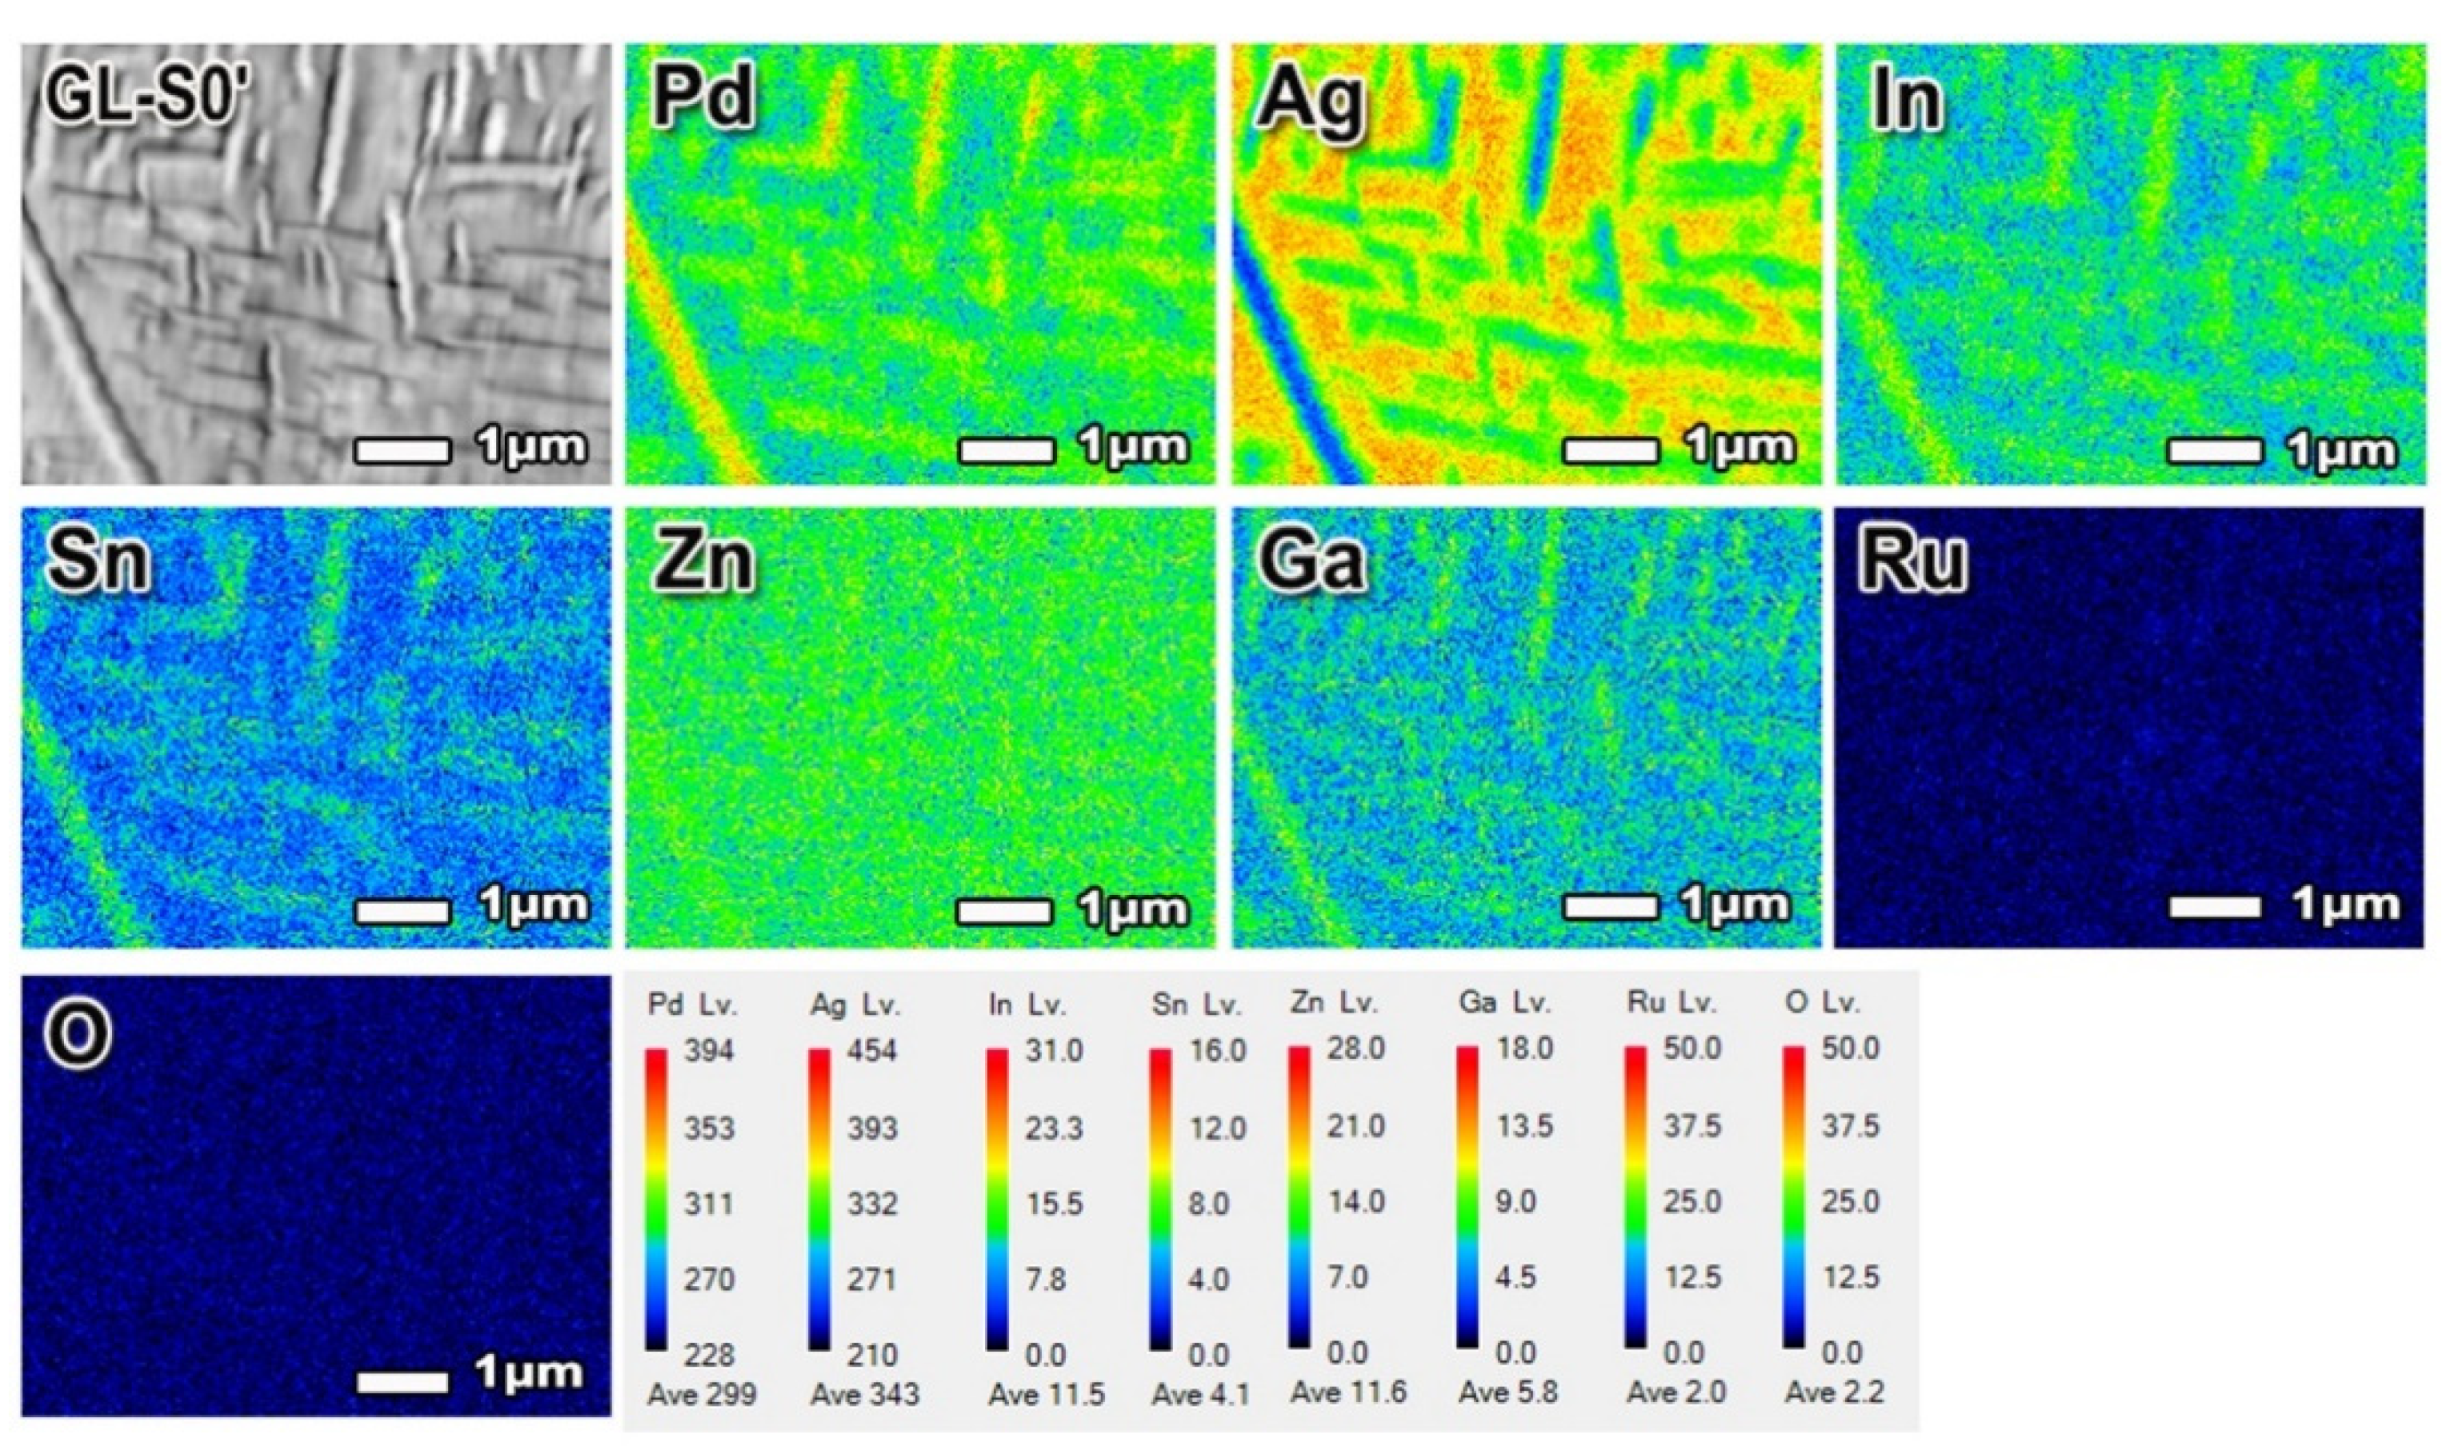
In this study, the homogenized specimen at an oxidation temperature was separated into the Pd-rich matrix and the InPd3-based precipitates during cooling process, which corresponded to the precipitation reaction presented in the phase diagram of the In–Pd binary system. In the phase diagram, the Pd content must be approximately 85 at% or higher for the alloy to be homogenized at 1040 °C [24]. Even though the Pd content was only 55.2 at% in the specimen alloy, a large amount of Ag contained in alloy made it possible by substituting Pd, as shown in the FE-EPMA results (Table 7). This trend was also reported in several Pd-Ag-based alloys [10,25].
In this study, the oxide layer that formed on the alloy specimen was removed by polishing for the hardness test. Therefore, the effect of ice-quenching after oxidation on the degree of oxide film formation could not be detected. Nevertheless, the effect seems to be weak, as sandblasting is usually suggested by the manufacturer for Pd-Ag-based alloys to remove the over-produced oxide layer after oxidation.

5. Conclusions

Oxidation followed by ice-quenching allowed the alloy to be in a homogenized state. The oxidation-treated specimens followed by cooling at relatively high or low cooling speeds showed much higher hardness than the ice-quenched specimen after oxidation, which was resulted from the formation of the metastable precipitates based on the InPd3 phase with tetragonal structure. The hardness of ice-quenched alloy after oxidation was recovered in the very next firing step at both, the relatively high and low cooling rates. In all specimens, the Pd-rich matrix and the InPd3-based precipitates were observed after the final step (glaze).

Author Contributions

Experiment and writing, H.-J.S. (Hye-Jeong Shin); review, Y.-H.K. Writing—review and supervision, H.-J.S. (Hyo-Joung Seol). All authors have read and agreed to the published version of the manuscript.

Funding

This research was supported by Basic Science Research Program through the National Research Foundation of Korea (NRF) funded by the Ministry of Education, Science and Technology (grant number: NRF-2017R1D1A1B03030705).

Institutional Review Board Statement

Not applicable.

Informed Consent Statement

Not applicable.

Data Availability Statement

Not applicable.

Conflicts of Interest

The authors declare no conflict of interest.

References

  1. Özcan, M. Fracture reasons in ceramic-fused-to-metal restorations. J. Oral Rehabil. 2003, 30, 265–269. [Google Scholar] [CrossRef] [PubMed]
  2. Mezger, P.R.; Stols, A.L.H.; Vrijhoef, M.M.A.; Greener, E.H. Metallurgical aspects of palladium-silver porcelain-bonding alloys. J. Dent. 1989, 17, 90–93. [Google Scholar] [CrossRef]
  3. Tuncdemir, A.R.; Karahan, I.; Polat, S.; Malkoc, M.A.; Dalkiz, M. The effect of repeated porcelain firings on corrosion resistance of different dental alloys. J. Adv. Prosthodont. 2013, 5, 44–50. [Google Scholar] [CrossRef] [PubMed] [Green Version]
  4. Li, B.H.; Ye, J.T.; Liao, J.K.; Zhuang, P.L.; Zhang, Y.P.; Li, J.Y. Effect of pretreatments on the metal-ceramic bonding strength of a Pd-Ag alloy. J. Dent. 2014, 42, 319–328. [Google Scholar] [CrossRef] [PubMed]
  5. Sun, D.; Brantley, W.A.; Frankel, G.S.; Heshmati, R.H.; Johnston, W.M. Potentiodynamic polarization study of the corrosion behavior of palladium-silver dental alloys. J. Prosthet. Dent. 2018, 119, 650–656. [Google Scholar] [CrossRef]
  6. Carr, A.B.; Cai, Z.; Brantley, W.A.; Mitchell, J.C. New high-palladium casting alloys: Part 2. Effects of heat treatment and burnout temperature. Int. J. Prosthodont. 1993, 6, 233–241. [Google Scholar]
  7. Li, D.; Baba, N.; Brantley, W.A.; Alapati, S.B.; Heshmati, R.H.; Daehn, G.S. Study of Pd-Ag dental alloys: Examination of effect of casting porosity on fatigue behavior and microstructural analysis. J. Mater. Sci. Mater. Med. 2010, 21, 2723–2731. [Google Scholar] [CrossRef]
  8. Shin, H.J.; Kim, M.J.; Kim, H.I.; Kwon, Y.H.; Seol, H.J. Effect of ice-quenching on the change in hardness of a Pd-Au-Zn alloy during porcelain firing simulation. Dent. Mater. J. 2017, 36, 142–148. [Google Scholar] [CrossRef] [Green Version]
  9. Shin, H.J.; Kwon, Y.H.; Seol, H.J. Effect of ice quenching after oxidation with or without vacuum on the hardness of Pd-Ag–Au–In alloy during porcelain firing simulation. J. Mech. Behav. Biomed. Mater. 2019, 94, 93–109. [Google Scholar] [CrossRef]
  10. Shin, H.J.; Kwon, Y.H.; Seol, H.J. Effect of cooling rate on hardness and microstructure of Pd-Ag–In–Sn–Ga alloy during porcelain firing simulation. J. Mech. Behav. Biomed. Mater. 2020, 107, 1–10. [Google Scholar] [CrossRef]
  11. Cohen, B.I.; Pagnillo, M.; Condos, S.; Deutsch, A.S. Comparative study of two precision overdenture attachment designs. J. Prosthet. Dent. 1996, 76, 145–152. [Google Scholar] [CrossRef]
  12. Armstrong, R.A. Recommendations for analysis of repeated-measures designs: Testing and correcting for sphericity and use of manova and mixed model analysis. Ophthalmic Physiol. Opt. 2017, 37, 585–593. [Google Scholar] [CrossRef] [PubMed] [Green Version]
  13. Kim, M.J.; Shin, H.J.; Kim, H.I.; Kwon, Y.H.; Seol, H.J. Effect of ice-quenching after Oxidation treatment on hardening of a Pd-Cu-Ga-Zn alloy for bonding porcelain. J. Mech. Behav. Biomed. Mater. 2018, 79, 83–91. [Google Scholar] [CrossRef] [PubMed]
  14. Porter, D.A.; Easterling, K.E.; Sherif, M.Y. Phase Transformations in Metals and Alloys, 3rd ed.; CRC Press/Taylor and Francis Group: Boca Raton, FL, USA, 2009; Chapter 5.5.1. [Google Scholar]
  15. Tanaka, Y.; Udoh, K.; Hisatsune, K.; Yasuda, K. Early stage of ordering in stoichiometric AuCu alloy. Mater. Trans. JIM 1998, 39, 87–94. [Google Scholar] [CrossRef] [Green Version]
  16. Hisatsune, K.; Hasaka, M.; Sosrosoedirdjo, B.I.; Udoh, K. Age-hardening behavior in a palladium-base dental porcelain-fused alloy. Mater. Charact. 1990, 25, 177–184. [Google Scholar] [CrossRef]
  17. Kim, H.I.; Jang, M.I.; Jeon, B.J. Age-hardening associated with precipitation reaction and spinodal decomposition in a commercial dental low-carat Au-Ag-Cu-Pd alloy. J. Mater. Sci. Mater. Med. 1997, 8, 333–339. [Google Scholar] [CrossRef] [PubMed]
  18. Kim, H.I.; Kim, Y.K.; Jang, M.I.; Hisatsune, K.; Sakrana, A.A. Age-hardening reactions in a type III dental gold alloy. Biomaterials 2001, 22, 1433–1438. [Google Scholar] [CrossRef]
  19. Guo, W.H.; Brantley, W.A.; Clark, W.A.T.; Monaghan, P.; Mills, M.J. Transmission electron microscopic investigate on of a Pd-Ag-In-Sn dental alloy. Biomaterials 2003, 24, 1705–1712. [Google Scholar] [CrossRef]
  20. Udoh, K.; Hisatsune, K.; Yasuda, K.; Ohta, M. Isothermal age-hardening behaviour in commercial dental gold alloys containing palladium. Dent. Mater. J. 1984, 3, 253–261. [Google Scholar] [CrossRef]
  21. Guo, W.H.; Brantley, W.A.; Li, D.; Clark, W.A.T.; Monaghan, P.; Heshmati, R.H. Annealing study of palladium-silver dental alloys: Vickers hardness measurements and SEM microstructural observations. J. Mater. Sci. Mater. Med. 2007, 18, 111–118. [Google Scholar] [CrossRef]
  22. Fonseca, J.C.; Henriques, G.E.P.; Sobrinho, L.C.; de Góes, M.F. Stress-relieving and porcelain firing cycle influence on marginal fit of commercially pure titanium and titanium–aluminum–vanadium copings. Dent. Mater. 2003, 19, 686–691. [Google Scholar] [CrossRef]
  23. Mitra, F.; Rashin, G.; Amin, A.R. The effect of multiple firings on the shear bond strength of porcelain to a new millable alloy and a conventional casting alloy. Materials 2018, 11, 478. [Google Scholar] [CrossRef] [Green Version]
  24. Massalski, T.B. Binary Alloy Phase Diagrams, 2nd ed.; ASM International: Materials Park, OH, USA, 1990; pp. 2271–2273. [Google Scholar]
  25. Hisatsune, K.; Udoh, K.; Nakagawa, M.; Yasuda, K. Three distinguishable phase changes during slow cooling in commercial dental alloys for porcelain bonding. Dent. Mater. J. 1987, 6, 54–63. [Google Scholar] [CrossRef] [PubMed]
Figure 1. Experimental flow chart. FE-SEM: field emission scanning electron microscopy. HRXRD: high-resolution X-ray diffraction. FE-EPMA: field emission electron probe microanalysis.
Metals 11 00680 g001
Figure 2. Change in the hardness during multiple firing.
Metals 11 00680 g002
Figure 3. Microstructure after oxidation (left at 5000×, right at 60,000×): (a) as cast; (b) OX-IQ; (c) OX-S0; (d) OX-S3. OX: oxidation. IQ: ice-quenching.
Metals 11 00680 g003
Figure 4. Microstructure after glaze (GL) (left at 5000×, right at 60,000×): (a) GL-S0′; (b) GL-S0; (c) GL-S3.
Metals 11 00680 g004
Figure 5. Microstructure of additional heat-treated GL-(S0′)IQ (5000×).
Metals 11 00680 g005
Figure 6. X-ray Diffraction (XRD) patterns of the specimens after oxidation. A.U.: arbitrary unit.
Metals 11 00680 g006
Figure 7. XRD patterns of the specimens after glaze.
Metals 11 00680 g007
Figure 8. FE-EPMA mapping of GL-S0′ (20,000×).
Metals 11 00680 g008
Figure 9. FE-SEM image of GL-S0′ (a) and GL-S3 (b) (M: matrix, P: precipitate in grain boundary, SP: precipitate in grain interior).
Metals 11 00680 g009
Table 1. Alloy composition.
CompositionPdAgInSnZnGaRu
wt%55346310.50.5
at%55.233.65.62.71.60.80.5
Table 2. Multiple firing schedule for bonding porcelain.
Firing CyclesDrying Time (min)Heating Rate (°C/min)Firing Temp. (°C)Holding Time (min)Vacuum Level (kpa)Vacuum Release (°C)
Oxidation0551040100-
Wash555940296940
Opaque555920296920
Main bake755900096900
Glaze55588000-
Table 3. Cooling rate during multiple firing.
Cooling RateStage 0Stage 1Stage 2Stage 3
ConditionFurnace chamber opens completelyFurnace chamber opens 70 mmFurnace chamber opens 50 mmKeep furnace chamber closed
Table 4. List of sample names.
NameDescription
S0, S3Cooling at rate of Stage 0 (S0) and Stage 3 (S3), respectively, during multiple firing
S0′, S3′Cooling at S0 and S3, respectively, during multiple firing, but ice-quenching only after Oxidation
OX-(IQ, S0, S3)Oxidation followed by ice-quenching (IQ), cooling at S0 and S3, respectively
GL-(S0′, S0, S3′, S3)Firing-simulated specimens exposed to controlled cooling rates (S0′, S0, S3′, S3), respectively, up to Glaze
GL-(S0′, S0, S3)IQFiring-simulated specimens exposed to controlled cooling rates (S0′, S0, S3), respectively, up to Main bake step, and then ice-quenching (IQ) after Glazing
Table 5. Analysis of the main and interaction effects on hardness by a RMANOVA.
FactorFp
Firing step (Oxidation-Glaze)4049.933<0.001 *
Cooling rate (S0′, S0, S3′, S3)3692.399<0.001 *
Firing step × Cooling rate1417.454<0.001 *
* Statistically different values. F: ratio of variance (between-group variation/within-group variation).
Table 6. Mean surface hardness (HV0.3) and standard deviations.
Cooling RateMean, kgf/mm2 (SD)
OxidationWashOpaqueMain BakeGlaze
S0′163 Aa297 Be289 Bd266 Bc256 Bb
(2.08)(3.24)(4.12)(3.08)(3.89)
S0303 Ce296 Bd288 Bc264 Bb253 Ba
(2.82)(4.11)(2.75)(3.42)(2.72)
S3′164 Aa275 Ae270 Ad242 Ac235 Ab
(3.03)(2.72)(2.40)(4.26)(3.17)
S3257 Bc277 Ae269 Ad241 Ab235 Aa
(5.62)(4.82)(4.81)(3.90)(3.49)
A, B, C Significant impact of the cooling rate (S0′, S0, S3′, S3), a, b, c, d, e Significant impact of the firing steps. Same superscript letters mean no significant difference between values.
Table 7. FE-EPMA spot analysis in the areas in Figure 9.
Region (at%)Mean (SD)
PdAgInSnZnGaRu
GL-S0′M57.0 (1.6)33.3 (1.2)4.8 (0.3)2.0 (0.3)1.8 (0.1)1.0 (0.1)0
P68.7 (1.7)12.5 (1.5)8.5 (0.4)4.8 (0.2)2.7 (0.1)2.8 (0.1)0
SP69.7 (1.1)13.1 (0.3)8.0 (0.4)4.2 (0.4)2.6 (0.1)2.4 (0.3)0
GL-S3M56.3 (0.2)34.8 (0.7)4.3 (0.2)1.7 (0.0)1.9 (0.1)1.0 (0.2)0
P69.2 (2.5)12.0 (1.8)8.5 (0.3)4.8 (0.3)2.7 (0.0)2.7 (0.2)0.1 (0.1)
SP69.0 (0.7)12.5 (0.3)8.4 (0.3)4.7 (0.2)2.7 (0.1)2.6 (0.1)0.1 (0.1)
The values represent the mean and standard deviation (SD). Three sites were randomly selected to analyze each region.
Publisher’s Note: MDPI stays neutral with regard to jurisdictional claims in published maps and institutional affiliations.

