Abstract
The effects of carbon contents on the mechanical properties and deformation behavior of medium Mn steels, 6Mn steels with 0.06C, 0.15C, and 0.3C, were investigated in this study. With the increase of the carbon content, not only the ultimate tensile stress, but also the total elongation, was increased (from 22.44% to 40.23%). The enhancement of carbon content promoted the diffusion of C and Mn atoms from ferrite to austenite and led to an increase of C and Mn concentrations in austenite, which increased both the volume fraction (from 15.5 vol% to 39.7 vol%) and the stability of austenite; therefore, the transformation-induced plasticity (TRIP) effect was intensified and larger amount of austenite transform in a greater strain range, which could continuously provide work hardening for the steels, thus preventing necking and improving the ductility of the material.
1. Introduction
As the most common element in steels, carbon plays a vital role, since the changes of carbon content affect the microstructures, mechanical properties, and deformation behavior of steels. Recently, the increasingly urgent problems of energy and environments require to develop the advanced high strength steels (AHSS) towards energy conservation, CO2 emission reduction, and safety improvement in the modern automotive industry. Therefore, as one of the effective solutions to achieve the lightweight of automobiles, medium-Mn steels (4–12 wt% Mn) with excellent combination of high strength and adequate ductility (the values of the products of strength and elongation (PSE) are generally above 30 GPa%) have drawn considerable attention [1,2,3].
In recent years, most of the studies on medium-Mn steels have focused on the chemical compositions, microstructural evolution, mechanical properties, and heat treatment schedules with different C contents from 0.1 wt% to 0.6 wt%. Merwin [4,5] reported the excellent combination of the high strength (above 1000 MPa) and total elongation (above 30%) of the Fe-(5–7) Mn-0.1 C (wt%) steels. Shi et al. [6] investigated the influence of the C and Mn content on the mechanical properties and work hardening ability of the Fe-(5–7) Mn-(0.2–0.4) C (wt%) alloy system and confirmed that the work hardening ability of the medium-Mn steel strongly depends on the volume fraction and stability of austenite, but they did not study the effects of C content on the relationship between the microstructural evolution and the work hardening behavior during deformation. Luo et al. [7] reported that the partitioning of C and Mn influenced the volume fraction and grain size of austenite, thus affecting the mechanical properties of the Fe-5 Mn-0.2 C (wt%) steel, but did not investigate the influence of the partitioning behavior on the work hardening ability. Lee et al. [8,9] reported that the change of the C and Mn content affected the deformation mechanism; however, the studies were mostly focus on the effects of transformation-induced plasticity (TRIP) + twinning-induced plasticity (TWIP). Although these studies have involved a wide range of C content, they were all independent studies with no correlation of alloying elements between each other, and the effects of C content on the relationships among austenite stability, mechanical properties, and deformation behaviors of medium-Mn steels have not been systematically studied yet. As reported by the previous studies, the amount and stability of retained austenite is of critical importance to the mechanical properties of medium-Mn steels, while the chemical compositions in different phases have strong influences on the stability of the metastable retained austenite. Meanwhile, the partitioning of alloying elements would be also influenced by the change of the chemical composition. Consequently, the variation of the distribution of C and Mn will directly affect the mechanical properties of medium-Mn steels; therefore, the study of the partitioning law of C and Mn is of great significance to the design of compositions and the determination of heat treatment schedules for medium-Mn steels.
In the present study, three hot-rolled steels with different C contents were adopted to investigate the influence of the C content on the relationships among the partitioning of elements, austenite stability, mechanical properties, and the work hardening behaviors in the experimental steels in order to improve the composition design of medium Mn steels.
2. Materials and Methods
The chemical compositions of the three experimental steels are displayed in Table 1. Three 39 kg ingots were cast after melting in vacuum induction furnaces. The ingots were heated at 1200 °C for 2 h, hot forged to slabs with width of 100 mm and thickness of 30 mm, and then air cooled to room temperature. The as-forged slabs were soaked at 1200 °C for 2 h and then hot rolled with the thickness reduction from 30 mm to 2 mm through eight passes within the temperature range of 1150–950 °C before finally being air cooled to room temperature.

Table 1.
The chemical compositions of the experimental steels (mass, %).
To establish the appropriate heat treatment schedules, the intercritical temperature range of the experimental steels was determined by means of dilatometry, and it was calculated as the ratio of length change (dl) to initial length (l0). Cylindrical dilatometry samples with the length of 10 mm and the diameter of 1.2 mm were heated to 1000 °C with the heating rate of 10 °C s−1 and air cooled to room temperature with the cooling rate of 5 °C s−1 after heat preservation for 10 min. The thermal expansion curves are illustrated in Figure 1, and the intercritical temperatures of three experimental steels are marked in Figure 1, respectively.
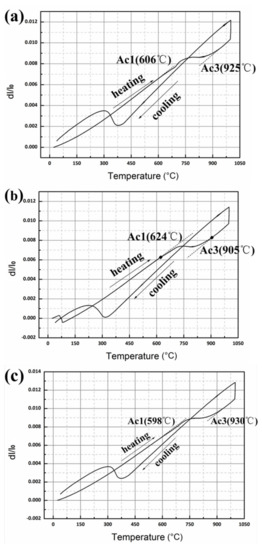
Figure 1.
Dilatometric curves for the experimental steels. (a) 0.06C steel. (b) 0.15C steel. (c) 0.3C steel.
A convenient quenching and tempering (Q&T) heat treatment [10,11] was adopted instead of the austenite reverted transformation (ART) in the present study. The as-hot-rolled samples were intercritically annealed at 635 °C for 1 h and subsequently water quenched to room temperature. The as-quenched samples were tempered at 300 °C for 20 min and then air cooled to ambient temperature.
Flat dog-bone tensile specimens with a gauge length of 25 mm and gauge width of 6 mm were machined from the sheets with the tensile axis parallel to the prior rolling direction. The tensile tests were carried out on a universal testing machine SANSCMT5000 at a constant crosshead speed of 1.5 mm min−1 at room temperature.
Microstructures of the samples were analyzed by field-emission scanning electron microscope (FE-SEM, ULTRA PLUS, ZEISS, Oberkochen, Germany) and Transmission Electron Microscope (TEM, FEI, Tecnai G2 F20, operated at 200 kV, Hillsboro, OR, USA) combined with Energy Dispersion X-ray Spectroscopy (EDS, Oxford, INCA Energy, Oxford, UK). Electron backscatter diffraction (EBSD) analysis of the microstructures was conducted using field-emission scanning electron microscopy (CROSSBEAM 550, ZEISS, Oberkochen, Germany). Distribution of C and Mn were observed by Electron Probe Microanalyzer (EPMA, JXA-8530F, JEOL, Tokyo, Japan). SEM samples, EBSD samples, and EPMA samples were electro-polished with a solution of 94% C2H5OH and 6% HClO4 at room temperature, and TEM specimens were twin-jet electropolishing with a solution of 88% C2H5OH and 12% HclO4 at −25 °C using a Twin-Jet Electro polisher (Struers, Tenupol-5, Struers, Copenhagen, Denmark). The volume fraction of retained austenite was determined by X-ray diffraction (XRD, Rigaku, D/Max2250/PC, Rigaku Corporation, Tokyo, Japan) analysis with CuKα radiation from the integrated intensity of the monitored austenite (Iγ,i) and α-phase (Iα,i) peaks [12]:
where Rγ,I and Rα,I are the normalization factors for austenite and α-phase peak intensities, respectively, and N and M are the number of considered austenite and α-phase reflections, respectively.
3. Results
The SEM micrographs of the steels are given in Figure 2. All three experimental steels exhibit an ultrafine lath-typed microstructure with dual phase of ferrite (α) and austenite (γ). The width of lath austenite is 100–300 nm, which is obviously smaller than that of ferrite phase; meanwhile, there are some big granular ferrites appearing in 0.06C steel and 0.15C steel. As the C content increases, the size of granular ferrite decreases, and the width of lath austenite increases, which can be ascribed to the partitioning of Mn. With the enhancement of C content, a larger amount of Mn partitions to austenite, resulting in an increase of Mn concentration in austenite (the partitioning behavior of Mn was confirmed by EDS results and will be discussed later to explain the influence of C content on austenite stability), and the enrichment of Mn leads to a larger volume faction of austenite and thicker austenite laths [7]. Finally, the microstructure of 0.3C steel is uniform lath-typed. Except for ferrite and austenite, there are some fine carbides distributing in the ferrite of 0.15C steel and 0.3C steel.
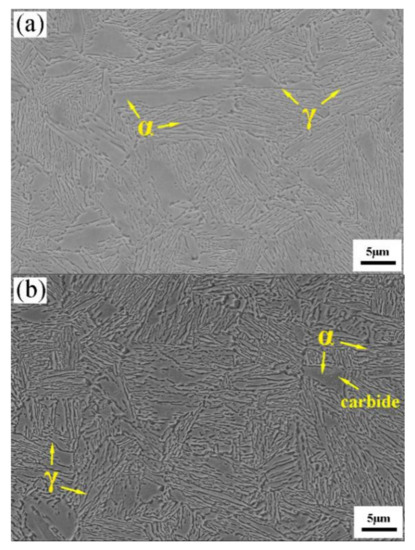
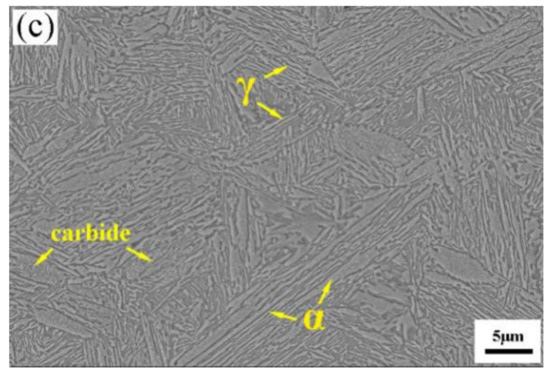
Figure 2.
SEM micrographs of the hot-rolled samples after intercritical annealing at 635 °C. (a) 0.06C steel. (b) 0.15C steel. (c) 0.3C steel.
The microstructures of the samples after Q&T heat treatment and the grain area distribution of austenite were investigated via EBSD, as displayed in Figure 3. Figure 3a–c demonstrates the phase distribution of the studied steels. The volume fraction of retained austenite increased with the enhancement of C content. In this work, the grain area was adopted to characterize the grain size in the lath-like microstructure. The grain area reflected the grain size through the values calculated by both length and width, which is fitted to the lath-typed microstructure. The austenite grain area distribution demonstrates that, with the increase of C content, the area fraction of small grain area decreased and the amount of large grain area increased; meanwhile, as shown in the phase maps, it is obvious that the huge block ferrite could be found in 0.06C steel and disappears with the enhancement of C content. It could be found that the increasing C content refines the ferrite grains but coarsens the austenite grains.
Figure 3.
Electron backscatter diffraction (EBSD) phase maps and grain area distribution of austenite of samples. (a) 0.06C steel. (b) 0.15C steel. (c) 0.3C steel. (d) The grain area distribution of austenite in different samples.
The XRD patterns are displayed in Figure 4a, and the volume fractions of austenite before and after tensile tests obtained from XRD results are shown in Figure 4b. The volume fraction of austenite presented to be low for the sample with C content of 0.06%. As C content increased from 0.06% to 0.3%, the volume fractions of retained austenite before tension increased from 15.5% to 39.7%, while the austenite volume fractions after tension for the investigated steels were similar. Furthermore, the sample after tensile test was studied by TEM, and the selected area diffraction pattern (SADP) in Figure 4c demonstrates the Kurdjumov-Sachs orientation relationship (K-S OR) between the martensite and retained austenite grains, indicated by yellow circle, which confirmed the appearance of strain induced martensite.
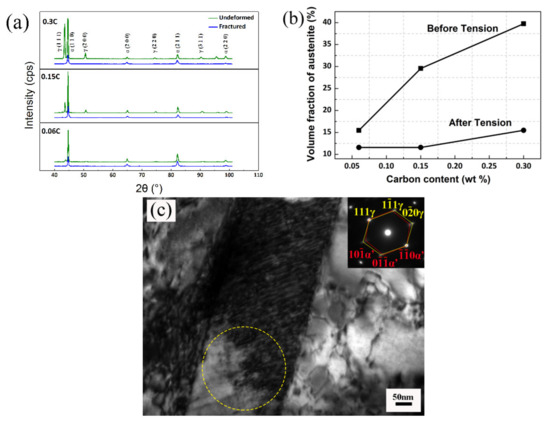
Figure 4.
Volume fraction of retained austenite and Transmission Electron Microscope (TEM) image of martensite. (a) X-ray diffraction (XRD) patterns of the experimental steels. (b) Volume fraction of retained austenite before and after tensile test. (c) Martensite and retained austenite with Kurdjumov-Sachs (K-S) orientation relationship.
Figure 5 shows the engineering stress-strain curves and the mechanical properties of the experimental steels. It could be found that both the ultimate tensile strength (UTS) and the total elongation (TEL) increased with C content increasing. It is obvious that 0.3C steel exhibited the best comprehensive mechanical properties resulting from the excellent combination of the highest strength and the most adequate ductility, which could be reflected by PSE. The PSE values reached 20.3 GPa%, 36.8 Gpa%, and 45.5 Gpa% for 0.06C, 0.15C, and 0.3C steels, respectively. Generally, for common advanced high strength steels, the strengths of steels are enhanced, but the ductility would deteriorate with the increase of C content [13,14,15].
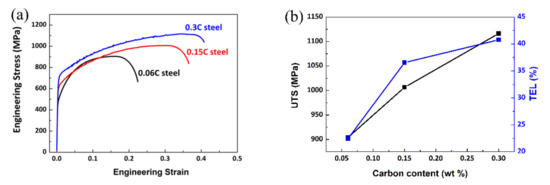
Figure 5.
Mechanical properties of the experimental steels. (a) Engineering strain-stress curves. (b) Tensile properties of the experimental steels.
The work hardening behavior was characterized by the instantaneous n value [16,17], as shown in Figure 6. The experimental steels exhibited three stage work hardening behavior: the instantaneous n value started to increase gradually in stage I, until it reached the peak value nmax, and decreased slowly with further straining in stage II before finally decreased rapidly in stage III. The 0.3C steel shows the highest instantaneous n value, while the 0.06C steel shows the lowest one, and the nmax values of the 0.06C steel, 0.15C steel, and 0.3C steel are 0.296, 0.368, and 0.482, respectively. The higher n value is often related to the higher level of work hardening, which means that the work hardening ability of the investigated steels has been improved with the increase of C content.
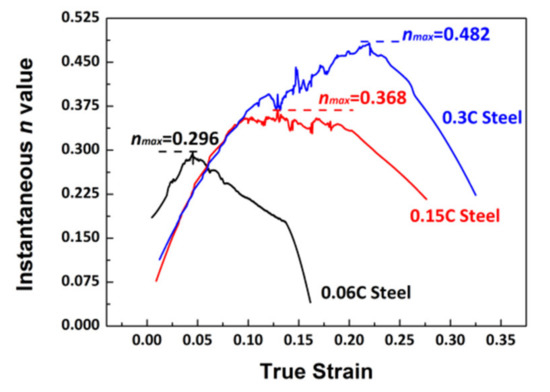
Figure 6.
Work hardening behavior of the experimental steels.
4. Discussion
4.1. Effect of Carbon Content on Mechanical Properties and Austenite Stability
Stacking fault energy (SFE) is a key parameter to determine the deformation mechanism of medium-Mn steels, and it is influenced by the composition of austenite. In the present work, the compositions of more than 10 austenite grains were determined through the TEM-EDS method. The SFE could be estimated by the following equation [18]:
where ρs is the molar surface density along the austenite close-packed plane. is the molar Gibbs energy of transformation γ→ε, and 𝜒 is the interfacial energy. The average C content in austenite (XC) was calculated by the XRD method [19]:
where αγ is the austenite lattice parameter determined from (220)γ, and XC, XMn, and XAl are the concentrations of C, Mn, and Al in austenite (wt%), respectively. For the 0.06C, 0.15C, and 0.3C samples, the values of SFEs were 2.89, 7.96, and 13.21 mJ m−2, respectively, which suggests that the TRIP effect was the major deformation mechanism during tensile loading because the SFEs of the experimental materials were below 15 mJ m−2 [20].
αγ = 3.556 + 0.0453 XC + 0.00095 XMn + 0.0056 XAl,
According to the rule of mixture, the tensile flow stress of multiphase TRIP steels could be interpreted as follows [21,22]:
where fα, fγ, and fm are the volume fractions, and σα, σγ, and σm are the flow stresses of ferrite, austenite, and martensite, respectively. It is pertinent to indicate that martensite was obtained by phase transformation during deformation. Since the strength of martensite is much higher than that of ferrite and austenite, combining Equation (4) and the phase proportion demonstrated in Figure 7a, the enhancement in UTS could be attributed to the higher volume fraction of newly-formed martensite transformed from austenite [6,22,23,24].
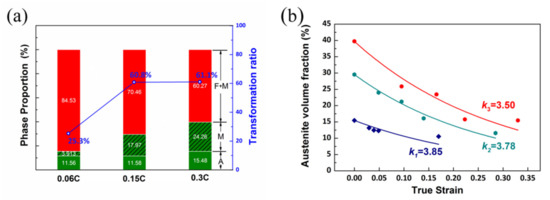
Figure 7.
Austenite transformation behavior of the experimental steels. (a) Phase proportion and transformation ratio of the experimental steels. (b) Austenite stability of different experimental steels.
Since the volume fraction of ferrite presented to be more than 50% for the experimental steels in the present study, the role of ferrite during deformation should not be ignored. The average dislocation density in ferrite could be determined by XRD analysis [25,26], which can be evaluated by selecting the diffraction of (211)α, and was calculated by Equation (5) [27,28].
where ρ and β are the dislocation density and the half-width determined by XRD profile, b is Burgers vector, and its value is 2.48 × 10⁻⁸cm [27,28]. Table 2 summarizes the results of the measurement. It is clear that the dislocation density of ferrite increased during the deformation for the three experimental steels. Besides, as the C content increased, the dislocation density after the tensile test increased, which also could give contribution to the UTS. The greater increment of the dislocation density is also related to the TRIP effect. Since martensite transformation leads to the volumetric expansion, local plasticity has been generated in the matrix phase adjacent to the newly-formed martensite, resulting in an increased dislocation activity in the ferrite [29,30,31,32]. As a larger amount of austenite transformed, the dislocation activities in the ferrite of the steels with a higher C content increased more significantly, resulting in the greater increment of the dislocation density. Hence, the higher UTS could be ascribed to the joint contribution of the significant TRIP effect and marked dislocation movements in ferrite for the sample with a higher C content.
Table 2.
Dislocation density of ferrite (1014, m−2) in 0.06C steel, 0.15C steel, and 0.3C steel.
As demonstrated in Figure 7a, the transformation proportion of 0.06C steel was only 25.3%, while, for 0.15C steel and 0.3C steel, the transformation proportions were 60.8% and 61.1%, respectively. The difference in transformation proportion might be ascribed to the different austenite stability. The stability of austenite could be evaluated by the mechanical stability parameter k, which was deduced from the following equation that quantitatively demonstrated the variation of austenite volume fraction during deformation [33]:
where fγ0 is the initial austenite volume fraction, fγ is the austenite volume fraction at strain ε, and k is the mechanical stability of austenite. As exhibited in Figure 7b, the k values are 3.85, 3.78, and 3.50 for 0.06C steel, 0.15C steel, and 0.3C steel, respectively. A higher k value means the larger driving force of martensite transformation and, therefore, the stability of austenite decrease.
As illustrated in Figure 6, 0.3C steel showed the highest instantaneous n value. In order to investigate the reason why the work hardening ability rose with the increase of C content, the variation of austenite volume fraction and work hardening behavior were studied together, as shown in Figure 8. In stage I, the transformation volume fraction of austenite increased with the enhancement of C content. As the austenite stabilities are improved with the increasing C content (Figure 7b), the strains of the nmax values of the experimental steels increased from 0.05 to 0.23, which means the increasing C content prolonged the process of stage I. Therefore, the largest nmax value was obtained in 0.3C steel because the largest amount of austenite transformed in the greatest strain range, which could continuously provide work hardening for the steel. The elongation of the medium Mn steel is related to its work hardening ability, and the progressive work hardening would retard the localization of deformation and enhance the uniform elongation [1]. Therefore, the TEL of 0.3C steel is larger than those of the other two experimental steels with lower C contents.
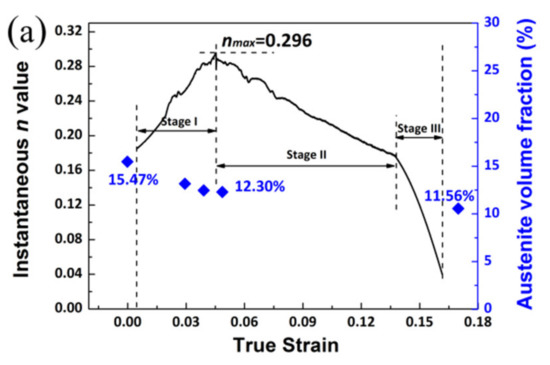
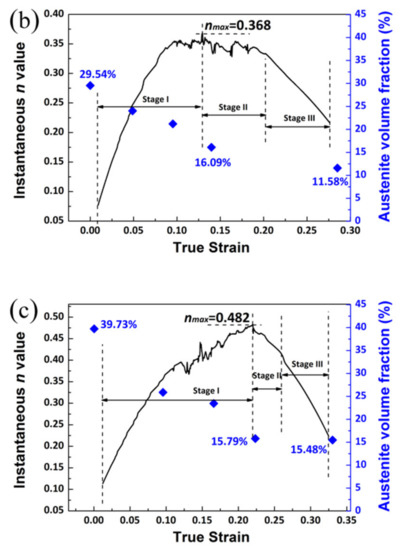
Figure 8.
Work hardening behavior and austenite volume fraction evolution. (a) 0.06C steel, (b) 0.15C steel, and (c) 0.3C steel.
4.2. Effect of Carbon Content on Distribution of Manganese
The analysis about the work hardening behavior and transformation behavior has confirmed that higher austenite stability leads to the better comprehensive mechanical properties of the medium Mn steels with a higher C content. However, as shown in Figure 3, the austenite grains of the steels with higher C content exhibit both the larger length and the larger width, which would decrease the austenite stability [34]; consequently, there must be extra factors which have improved the austenite stability of the steels with a higher C content. Previous investigations showed that, except the grain size, the chemical compositions also affect the stability of austenite [35], so that the partition of C and Mn was studied in the present work.
Figure 9 displays the microstructures and the corresponding distribution of C and Mn concentrations of the experimental steels measured by EPMA. As shown in Figure 8, it is clear that the concentrations of C and Mn in austenite are both higher than the ones in ferrite, and the distribution of C and Mn in each phase is fairly uniform. The relative mean concentration and the percentage of each concentration range of C and Mn are shown in Table 3, which demonstrates that an increase in the austenite volume fraction with a higher Mn concentration has been obtained with the enhancement of C content in three experimental steels. Meanwhile, the disparities in the concentration of Mn in austenite and ferrite in the experimental steels rose. However, as mentioned above, the concentration of Mn in austenite is higher than that in ferrite, so the increase in the amount of austenite should cause a decrease in the concentration of Mn in austenite as the total content of Mn is constant in each experimental steel, which seems inconsistent with the results observed by EPMA. In order to investigate the variation of Mn in austenite, the concentration of Mn in austenite and ferrite was measured by EDS (integrated in TEM).
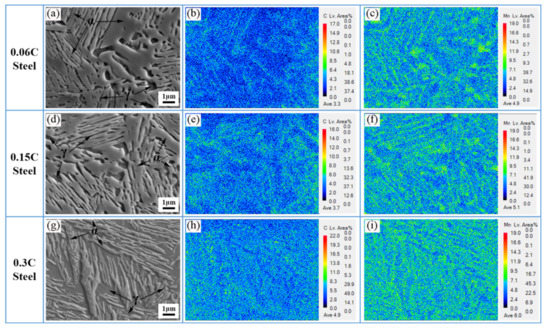
Figure 9.
SEM micrograph and corresponding C and Mn concentrations distribution of 0.06C steel (a–c), 0.15C steel (d–f), and 0.3C steel (g–i). (a,d,g) microstructure of the experimental steels, (b,e,h) C concentrations distribution, and (c,f,i) Mn concentrations distribution correspond to the micrograph.ent
Table 3.
Relative mean concentration and the percentage of each concentration range of C and Mn.
Figure 10 demonstrates the corresponding EDS results of the Mn distribution in austenite and ferrite of the samples with different C contents. It is obvious that the enhancement of C content leads to the increase of Mn concentration in austenite and decrease of Mn concentration in ferrite; in other words, a larger amount of Mn partitions to austenite with the increase of C content. The distribution of Mn measured by EDS is consistent with the EPMA result in Figure 9. As displayed in Table 2, the ferrite dislocation density of the samples after heat treatment increased with the increase of C content; therefore, local diffusion channels were created, which promoted the diffusion of C and Mn atoms and enhanced the amount of the partition of C and Mn [36]. As both C and Mn are austenite stabilizing element, higher C and Mn concentrations in austenite enhanced the stability of austenite. In summary, the partitioning of C and Mn to austenite is the reason why the austenite stability rose with the increase of C content.
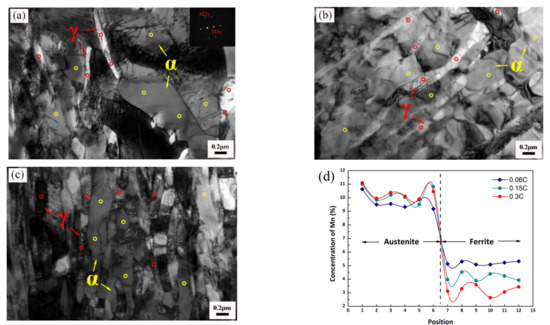
Figure 10.
TEM micrograph and Mn concentration in austenite and ferrite. (a) 0.06C steel. (b) 0.15C steel. (c) 0.3C steel. (d) Mn concentration in austenite and ferrite.
Overall, an increase in C content resulted in a higher stability of austenite, which provided appropriate stability for austenite to trigger a more significant and sustainable TRIP effect, and finally led to a simultaneous enhancement in the strength and the ductility.
5. Conclusions
The deformation behavior and alloying element partitioning of hot rolled 0.06C steel, 0.15C steel, and 0.3C steel were investigated in the present study. The following conclusions could be obtained:
Higher C content promoted TRIP effect. With the increase of C content, the volume fraction of austenite increased from 15.5 vol% to 39.7 vol%, and the transformation proportion increased from 25.3% to 61.1%. Meanwhile, the dislocation density in ferrite of the steel with a higher C content increased more obviously during deformation. The joint contribution of the significant TRIP effect and marked dislocation movements in ferrite improved the comprehensive mechanical properties of the material.
The increase of C content led to the enhancement of the value of nmax and the retardation of the appearance of nmax, which was attributed to appropriate austenite stability so that the more significant and sustainable TRIP effect has been triggered; thus, a higher work hardening ability has been attained.
Suitable austenite stability of 0.3C steel was the result of the high C and Mn concentrations in austenite. Mn partitioned to the austenite with a higher C concentration during the annealing process, which increased both C concentration and Mn concentration in austenite of the steel with a higher C content.
Author Contributions
Y.Z. designed most of the experiments, performed most experiments, analyzed the results, and wrote this manuscript. Z.T. and H.D. helped analyze the experiment data and gave some constructive suggestions about how to write this manuscript. All authors have read and agreed to the published version of the manuscript.
Funding
This research received no external funding.
Institutional Review Board Statement
Not applicable.
Informed Consent Statement
Not applicable.
Data Availability Statement
Data sharing not applicable.
Acknowledgments
The present work was financially supported by the National Natural Science Foundation of China (No. U1760205). The authors thank Y. Zhang for his comments on this paper.
Conflicts of Interest
The authors declare no conflict of interest.
Abbreviation
| Nomenclature | |
| dl | Length change |
| l0 | Initial length |
| Iγ,i | Integrated intensity of the monitored austenite |
| Iα,i | Integrated intensity of the monitored α-phase |
| Rγ,i | Normalization factor for austenite peak intensities |
| Rα,i | Normalization factor for α-phase peak intensities |
| N | Number of considered austenite reflection |
| M | Number of considered α-phase reflection |
| n | Work hardening exponent |
| nmax | Peak value of the work hardening exponent |
| ρs | Molar surface density along the austenite close-packed plane |
| Molar Gibbs energy of transformation γ→ε | |
| αγ | Austenite lattice parameter determined from (220)γ |
| XC, XMn, XAl | Concentrations of C, Mn, and Al in austenite (wt%) |
| fα, fγ, fm | Volume fractions of ferrite, austenite and martensite |
| σα, σγ, σm | Flow stresses of ferrite, austenite and martensite |
| b | Burgers vector |
| k | Mechanical stability parameter |
| fγ0 | Initial austenite volume fraction |
| fγ | Austenite volume fraction |
| Greek Letters | |
| γ | Austenite |
| α | Ferrite |
| 𝜒 | Interfacial energy |
| ρ | Dislocation density |
| β | Half-width of the diffraction peak |
| ε | True strain |
References
- Zhang, Y.; Ding, H. Ultrafine also can be ductile: On the essence of Lüders band elongation in ultrafine-grained medium manganese steel. Mater. Sci. Eng. A 2018, 733, 220–223. [Google Scholar] [CrossRef]
- Nakada, N.; Mizutani, K.; Tsuchiyama, T.; Takaki, S. Difference in transformation behavior between ferrite and austenite formations in medium manganese steel. Acta Mater. 2014, 65, 251–258. [Google Scholar] [CrossRef]
- Mertinger, V.; Nagy, E.; Tranta, F.; Sólyom, J. Strain-induced martensitic transformation in textured austenitic stainless steels. Mater. Sci. Eng. A 2008, 481-482, 718–722. [Google Scholar] [CrossRef]
- Merwin, M. Low-Carbon Manganese TRIP Steels. Mater. Sci. Forum 2007, 539, 4327–4332. [Google Scholar] [CrossRef]
- Merwin, M.J. Microstructure and properties of cold rolled and annealed low-carbon manganese TRIP steels. Iron. Steel. Technol. 2008, 10, 66–84. [Google Scholar]
- Shi, J.; Sun, X.; Wang, M.; Hui, W.; Dong, H.; Cao, W. Enhanced work-hardening behavior and mechanical properties in ultrafine-grained steels with large-fractioned metastable austenite. Scr. Mater. 2010, 63, 815–818. [Google Scholar] [CrossRef]
- Luo, H.; Shi, J.; Wang, C.; Cao, W.; Sun, X.; Dong, H. Experimental and numerical analysis on formation of stable austenite during the intercritical annealing of 5Mn steel. Acta Mater. 2011, 59, 4002–4014. [Google Scholar] [CrossRef]
- Lee, S.; Estrin, Y.; De Cooman, B.C. Effect of the Strain Rate on the TRIP–TWIP Transition in Austenitic Fe-12 pct Mn-0.6 pct C TWIP Steel. Met. Mater. Trans. A 2014, 45, 717–730. [Google Scholar] [CrossRef]
- Lee, S.; De Cooman, B.C. Tensile Behavior of Intercritically Annealed 10 pct Mn Multi-phase Steel. Met. Mater. Trans. A 2013, 45, 709–716. [Google Scholar] [CrossRef]
- Li, Z.; Ding, H.; Cai, Z. Mechanical properties and austenite stability in hot-rolled 0.2C–1.6/3.2Al–6Mn–Fe TRIP steel. Mater. Sci. Eng. A 2015, 639, 559–566. [Google Scholar] [CrossRef]
- Cai, Z.; Ding, H.; Misra, R.; Ying, Z. Austenite stability and deformation behavior in a cold-rolled transformation-induced plasticity steel with medium manganese content. Acta Mater. 2015, 84, 229–236. [Google Scholar] [CrossRef]
- Van Dijk, N.; Butt, A.; Zhao, L.; Sietsma, J.; Offerman, S.; Wright, J.; Van Der Zwaag, S. Thermal stability of retained austenite in TRIP steels studied by synchrotron X-ray diffraction during cooling. Acta Mater. 2005, 53, 5439–5447. [Google Scholar] [CrossRef]
- Ritchie, R.O. The conflicts between strength and toughness. Nat. Mater. 2011, 10, 817–822. [Google Scholar] [CrossRef]
- Krauss, G. Deformation and fracture in martensitic carbon steels tempered at low temperatures. Met. Mater. Trans. A 2001, 32, 205–221. [Google Scholar] [CrossRef]
- Rashid, M.S. High-Strength, Low-Alloy Steels. Science 1980, 208, 862–869. [Google Scholar] [CrossRef]
- Pan, H.; Cai, M.; Ding, H.; Huang, H.; Zhu, B.; Wang, Y.; Zhang, Y. Microstructure evolution and enhanced performance of a novel Nb-Mo microalloyed medium Mn alloy fabricated by low-temperature rolling and warm stamping. Mater. Des. 2017, 134, 352–360. [Google Scholar] [CrossRef]
- Rastegari, H.; Kermanpur, A.; Najafizadeh, A. Effect of initial microstructure on the work hardening behavior of plain eutectoid steel. Mater. Sci. Eng. A 2015, 632, 103–109. [Google Scholar] [CrossRef]
- He, B.; Luo, H.; Huang, M. Experimental investigation on a novel medium Mn steel combining transformation-induced plasticity and twinning-induced plasticity effects. Int. J. Plast. 2016, 78, 173–186. [Google Scholar] [CrossRef]
- Sohn, S.S.; Choi, K.; Kwak, J.-H.; Kim, N.J.; Lee, S. Novel ferrite–austenite duplex lightweight steel with 77% ductility by transformation induced plasticity and twinning induced plasticity mechanisms. Acta Mater. 2014, 78, 181–189. [Google Scholar] [CrossRef]
- Lee, T.-H.; Shin, E.; Oh, C.-S.; Ha, H.-Y.; Kim, S.-J. Correlation between stacking fault energy and deformation microstructure in high-interstitial-alloyed austenitic steels. Acta Mater. 2010, 58, 3173–3186. [Google Scholar] [CrossRef]
- Dan, W.; Zhang, W.; Li, S.; Lin, Z. A model for strain-induced martensitic transformation of TRIP steel with strain rate. Comput. Mater. Sci. 2007, 40, 101–107. [Google Scholar] [CrossRef]
- Lee, S.; De Cooman, B.C. Annealing Temperature Dependence of the Tensile Behavior of 10 pct Mn Multi-phase TWIP-TRIP Steel. Met. Mater. Trans. A 2014, 45, 6039–6052. [Google Scholar] [CrossRef]
- Cai, Z.; Li, H.; Jing, S.; Li, Z.; Ding, H.; Tang, Z.; Misra, R. Influence of annealing temperature on microstructure and tensile property of cold-rolled Fe-0.2C-11Mn-6Al steel. Mater. Charact. 2018, 137, 256–262. [Google Scholar] [CrossRef]
- Embury, D.; Bouaziz, O. Steel-Based Composites: Driving Forces and Classifications. Annu. Rev. Mater. Res. 2010, 40, 213–241. [Google Scholar] [CrossRef]
- Liang, Z.; Li, Y.; Huang, M. The respective hardening contributions of dislocations and twins to the flow stress of a twinning-induced plasticity steel. Scr. Mater. 2016, 112, 28–31. [Google Scholar] [CrossRef]
- Li, W.; Xu, W.; Wang, X.; Rong, Y. Measurement of microstructural parameters of nanocrystalline Fe–30wt.%Ni alloy produced by surface mechanical attrition treatment. J. Alloys Compd. 2009, 474, 546–550. [Google Scholar] [CrossRef]
- Dunn, C.G.; Koch, E.F. Comparison of dislocation densities of primary and secondary recrystallization grains of Si-Fe. Acta Metall. 1957, 5, 7. [Google Scholar] [CrossRef]
- Gay, P.; Hirsch, P.; Kelly, A. The estimation of dislocation densities in metals from X-ray data. Acta Met. 1953, 1, 315–319. [Google Scholar] [CrossRef]
- Jacques, P.; Furnemont, Q.; Mertens, A.; Delannay, F. On the sources of work hardening in multiphase steels assisted by transformation-induced plasticity. Philos. Mag. A 2001, 81, 1789–1812. [Google Scholar] [CrossRef]
- Han, H.N.; Lee, C.G.; Suh, D.-W.; Kim, S.-J. A microstructure-based analysis for transformation induced plasticity and mechanically induced martensitic transformation. Mater. Sci. Eng. A 2008, 485, 224–233. [Google Scholar] [CrossRef]
- Miyamoto, G.; Shibata, A.; Maki, T.; Furuhara, T. Precise measurement of strain accommodation in austenite matrix surrounding martensite in ferrous alloys by electron backscatter diffraction analysis. Acta Mater. 2009, 57, 1120–1131. [Google Scholar] [CrossRef]
- Ennis, B.; Jimenez-Melero, E.; Atzema, E.; Krugla, M.; Azeem, M.; Rowley, D.; Daisenberger, D.; Hanlon, D.; Lee, P. Metastable austenite driven work-hardening behaviour in a TRIP-assisted dual phase steel. Int. J. Plast. 2017, 88, 126–139. [Google Scholar] [CrossRef]
- Sugimoto, K.; Kobayashi, M.; Hashimoto, S. Ductility and strain-induced transformation in a high-strength transformation-induced plasticity-aided dual-phase steel. Metall. Mater. Trans. A 1992, 23, 3085–3091. [Google Scholar] [CrossRef]
- Lee, S.; Lee, S.-J.; Kumar, S.S.; Lee, K.; De Cooman, B.C. Localized Deformation in Multiphase, Ultra-Fine-Grained 6 Pct Mn Transformation-Induced Plasticity Steel. Met. Mater. Trans. A 2011, 42, 3638–3651. [Google Scholar] [CrossRef]
- Blondé, R.; Jimenez-Melero, E.; Zhao, L.; Wright, J.P.; Brück, E.; Van der Zwaag, S.; Van Dijk, N.H. High-energy X-ray diffraction study on the temperature-dependent mechanical stability of retained austenite in low-alloyed TRIP steels. Acta Mater. 2012, 60, 565–577. [Google Scholar] [CrossRef]
- Chen, L.S.; Li, Y.; Zhang, M.S.; Tian, Y.Q.; Zheng, X.P.; Xu, Y.; Zhang, S.H. Effect of intercritical dislocation multiplication to Mn partitioning and microstructure evolution of bainite in low carbon steel. Acta Metall Sin. 2017, 53, 1418. [Google Scholar]


Publisher’s Note: MDPI stays neutral with regard to jurisdictional claims in published maps and institutional affiliations. |
© 2021 by the authors. Licensee MDPI, Basel, Switzerland. This article is an open access article distributed under the terms and conditions of the Creative Commons Attribution (CC BY) license (https://creativecommons.org/licenses/by/4.0/).