Abstract
Spatially resolved elastic strains in the bulk interior of a laminated Ti-Al metal composite were studied during in situ tensile loading at strains up to 1.66% by a synchrotron-based micro-diffraction technique, namely differential aperture X-ray microscopy (DAXM). For both Al and Ti grains, deviatoric elastic strains were estimated based on polychromatic X-ray microbeam diffraction, while lattice strains along the normal direction of the tensile sample were directly measured using monochromatic X-ray microbeam diffraction. The estimated deviatoric strains show large spatial variations, and the mean values are consistent with the external loading conditions, i.e., increasing tensile strain along the tensile direction and increasing compressive strain along the sample normal with increasing loading. The directly measured lattice strains also show large spatial variations, although the magnitude of this variation is smaller than that for the estimated deviatoric strain. The directly measured lattice strains in Ti grains are largely consistent with the external loading, whereas those in Al grains are in contradiction with the external loading. The causes of the experimental results are discussed and related to both the laminated microstructure of the composite material and the limitations of the techniques.
1. Introduction
Laminated metal composites (LMCs) are an important class of engineering materials owing to their enhanced strength-to-weight ratios and their ability to be tailored to suit different applications [1,2]. Many systems of LMCs have been fabricated through accumulative roll bonding or hot pressing followed by hot rolling, e.g., [3,4,5,6,7]. In recent studies, it was shown that a combination of high strength and good ductility was achieved in laminated Ti-Al composites [2,4]. To probe the early stage of plastic deformation and to examine the effects of the layer interfaces in laminated Ti-Al composites, we carried out, in an earlier work, an in situ synchrotron polychromatic X-ray micro-diffraction investigation during the tensile loading of laminated Ti-Al composite samples [8]. In that study, we found an ultra-low-strain deformation microstructure in the Al layers induced by thermal stresses, and revealed a strong influence of both the initial microstructure and the interfaces on the dislocation activities in Al layers during tensile loading [8]. However, an important aspect of the deformation—namely the distribution and evolution of elastic strains—was not analyzed.
Residual elastic strains and related residual stresses are known to have a strong effect on the yielding behavior of LMCs, because local yielding results from the combined effect of local residual stresses and applied stresses [9]. When macroscopic yielding occurs in the soft layers of LMCs, the hard layers are still in the macroscopic elastic regime, and thus the evolution of the elastic strain is significantly different within the soft and hard layers [10]. When macroscopic yielding occurs in both the soft and hard layers, the influence of residual strains and stresses may be lost, but the layered microstructures of LMCs may lead to a heterogeneous distribution of local elastic strains and stresses owing to the interface constraint. These local elastic strains and stresses may have a strong influence on the activation of slip and twinning systems, and therefore a detailed characterization of the distribution and evolution of elastic strains during the deformation of LMCs is important for understanding their deformation behaviors and strengthening mechanisms.
Several destructive and non-destructive techniques have been proposed and used to measure elastic strains [9]. Non-destructive techniques make in situ studies possible, and they are primarily based on diffraction, including electron, X-ray and neutron diffraction, by determining lattice spacings through Bragg’s equation. Electron diffraction only works for thin foil samples, and neutron diffraction gives averaged measurements over large sample volumes. Therefore, X-ray micro-diffraction appears to be the most suitable method for local elastic strain measurement in bulk samples with micrometer spatial resolution. Moreover, new developments of synchrotron-based X-ray techniques are opening up new opportunities for elastic strain measurement [11,12,13,14,15]. In particular, the development of the synchrotron-based micro-diffraction technique, also termed differential aperture X-ray microscopy (DAXM), offers depth-resolved elastic strain measurement with a sub-micrometer spatial resolution using a Pt wire as a differential aperture (knife-edge absorption profiler) [16,17].
In the DAXM polychromatic beam mode [16], diffraction patterns from many lattice planes along the incident polychromatic X-ray microbeam are collected, and the contribution from each specific depth is calculated with the help of the Pt differential aperture. From the calculated diffraction patterns, the orientation of each voxel can be determined with a resolution of 0.01°, and the deviatoric strain tensor (distortion of lattice) for each voxel can be estimated from the relative positions of the diffraction spots. However, the presence of dislocations may exaggerate the estimated deviatoric strains due to the inaccurate determination of the center positions of the diffraction spots, which are broadened by local dislocations [13]. Moreover, the hydrostatic strain (dilatation of lattice) cannot be determined by this method due to the use of the polychromatic X-ray microbeam—the wavelength is not fixed, so the absolute lattice spacing is unknown. In the DAXM monochromatic beam mode [17], the focus is on one selected diffraction spot with the indices (hkl). The exact wavelength for the strongest diffraction is determined through the scanning of the beam energy, while the depth is determined through the scanning of the differential aperture. As a result, the absolute spacing of the (hkl) plane can be determined for each voxel along the incident X-ray microbeam, and the lattice strain along the (hkl) normal (dilatation of lattice) can be obtained with an accuracy of 1 × 10⁻⁴ by relating to the unstrained lattice spacing. Full strain tensors may also be obtained after such measurement for three independent diffraction vectors [18].
In the present study, both polychromatic and monochromatic DAXM are employed to characterize the distribution of residual elastic strains in laminated Ti-Al composites and to follow the evolution of elastic strains non-destructively during the early stages of tensile deformation (applied tensile strain less than 2%). The new results on the elastic strains complement a previous analysis on the plastic strains [8], giving important information on the stress partitioning in the layered microstructure and the local deformation behavior.
2. Materials and Methods
Commercial purity Ti (99.4% purity) and Al (99.2% purity) sheets with a thickness of 200 µm were used as the starting materials to produce Ti-Al LMCs. The Ti and Al sheets were stacked alternatively and bonded at 500 °C for 1 h under a pressure of 40 MPa in vacuum. The hot-pressed LMCs were then hot rolled to a thickness reduction of 50%. The details of the fabrication process of the Ti-Al LMCs can be found in [4]. Dog-bone-shaped tensile specimens with a gauge length of 10 mm and a gauge width of 2 mm were cut from the fabricated LMC sheets by electron discharge machining, annealed at 500 °C for 1 h followed by furnace cooling, ground to a thickness lower than 1 mm and then electro-polished to remove any surface damage. A tensile specimen with a thickness of about 340 µm (the two surface layers are both made of Ti and 20 µm thick to permit a sufficient transmission of X-rays) was chosen for the DAXM investigation, which was carried out at beamline 34-ID-E at the Advanced Photon Source, Argonne National Laboratory.
For the deviatoric strain measurement, a polychromatic X-ray microbeam (7–30 keV with a relatively flat off-axis spectrum from an undulator source) was focused to a size of 0.3 µm. The tensile specimen was mounted in a specially designed tensile rig offering a strain resolution of ~0.05% and installed at a 45° incident angle toward the X-ray microbeam. See [8,17] for the details of the set-up. The X-ray microbeam was scanned (exposure time 0.5 s) along the tensile axis (TA) with a step size of 1.5 µm perpendicular to the incident X-ray microbeam, while the position along the transverse direction (TD) was fixed. Pattern reconstruction and indexing (see Figures S1 and S2 in the Supplementary Materials) were conducted using the LaueGo package at beamline 34-ID-E [19]. A 2D slice containing the TA and the normal direction (ND) was indexed with a depth spacing of 1.5 µm along the incident X-ray microbeam, i.e., spatially resolved orientation data were obtained. The deviatoric strain tensors were refined based on the positions of the diffraction spots using the LaueGo package, and their normal strain components ε′TD, ε′TA and ε′ND are presented in this study.
For the lattice strain (i.e., lattice plane spacing) measurement in a selected grain, a Laue spot with both a high intensity and a diffraction vector close to the ND was chosen, and then energy scans (near 20 keV depending on the chosen Laue spot) with a monochromatic X-ray microbeam, as well as Pt wire scans for depth information, were carried out for the chosen Laue spot (Figure 1a). From the energy scans at the chosen sample position, the intensity distribution of the diffracted beam as a function of the diffraction vector was determined for each depth, and this distribution was fitted using a Gaussian function (see Figures S3 and S4 in the Supplementary Materials). The center of the Gaussian function was used to determine the spacing of the diffraction planes [17,20]. By comparing to the unstrained plane spacing (here taking the theoretical lattice constants a = 4.0495 Å for Al [21] and a = 2.9508 Å and c = 4.6855 Å for Ti [22]), the lattice strain along the plane normal was determined and termed εND, as the plane normal is very close to the ND of the tensile sample.
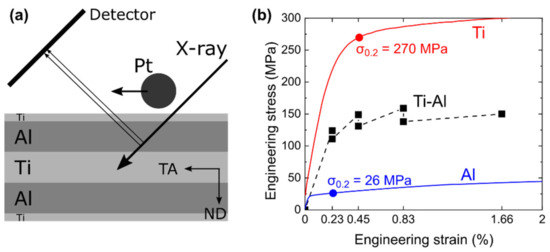
Figure 1.
Schematic view of the experimental setup for the monochromatic differential aperture X-ray microscopy (DAXM) experiment, where transverse direction (TD) is out of plane (a) and the interrupted tensile loading of the Ti-Al laminated metal composites (LMC) together with tensile curves for Ti and Al after the same thermomechanical treatment (b). Adapted from [8].
The DAXM experiments were carried out after calibration using a single crystal silicon sample, providing a strain resolution of 1 × 10⁻⁴ for a monochromatic DAXM energy scan. Diffraction data were collected for the same area of the specimen both before tensile deformation and after tensile deformation to strains of 0.23%, 0.45%, 0.83% and 1.66% (Figure 1). The strains were applied manually using a homemade push-to-pull device, and the applied strains were measured by determining the positions of two Pt markers deposited on the tensile LMC specimen using fluorescence spectroscopy, which was also used to find the same area for characterization after increasing the tensile load. There were drops in the stress between two successive loading steps due to sample creep and/or relaxation of the tensile rig. As shown in Figure 1b, these drops were small compared to the flow stress of Ti, but they were rather big compared to the flow stress of Al. The tensile curves of Ti and Al, shown in Figure 1b, were obtained from Ti and Al tensile samples after the same thermomechanical treatment as the Ti-Al LMC, i.e., 50% hot rolling and annealing at 500 °C for 1 h.
3. Results
The region examined by DAXM is shown in Figure 2a using inverse pole figure coloring. There are six big Al grains labeled G1 to G6 underneath a layer of small Ti grains, as well as a few indexed Ti grains below the Al layer (most of the Ti grains there cannot be indexed due to weak signals, as this layer is deep below the sample surface). The initially recrystallized Al grains show an ultra-low-strain deformation microstructure caused by thermal stresses [8]. The recovered Ti layers (with a few recrystallized grains) have a mean grain size of about 10 μm and a basal texture with their c-axes close to the ND. The grain rotation and subdivision in the Al layers during tensile loading have been analyzed in a previous publication, showing strong influences from both the initial microstructure and the interface constraint [8]. In the following, the deviatoric strains from the polychromatic DAXM investigation and the lattice strains along the ND from the monochromatic DAXM investigation are analyzed.

Figure 2.
The initial state before tensile loading. (a) Inverse pole figure coloring map with separate color codes for Ti and Al; grain boundaries with misorientation angles larger than 15° are shown by thick lines for both Ti and Al, and boundaries between 0.1° and 15° are shown by thin lines for Al (adapted from [8]). (b) Local misorientation angle map for the six Al grains. (c–e) Maps of deviatoric strains along the TD, tensile axis (TA) and normal direction (ND), respectively.
3.1. Deviatoric Strains in Al
Figure 2b shows the spatial variation of the local misorientation angle (i.e., average misorientation angle between each pixel and its eight neighbors, excluding grain boundaries >15°) in the Al layer before tensile loading. The regions close to interfaces show higher local misorientation angles compared to the middle of the layer, and dislocation boundaries with very low misorientation angles (<0.5°) can be observed inside the six Al grains. Figure 2c–e show the spatial variations of the deviatoric strains (ε′TD, ε′TA and ε′ND) along the TD, TA and ND, respectively. There is a strong correlation between high local misorientation angles (green in Figure 2b) and extremely large tensile/compressive deviatoric strains (magnitudes larger than 2 × 10⁻⁴ shown as dark red/blue in Figure 2c–e). These extremely large deviatoric strains are clearly exaggerated due to local dislocations, but the spatial variation pattern of the estimated deviatoric strain indicates the presence of residual elastic strains in the Al layers. For example, in grain G3, there is a clear transition in deviatoric strains across the long low angle dislocation boundary subdividing this grain (marked by an arrow through grain G3 in Figure 2a).
Figure 3 shows that the local misorientation angles increase with the increasing tensile load. Due to the limited range of elastic deformation in Al (Figure 1b), plastic deformation occurs after 0.23% tensile deformation, and thus a small increase in the local misorientation angle can be observed already after this first step of loading (compare Figure 2b and Figure 3a). It is also clear from Figure 3 that regions close to interfaces keep higher local misorientation angles compared to the middle of the layer during tensile loading, showing a strong interface effect. Figure 4 shows the distribution and evolution of the deviatoric strain along the TA (ε′TA) in the six Al grains. The deviatoric strain ε′TA is generally tensile, in agreement with the external loading condition. The local deviatoric strains ε′TA are very different from those before tensile loading, but remain rather constant between different loading steps—local positive ε′TA largely keeps positive and local negative ε′TA largely keeps negative with increasing tensile loading, indicating a similar dislocation activity in the four steps of tensile loading. With the increase of plastic strain and thus also dislocation density, the fraction of extremely large values (|ε′TA| > 2 × 10⁻³ shown as dark red/blue in Figure 3), i.e., artefacts, increases. Figure 5 shows the distribution and evolution of the deviatoric strain along the ND (ε′ND) in the six Al grains. The results are complementary to those in Figure 4. The deviatoric strain ε′ND is generally compressive, as expected for tensile loading.
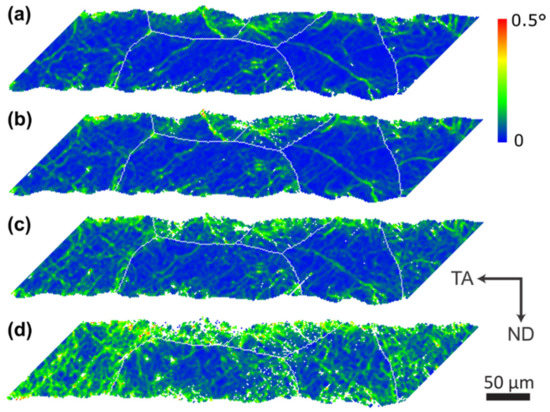
Figure 3.
Local misorientation angle maps for the six Al grains at different tensile strains. (a) 0.23%; (b) 0.45%; (c) 0.83%; (d) 1.66%.
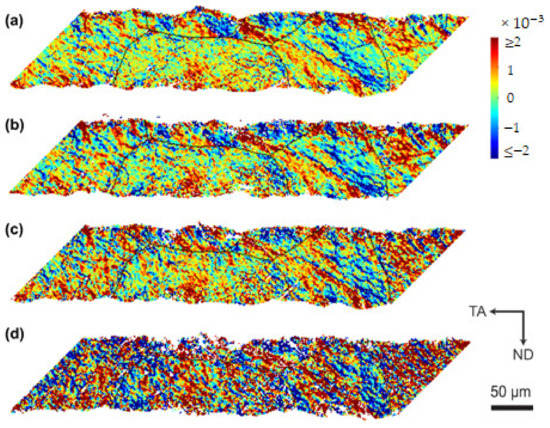
Figure 4.
Maps of the deviatoric strain along the tensile axis ε′TA for the six Al grains at different tensile strains. (a) 0.23%; (b) 0.45%; (c) 0.83%; (d) 1.66%.
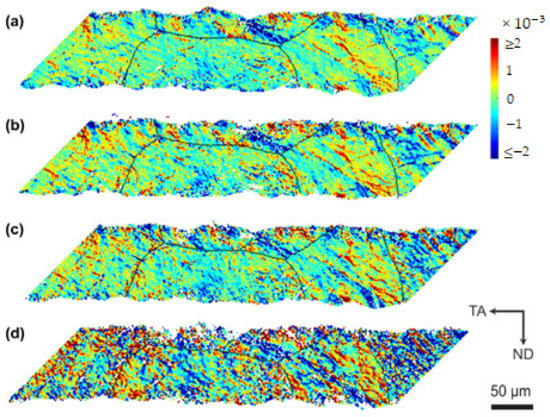
Figure 5.
Maps of the deviatoric strain ε′ND for the six Al grains at different tensile strains. (a) 0.23%; (b) 0.45%; (c) 0.83%; (d) 1.66%.
The local deviatoric strains of Al estimated from the polychromatic DAXM data show artificially larger variations (Figure 4 and Figure 5) due to the interference of dislocations. However, their average values give a clearer picture, as shown in Figure 6. The average values of the deviatoric strains ε′TD, ε′TA and ε′ND are close to zero before tensile loading, and their magnitudes increase and saturate quickly during tensile loading. There are tensile deviatoric strains along the TA and compressive deviatoric strains along the TD and ND. The observed maximum is ε′TA = 3.5 × 10⁻⁴, corresponding to an estimated tensile stress of 25 MPa based on a simple multiplication of the elastic modulus (70 GPa for Al). Such a stress level agrees well with the tensile curve of Al (Figure 1b), giving further support in using the average deviatoric strains.
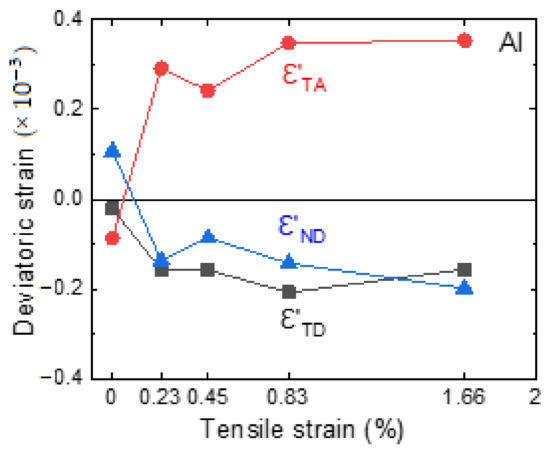
Figure 6.
The evolution of the average deviatoric strains (ε′TD, ε′TA and ε′ND) in the Al layer during tensile loading. The magnitude of the standard deviation is in the order of 10−3. The 0.2% offset yield point strain for Al is about 0.23%.
3.2. Lattice Strains Along ND in Al
Monochromatic DAXM energy scans were carried out for two Al grains, G1 and G3, from their centers to the bottom interfaces (see the arrows in Figure 2a) using diffraction from their (408) planes, which are approximately perpendicular to ND. For each depth along the incident X-ray microbeam, the intensity distribution of the (408) diffraction beam as a function of the diffraction vector was reconstructed, and the evolution of the average width of this profile is shown in Figure 7. The width is initially small and remains so up to the tensile strain of 0.83%, but increases significantly after a tensile strain of 1.66%, indicating a significant increase in the dislocation density [23].
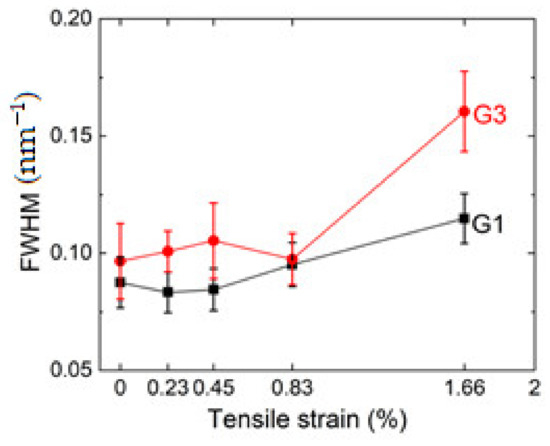
Figure 7.
The average values of the full width at half the maximum (FWHM) of the diffraction intensity profile from energy scans in grains G1 and G3 during tensile loading. The error bars show standard deviations. The 0.2% offset yield point strain for Al is about 0.23%.
The (408) plane spacings were determined from these profiles and compared with the theoretical spacing to calculate the lattice strain εND. The evolution of the depth-resolved lattice strain εND in grains G1 and G3 is shown in Figure 8. For both grains, there is a tensile lattice strain along ND before tensile loading. The observed maximum is εND = 4.8 × 10⁻⁴, which is observed near the bottom interface of G3. This local peak strain corresponds to a tensile stress of 34 MP along the ND (based on simple multiplication)—slightly larger than the macroscopic yield strength of the Al (Figure 1b). After the first step of loading (0.23%), the lattice strain εND decreases due to the Poisson effect but remains tensile. With increasing tensile loading, the lattice strain εND in the center of grain G1 fluctuates with a small peak-to-peak amplitude (1 × 10⁻⁴), whereas it fluctuates with a big peak-to-peak amplitude (3 × 10⁻⁴) near the bottom interface, indicating a strong effect of interface constraint. In grain G3, the lattice strain εND generally decreases with the increasing tensile loading except for the last step of loading, and εND increases from the center to the bottom interface, also indicating an effect of the interface.
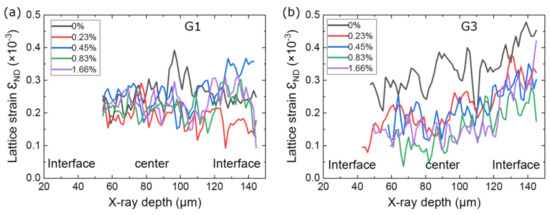
Figure 8.
Depth-resolved lattice strain εND in two Al grains before and after tensile deformation to different strains. (a) In grain G1; (b) in grain G3. The strain accuracy of the technique is 1 × 10⁻⁴.
3.3. Deviatoric Strains in Ti
Figure 9a shows the spatial variation of the local deviatoric strain along the TA and ND in the top Ti layer before tensile loading. These estimated residual deviatoric strains (ε′TA and ε′ND) are mostly small, although large values can also be seen at some locations, most likely due to experimental errors caused by the polychromatic DAXM technique. Figure 9b shows the distributions of the deviatoric strains ε′TA and ε′ND after applying 0.23% tensile strain, showing mostly tensile strains along the TA and compressive strains along the ND, in agreement with the external loading condition. With increasing load, the changes in the deviatoric strains ε′TA and ε′ND are relatively small (Figure 9), although after the last tensile step (1.66%), the higher dislocation density leads to more artificially large values (magnitudes larger than 5 × 10⁻³ shown as dark red/blue in Figure 9). The average values of the deviatoric strains ε′TA and ε′ND in the top Ti layer are close to zero before tensile loading, and their magnitudes increase dramatically after the first loading step, followed by a small increase of ε′TA and ε′ND after the last loading step (Figure 10). The observed maximum is ε′TA = 1.86 × 10⁻³, corresponding to an estimated tensile stress of 190 MPa based on simple multiplication (taking 102 GPa as the elastic modulus of Ti). Such a stress level agrees well with the flow stress of Ti (Figure 1b), giving further support in using the average deviatoric strains.
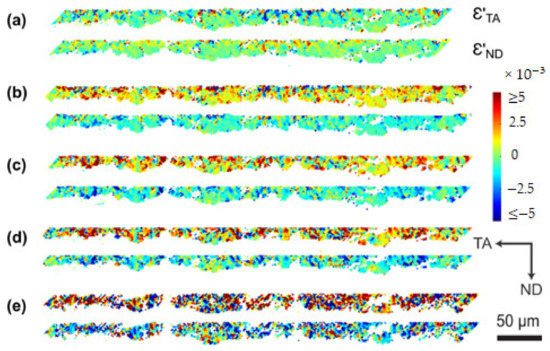
Figure 9.
Maps of the deviatoric strains ε′TA and ε′ND for the top Ti layer. (a) Before tensile loading; (b) after a strain of 0.23%; (c) 0.45%; (d) 0.83; (e) 1.66%. The scanned region for the initial state is slightly smaller than the other four states.
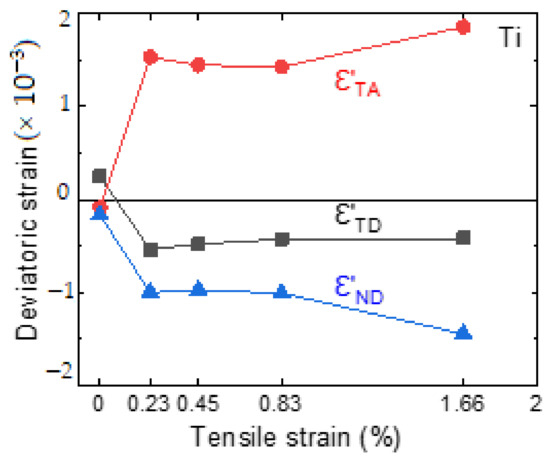
Figure 10.
The evolution of the average deviatoric strain (ε′TD, ε′TA and ε′ND) in the top Ti layer during tensile loading. The magnitude of the standard deviation is on the order of 10−3. The 0.2% offset yield point strain for Ti is about 0.45%.
Due to its hexagonal crystal structure, Ti is elastically and plastically anisotropic, and thus the orientation dependence of the deviatoric strain in Ti is analyzed. Figure 11 shows the variation of the deviatoric strain ε′TA as a function of the misalignment angle between the tensile axis and c-axis for the top Ti layer. A large spread is observed for all cases. Before tensile loading, the average residual deviatoric strain ε′TA is compressive, and this compressive strain decreases (i.e., approaching zero) with an increasing misalignment angle. After the first step of loading (0.23%), a primarily elastic deformation is expected in the Ti layers (see Figure 1b). The estimated deviatoric strain ε′TA is mostly tensile and increases with the increasing misalignment angle (Figure 11b). This positive slope of the fitted line after the first step of loading indicates the effect of the residual strain, although there is a slight decrease in the slope. After further tensile loading, plastic deformation occurs in the Ti layers, and the estimated deviatoric strain ε′TA changes its orientation dependence compared to that after the first step of loading—the estimated ε′TA decreases with the increasing misalignment angle (negative slopes in Figure 12c,d). The slightly larger average deviatoric strain ε′TA for grains with a small misalignment angle may be related to the difficulty of these grains in activating easy basal and prismatic <a> slip systems. However, the large scattering of ε′TA within each grain, although largely being an artefact caused by the polychromatic DAXM technique, may also indicate a strong effect from the local dislocation structure and neighboring grains.
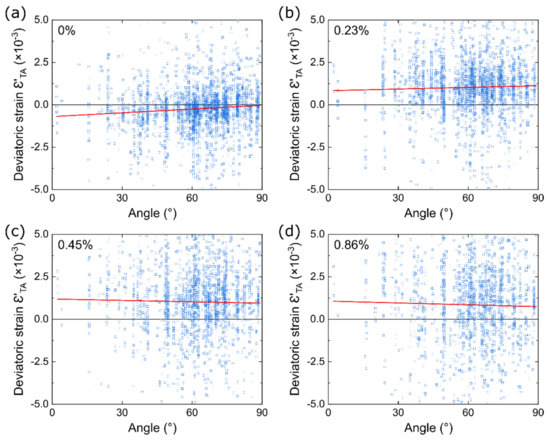
Figure 11.
The dependence of the deviatoric strain ε′TA on the misalignment angle between the tensile axis and the c-axis of Ti grains in the top Ti layer. (a) Before tensile loading; (b) after a strain of 0.23%; (c) 0.45%; (d) 0.83%. The red lines show linear fittings.
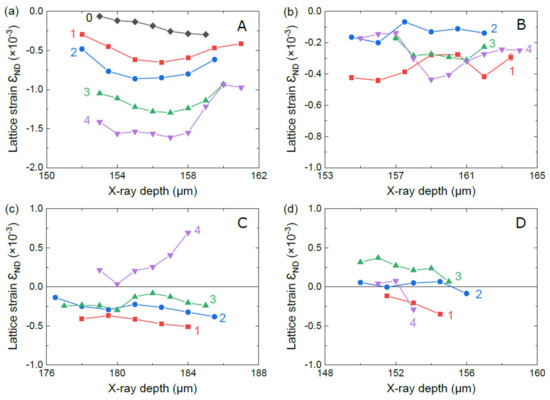
Figure 12.
Depth-resolved lattice strain εND in four Ti grains in the Ti layer below the Al layer after 1-4 steps of tensile loading. (a) (20–29) reflection of grain A; (b) (31–47) reflection of grain B; (c) (31–47) reflection of grain C; (d) (35–26) reflection of grain D. The lattice strains before tensile loading (step 0) are also shown in (a). The strain accuracy of the technique is 1 × 10⁻⁴.
3.4. Lattice Strains Along ND in Ti
DAXM energy scans were also carried out for four recrystallized Ti grains of different orientations (grain size 5–15 µm) in the Ti layer below the Al layer, and the evolution of the depth-resolved lattice strains (εND) is shown in Figure 12. This layer is considered the most interesting, as the results are not affected by near-sample-surface stress relaxation effects. In most cases, the measured lattice strain εND is compressive. After the first step of loading (0.23%), a primarily elastic deformation is expected in the Ti layers (Figure 1b), although micro-plasticity is inevitable. It is found that the measured lattice strain εND (red curves in Figure 12) is compressive in all four Ti grains, in agreement with the loading condition. With increasing strain, plastic deformation takes place in the Ti layers, leading to significant changes in the local stress and elastic strain. Different Ti grains show different evolutions of the lattice strain εND. Figure 12a shows a grain with compressive εND increasing in magnitude with increasing external loading. The maximum magnitude is 1.61 × 10⁻³, corresponding to a compressive stress of 164 MPa along ND based on simple multiplication—about 60% of the yield stress of Ti (Figure 1b). For these four Ti grains, the misalignment angle between the c-axis and TA varies between 52° to 80°, and thus a relatively easy activation of the basal and prismatic <a> slip systems is expected for all the four grains. The significant difference in the evolution of lattice strain εND during tensile loading therefore suggests a strong effect from neighboring grains. Nevertheless, further studies are needed to clarify the effects of crystallographic orientation, local dislocation structure and neighboring grains, as well as to correlate the local strain/stress tensor with the activation of particular slip/twinning systems in Ti grains.
4. Discussion
4.1. Deviatoric Strain vs Lattice Strain
In the current work, the deviatoric strains are estimated from polychromatic DAXM investigations, and the lattice strains (normal strain components along ND) are determined from monochromatic DAXM investigations. To compare with the lattice strains εND measured along the two paths in the two Al grains G1 and G3, the deviatoric strains ε′ND along the same paths estimated from the polychromatic DAXM experiments are extracted from Figure 2e and Figure 5. The local deviatoric strain ε′ND shows an artificially large variation and does not match the local lattice strain εND. A better agreement is found for the average values for the two paths, as shown in Figure 13. The average deviatoric strain ε′ND along the path in grain G1 is positive during tensile loading, in a good agreement with the average lattice strain εND determined from the energy scans. The average deviatoric strain ε′ND along the path in grain G3 decreases continuously, also in a good agreement with the results from the energy scans.
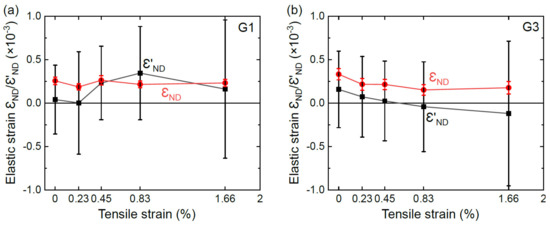
Figure 13.
Average lattice strain εND and deviatoric strain ε′ND (magnitudes larger than 2 × 10⁻³ are discarded during averaging) along two paths in two Al grains before and after tensile deformation to different strains. (a) In grain G1; (b) in grain G3. The error bars show standard deviations. The 0.2% offset yield point strain for Al is about 0.23%.
For the four Ti grains in the Ti layer below the Al layer, the measured lattice strains εND are also compared with the deviatoric strains ε′ND estimated approximately at the same positions. The deviatoric strain ε′ND shows a larger variation, but some agreement can be found for their average values, as shown in Figure 14. They are mostly compressive, as expected from the Poisson effect. In one case (Figure 14a), the agreement on the magnitude is rather satisfactory. In the other cases, however, the estimated average deviatoric strains ε′ND generally show much larger compressive strains.
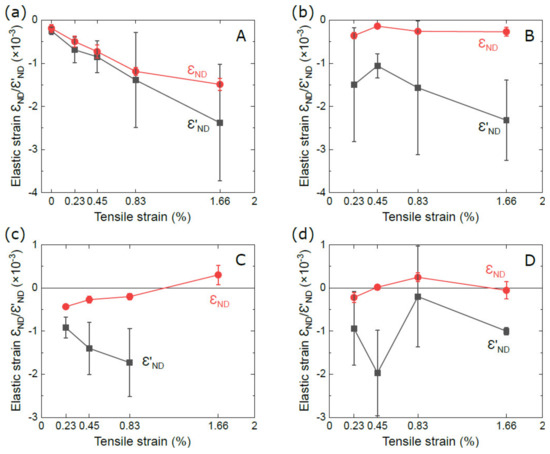
Figure 14.
Average lattice strain εND and deviatoric strain ε′ND (magnitudes large than 5 × 10⁻³ are discarded during averaging) in four Ti grains below the Al layer before and after tensile deformation to different strains. (a) Grain A; (b) grain B; (c) grain C; (d) grain D. The error bars show standard deviations. The 0.2% offset yield point strain for Ti is about 0.45%.
In the annealed state, the local hydrostatic strains may be negligible. During the interrupted tensile loading, the load is largely maintained between each loading step despite a small relaxation (Figure 1b), and thus the resulting global elastic strain is also largely maintained. The corresponding average hydrostatic strain may be estimated as εhyd = (1 − 2ν)·σ/3E, where ν is the Poisson ratio, σ is the applied stress in the layer and E is the elastic modulus. Taking ν = 0.33 and E = 70 GPa for the Al grains and ν = 0.34 and E = 102 GPa for the Ti grains, the average hydrostatic strains in the Al and Ti layers can be estimated based on the tensile curves of Al and Ti shown in Figure 1b, when the interface constraint is not considered. The results are shown in Figure 15, indicating relatively small hydrostatic tensile strains, especially in the Al layers. These positive strains, however, partly explain the discrepancies found between the deviatoric strain ε′ND and the lattice strain εND shown in Figure 13 and Figure 14.
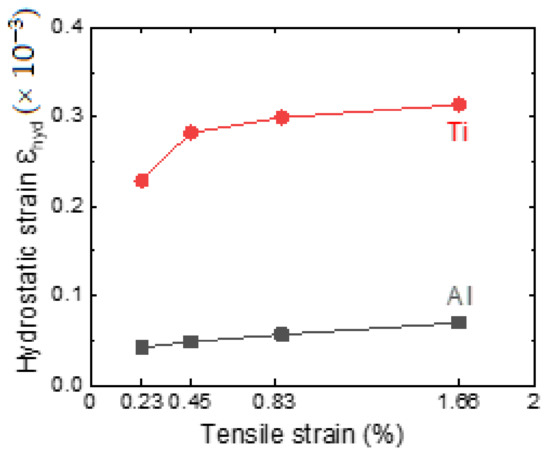
Figure 15.
Estimated average hydrostatic strains εhyd for Ti and Al during tensile loading. The 0.2% offset yield point strains for Ti and Al are about 0.45% and 0.23%, respectively.
The measured lattice strain εND also depends critically on the choice of unstrained lattice constant. Theoretical lattice constants are used in the current work, and calculations show that different choices only give rise to a small difference in the determined lattice strain. For example, if the lattice constant 4.0500 Å is chosen for Al, as measured in a previous study for an Al alloy with a similar chemical composition [18], instead of the 4.0495 Å used here, the difference in the determined lattice strain is only 1.2 × 10⁻⁴, thus not changing the general conclusion. To further evaluate the choice of unstrained lattice constants, one Ti-Al LMC sample was ground to remove the surface Ti layer before annealing at 500 °C for 1 h. The average residual lattice strain εND determined by the monochromatic DAXM experiment for the surface Al layer of this sample turned out to be −2 × 10⁻⁴. This small compressive strain, together with the small tensile strains measured along the two paths shown in Figure 2a, indicate that the choice of the theoretical lattice constant is likely to be appropriate.
The local deviatoric strains estimated from polychromatic DAXM experiments are known to suffer from the influence of internal dislocation structures [13]. This is evident from the correlation between local misorientation angles and artificially large deviatoric strains (Figure 3 and Figure 4). However, useful information can still be obtained statistically, for example: (i) the subdivision of the microstructure into domains with tensile strains and compressive strains (Figure 2c–e) and (ii) the dependence of the deviatoric strain on the misalignment angle between the tensile axis and the c-axis of Ti grains (Figure 11). Moreover, the current work shows that the estimated average deviatoric strain, through averaging over a large number of measurements, may not only capture the general trend but also give an approximate magnitude (Figure 6 and Figure 10)—the average values are quite close to previous results obtained through neutron diffraction [10]. It is surprising that the monochromatic DAXM investigation shows tensile lattice strains εND along the two X-ray paths in the Al layer during tensile loading (Figure 8). However, considering the high resolution of the monochromatic DAXM technique (1 × 10⁻⁴) and the good match with the average deviatoric strain ε′ND along these two paths (Figure 13), we believe that the measured tensile strains for εND are real. Possible causes are the local variation of the elastic strain and the slight relaxation of the load, which may significantly alter the elastic strain in the Al layers. It should also be mentioned that tensile elastic strains along ND during in situ tensile tests were also reported previously in synchrotron X-ray studies [14,24]. For further understanding, the measurement of the full strain tensor (energy scans for three independence reflections) in several grains is needed.
4.2. Effect of Layered Structure
In the previous work [8], it was found that an ultra-low-strain deformation microstructure with a plastic strain gradient was formed in the Al layers of Ti-Al LMCs due to the thermal stresses between layers. In the current work, residual elastic strains are found in both Ti and Al layers. In the unloaded state, the residual strains in Al grains are relatively large compared to the elastic limit of Al (Figure 8), whereas the residual strains in Ti grains are small compared to its elastic limit (Figure 12a). This observation is in agreement with the expected plastic deformation in the Al layers and the slight elastic deformation in the Ti layers caused by thermal stresses during furnace cooling from 500 °C to the room temperature. In other words, the soft Al layers are constrained by the hard Ti layers, but the hard Ti layers are almost free of constraint from the soft Al layers. Besides, it was also found previously that an intermittent TiAl3 layer about 100 nm in thickness was formed at the Ti-Al interface [4]. TiAl3 has a much higher yield strength compared to Ti and Al, and thus the thin layer of TiAl3, although not continuous at the interface, also has a constraint effect on the plastic deformation of both Ti and Al.
During tensile loading, plastic deformation occurs in the Al layers. However, due to the dislocations in the initial microstructure, the change of the dislocation density in the Al layers is not significant for the first three steps of tensile loading, as shown in Figure 7, where the change in the width of the diffraction intensity profile of the energy scans is small. On the other hand, the significant change of profile width after the tensile strain of 1.66% indicates a significant increase of the dislocation density in the Al layers at this strain [23,25]. This high dislocation density also leads to many artificially large values of the estimated deviatoric strain (magnitudes larger than 2 × 10⁻³ shown as dark red/blue in Figure 4 and Figure 5). The interface constraint effect can be seen from the large variation of the lattice strain near the interface in grain G1 (Figure 8a) and the large tensile lattice strain near the interface in grain G3 (Figure 8b). In both cases, more independent slip systems in the Al layers are expected to operate near the interface, compared to the middle of the layer, to accommodate the plastic strain requirement at the layer interface [8].
4.3. Elastic-Plastic Transition
Figure 1b shows that the slopes of the tensile curves for Al and Ti change gradually, indicating that the existence of true linear elastic regions is negligible. Such a phenomenon appears to be universal in polycrystalline metallic materials [26], including hot-rolled Ti-Al LMCs [4]. Micro-plasticity, i.e., local plastic deformation while the sample is still in the macroscopic elastic range, has been known for almost a century [27,28], and the dislocation pile-up and relaxation process is considered to be the primary mechanism behind it [26,29]. The large variation of the residual elastic strain observed in the current work gives further support to this hypothesis. As shown in Figure 2d and Figure 9a, a local glide of dislocations in the “hot spots” (regions with a large residual deviatoric strain ε′TA) is expected after a small tensile load. Such local glide events increase with the increasing external loading, leading to a decreasing slope of the tensile curve, i.e., a decreasing chord modulus. It follows that there is a gradual elastic-plastic transition in these materials, rather than an abrupt transition due to sudden macroscopic yielding.
During furnace cooling, residual elastic strains develop in the Al layers mainly due to thermal stresses at layer interfaces (because of the difference in the thermal expansion coefficient between Al and Ti), while residual elastic strains develop in the Ti layers mainly due to the anisotropy of thermal expansion/contraction in the Ti of the hexagonal close-packed (hcp) structure. The former is on the sample scale and is thus related to type I residual stresses, whereas the latter is on the grain scale and thus related to type II residual stresses [9]. These residual strains and stresses have a strong effect on the micro-plasticity of the Ti-Al LMC sample during tensile loading. Meanwhile, during furnace cooling, a dislocation structure is formed in the Al layers due to thermal stresses, and the hot-rolled dislocation structures in the Ti layers are not fully restored. These dislocation structures also have a strong influence on the micro-plasticity of the Ti-Al LMC sample during tensile loading by providing the carrier and barrier of local plastic deformation. Moreover, the influence of this initial microstructure, coupled with the interface constraint, continues during the plastic deformation of the Al layers, as found previously [8].
5. Conclusions
An in situ synchrotron-based micro-diffraction experiment is carried out to investigate the evolution of spatially resolved elastic strains in the bulk interior of a laminated Ti-Al metal composite (LMC) during tensile loading. For both Al and Ti grains, the deviatoric strain ε′ is estimated based on polychromatic X-ray microbeam diffraction, and the lattice strain εND is measured in the normal direction using monochromatic X-ray microbeam diffraction. The main conclusions are as follows:
- The polychromatic DAXM technique is capable of not only revealing the local variation of the deviatoric strain in the Ti-Al LMC but also of providing a good estimate of the magnitude of the average deviatoric strain (ε′TA = 3.5 × 10⁻⁴ for Al and ε′TA = 1.86 × 10⁻³ for Ti after a tensile strain of 1.66%). The monochromatic DAXM technique is capable of determining the absolute lattice strain component in the Ti-Al LMC, showing large spatial and temporal variations during tensile loading.
- There is a reasonable agreement between the average values of the estimated deviatoric strain and measured lattice strain, especially when the calculated average hydrostatic strain is considered. These average strains are consistent with the loading condition and are generally within the limits set by the flow stresses of Al and Ti.
- The variation of the elastic strain near the interfaces in Al layers is larger than that in the middle of the layer during tensile loading, showing a strong influence of the interface constraint to the Al layers. This is caused by the high initial dislocation density near the interfaces and the requirement of activating dislocations with a wide variety of Burgers vectors to accommodate the strain near the interfaces.
- The residual elastic strain is found to be large in the Al layers and small in the Ti layers compared to their elastic limits, respectively. The local variation of residual strain plays an important role in the micro-plasticity of the Ti-Al LMC sample during tensile loading, leading to a gradual elastic-plastic transition.
Supplementary Materials
The following are available online at https://www.mdpi.com/article/10.3390/met11040668/s1, Figure S1: Example of depth-resolved diffraction pattern from the Al., Figure S2: Example of depth-resolved diffraction pattern from the Ti., Figure S3: Example of diffraction intensity profile (fitted by a Gaussian function) of the energy scan in an Al voxel before tensile loading., Figure S4: Example of diffraction intensity profile (fitted by a Gaussian function) of the energy scan in a Ti voxel before tensile loading.
Author Contributions
Conceptualization, (T.Y., Y.D., G.F., R.B., D.J.J., Y.Z.); methodology, T.Y., Y.D. and Y.Z.; writing—original draft preparation, T.Y.; writing—review and editing, (T.Y., Y.D., G.F., R.B., D.J.J., Y.Z.). All authors have read and agreed to the published version of the manuscript.
Funding
This research was funded by the European Research Council (ERC) under the European Union’s Horizon 2020 research and innovation program (M4D—grant agreement no. 788567). This research used resources of the Advanced Photon Source, a U.S. Department of Energy (DOE) Office of Science User Facility operated for the DOE Office of Science by Argonne National Laboratory under Contract no. DE-AC02-06CH11357.
Institutional Review Board Statement
Not applicable.
Informed Consent Statement
Not applicable.
Data Availability Statement
The data presented in this study are available from the corresponding author, upon reasonable request.
Conflicts of Interest
The authors declare no conflict of interest.
References
- Lesuer, D.R.; Syn, C.K.; Sherby, O.D.; Wadsworth, J.; Lewandowski, J.J.; Hunt, W.H. Mechanical behaviour of laminated metal composites. Int. Mater. Rev. 1996, 41, 169–197. [Google Scholar] [CrossRef]
- Wu, H.; Fan, G. An overview of tailoring strain delocalization for strength-ductility synergy. Prog. Mater. Sci. 2020, 100675. [Google Scholar] [CrossRef]
- Kümmel, F.; Hausöl, T.; Höppel, H.W.; Göken, M. Enhanced fatigue lives in AA1050A/AA5005 laminated metal composites produced by accumulative roll bonding. Acta Mater. 2016, 120, 150–158. [Google Scholar] [CrossRef]
- Du, Y.; Fan, G.; Yu, T.; Hansen, N.; Geng, L.; Huang, X. Laminated Ti-Al composites: Processing, structure and strength. Mater. Sci. Eng. A 2016, 673, 572–580. [Google Scholar] [CrossRef]
- Ohsaki, S.; Kato, S.; Tsuji, N.; Ohkubo, T.; Hono, K. Bulk mechanical alloying of Cu–Ag and Cu/Zr two-phase microstructures by accumulative roll-bonding process. Acta Mater. 2007, 55, 2885–2895. [Google Scholar] [CrossRef]
- Li, D.; Fan, G.; Huang, X.; Juul Jensen, D.; Miao, K.; Xu, C.; Geng, L.; Zhang, Y.; Yu, T. Enhanced strength in pure Ti via design of alternating coarse- and fine-grain layers. Acta Mater. 2021, 206, 116627. [Google Scholar] [CrossRef]
- Ma, M.; Huo, P.; Liu, W.C.; Wang, G.J.; Wang, D.M. Microstructure and mechanical properties of Al/Ti/Al laminated composites prepared by roll bonding. Mater. Sci. Eng. A 2015, 636, 301–310. [Google Scholar] [CrossRef]
- Yu, T.; Du, Y.; Fan, G.; Xu, R.; Barabash, R.; Hansen, N.; Huang, X.; Zhang, Y. In-situ synchrotron X-ray micro-diffraction investigation of ultra-low-strain deformation microstructure in laminated Ti-Al composites. Acta Mater. 2021, 202, 149–158. [Google Scholar] [CrossRef]
- Withers, P.J.; Bhadeshia, H.K.D.H. Residual stress. Part 1–measurement techniques. Mater. Sci. Technol. 2001, 17, 355–365. [Google Scholar] [CrossRef]
- Huang, M.; Xu, C.; Fan, G.; Maawad, E.; Gan, W.; Geng, L.; Lin, F.; Tang, G.; Wu, H.; Du, Y.; et al. Role of layered structure in ductility improvement of layered Ti-Al metal composite. Acta Mater. 2018, 153, 235–249. [Google Scholar] [CrossRef]
- Poulsen, H.F. An introduction to three-dimensional X-ray diffraction microscopy. J. Appl. Crystallogr. 2012, 45, 1084–1097. [Google Scholar] [CrossRef]
- Reischig, P.; King, A.; Nervo, L.; Viganó, N.; Guilhem, Y.; Palenstijn, W.J.; Batenburg, K.J.; Preuss, M.; Ludwig, W. Advances in X-ray diffraction contrast tomography: Flexibility in the setup geometry and application to multiphase materials. J. Appl. Crystallogr. 2013, 46, 297–311. [Google Scholar] [CrossRef]
- Larson, B.C.; Levine, L.E. Submicrometre-resolution polychromatic three-dimensional X-ray microscopy. J. Appl. Crystallogr. 2013, 46, 153–164. [Google Scholar] [CrossRef]
- Abdolvand, H.; Wright, J.; Wilkinson, A.J. Strong grain neighbour effects in polycrystals. Nat. Commun. 2018, 9, 171. [Google Scholar] [CrossRef]
- Barabash, R.I.; Liu, W.; Tischler, J.Z.; Bei, H.; Budai, J.D. Phase-specific elastic/plastic interface interactions in layered NiAl-Cr(Mo) structures. Acta Mater. 2012, 60, 3279–3286. [Google Scholar] [CrossRef]
- Larson, B.C.; Yang, W.; Ice, G.E.; Budai, J.D.; Tischler, J.Z. Three-dimensional X-ray structural microscopy with submicrometre resolution. Nature 2002, 415, 887–890. [Google Scholar] [CrossRef]
- Levine, L.E.; Larson, B.C.; Yang, W.; Kassner, M.E.; Tischler, J.Z.; Delos-Reyes, M.; Fields, R.J.; Liu, W. X-ray microbeam measurements of individual dislocation cell elastic strains in deformed single-crystal copper. Nat. Mater. 2006, 5, 619–622. [Google Scholar] [CrossRef]
- Phan, T.Q.; Levine, L.E.; Lee, I.F.; Xu, R.; Tischler, J.Z.; Huang, Y.; Langdon, T.G.; Kassner, M.E. Synchrotron X-ray microbeam diffraction measurements of full elastic long range internal strain and stress tensors in commercial-purity aluminum processed by multiple passes of equal-channel angular pressing. Acta Mater. 2016, 112, 231–241. [Google Scholar] [CrossRef]
- Tischler, J.Z. Reconstructing 2D and 3D X-ray orientation maps from white-beam laue. In Strain and Dislocation Gradients from Diffraction: Spatially-Resolved Local Structure and Defects; Barabash, R., Ed.; Imperial College Press: London, UK, 2014; pp. 358–375. [Google Scholar]
- Zhang, Y.; Barabash, R. High Resolution Mapping of Orientation and Strain Gradients in Metals by Synchrotron 3D X-ray Laue Microdiffraction. Quantum Beam Sci. 2019, 3, 6. [Google Scholar] [CrossRef]
- Witt, W. Absolute Präzisionsbestimmung von Gitterkonstanten an Germanium- und Aluminium-Einkristallen mit Elektroneninterferenzen. Zeitschrift fur Naturforsch. Zeitschrift für Naturforschung 1967, 22, 92–95. [Google Scholar] [CrossRef]
- Pawar, R.R.; Deshpande, V.T. The anisotropy of the thermal expansion of α-titanium. Acta Crystallogr. Sect. A 1968, 24, 316–317. [Google Scholar] [CrossRef]
- Ice, G.E.; Barabash, R.I. White Beam Microdiffraction and Dislocations Gradients. In Dislocations in Solids; Elsevier Science: New York, NY, USA, 2007; Volume 13, pp. 499–601. [Google Scholar]
- Barabash, R.I.; Barabash, O.M.; Ojima, M.; Yu, Z.; Inoue, J.; Nambu, S.; Koseki, T.; Xu, R.; Feng, Z. Interphase strain gradients in multilayered steel composite from microdiffraction. Metall. Mater. Trans. A Phys. Metall. Mater. Sci. 2014, 45, 98–108. [Google Scholar] [CrossRef]
- Zhou, G.; Pantleon, W.; Xu, R.; Liu, W.; Chen, K.; Zhang, Y. Quantification of local dislocation density using 3D synchrotron monochromatic X-ray microdiffraction. Mater. Res. Lett. 2021, 9, 183–189. [Google Scholar] [CrossRef]
- Chen, Z.; Bong, H.J.; Li, D.; Wagoner, R.H. The elastic-plastic transition of metals. Int. J. Plast. 2016, 83, 178–201. [Google Scholar] [CrossRef]
- Hanson, A.W. Elastic behavior and elastic constants of zinc single crystals. Phys. Rev. 1934, 45, 324–331. [Google Scholar] [CrossRef]
- Chalmers, B. Micro-plasticity in crystals of tin. Proc. Math. Phys. Eng. Sci. 1936, 156, 427–443. [Google Scholar] [CrossRef]
- Maaß, R.; Derlet, P.M. Micro-plasticity and recent insights from intermittent and small-scale plasticity. Acta Mater. 2018, 143, 338–363. [Google Scholar] [CrossRef]


Publisher’s Note: MDPI stays neutral with regard to jurisdictional claims in published maps and institutional affiliations. |
© 2021 by the authors. Licensee MDPI, Basel, Switzerland. This article is an open access article distributed under the terms and conditions of the Creative Commons Attribution (CC BY) license (https://creativecommons.org/licenses/by/4.0/).