Article

High-Temperature Deformation of Naturally Aged 7010 Aluminum Alloy

by
Abdulhakim A. Almajid
1,2
1
Mechanical Engineering Department, College of Engineering, King Saud University, P.O. Box 800, Riyadh 11421, Saudi Arabia
2
Department of Engineering Management, College of Engineering, Prince Sultan University, P.O. Box 66833, Riyadh 11586, Saudi Arabia
Metals 2021, 11(4), 581; https://doi.org/10.3390/met11040581
Submission received: 24 February 2021 / Revised: 13 March 2021 / Accepted: 29 March 2021 / Published: 2 April 2021

Abstract

:
This study is focused on the deformation mechanism and behavior of naturally aged 7010 aluminum alloy at elevated temperatures. The specimens were naturally aged for 60 days to reach a saturated hardness state. High-temperature tensile tests for the naturally aged sample were conducted at different temperatures of 573, 623, 673, and 723 K at various strain rates ranging from 5 × 10⁻⁵ to 10−2 s−1. The dependency of stress on the strain rate showed a stress exponent, n, of ~6.5 for the low two temperatures and ~4.5 for the high two temperatures. The apparent activation energies of 290 and 165 kJ/mol are observed at the low, and high-temperature range, respectively. These values of activation energies are greater than those of solute/solvent self-diffusion. The stress exponents, n, and activation energy observed are rather high and this indicates the presence of threshold stress. This behavior occurred as a result of the dislocation interaction with the second phase particles that are existed in the alloy at the testing temperatures. The threshold stress decreases in an exponential manner as temperature increases. The true activation energy was computed by incorporating the threshold stress in the power-law relation between the stress and the strain. The magnitude of the true activation energy, Qt dropped to 234 and 102 kJ/mol at the low and high-temperature range, respectively. These values are close to that of diffusion of Zinc in Aluminum and diffusion of Magnesium in Aluminum, respectively. The Zener–Hollomon parameter for the alloy was developed as a function of effective stress. The data in each region (low and high-temperature region) coalescence in a segment line in each region.

1. Introduction

The deformation of aluminum and aluminum alloys at high-temperatures has received great interest in recent years [1,2,3,4]. Many engine components are manufactured using aluminum-based materials. Adding alloying elements to aluminum generally improves the mechanical properties of aluminum [5,6,7,8,9]. Aerospace and automotive industries utilize aluminum alloys in many structural components. There is great interest in developing high-strength aluminum alloys. The controlling process during high-temperature deformation is the dynamic recovery [4,5,6,7,8,9,10,11]. One of the most effective methods for strengthening the aluminum alloy is by precipitation of fine particles [12,13,14,15]. Second phase particles hinder the dislocation glide and cause the flow stress to rise. In creep experiments, the relation between the applied stress and the resulting strain rate is represented by the power-law function [5],
ε ˙ = A σ n exp Q a R T
where A is a constant, σ is the applied stress, n is the stress exponent, Qa is the apparent activation energy, R is the universal gas constant, and T is the absolute temperature. The magnitude of the stress exponents classifies metals and alloys [8,12]. Two well-known classes of alloys exist, Class I and Class II alloys. Class I alloys (alloy class) have a stress exponent of ~3 and strain rate is controlled by solute drag mechanism as in the case of Al-Mg alloys [16,17,18,19] and Al-Cu alloys [20]. Solid solution hardening is exhibited in Class I due to the high atomic–misfit parameter. Class II alloys (metal class) have a stress exponent of ~5, as in the case of pure metals, and have low misfit parameters in the solid solutions. Dislocation climb is believed to be the strain rate controlling process in Class II [8,9]. The deformation mechanism in solid solution alloys started with dislocation climb and then followed by viscous glide. The slower process between the two processes controls the mechanism of deformation under the enforced experimental conditions [21]. The addition of Mg and/or Cu of high misfit parameter usually increase the strength of the alloy, and change the rate-controlling process from dislocation climb as in pure aluminum to dislocation glide in Al/Mg and Al/Cu alloys [19,20]. There exist different viscous drag processes that can simultaneously work with the solute drag mechanism. The contribution of each process depends on the type of alloy system [21,22].
High-temperature deformations of aluminum alloys are identified by the existence of the threshold stress, σo. Second phase particles interact with dislocations in aluminum alloys and induce threshold stress [23,24]. As a result, the deformation process is directed by the effective stress (σe = σ − σo). Spigarelli et al. [25] found that the stress exponent for hyper eutectic Al-17Si was around 4 to 5. The value of the stress exponent obtained was comparable to that evaluated in pure aluminum. On the other hand, the observed apparent activation energy was (Q = 210 kJ/mol) which was higher than the activation energy for self-diffusion in Al (Qd = 143 kJ/mol) [21]. This indicates that the threshold stress concept should be considered as it addresses the apparent activation energy and the stress exponent for creep [23]. True activation energy is then calculated based on the presence threshold stress and the resulted value is 160 kJ/mol [25]. The true activation energy value is somehow similar to that of pure aluminum. The high-temperature deformation of solid solution treated AA 7010 was investigated in our earlier work [15] and showed that the strain rate is controlled by threshold stress. The values of stress exponent, n, and apparent activation, Qa were ~8.5 and 170 kJ/mol, respectively, for the different range of temperatures and strain rate applied, and climb of dislocations is the controlling deformation mechanism. The true activation energy was found to be 137 kJ/mol and n~5 when threshold stress was considered in the analysis.
The increased use of aluminum alloys in high-temperature applications, such as engine blocks, requires a better understanding of the performance of these alloys at high temperatures. In this work, the deformation behavior of naturally aged 7010 aluminum alloy at high temperatures is studied. The existence of threshold stress in the alloy system is investigated. The study will also discuss the rate-controlling mechanism for the hot deformation of the alloy as a sequence of second phase particles.

2. Materials and Methods

The Al-Zn alloy used in this study is a commercial alloy AA 7010 obtained from Smiths Company (Bedfordshire, UK). The material was characterized to identify the elemental analysis in the alloy using optical emission spectroscopy (SPECTRO Analytical Instruments GmbH., Kleve, Germany). Table 1 shows the composition of the AA 7010 obtained from the optical emission spectroscopy. Tensile specimens were cut to the required dimensions in order to conduct high-temperature experiments. The tensile specimens have a gauge length of 15 mm and a cross-section of 5 × 3 mm2. The longitudinal direction of the tensile samples was machined in a direction that is parallel to the rolling direction. AA 7010 alloy samples were heated to the solid solution state at 748 K for two hours and then quenched in a water bath. The samples were then naturally aged at room temperature for 60 days. The Vickers microhardness of naturally aged samples was measured using Buhler hardness tester (model micromet-5114, Buhler, Lake Bluff, IL, USA) at room temperature using a tungsten carbide ball of 1mm diameter and a load of 100 gf. At least five readings were conducted for each test.
The tensile tests were conducted using a tensile testing machine (Instron, model 3385H, Norwood, MA, USA) with three heating zone split furnace. Tensile samples were heated to the desired testing temperature and were held at that temperature for 30 min prior to testing in the air. Four testing temperatures were selected; 573, 623, 673, and 723 K. The selected temperatures are similar to actual forming conditions found in the industry for this alloy. The testing temperatures were maintained by connecting a thermocouple to the sample’s gauge section. Various testing speed is conducted at each testing temperature. Testing speed was designed to have initial strain rates ranging from 5 × 10⁻⁵ s−1 to 10−2 s−1. The strain rates were based on the initial gauge length of the tensile specimens.

3. Results

3.1. Hardness

The Vickers hardness of the naturally aged AA 7010 was measured as a function of aging time. The specimens were heated to 748 K (475 °C) and were soaked at that temperature for two hours. Then, the material quenched in cold water. The hardness versus time was then measured. Figure 1 shows the change of hardness versus time for the naturally aged samples. The duration of the test was 60 days. The hardness of AA 7010 is 75 HV just after quenching. The hardness increased with time and reached a constant value of 137 HV after 12 days. The values of hardness were recorded for the remaining time but slight changes occurred on it. The hardness reached a maximum after two weeks. The decomposition of the supersaturated solid solution during natural aging promotes the precipitation of the η hexagonal phase first (Mg(Zn2, AlCu)), and then of the S orthorhombic (Al2CuMg) and T cubic (Al32(Mg, Zn)49) phases [26]. These phases are fine and dispersed in the matrix of the alloy that hinder the motion of dislocations at high temperature and result in the presence of threshold stress, σo [23,24,25]. The present model is basically based on the effect of σo on the calculated values of stress exponent and activation energy.

3.2. True Stress-Strain Rate

The true stress-strain curves of AA 7010 for temperatures 673 and 723 K are shown in Figure 2a,b. At each testing temperature, different initial strain rates test conducted. Three regions in the true stress-strain curve are observed; namely; strain hardening region, steady-state stress region, necking, and/or failure region. True stress increases with the increase in strain rate. The maximum stress reduces with the increase in testing temperature.

3.3. Stress Dependence on Strain Rate
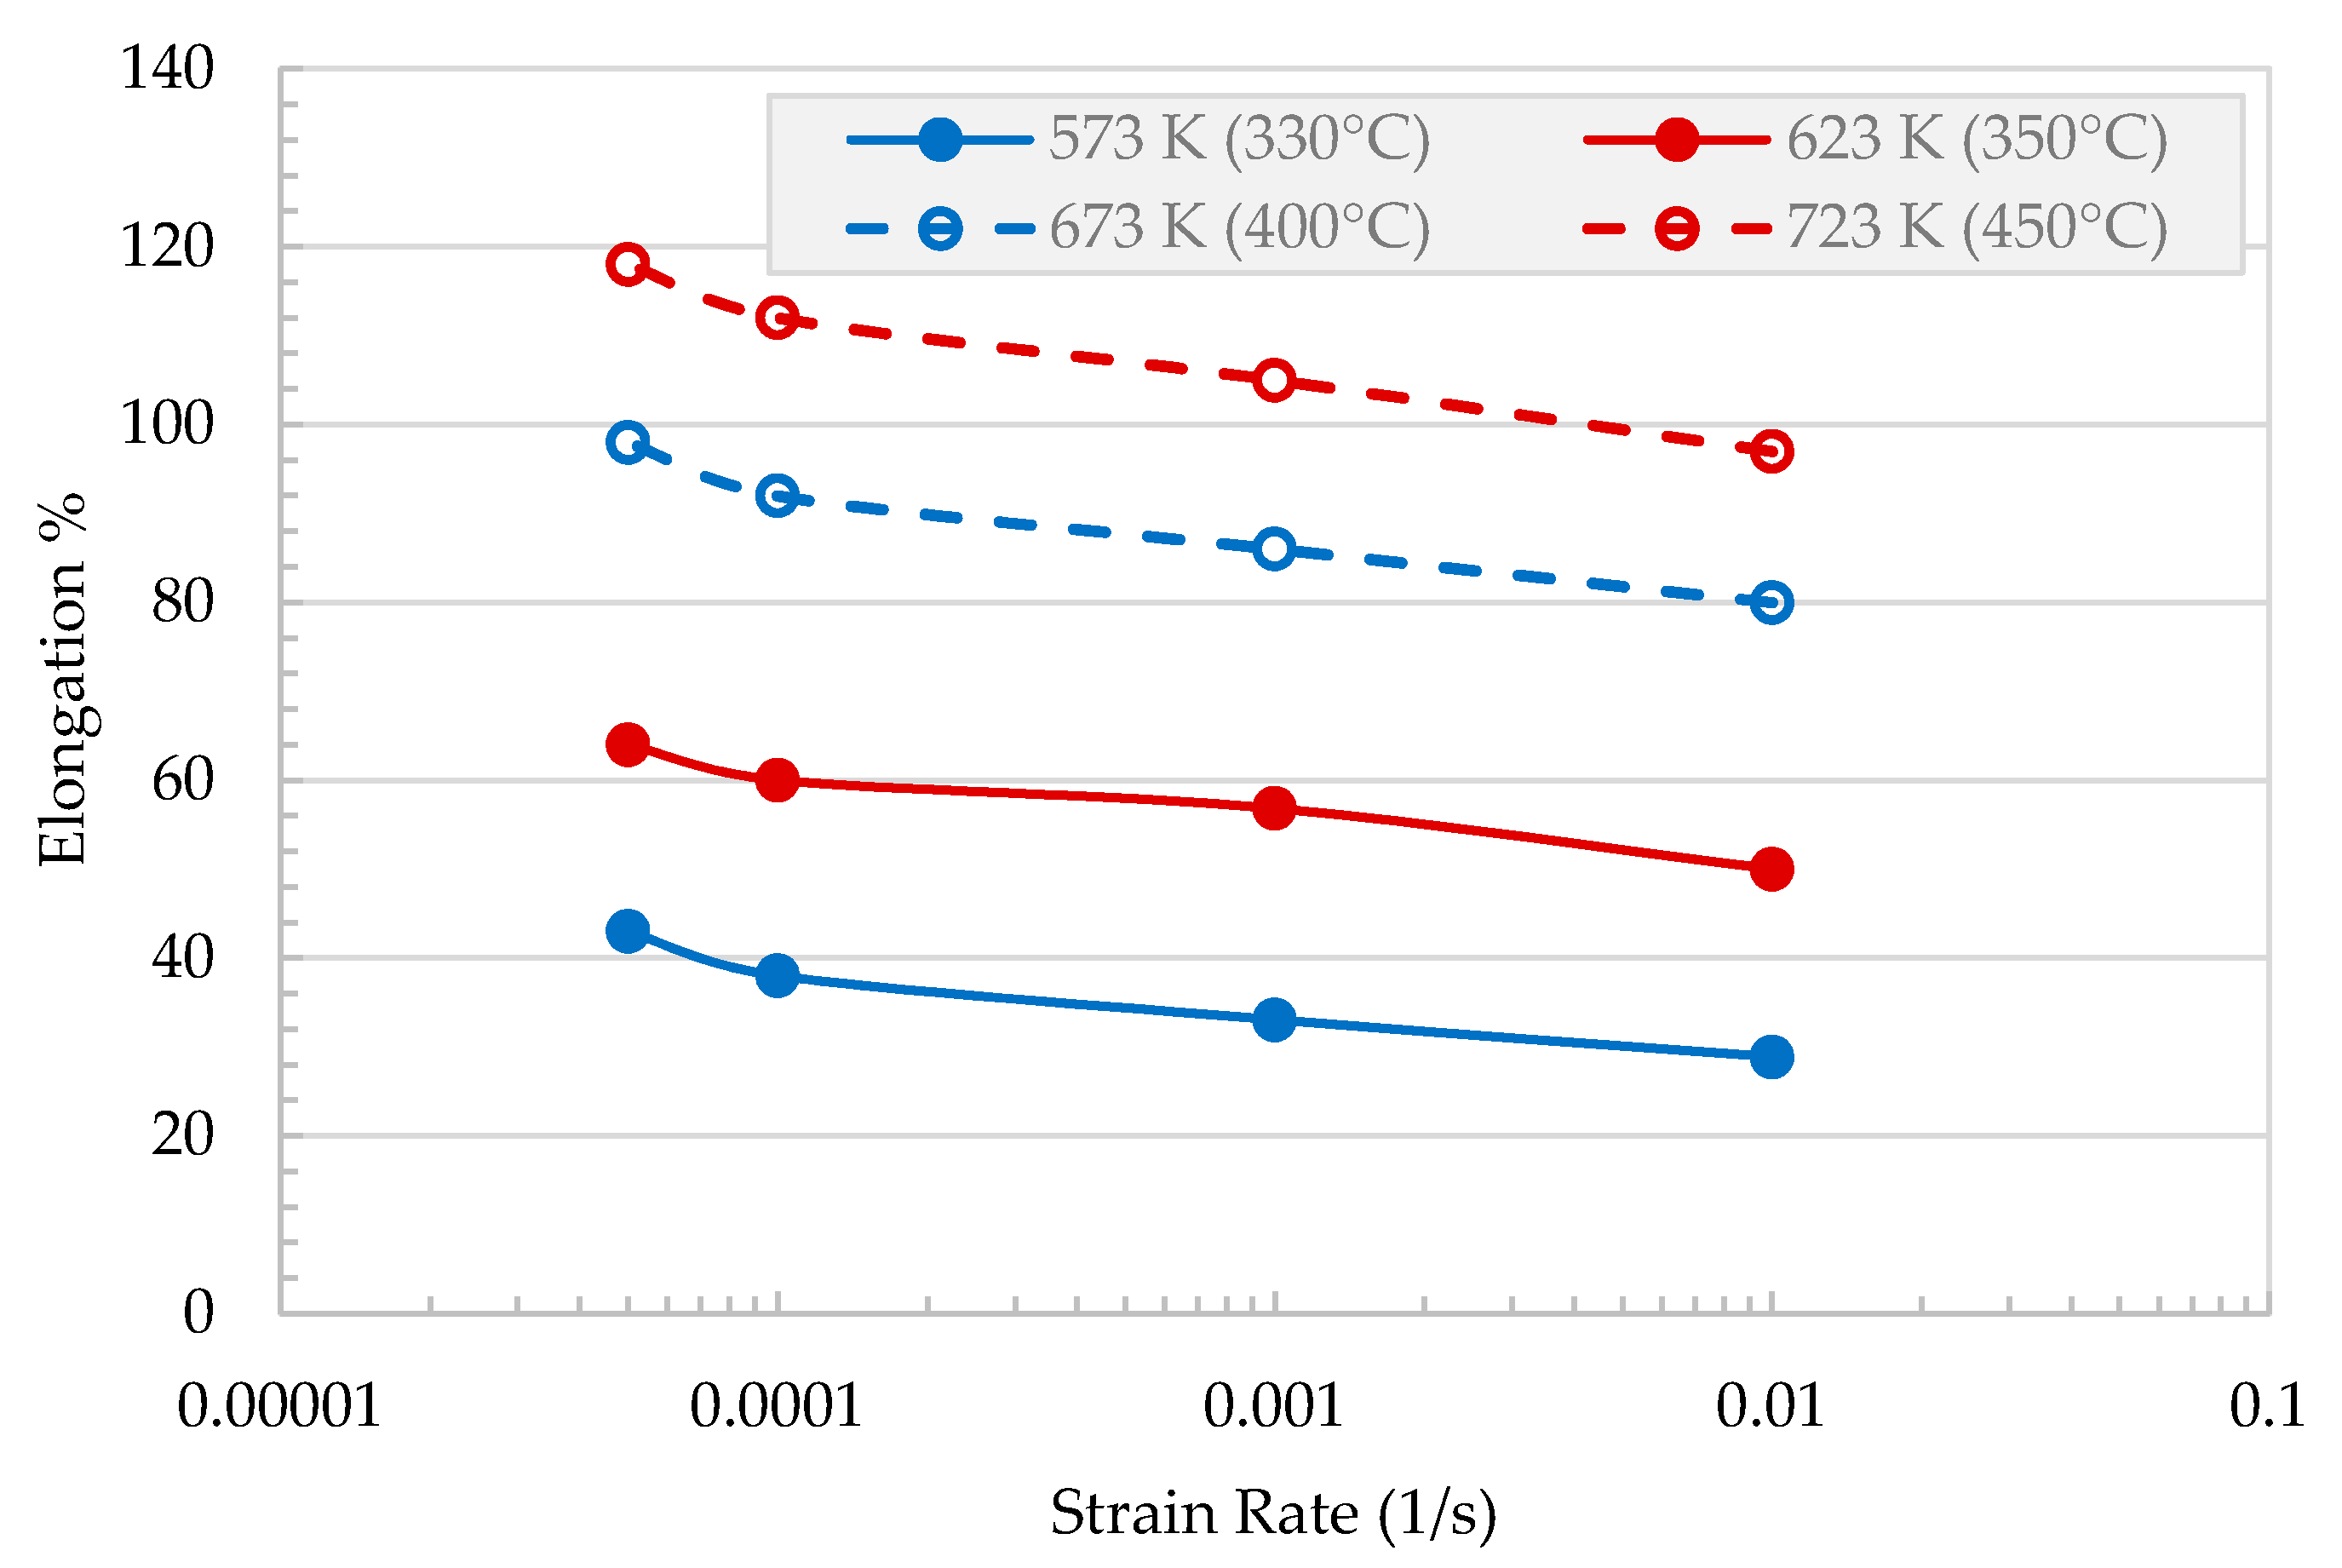
The effect of strain rate on the stress is presented in Figure 3. The relationship between strain rate, ε ˙ , and stress is presented in a double logarithmic scale. The graph was obtained for various temperatures, 573, 623, 673, and 723 K. The values of the strain rate-stress points for the range of temperatures tested fall on line segments with a stress exponent of n~6.5 for the low-temperature range, while n~4.5 for the high-temperature range.

3.4. Ductility

Elongation at the break (ductility) is drawn as a function of testing temperature for different initial strain rate, ε ˙ , is presented in Figure 4. Strain at the break increases with the increase in testing temperature and decreases with the increase in strain rate.

3.5. Apparent Activation Energy

The power-law function that relates the applied stress to strain in Equation (1) can be re-arranged for constant strain rate as,
Q a = n R ln σ 1 T ε ˙ = n R ln σ 2 / σ 1 1 T 2 1 T 1 ε ˙
The apparent activation energy can be computed using Equation (2) for each temperature range. Table 2 presents the activation energy, which gives Qa a value of 290 kJ/mol for the low-temperature range and 165 kJ/mol for the high-temperature range. The values of apparent activation energy calculated are higher than that for self-diffusion of aluminum which reflects the effect of the threshold stress process. It is clear from Table 2 that the strain rate does not affect the apparent activation energy, i.e., no change in the deformation process as reflected in the constant stress exponent value, n, over the strain rate range investigated. The standard deviations of the activation energies in Table 2 were within 2–3%.

4. Discussion

4.1. Threshold Stress

The values stress exponent, n, developed in Figure 3 has a value of 6.5 for the low-temperature range and 4.5 for the high temperatures range. The stress exponent value, n, found in the current study is greater than those found for binary Al-Zn alloys (n = 5) at comparable temperatures and strain rates [21,22]. Although the value of n, at a high temperature reaches 4.5, this value is associated with high activation energy. The existence of threshold stress might be the reason for the difference in stress exponent, n. The threshold stress is developed as the dislocations interact with the second phase particles. The threshold stress can be obtained by plotting ε ˙ 1 / n versus stress as shown in Figure 5. Figure 5a presents the plot of stress vs. ε ˙ 1 / 5 for the low-temperature range, while Figure 5b presents the plot of stress vs. ε ˙ 1 / 3 for the high-temperature range. The data points for the high-temperature zone (Figure 5b) represent a straight line. The extrapolation intersection of these lines with the y-axis provides the magnitude of the threshold stress, σo, at each temperature. The values of σo are 23.8, 12.7, 11.3, and 7.2 MPa at 573, 623, 673, and 723 K, respectively. The threshold stress, σo, decrease with the increase in testing temperature. [15,16].
The relation between the normalized threshold stress (σo/G) and the temperature reciprocal (1/T) is shown in Figure 6; G is the shear modulus of Al [20]. The plot is presented in a semi-logarithmic curve. The threshold stress increases with the decrease of testing temperature. This relationship can be expressed as,
σ o G = B o   exp Q o R T
where Bo is a constant with a value of 1 × 10⁻⁶ and Qo is also another constant with a value of 34.2 kJ/mol. The behavior observed here is comparable to that observed in other aluminum alloys and aluminum composites [23,24]. The data of threshold stress in both low and high-temperature regions suggest that the interaction mechanism of dislocations with second-phase particles is similar in both regions. The effective stresses (σ − σo) are plotted against the strain rates in a double logarithmic scale as shown in Figure 7. The stress exponent, n, can be estimated to be approximately 3 for the high-temperature range and 5 for the low-temperature range.

4.2. True Activation Energy

Equation (1) can be modified to account for the threshold stress that is existed in the alloy. Applied stress can be exchanged by the effective stress, (σ − σo). Equation (1) will then be,
ε ˙ k T D G b = A o σ σ o G n with       D = D o exp Q t R T                      
where k is Boltzmann’s constant, Ao is a dimensionless constant, b is the magnitude of the Burgers vector, Qt is the diffusion true activation energy that guides the deformation mechanism, and Do is a diffusion constant. By re-arranging Equation (4), at constant strain rate, the following equation obtained,
exp Q t R T = C G T σ σ o G n
where C is a constant.
Equation (5) can be modified by taking the natural logarithm of all terms in the equation followed by differentiating the equation with respect to (1/T). The equation is then can be written in terms of Qt as:
Q t = R ln G T σ σ o G n 1 T .
True activation energy can be computed from Equation (6) by calculating the term ln G T σ σ o G n at two different temperatures in each region. The true activation energy was computed at four different strain rates in each temperature range (Table 3).
As presented in Table 3, the average magnitude of true activation energy, Qt, at low temperature was computed as 234 kJ/mol. This value is approximate to that described in the literature for self-diffusion of Zinc in Aluminum [21]. At high-temperature range (n = 3), the activation energy is approximate to the diffusion of Magnesium in Aluminum (102 kJ/mol) [27]. A similar observation is drawn here compared to Table 2 that the strain rate does not affect true activation energy. The standard deviations of the true activation energies in Table 3 were within 2–3%.
For the two regions, the Zener–Hollomon parameter Z = ε ˙   e x p Q t R T is plotted versus the effective stress (Figure 8) using the true value of Qt at the two regions. The data in each region coalescence in a single segment line. The value of n = 5 at low temperature, suggests that deformation is controlled by dislocation climb using Zn diffusion. On the other hand, at high temperatures, the flow is dominated by the viscous glide of dislocations controlled by the diffusion of Mg atoms. The separation of the two lines is due to the difference in Qt for both regions.

5. Conclusions

Hot deformation behavior and deformation mechanism of naturally aged AA7010 Al alloy were investigated at high temperatures in the range of 573–723 K at different strain rates ranging from 5 × 10⁻⁵ to 10−2 s−1. The value stress exponent, n, and the apparent activation energy, Qa’s were found to be ~6.5 and 290 kJ/mol for low-temperature range (573–623 K), and ~4.5 and 165 kJ/mol for the high-temperature range (673–723 K), respectively. Based on the analysis, threshold stress appeared to be present in the alloy during the deformation. The threshold stress decreases with the increase in temperature.
The true activation energy of the alloy was calculated and the value was 234 kJ/mol at a low-temperature range where n = 5. For the high-temperature range, the true activation energy was 102 kJ/mol where n = 3. By integrating the threshold stress in the analysis and plotting Zener–Hollomon against normalized effective stress, the slope of the curve revealed that a stress exponent, n of five for low-temperature range, and three for high-temperature range.
The changes in stress exponent value, n, from three to five indicate that the mechanism of deformation was dislocation climb in the low-temperature range to viscous glide in the high-temperature range. The ductility of the alloys increases with the increase in temperature, while the ductility decrease with the increase in strain rate.

Funding

This research received no external funding.

Institutional Review Board Statement

Not applicable.

Informed Con sent Statement

Not applicable.

Data Availability Statement

The data presented in this study are available on request from the corresponding author.

Conflicts of Interest

The authors declare no conflict of interest.

References

  1. McQueen, H.; Jones, J. Recovery and Recrystallization during High Temperature Deformation. In Plastic Deformation of Materials; Arsenault, R., Ed.; Academic Press: New York, NY, USA, 1975; Volume 6, pp. 393–493. [Google Scholar]
  2. Kaibyshev, R.; Sitdikov, O.; Mazurina, I.; Lesuer, D. Deformation Behavior of a 2219 Al Alloy. Mater. Sci. Eng. A 2002, 334, 104. [Google Scholar] [CrossRef]
  3. Marquis, E.; Seidman, D.; Dunand, D. Effect of Mg Addition on the Creep and Yield Behavior of an Al-Sc Alloy. Acta Mater. 2003, 51, 4751–4760. [Google Scholar] [CrossRef]
  4. He, Z.; Wang, Z.; Lin, Y.; Fan, X. Hot Deformation Behavior of a 2024 Aluminum Alloy Sheet and its Modeling by Fields-Backofen Model Considering Strain Rate Evolution. Metals 2019, 9, 243. [Google Scholar] [CrossRef] [Green Version]
  5. McQueen, H.; Kassner, M. Elevated temperature deformation: Hot working amplifies creep. Mater. Sci. Eng. A 2005, 410–411, 58–61. [Google Scholar] [CrossRef]
  6. Seung-Baek, Y.; Mok-Soon, K. Microstructure and High Temperature Deformation of Extruded Al-12Si-3Cu-Based Alloy. Metals 2016, 6, 32. [Google Scholar]
  7. Mrowka-Nowotnik, G.; Sieniawski, J. Influence of heat treatment on the microstructure and mechanical properties of 6005 and 6082 aluminium alloys. J. Mater. Process. Technol. 2005, 162, 367–372. [Google Scholar] [CrossRef]
  8. Kassner, M.; Perez-Prado, M. Five-Power-Law Creep in SinglePhase Metals and Alloys. Prog. Mater. Sci. 2000, 45, 1–102. [Google Scholar] [CrossRef]
  9. Soliman, M.; Mohamed, F. Correlation between Creep Behavior and Substructure in Al-3% Mg Solid-Solution Alloy. Mat. Sci. Eng. 1982, 55, 111–119. [Google Scholar] [CrossRef]
  10. Sajadifar, S.; Scharifi, E.; Weidig, U.; Steinhoff, K.; Niendorf, T. Performance of Thermo-Mechanically Processed AA7075 Alloy at Elevated Temperatures—From Microstructure to Mechanical Properties. Metals 2020, 10, 884. [Google Scholar] [CrossRef]
  11. Schindler, I.; Kawulok, P.; Očenášek, V.; Opěla, P.; Kawulok, R.; Rusz, S. Flow Stress and Hot Deformation Activation Energy of 6082 Aluminium Alloy Influenced by Initial Structural State. Metals 2019, 9, 1248. [Google Scholar] [CrossRef] [Green Version]
  12. Mohamed, F.; Langdon, T. The Transition from Dislocation Climb to Viscous Glide in Creep of Solid Solution Alloys. Acta Metall. 1974, 22, 779–788. [Google Scholar] [CrossRef]
  13. Yavari, P.; Mohamed, F.; Langdon, T. Creep and Substructure Formation in an Al-5% Mg Solid Solution Alloy. Acta Metall. 1981, 29, 1495–1507. [Google Scholar] [CrossRef]
  14. El-Danaf, E.; Almajid, A.; Soliman, M. Hot deformation of AA6082-T4 aluminum alloy. J. Mat. Sci. 2008, 43, 6324–6330. [Google Scholar] [CrossRef]
  15. Almajid, A. High temperature deformation of solution treated7010 Al-alloy. J. King Saud Univ. Eng. Sci. 2011, 23, 21–25. [Google Scholar]
  16. Abdu, M.; Soliman, M.; El-Danaf, E.; Almajid, A.; Mohamed, F. Creep characteristics and Microstructure in nanoparticle strengthened AA6082. Mater. Sci. Eng. A 2012, 531, 35–44. [Google Scholar] [CrossRef]
  17. Oikawa, H.; Honda, K.; Ito, S. Experimental Study on the Stress Range of Class I Behavior in the Creep of Al-Mg Alloys. Mat. Sci. Eng. 1984, 64, 237–245. [Google Scholar] [CrossRef]
  18. Oikawa, H.; Sato, H.; Maruyama, K. Influence of Temperature on the Transition of Deformation Characteristics of Al-1Mg Alloy in the Power Law Creep Regime. Mat. Sci. Eng. 1985, 75, 21–28. [Google Scholar] [CrossRef]
  19. Sato, H.; Oikawa, H. Further Experimental Study of Deformation Characteristics of Al-Mg Alloys in the Power-Law Creep Regime. Scr. Metall. 1988, 22, 87–92. [Google Scholar] [CrossRef]
  20. Soliman, M. Effect of Cu Concentration on the Creep Behavior of Al-Cu Solid-Solution Alloys. Mat. Sci. Eng. A 1995, 201, 111–117. [Google Scholar] [CrossRef]
  21. Soliman, M.; Mohamed, F. Creep Transitions in an Al-Zn Alloy. Metall. Trans. A 1984, 15, 1893–1904. [Google Scholar] [CrossRef]
  22. Mohamed, F. Incorporation of the Suzuki and the Fisher Interactions in the Analysis of Creep Behavior of Solid Solution Alloys. Mat. Sci. Eng. 1983, 61, 149–165. [Google Scholar] [CrossRef]
  23. Mohamed, F. Correlation between Creep Behavior in Al-based Solid Solution Alloys and Powder Metallurgy Al Alloys. Mat. Sci. Eng. A 1998, 245, 242–256. [Google Scholar] [CrossRef]
  24. Evangelista, E.; Spigarelli, S. Constitutive Equations for Creep and Plasticity of Aluminum Alloys Produced by Powder Metallurgy and Aluminum-Based Metal Matrix Composites. Metall. Mater. Trans. A 2002, 33, 373–381. [Google Scholar] [CrossRef]
  25. Spigarelli, S.; Evangelista, E.; Cucchieri, S. Analysis of the creep response of an Al–17Si–4Cu–0.55Mg alloy. Mat. Sci. Eng. A 2004, 387–389, 702–705. [Google Scholar] [CrossRef]
  26. Godard, D.; Archambault, P.; Aeby-Gautier, E.; Lapasset, G. Precipitation sequences during quenching of the AA 7010Alloy. Acta Mater. 2002, 50, 2319–2329. [Google Scholar] [CrossRef]
  27. Hamerskt, M.; Lukac, P.; Trojanova, Z.; Pink, E. Creep of Al-3wt% Mg as measured with the incremental loading method. Mat. Sci. Eng. A 1991, 148, 7–14. [Google Scholar] [CrossRef]
Figure 1. The Vickers hardness of AA 7010 versus time for naturally aged samples.
Metals 11 00581 g001
Figure 2. True stress versus true strain at; (a) 573 K (300 °C) and (b) 673 K (400 °C) at different initial strain rates.
Metals 11 00581 g002aMetals 11 00581 g002b
Figure 3. Strain rate versus stress at various temperatures, illustrating the value of stress exponent.
Metals 11 00581 g003
Figure 4. Elongation at failure, ef, versus temperature at various strain rates.
Metals 11 00581 g004
Figure 5. Double linear plot for (a) ε ˙ 1 / 5 , and (b) ε ˙ 1 / 3 versus stress at different temperatures.
Metals 11 00581 g005
Figure 6. The relation between normalized threshold stress and (1/T).
Metals 11 00581 g006
Figure 7. A double logarithmic plot of strain rate versus effective stress at different temperatures.
Metals 11 00581 g007
Figure 8. Zener–Hollomon parameter versus normalized effective stress for 7010 alloys.
Metals 11 00581 g008
Table 1. Chemical Composition of AA 7010 Alloy used in this study.
ElementZnMgCuSiFeMnAl
AA 7010 wt%5.72.41.840.290.150.03Bal
Table 2. Apparent Activation Energy for different temperature ranges.
Temperature Range
(K)
Strain RateActivation Energy,
Qa (kJ/mol)
Average Activation Energy,
Qa (kJ/mol)
573–62310−2292290
10−3291
10−4290
5 × 10−5288
673–72310−2165165
10−3165
10−4164
5 × 10−5164
Table 3. True Activation Energy for different temperature ranges.
Temperature Range
(K)
Strain RateTrue Activation Energy,
Qt (kJ/mol)
Average True ActivationEnergy,
Qt (kJ/mol)
573–623
(n = 5)
10−2235234
10−3230
10−4235
5 × 10−5234
673–723
(n = 3)
10−2102102
10−3101
10−4102
5 × 10−5103
Publisher’s Note: MDPI stays neutral with regard to jurisdictional claims in published maps and institutional affiliations.

