Abstract
Residual stresses resulting from hot-forming processes represent an important aspect of a component’s performance and service life. Considering the whole process chain of hot forming, the integrated heat treatment provided by a defined temperature profile during cooling offers a great potential for the targeted adjustment of the desired residual stress state. Finite element (FE) simulation is a powerful tool for virtual process design aimed at generating a beneficial residual stress profile. The validation of these FE models is typically carried out on the basis of individual surface points, as these are accessible through methods like X-ray diffraction, hole-drilling, or the nanoindentation method. However, especially in bulk forming components, it is important to evaluate the quality of the model based on residual stress data from the volume. For these reasons, in this paper, an FE model which was already validated by near surface X-ray diffraction analyses was used to explain the development of residual stresses in a reference hot forming process for different cooling scenarios. Subsequently, the reference process scenarios were experimentally performed, and the resulting residual stress distributions in the cross-section of the bulk specimens were determined by means of the contour method. These data were used to further validate the numerical simulation of the hot forming process, wherein a good agreement between the contour method and process simulation was observed.
1. Introduction
As a result of the manufacturing process, almost every component exhibits residual stresses (RS), which prevail in the absence of external forces or moments. Considering forgings, these stresses play an important role in predicting and controlling distortions during machining [1]. Furthermore, residual stresses are of particular importance for service life, the analysis of distortions, and the evaluation of failures [2]. For example, it has already been demonstrated scientifically in alternating bending tests that specimens with compressive RS on the surface have a higher fatigue strength than specimens with a disadvantageous RS depth distribution [2]. Furthermore, the RS in a component resulting from the manufacturing process has a significant impact on distortion, for instance, during a subsequent heat treatment [3].
For these reasons, a better understanding of the RS generation as well as the modification and even the utilization of the RS distributions in modern forming processes should be aimed for. For example, some process chains are supplemented by a further mechanical surface treatment, such as shot peening or deep rolling, in order to introduce compressive RS, which can increase the service life of the product [4]. These types of time-consuming and cost-intensive additional post-processing treatments can be avoided by advantageous RS already generated in the primary forming process by targeted parameter selection. The development of such processes solely based on trial and error tests is almost impossible considering the complex interrelationships between the process parameters and the resulting RS. Indeed, it is indispensable to identify and understand the phenomena responsible for the formation of RS in the components. An appropriate method for the investigation of the development of RS in the hot forming process chain and its interaction with the process parameters is provided by FE simulation, if it is possible to map the process as realistically as possible.
Especially in hot forming, the calculation of stresses is subject to a variety of process parameters and material phenomena. Thus, not only the forming process itself but above all the subsequent cooling of the components from the forging heat has a decisive influence on the arising RS [5]. During this cooling process, the cooling conditions and the forming parameters influence the resulting RS, because the preceding local degree of deformation determines the phase-transformation kinetics in a specific cooling scenario. In total, the RS in a hot-formed component arise as a result of five locally inhomogeneous and superimposing effects. The elastic and plastic strains introduced during hot forming, the thermal contraction during cooling, and the transformation-related and transformation-plastic strains are a result of phase transformations. In view of these complex interactions, the FE method combined with an additive strain decomposition method has been well established in the scientific community regarding the thermo-mechanical process simulation, as shown in [5,6,7]. Here, the strain increments resulting from the five physical phenomena mentioned above are first considered separately and then added together to a total strain increment resulting from the thermo-mechanical treatment. Using FE simulation, the stress state in all phases of the manufacturing process, both on the workpiece surface and inside the workpiece, can be assessed. This is intended to provide a better understanding of the origin of RS and thus facilitate process optimization for the generation of advantageous RS profiles.
In previous works, a comprehensive material characterization for the alloys AISI 52100 and AISI 4140 was carried out regarding the flow stress calculation resulting from hot forming [8], the phase transformation behavior during cooling [9], and the transformation plasticity effects arising from a superimposed load during phase transformations [10]. With these data in hand, FE models for the simulation of the hot-forming processes of the different materials AISI 52100 and AISI 4140, followed by cooling in water or air, were developed. The additive strain decomposition method in the MSC.Marc solver [11] was used for the simulation. The FE models were validated by means of experimental data from X-ray diffraction measurements on the specimen surfaces [8].
In the validation tests, specimens with an eccentric borehole inspired by [12] were used. As a result of the asymmetric geometry, multiaxial residual stress states develop in the hot-formed specimens. Thus, the complex development of the RS can be investigated, as it also occurs in industrial components. As revealed by numerical simulations, for different materials and cooling scenarios, significant differences in the RS distributions predominantly occur in the volume of the specimens, which are not accessible by means of conventional X-ray diffraction methods. There are numerous other well-established methods for the analysis of RS [13], including the incremental hole-drilling method, the crack compliance method, layer removal techniques, neutron diffraction, and more recent methods such as nanoindentation methods [14] and the contour method [15]. However, of all the existing methods, only a few non-destructive diffraction techniques—such as neutron diffraction and synchrotron X-ray diffraction—allow the two-dimensional (2D) mapping of RS gradients through thickness, as they feature large penetration depths. Because these methods are only available in large-scale facilities, they are accessible to a very limited extent. In contrast, the contour method offers the possibility to determine 2D RS maps with significantly less effort. The method is based on cutting a specimen, generally by wire-electrical-discharge machining (WEDM), in order to relax the RS at the newly-created surfaces. After cutting, the out-of-plane displacement distributions on the cutting planes are measured using tactile or non-tactile techniques. By means of numerical calculations—e.g., finite element methods—the RS distribution, normal to the cutting plane, is determined in an equilibrium step, considering the experimentally-measured displacements as boundary conditions [16]. Thus, the contour method is an experimental-numerical method whereby the residual stress distributions of experimentally-produced specimens from a real process are determined. For this reason, in contrast to the results of numerical process simulation, the results of the contour method are referred to as experimental results in the following.
In this work, employing the developed FE-models for the process simulation of hot bulk forming, the temporal course of tangential stresses at the surface and in the core of two opposite sides of the specimen is investigated, in order to understand the development of RS in such asymmetric specimens. Different stages of cooling are identified, which correspond to the predominant material phenomena. In addition, the von Mises stress is used as a measure of the multi-axial stress state in order to evaluate the local plastic deformations which cause the RS. Furthermore, the contour method is applied, and the 2D distribution of the tangential RS is determined for all of the investigated materials and cooling scenarios in order to validate the numerically-predicted RS state.
First, the experimental reference process of hot forming is presented in Section 2.1. A summary of the simulation methodology used follows in Section 2.2. The contour method is explained in Section 2.3. Section 3.1 describes the analysis of the stress distribution during cooling from the forming heat. The distribution of RS over the cross-section of the specimens from the simulations is evaluated by the experimental results from the contour method in Section 3.2. Finally, Section 4 summarizes the work briefly, and the conclusions are drawn.
2. Materials and Methods
For the investigations in this work, two different typical hot-forming steel alloys were used. The first one was alloy AISI 52100, also referred to as 1.3505 according to the international standard ISO 683-17 [17], which is used for the production of roller bearing rings. The second was alloy AISI 4140, also referred to as 1.7225 according to the international standard ISO 683-1 [18], which is used as heat-treatable steel for highly-loaded components, for example in the automotive sector. The chemical compositions provided by the supplier are listed in Table 1.

Table 1.
Chemical composition of steel alloys AISI 52100 and AISI 4140.
In order to investigate the RS, the materials are treated thermo-mechanically in two different ways. For this purpose, the specimens are cooled with water or atmospheric air after hot forming. The different cooling methods result in different cooling rates, and correspondingly in different phase-transformation phenomena causing varying stress states. The stress states were analysed by FE simulation and contour method. A description of the experimental test procedure as well as the numerical and experimental analysis methods is given in this section.
2.1. Experimental Hot-Forming Process
As mentioned before, the RS investigations in this work were carried out on a reference process of hot forming. For this process, specimens with an eccentric borehole were used, as shown in Figure 1a, aiming at causing an inhomogeneous stress profile in the material during production. The specimens were heated in the furnace to 1000 °C and then quasi isothermally upset in a thermobox, as shown in Figure 1b, by 22 mm at a speed of 200 mm/s using a servo-hydraulic forming simulator DYNSJ5590 (Instron GmbH, Darmstadt, Germany). Subsequently, the specimens were removed from the thermobox and cooled down to room temperature either in water or in atmospheric air. The different cooling media were intended to cause varying cooling routes, and correspondingly diverse location-dependent phase transformations in the materials. During the entire process, the temperature is monitored using type K (NiCr-Ni) thermocouples. More detailed information about the reference process is given in the previous publication [19].

Figure 1.
Shape of the specimens investigated with dimensions in mm (a), and a schematic representation of the specimen prepared with thermocouples (TC) in a thermobox (b) [19].
2.2. FE Simulation of the Hot-Forming Process
For the numerical analysis of the RS, the FE model—including its boundary conditions, which are shown schematically in Figure 2—was created with Simufact.forming v16 (simufact engineering GmbH, Hamburg, Germany) [20]. Analogous to the experiments, the tools were designed as thermally-conductive rigid bodies made of the material Inconel 718, with a specific heat capacity of 435 Jkg−1K−1 and a thermal conductivity of 11.4 Wm−1K−1 according to the material supplier’s specifications [21]. Taking advantage of axis symmetry, the number of finite elements was reduced by using a half model, while still considering both tools.

Figure 2.
Design of the investigated FE simulation model, with boundary conditions [10].
It was assumed that the workpiece had a completely austenitized microstructure prior to forming. The heat transfer coefficients (HTC) were determined using an experimental numerical method, as detailed in [19]. The experimentally-determined time–temperature curves were compared with the numerically-calculated time–temperature curves, and the HTC was adjusted iteratively until an agreement between the simulation results and experimental results was achieved. Based on the determined HTC shown in Figure 3, it can be seen that very different cooling scenarios result from the various cooling media. In order to validate the HTC values, a comparison of the calculated temperature curves with the experimentally determined temperature curves is presented in Section 3.1.

Figure 3.
Numerically-identified heat transfer coefficients between the steel alloys (AISI 52100 or AISI 4140) and the media water (a) or air (b).
In order to realise thermal-metallurgical-mechanically coupled simulations, MSC.marc v2018.0 solver (MSC.Software GmbH, München, Germany) was used, employing the additive strain decomposition method. According to Equation (1), using this method, the total strain increment is calculated from the sum of the elastic- (el), plastic- (pl), thermal- (th), and transformation-induced (tr) and transformation-plasticity (tp) effects.
A comprehensive material characterization was already carried out and published, in order to account for each of these material phenomena. For the modelling of the viscoplastic flow behaviour during hot forming, the so-called ‘GMT model’, according to Equation (2), was used. The model was calibrated by flow curves from upsetting tests on the physical forming simulator Gleeble 3800-GTC (Dynamic Systems Inc., Poestenkill, NY, USA), as shown in [8]. This enables the calculation of the yield stress kf as a function of the plastic strain εeq, strain rate eq, and temperature Tf. The model-parameters c1, c2, n1, n2, l1, l2, m1 and m2 determined for the considered alloys are shown in Table 2.

Table 2.
Calibrated GMT model parameters for AISI 52100 and AISI 4140.
In the publication [9], the time-temperature-transformation (ttt) behaviour was determined based on dilatometric investigations for the calculation of the transformation-related strains. Using an experimental–numerical approach, the transformation plasticity coefficients were investigated in [10], aiming at a material- and phase-specific calculation of the transformation-plastic strains. Further material parameters—such as the coefficients of thermal expansion, specific heat capacity, or latent heat—were calculated for each phase with the thermo-dynamic calculation software JMatPro v11.2 (Matplus GmbH, Wuppertal, Germany) based on the chemical composition of the materials [22].
2.3. Residual Stress Analysis by Means of the Contour Method
In order to validate the numerical approach, the distribution of the tangential RS was analysed for all of the specimens, applying the contour method. Therefore, the specimens were cut via wire-electric-discharge machining (WEDM) along the specimens’ symmetry planes, named the cut plane, as shown in Figure 4a. Thus, the RS present on the cut surface before WEDM, as indicated in Figure 4b, can be analysed. WEDM is used because it is a non-contact technique which does not introduce additional mechanical stresses [23]. An EDM machine type BA24 (Mitsubishi Electric Europe B.V., Ratingen, Germany) and a brass wire of diameter 0.25 mm were used. As depicted in Figure 5a, the cutting direction was set along the axial borehole in order to avoid a second contact of the wire with the free specimen surface. The specimens were clamped to the backing plate on both sides of the cutting plane.
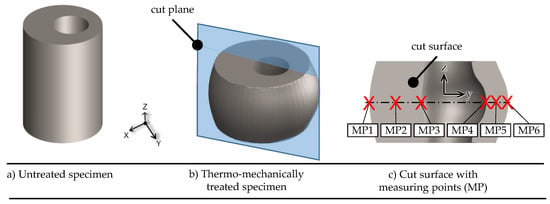
Figure 4.
Illustration of the untreated (a) and the thermo-mechanically treated specimens (b), and the cut surface including measuring points MP1 to MP6 at the mid-height of the cut specimen (c).

Figure 5.
Application of the contour method for the analysis of the tangential RS component: (a) specimen clamping for WEDM and (b) FE model for RS evaluation.
The contours of all of the cut surfaces were measured by means of a 3D-coordinate measurement machine (CMM) of the type Prismo (Zeiss GmbH, Oberkochen, Germany) using a ruby touch probe head of 1.5 mm diameter. Each surface was scanned at approximately 100,000 measurement points. The raw contour data sets were then processed following the proposed procedure from [24].
The final numerical calculation of the RS distribution was performed using the FE software ABAQUS/Standard v6.23 (Dassault Systèmes SE, Vélizy-Villacoublay, France). For each of the symmetrically-cut specimens, a 3D model based on the measured perimeter of the cut parts was created by applying hexahedral elements of the type C3D8R (see Figure 5b). The linear elastic isotropic material properties were considered with Young’s modulus E = 210 GPa and Poisson’s ratio ν = 0.3 [25]. For each of the specimens, the specifically measured and fitted surface contour was applied as a negative constraint for all of the element nodes which were part of the cut surface, and the planar RS distribution in the normal direction (corresponding to the tangential RS component regarding the specimen geometry) was evaluated after a static calculation step.
2.4. Light Microscopy and Hardness Measurements According to Vickers
After cutting and measuring the contour of the specimens, analyses of the microstructural properties on the cut surface were carried out for all of the specimens. These included light optical microscopic imaging as well as Vickers hardness tests according to the international standard DIN EN ISO 6507-1 [26] at the measuring points (MP) 1 to 6 (see Figure 4c). In order to reveal the microstructure in the micrographs, the specimens were etched using a 4wt% nitric acid alcohol solution. Subsequently, the surface was ground and polished in order to carry out the Vickers hardness tests. The micrographs and the hardness values serve as supporting results for the interpretation of the results of the simulation in Section 3.1.
3. Results and Discussion
3.1. Temporal Development of Temperature and Tangential Stresses during Hot Forming
Numerical process analysis based on the FE model from Section 2.2 provides an insight into the stress development during the process chain of hot forming. During the forming process itself, the low yield strength of the austenitic phase at a temperature of 1000 °C leads to consistently low stresses in the component. In this part of the process chain, dynamic recrystallization takes place depending on the forming parameters, such as the local equivalent plastic strain, local equivalent plastic strain rate, or local forming temperature. The resulting microstructure morphology influences the phase transformation phenomena in the course of the austenite decomposition during cooling from the forming heat. In the FE models, these influences are taken into account by the application-specific material characterisation using the relevant deformation-ttt diagrams and the corresponding transformation plasticity coefficients.
In Figure 6, the temperature–time development at the measuring point TC, specified in Figure 1a, for the two materials during cooling in water and air is shown. The water medium causes rapid cooling, such that the materials at MP1 are already cooled to room temperature after a few seconds. In the air medium, cooling takes place more slowly, and lasts several thousand seconds. The HTC presented in Section 2.2 prove to be appropriate for the simulation of the cooling processes, as shown by the comparison of the temperature curves from the simulations and experiments.
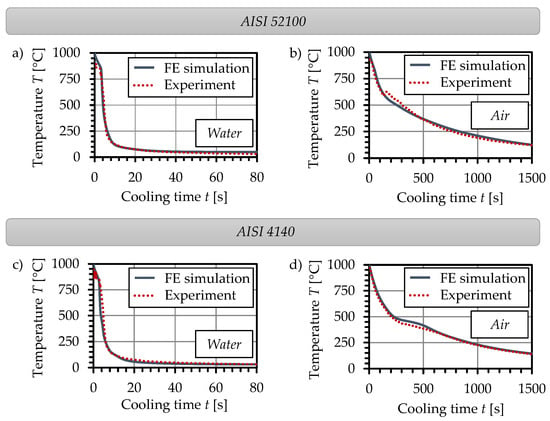
Figure 6.
Comparison of the temperature curves at the measuring point TC from the experiments and simulations for the cooling of AISI 52100 in water (a) and air (b), and for AISI 4140 in water (c) and air (d).
In order to understand the resulting RS distributions in the specimens, the temporal courses of the stresses at the surface and the core on the thick-walled side and thin-walled side of the specimens are compared below. Besides the temperature profile T, Figure 7a shows the development of the tangential stresses σt at MP1 on the surface, and at MP2 in the core on the thick-walled side of the specimen from AISI 52100 cooled in water. Cooling can be divided into four stages referring to the occurring material phenomena caused by the temperature distribution.
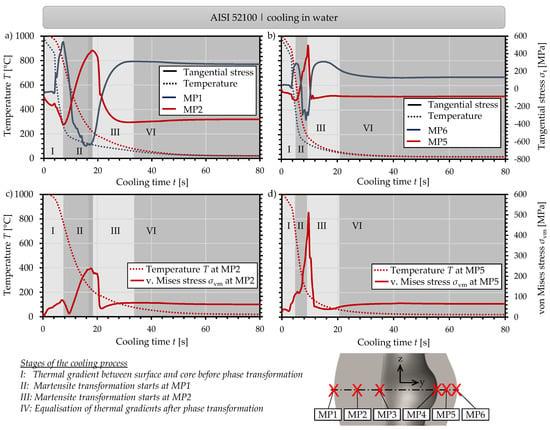
Figure 7.
Temporal development of the temperature and angential stresses on the thick-walled side at MP1 and MP2 (a), and on the thin-walled side at MP5 and MP6 (b) during the cooling of the material AISI 52100 in water, supported by the temporal development of the von Mises stress at MP2 (c) and MP5 (d).
In stage I, the temperature at MP1 at the surface of the specimen cools down rapidly, while at MP2 the material core’s cooling is delayed. The local thermal contraction of the surface counteracts the expanded specimen core, which explains the tensile stresses at MP1. Conversely, at the process time of about 5 to 7 s, compressive stresses are present at MP2, as a balance of forces must be obtained. Subsequently, in stage II, the martensite start temperature is reached at the specimen surface, and the martensite phase transformation takes place, triggered by the high cooling rate. The martensitic phase transformation results in a volume expansion counteracting the thermal contraction. This results in a sign reversal leading to the formation of compressive stresses at MP1, and tensile stresses at MP2. As soon as the martensitic transformation starts in the specimen core at MP2 after about 19.6 s, stage III begins, and the associated increase in volume again leads to a reversal of the stress sign. Following this, only slight changes in the stress state occur as a result of further temperature equalisation between the specimen surface and specimen core in stage IV. Finally, tensile RS are present at MP1, while compressive RS exist at MP2.
The tangential stresses allow for an orientation-dependent analysis of the material phenomena. In order to evaluate the effects on the multiaxial stress state at MP2 in the asymmetric specimen, the temporal course of the von Mises stresses σvm is shown in Figure 7c. In stage I, there is an increase in the von Mises stress, confirming that there is strain on MP2 due to the thermal gradient between the surface and the core. With the beginning of the martensite transformation at MP1, a reduction of the von Mises stress can be observed in stage II. As was already noted for the tangential stress component, the volumetric strain resulting from the martensite transformation compensates for the thermally induced contraction. As the cooling proceeds, the martensitic volumetric expansion at the surface causes the material core to expand. In this stage, the temperature at MP2 is significantly higher than at MP1, and consequently the yield strength of the material is lower. This leads to plastic deformation, and consequently to an expansion of the material core. The volume expansion as a result of the martensite transformation at MP2 in stage III compensates for the stress gradient that occurred first. Until the completion of the martensite transformation, however, the volume expansion at MP2 again causes a slight increase in the von Mises stress, and therefore causes plastic strains. In stage IV, minor changes in the multiaxial stress state occur as a result of thermal equalisation. However, as a result of the plastic strains which occurred in stages II and III, a significant RS depth gradient develops, with tensile RS at MP1 and compressive RS at MP2.
Based on the tangential stresses (see Figure 7b) and the von Mises stresses (see Figure 7d), the same cooling stages as on the thick-walled side can be observed on the thin-walled side. Owing to the lower material volume on this side, faster cooling occurs, with smaller temperature differences between the surface at MP6 and in the core at MP5. This leads to a temporal shortening of the cooling stages. It is noticeable that the amounts of tangential stresses for the surface and the core are lower on the thin-walled side than on the thick-walled side. This can be explained by the lower temperature gradient on the thin-walled side throughout the cooling process. A comparison of the von Mises stress curves for MP2 and MP5 provides an explanation for this. Based on the course of MP2, the effects in the individual stages—such as the stress increase due to thermal gradients, due to the start of martensite transformation at MP1, and due to the martensite transformation at MP2—can be clearly identified. On the thin-walled side, these effects are only slightly delayed at MP5 and MP6. In particular, stages II and III succeed each other quickly, which means that the martensite transformation takes place almost simultaneously throughout the cross section. Unlike on the thick-walled side, this counteracts the plastic deformation of the core in stage II, because the yield strength at MP5 has already increased too much due to cooling and martensitic transformation. This persists even though higher von Mises stresses are calculated at MP5 than at MP2.
The metallographic examinations confirm that a diffusionless martensitic phase transformation develops during cooling in water. Figure 8 shows the hardness values at MP1 to MP6 on the cut surface I, measuring around 800 HV at all of the points over the cross-section, indicating a completely martensitic material. This is also confirmed by the light microscopic examinations in Figure 8, which reveal the typical needle-shaped martensitic microstructure.
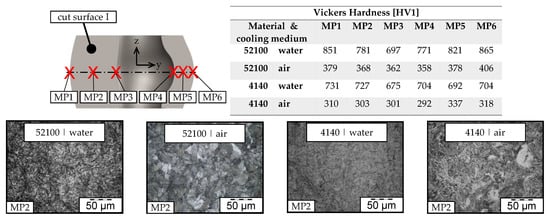
Figure 8.
Vickers hardness and micrographs of the resulting microstructures of the differently-treated specimens made of AISI 52100 and AISI 4140.
In contrast to the cooling of the specimens in water, the cooling in air features a significantly smaller cooling rate, almost uniformly distributed throughout the entire cross section of the specimen. Figure 9a,b illustrates that, at the beginning of cooling, a slight increase in the von Mises stress arises. At this point, the temperature-dependent HTC and the high temperature difference between specimen and the ambient air lead to a slightly faster cooling of the specimen surface than of the specimen core. As the temperature of the specimen decreases, less heat is transferred from the specimen to the ambient air, such that the thermal gradients are immediately compensated by the thermal conductivity of the material.
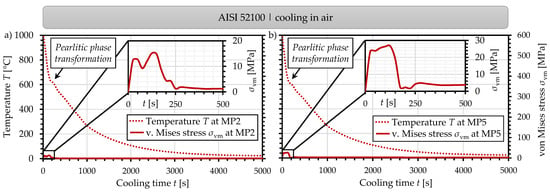
Figure 9.
Temporal development of the temperature and von Mises stress at MP2 (a) and MP5 (b) during the cooling of AISI 52100 in air.
Furthermore, the inflexion point in the temperature curves of MP2 and MP5 after about 125 s of cooling indicate that pearlitic phase transformation occurs. The different thermal properties—such as specific heat capacity, thermal conductivity and the latent heat—from the pearlitic structure compared to the austenitic structure cause a change in the cooling behaviour, resulting in the mentioned inflexion point of the temperature curve. Because pearlitic phase transformation takes place almost simultaneously everywhere in the specimen, transformation-related strains only have a marginal influence on the stress curve.
According to the hardness values of about 370 HV, as well as the lamellar microstructure from the micrograph in Figure 8, diffusion-controlled phase transformation into pearlite, which was determined in the simulation, can be confirmed.
The same cooling stages as for the AISI 52100 specimens were also identified for the AISI 4140 specimens. However, higher amounts of tangential stresses and von Mises stresses were calculated for the measuring points in AISI 4140, as shown in Figure 10. In stage I, for example, von Mises stresses of up to 220 MPa occur at MP1, while only 80 MPa are reached at the maximum for AISI 52100. In stage III, stresses of up to 1900 MPa are reached at MP5 for AISI 4140. These increased stresses are due to the higher martensite start temperature (Ms) of AISI 4140 (Ms = 394 °C) in contrast to AISI 52100 (Ms = 184 °C). The martensite transformation in stage II already starts at higher temperatures than for AISI 52100. At MP1, the increased martensite content leads to a rapid increase in the yield strength, in contrast to MP2. At MP2, a significantly lower yield strength is present due to the higher temperature in the austenitic phase. Therefore, higher plastic strains occur at MP2 for AISI 4140 than for AISI 52100. This is also noticeable in the higher amount of maximum tangential stresses at MP1 in stage I of 850 MPa compared to 400 MPa at MP2. High stresses occur in the already-hardened martensitic phase at MP1, while the stresses are balanced by plastic deformation at MP2. The von Mises stress in stage III is correspondingly high as a result of the volumetric strains during martensitic transformation in the specimen core against the resistance of the already-hardened specimen surface.
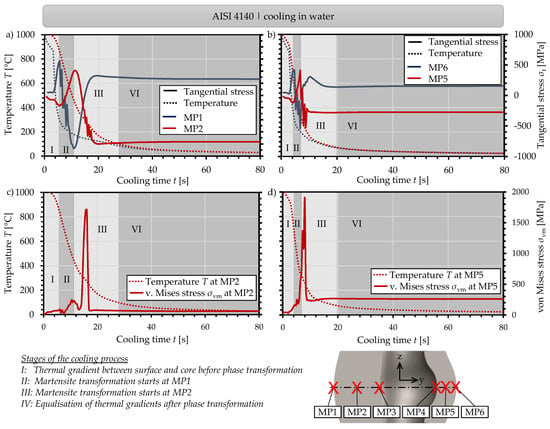
Figure 10.
Temporal development of the temperature and tangential stresses on the thick-walled side at MP1 and MP2 (a), and on the thin-walled side at MP5 and MP6 (b) during the cooling of AISI 4140 in water, supported by the temporal development of the von Mises stress at MP2 (c) and MP5 (d).
Because AISI 4140 has experienced a stronger inhomogeneous plastic deformation of the specimen over the cross-section during cooling, a higher stress gradient between the near-surface areas and the core areas of the specimens results than with AISI 52100. This can be derived from the stress difference between MP1 and MP2, or MP5 and MP6, respectively, of the different materials.
As can be seen from the hardness values from Figure 8 of around 700 HV, as well as the needle-shaped microstructure, martensite is formed in the experimentally-manufactured specimens. Thus, as with AISI 52100, a diffusionless phase transformation has also taken place here during water cooling.
When cooled, the AISI 4140 specimens also experienced low von Mises stresses of up to 40 MPa, as Figure 11 shows. Therefore, low RS are expected on these specimens. The Vickers hardness values of about 300 HV and the micrograph confirm the bainitic phase transformation predicted by the simulation.
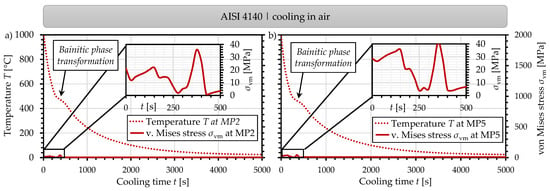
Figure 11.
Temporal development of the temperature and von Mises stress at MP2 (a) and MP5 (b) during the cooling of AISI 4140 in air.
After explaining the material phenomena occurring in the various stages of cooling, and thus influencing the RS profile in this section, an evaluation of the simulation results is carried out in Section 3.2 using the RS distributions in the specimen cross-section determined experimentally by means of the contour method.
3.2. Spatial Distribution of the Residual Stresses Resulting from the Hot-Forming Process Assessed by FE-Simulation and Contour Method
Figure 12 shows the results of the spatial distribution of tangential RS on the cut surface of the AISI 52100 specimens after cooling in water and cooling in air, for both numerical simulation (left) and experimental analysis using the contour method (right). For the water-cooled specimen, the FE simulation calculated a ring-shaped graded distribution of tangential RS for the thick-walled side. Tensile stresses of approximately 300 MPa were present on the surface of the specimen. Only in the area of the borehole were lower tensile RS of about 100 MPa obtained. The ring-shaped tensile RS were balanced by compressive RS of up to −300 MPa in the core of the material. The stress distribution on the thin-walled side also had a ring-shaped character, with the tensile RS on the surface and the compressive RS in the core of the material. However, the differences in RS on the surface and in the specimen core are smaller than on the thick-walled side. Here, about 150 MPa occurred at the specimen surface, while only up to −150 MPa were present in the core.
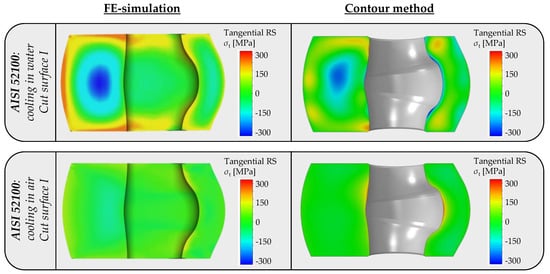
Figure 12.
Comparison of the spatial distribution of tangential RS on the cut surface of AISI 52100 after cooling in water or air from the FE-simulation and the contour method.
The contour method applied to the correspondingly manufactured specimen confirmed the ring-shaped graded distribution of the tangential RS for the thick-walled side. The shapes of the surrounding tensile RS distribution and the centred compressive RS distribution are qualitatively in very good accordance with numerical results. However, slightly lower tensile RS of about 200 MPa were present on the outer ring near the specimen surface, and compressive RS up to −250 MPa were present in the core of the specimen. Using the contour method, a slightly different RS distribution was obtained on the thin-walled side compared to FE simulation results. Although the two local tensile RS maxima of approximately 200 MPa close to top and bottom of the thin-walled side correspond to the numerically-predicted tensile RS maxima, the predicted compressive RS up to about −150 MPa in the center was not confirmed. Instead, the compressive RS were determined for the near-surface area on the inside and outside of the thin-walled side by means of the contour method.
For the specimens cooled in air, an almost gradient-free RS distribution was determined, both with FE simulation and using the contour method. The RS in the entire specimen cross section were in the range of approximately ±50 MPa. This result of the expected and plausible occurrence of low RS for cooling in air is interesting as a reference compared to the specimens cooled in water with high RS.
A ring-shaped graded distribution of tangential RS on the thick-walled side was also calculated for the water-cooled steel AISI 4140, as shown in Figure 13. Here, the compressive RS distribution, located in the center of the thick-walled side, showed a maximum in compressive RS up to about −800 MPa. As was already observed for AISI 52100, the compressive RS decreased with the increasing distance to the center and formed a ring-shaped tensile RS distribution close to the surface, with RS maxima of approximately 800 MPa. In contrast to the AISI 52100 specimen, the tensile RS ring was located at a smaller radius surrounding the center of the thick-walled side, and compressive RS distributions of about −400 MPa were present at the top and bottom corner of the shown cross section. As was already observed for AISI 52100, the simulation also showed a ring-shaped graded RS distribution for the thin-walled side, but here the amount of RS was lower than on the thick-walled side. The tensile RS in the ring below the surface were in a range of about 100 to 300 MPa, and the RS in the specimen core were at a minimum of about −300 MPa.
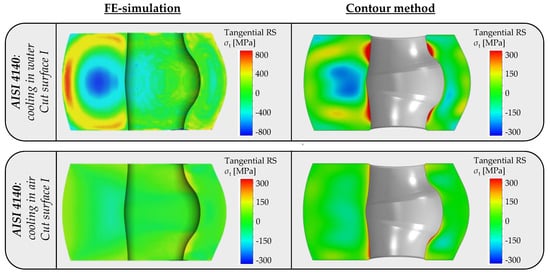
Figure 13.
Comparison of the spatial distribution of the tangential RS on the cut surface of AISI 4140 after cooling in water or air from the FE-simulation and the contour method.
Using the contour method, a ring-shaped graded distribution of tangential RS was also observed on the thick-walled side of this specimen. The tensile RS maxima with RS up to about 300 MPa were located near the borehole. In the core of the material, compressive RS of up to approx. −300 MPa were determined. Two tensile RS maxima up to about 300 MPa were observed on the thin-walled side opposite the maxima on the thick-walled side at the borehole. Furthermore, compressive RS were present in the core of the material, while slight tensile RS prevailed at the surface of the specimen.
As with AISI 52100, only small RS gradients occurred at the AISI 4140 specimen in both the experimental and numerical results as a consequence of cooling in air. The RS were below ±50 MPa in the entire cross section.
Overall, the contour method for cooling in water shows higher tangential and axial RS in the AISI 4140 specimen than in the AISI 52100 specimen. However, the simulation overestimates the experimentally-determined RS.
The differences in the magnitude of the determined RS regarding process simulation and experimental RS analysis may be caused by inaccuracies in the numerical approach as well as the experimental application.
The numerical simulation is based on continuum mechanics, and the experimentally-determined and interpolated thermo-physical and thermo-mechanical-metallurgical input parameters applied might be fraught with uncertainties. Besides this, the simulation considers an ideal process, whereas temporal and local deviations from the ideal conditions can occur in the experiments. Furthermore, micro-mechanical interrelationships between the phases resulting in micro RS are not considered. Improved process prediction can be expected with the help of thermal-mechanical-metallurgically coupled FE simulations, as presented in [27]. However, this is associated with a significantly higher computational effort.
Regarding the application of the contour method, a well-known challenge is the processing of experimentally-measured surface contours. Cutting and measurement artefacts have to be identified and removed prior to the following evaluation steps. Cutting artefacts from WEDM processes are known to arise primarily from wire entry and exit artefacts, i.e., they are predominately located on the specimen’s surface [23]. In our work, measurement artefacts of up to 2 mm had to be removed from the outer near-surface areas. According to the FE simulations, the maxima in tensile RS are located at the near-surface area of the thick-walled side of the specimens. Because the RS distribution is calculated in an equilibrium step, the missing displacements at the near-surface areas lead to a reduction in both the tensile RS and the compressive RS maxima. For simpler specimen geometries, this effect can be avoided using sacrificial material applying the contour method [23]. Here, a piece of material consisting of comparable material properties and precisely fitting the specimen surface is glued to the perimeter for the cutting process, in order to shift the wire entry/exit artefacts away from the specimen. However, this approach could not be applied here due to the complexity of the specimen geometry.
Although, for the investigated specimens, which were small in dimension and of complex shape, certain inaccuracies—especially regarding the near-surface RS distribution—have to be taken into account; the contour method provides a valuable contribution to the validation of our simulation approach. The results show a very good agreement of the qualitative RS distribution for the thick-walled specimen side. The principle RS distribution for the complete cross section could now be validated for the first time, and the numerical findings are further confirmed.
4. Conclusions
In this paper, a reference process of hot forming was presented, in which specimens with eccentric boreholes of the alloys AISI 52100 and AISI 4140 were upset at 1000 °C, and subsequently cooled with the media water or air. The process was simulated by means of an FE model, which was already validated in a previous work merely on individual surface points by means of X-ray diffraction [8]. The development of the RS in the course of cooling was analysed based on the simulation results. The different stages of cooling were identified, corresponding to the predominant material phenomena. In addition, the von Mises stress was used as a measure of the multi-axial stress state to evaluate the local plastic deformation which causes the RS. Subsequently, the RS distributions inside of the bulk specimen predicted by the simulations were evaluated based on the experimental results from the contour method. The following conclusions can be drawn from the investigations.
- The FE model applied is a valid tool for mapping the process history of hot-bulk forming, i.e., the local temporal temperature and stress evolution.
- The contour method is well-suited to validate the numerical predictions. In this regard, the distributions predicted by the simulations for the tangential RS on the cut surface of the specimens cooled in water could be qualitatively confirmed by means of the contour method. In particular, the above-mentioned ring-shaped distribution with compressive RS in the core and tensile RS in near-surface areas found in the simulations were well-confirmed by the contour method.
- The simulations quantitatively predicted higher amounts of RS than were obtained with the contour method. This may be due to the fact that continuum-mechanics–based FE simulations are taken into account and micro-mechanical interrelationships are not considered in the model used. On the other hand, removing cutting artefacts from the specimens in order to apply the contour method may lead to a reduction in the overall stress level.
From the FE simulation of the hot-bulk forming of the steels AISI 4140 and AISI 52100, it can further be concluded that:
- The different cooling media (water and air) lead to different cooling rates of the specimens. This in turn causes different kinds of microstructural transformations, with rapid cooling in water leading to diffusionless martensitic transformation, and slow cooling in air leading to diffusion-controlled pearlitic phase transformation for AISI 52100, and to bainitic phase transformation for AISI 4140.
- The thermal and transformation-related strains occurring on the specimen surfaces and in the material core with a time delay were found to be the reasons for the high stress gradients during water cooling. A characteristic finding is the ring-shaped distribution of tangential RS on the thick-walled side of the cut surface of the specimens for both materials, with compressive RS in the core and tensile RS in the areas near the surface.
- In the material core, plastic deformation takes place during successive martensitic transformation in the near-surface regions of the specimen, followed by martensitic transformation in the core. After cooling, the material core is expanded contrary to the surface areas as a result. This is favoured by the lower yield strength of the material in the specimen core in contrast to the near-surface area as a consequence of the time-delayed cooling of surface and core. The effect is more pronounced for AISI 4140 than for AISI 52100 due to the higher martensite start temperature.
- Due to the comparatively more homogeneous temperature distribution during cooling in air, no inhomogeneous plastic strain distributions occurred in the specimens. The numerical and experimental results, in agreement, show very low RS of less than <50 MPa in the entire cross-section for the specimens of both materials.
In summary, the in-depth analysis of the arising material phenomena as well as the RS analysis in the volume of the specimen provided a valuable contribution to the understanding of the RS formation in hot-formed specimens.
After the basic suitability of the simulation model for the numerical prediction of hot-bulk forming of steels AISI 52100 and AISI 4140 has been ensured, the presented FE models are to be used for the optimization of the reference process regarding the generation of advantageous compressive RS in the surface-near areas of the specimen in the next step. The overall objective of the project is to adjust the RS in complex components with industrial relevance using the developed numerical methods in an application-specific and beneficial way.
Author Contributions
Conceptualization, B.-A.B., K.B. and J.G.; methodology, N.S., C.K. and H.W.; validation, N.S. and C.K.; formal analysis, N.S. and C.K.; investigation, N.S. and C.K.; resources, N.S. and C.K.; data curation, N.S. and C.K.; writing—original draft preparation, N.S. and C.K.; writing—review and editing, B.-A.B., K.B., H.W. and J.G.; visualization, N.S. and C.K.; supervision, B.-A.B., and J.G.; project administration, B.-A.B., K.B. and J.G.; funding acquisition, B.-A.B. and J.G. All authors have read and agreed to the published version of the manuscript.
Funding
Funded by the Deutsche Forschungsgemeinschaft (DFG, German Research Foundation)—374871564 (BE 1691/223-2) and 374768210 (GI 376/13-2) within the priority program SPP 2013.
Institutional Review Board Statement
Not applicable.
Informed Consent Statement
Not applicable.
Acknowledgments
Klaus Simon from the Institute of Production Science (wbk) at Karlsruhe Institute of Technology (KIT) is gratefully acknowledged for providing CMM measurements. We would also like to express our thanks to Mike Prime from Los Alamos National Laboratory (US), who introduced us to the application of the contour method.
Conflicts of Interest
The authors declare no conflict of interest
References
- Aurrekoetxea, M.; López de Lacalle, L.N.; Llanos, I. Machining Stresses and Initial Geometry on Bulk Residual Stresses Characterization by On-Machine Layer Removal. Materials 2020, 6, 1445. [Google Scholar] [CrossRef] [PubMed]
- Löhe, D.; Lang, K.-H.; Vöhringer, O. Residual Stresses and Fatigue Behavior. In Handbook of Residual Stresses and Deformation; Totten, G., Howes, M., Inoue, T., Eds.; ASM International: Novelty, OH, USA, 2002. [Google Scholar]
- Epp, J.; Surm, H.; Kovac, J.; Hirsch, T.; Hoffmann, F. Interdependence of Distortion and Residual Stress Relaxation of Cold-Rolled Bearing Rings During Heating. Metall. Mater. Trans. A 2011, 42, 1205–1214. [Google Scholar] [CrossRef]
- Löhe, D.; Hoffmann, J.E. Influence of Macro Residual Stresses on the Fatigue Behavior Smooth and Notched Specimens Made from a High Strength Steel. J. Mater. Manuf. 2002, 57, 704–710. [Google Scholar]
- Denis, S.; Gautier, E.; Simon, A.; Beck, G. Stress-phase-transformation interactions—Basic principles, modelling and calculation of internal stresses. Mater. Sci. Technol. 1985, 1, 805–814. [Google Scholar] [CrossRef]
- Simsir, C. 3D Finite Element Simulation of Steel Quenching in Order to Determine the Microstructure and Residual Stresses; Middle East Technical University: Ankara, Turkey, 2008. [Google Scholar]
- Behrens, B.; Schrödter, J. Numerical Simulation of Phase Transformation during the Hot Stamping Process. In Proceedings of the 5th International Conference on Thermal Process Modeling and Computer Simulation; ICTPMCS: Novelty, OH, USA, 2014; pp. 179–190. [Google Scholar]
- Behrens, B.-A.; Schröder, J.; Wester, H.; Brands, D.; Uebing, S.; Kock, C. Experimental and numerical investigations on the development and stability of residual stresses arising from hot forming processes. In Proceedings of the 13th International Conference on Technology of Plasticity (ICTP), Columbus, OH, USA, 25–30 July 2021. [Google Scholar]
- Behrens, B.-A.; Chugreev, A.; Kock, C. Experimental-numerical approach to efficient TTT-generation for simulation of phase transformations in thermomechanical forming processes. In IOP Conference Series, Materials Science and Engineering; IOP Publishing: Bristol, UK, 2018. [Google Scholar]
- Behrens, B.-A.; Chugreev, A.; Kock, C. Macroscopic FE-simulation of residual stresses in thermo-mechanically processed steels considering phase transformation effects. In XIV International Conference on Computational Plasticity. Fundamentals and Applications; CIMNE: Barcelona, Spain, 2019; pp. 211–222. [Google Scholar]
- MSC.Marc®. User’s Handbook, Volume A: Theory and User Information; Version 2013.1; MSC. Software GmbH: Munich, Germany, 2013. [Google Scholar]
- Simsir, C.; Gür, C.H. 3D FEM simulation of steel quenching and investigation of the effect of asymmetric geometry on residual stress distribution. J. Mater. Process. Technol. 2008, 207, 211–221. [Google Scholar] [CrossRef]
- Lu, J. Handbook of Measurement of Residual Stresses; Fairmont Press: Upper Saddle River, NJ, USA, 1996. [Google Scholar]
- Lee, Y.H.; Kwon, D. Measurement of residual-stress effect by nanoindentation on elastically strained (100) W. Scr. Mater. 2003, 49, 459–465. [Google Scholar] [CrossRef]
- Prime, M.; Gonzales, A. The Contour Method: Simple 2-D Mapping of Residual Stresses. In The 6th International Conference on Residual Stresses; Los Alamos National Lab.: Oxford, UK, 2000. [Google Scholar]
- Prime, M. Cross-sectional mapping of residual stresses by measuring the surface contour after a cut. J. Eng. Mater. Technol. 2001, 123, 162–168. [Google Scholar] [CrossRef]
- DIN EN ISO 683-17. Heat-Treated Steels, Alloy Steels and Free-Cutting Steels—Part 17: Ball and Roller Bearing Steels; Beuth: Berlin, Germany, 2014. [Google Scholar]
- DIN EN ISO 683-1. Heat-Treatable Steels, Alloy Steels and Free-Cutting Steels—Part 1: Non-Alloy Steels for Quenching and Tempering; Beuth: Berlin, Germany, 2018. [Google Scholar]
- Behrens, B.-A.; Schröder, J.; Brands, D.; Scheunemann, L.; Niekamp, R.; Chugreev, A.; Sarhil, M.; Uebing, S.; Kock, C. Experimental and numerical investigations on the development of residual stresses in thermo-mechanically processed Cr-alloyed steel 1.3505. Metals 2019, 9, 480. [Google Scholar] [CrossRef]
- Simufact Engineering Gmbh, Umformen Simulieren Mit Simufact Forming. 2021. Available online: https://www.simufact.de/simufactforming-umformsimulation.html (accessed on 19 February 2021).
- Special Metals Co, New Hartford, NY, USA. Available online: http://www.specialmetals.com/assets/smc/540documents/pcc-8064-sm-alloy-handbook-v04.pdf (accessed on 8 January 2020).
- JMatPro. Practical Software for Materials Properties; Sente Software Ldt.: Guildford, UK, 2020; Available online: https://www.sentesoftware.co.uk/jmatpro (accessed on 8 January 2020).
- Hosseinzadeh, F.; Ledgard, P.; Bouchard, P. Controlling the Cut in Contour Residual Stress Measurements of Electron Beam Welded Ti-6Al-4V Alloy Plates. Exp. Mech. 2013, 53, 829–839. [Google Scholar] [CrossRef]
- Prime, M.; DeWald, A. The Contour Method. In Practical Residual Stress Measurement Methods; Schajer, G.S., Ed.; Wiley-Blackwell: Hoboken, NJ, USA, 2013; pp. 109–138. [Google Scholar]
- Spittel, M.T.S. 4.2 Young’s modulus of steel. In Metal Forming Data of Ferrous Alloys-Deformation Behaviour; Springer: Berlin/Heidelberg, Germany, 2009; pp. 85–88. [Google Scholar]
- DIN EN ISO 6507-1. Metallic Materials—Vickers Hardness Test—Part 1: Test Method; Technical Report; Beuth: Berlin/Heidelberg, Germany, 2018. [Google Scholar]
- Uebing, S.; Scheunemann, L.; Brands, D.; Schröder, J. Numerical thermo-elasto-plastic analysis of residual stresses on different scales during cooling of hot forming parts. In XIV International Conference on Computational Plasticity. Fundamentals and Applications; CIMNE: Barcelona, Spain, 2019; pp. 223–234. [Google Scholar]
Publisher’s Note: MDPI stays neutral with regard to jurisdictional claims in published maps and institutional affiliations. |
© 2021 by the authors. Licensee MDPI, Basel, Switzerland. This article is an open access article distributed under the terms and conditions of the Creative Commons Attribution (CC BY) license (https://creativecommons.org/licenses/by/4.0/).