Article

A Study on the Effect of Current Waveform on Intermetallics Formation and the Weldability of Dissimilar Materials Welded Joints (AA5052 Alloy—GI Steel) in AC Pulse GMAW

1
Joining and Welding Research Institute, Osaka University, Osaka 567-0047, Japan
2
Department of Welding and Joining Science Engineering, Chosun University, Gwangju 61452, Korea
*
Author to whom correspondence should be addressed.
Metals 2021, 11(4), 561; https://doi.org/10.3390/met11040561
Submission received: 1 March 2021 / Revised: 23 March 2021 / Accepted: 26 March 2021 / Published: 30 March 2021

Abstract

:
In joining aluminum alloy to galvanized (GI) steel, the huge gap of thermophysical properties, defects by zinc from the steel surface, and formation of excessive brittle Fe-Al intermetallics (IMC) are the main factors that deteriorate the joint quality. In this study, alternating current pulse gas metal arc welding (AC pulse GMAW) was suggested as a solution with a mix of electrode positive and negative modes. A 1.2 mm thick AA5052 aluminum alloy and GI steel plates were joined using 1.2 mm diameter AA4047 filler wire. A comparative study on the joint interface was conducted varying the welding current and electrode-negative (EN) ratio to investigate the effect of different welding parameters on the growth of the Fe-Al intermetallics (IMC) layer, the effect of zinc, and the mechanical characteristics of the joints. It was confirmed that the change of polarity affects the distribution of zinc element in the joints. An increase in the EN ratio suppressed the growth of the IMC layer to 3.59 μm with decreased heat input. The maximum tensile-shear strength of the welded joints was approximately 171 MPa (78% joint efficiency) at the welding current of 50 A with 20% EN ratio.

1. Introduction

The application of lightweight materials to automobiles for improving fuel efficiency with the reduction of gas emission is an important issue in manufacturing industries. Especially, application of aluminum alloys to the body of the automobiles with joining to steel can be an efficient way to reduce the product weight because the alloy has one third of specific gravity compared to steel with high corrosion resistance. However, joining these two materials is still challenging through the conventional arc welding process due to the sensitive and complicated phenomenon of the arc with high heat input [1,2,3,4,5,6]. Furthermore, there are significant differences in solid solubility, lattice transformation, and thermophysical properties (e.g., melting temperature, thermal conductivity, coefficient of thermal expansion, and heat capacity) between aluminum and steel; thus, the conventional process can induce defects or deformation on the joints easily. Conspicuously, the formation of Fe-Al intermetallics (IMC) layer in the joint interface is unavoidable in fusion welding, but its brittle characteristics can severely deteriorate the joint strength [7]. To achieve a sound joint, therefore, it is necessary to control and optimize the IMC layer thickness to a value less than 10 µm [8].
Many studies have been conducted on joining aluminum to steel via lap or butt joint configurations using different joining processes, such as adhesive bonding, mechanical fastening [9], gas tungsten arc welding (TIG) [10,11,12,13], gas metal arc welding (GMAW) [14,15,16,17], laser beam welding [18,19,20], friction stir welding (FSW) [21], plasma-metal inert gas (MIG) hybrid process [22], and laser/arc-FSW hybrid process [23,24,25] to improve the joint strength with controlling the growth of IMC layer. Several researchers reported GMAW, which can be applied to intricate joint geometries with high welding speed and high heat efficiency [26], can provide improved joint quality, but the research works with this process showed a wide range of welding parameters or heat inputs to achieve sound joints and to restrict the growth of the IMC layer.
In GMAW process, which deposits a filler wire as an additional metal to base metal to secure joint strength, selecting the proper wire is important because the chemical or metallurgical interaction between the wire and the base metal affect to the joint strength significantly. Dong et al. [27] compared the effect of different filler wires on the growth of IMC layer. The authors reported that Si in the filler wire suppressed the growth of the Fe2Al5 IMC layer. Lemmens et al. [28] reported that the aggregation of Si atoms on the joint interface facilitated the change in the interfacial reaction mechanism along the IMC layer. In another approach to investigate the joining mechanism to improve the aluminum-alloy—steel joint quality, researchers employed different types of steel, such as aluminum (Al)-coated steel [29] and zinc (Zn)-coated steels which are galvannealed (GA) steel and galvanized (GI) steel. Compared to conventional steels, Zn-coated steels are widely adopted because they exhibit a high corrosion resistance due to the lower ionization series of Zn than that of Fe that delays the Fe oxidation on the base metal surface. Yagati et al. [26] observed the wettability of aluminum to steel with different coating such as GA, GI, and cold-rolled (CR) steel. Zhou et al. [30] analyzed the wettability of aluminum on GI steel approaching with the view of enthalpy. The authors explained that Fe-Al, which has the lowest enthalpy than Al-Fe, Fe-Zn, and Zn-Al, reacts primarily and forms the IMC, and the evaporated or molten Zn can be found in the Zn-rich zone. In joining of Zn-coated steel to aluminum, Zhang and Liu [17] reported adopting heat input of 63–99 J/mm can achieve the maximum joint strength in MIG welding-brazing process, corresponding to a maximum IMC layer thickness of 10 µm. Makwana et al. [31] adopted a double-electrode GMAW employing TIG to join 3 mm thick AA5052 aluminum alloy to aluminum-cladded steel and achieved approximately 2.5 µm-thick IMC layer. Goecke et al. [32] employed controlled pulse GMA with short-circuiting metal transfer to join Al5052 aluminum alloy with GI steel. The authors reported that the low heat input by the pulsed current decreased distortion in the dissimilar materials joints. Das et al. [33,34] also attempted to join Al5052 aluminum alloy to GI and GA steel. The authors reported that controlling the current pulse can decrease the heat input to the base metal resulting decreased Fe-Al IMC layer thickness. Zhang et al. [35] adopted a cold metal transfer (CMT) system to join 1 mm thick 6061 aluminum alloy and GI steel plates using an AA4043 (Al-5%Si) filler wire. They achieved an IMC layer thicknesses of 7–40 µm with a maximum joint strength of 96 MPa. Su et al. [36] suggested that the joint strength is significantly affected by the thickness of the Fe-Al IMC layer, whose growth is dependent on the melting pool temperature and time. Murakami et al. [16] achieved an IMC layer thickness of 0.9–2.5 µm with 1.5 mm-thick aluminum and 1.2 mm-thick GA steel plates. Nishimoto et al. [37] suggested that the presence of Zn in IMC such as Fe2Al5Zn0.4 indicates it does not always mean the Fe-Al IMC is brittle. However, joining aluminum alloys to steel using the GMAW process is still challenging because of the excessive growth of IMC, the complex joining mechanism of aluminum to steel, and the high heat input from the arc.
Alternating current (AC) pulse GMAW, which cyclically applies electrode positive (EP) and electrode negative (EN) modes, can be a reasonable option to overcome the problems described above. It offers the advantages of both EP and EN modes which are relatively low heat input to the base metal, improved bead geometry from the spray metal transfer, and cleaning effect which is preventing joint oxidation. So et al. [38] optimized the parameters required for joining DP780 high-strength steel and confirmed that the wire melting speed was increased as the time period of EN in a cycle of pulsed current wave form (EN ratio) increased. Kumar et al. [39] and Park et al. [40] investigated the effect of the current wave form on bead geometry in AC pulse GMAW for aluminum welding. The authors reported that the application of the polarity change can improve joint strength by controlling the penetration depth and porosity in the joints. In joining of aluminum to steel by AC pulse GMAW, Park et al. [41] employed a 6K21 aluminum alloy with an Al-5%Si wire and confirmed that the gap bridging to the aluminum and steel can be applicable. The authors also confirmed that FeAl3 and Fe2Al5 IMC are mainly formed at the joint interface, but their thickness is reduced compared to the conventional GMAW process. Although AC pulse GMAW can be considered as a suitable process for joining aluminum with steel, only few studies on this process have been carried out. Notably, there are very few studies on AC pulse GMAW to join aluminum alloys to GI steel which is coated with pure Zn layer, which has not only high corrosion resistance but also high paintability and higher weldability to aluminum than GA steel whose coating is Fe-Zn alloy layer.
The purpose of the present study is to investigate the effect of the current wave form as process parameters on the formation of IMC layer and on the mechanical characteristics of the dissimilar materials (aluminum alloy to steel) joints by AC pulse GMAW. A 1.2 mm thick AA5052 aluminum alloy was joined with 1.2 mm thick hot-dip galvanized (GI) steel plates in a lap configuration using 1.2 mm diameter AA4047 (Al-12%Si) filler wire; the welding current and EN ratio were varied. A comparative experimental study on the joints was carried out by evaluating the metallurgical characteristics through macroscopy (VH-Z500, KEYENCE, Japan), scanning electron microscope with energy dispersive X-ray spectroscopy (SEM-EDS; SU-70, HITACHI, Japan, and electron probe microanalyzer (EPMA; JXA-8530F, JEOL, Japan. Moreover, the mechanical characteristics of the joints were investigated through Vickers hardness test (HM-221, MITUTOYO, Japan) and tensile-shear strength test (AG-10TB, SHIMADZU, Japan) to secure the reliability of AC pulse GMAW process.

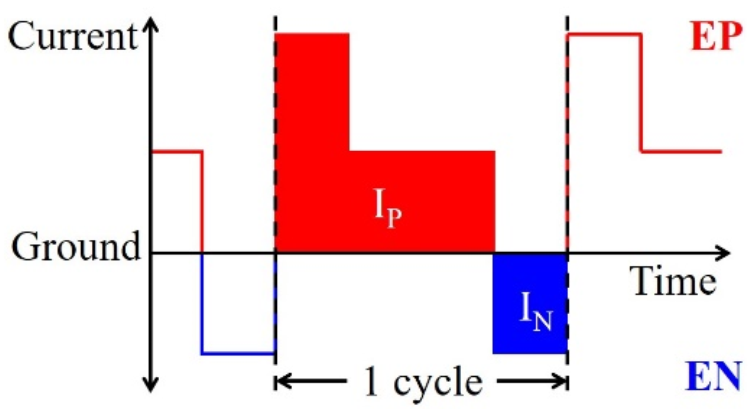
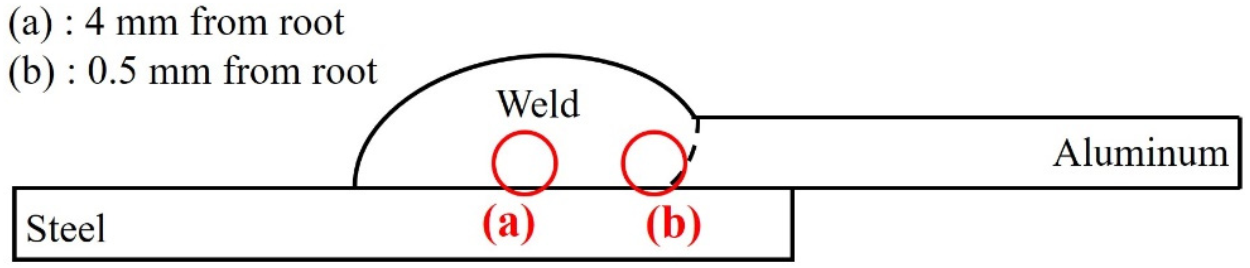
2. Materials and Methods

In this study, 100 (W) × 200 (L) × 1.2 (t) mm AA5052 aluminum alloy plate and 100 (W) × 200 (L) × 1.2 (t) mm hot-dip galvanized (GI) steel plate were used as the base metals. As shown in Figure 1, the steel plate was coated with 12 µm thick Zn layer with hot-dip galvanizing treatment. Furthermore, 1.2 mm diameter AA4047 (Al-12%Si) wire was employed as the filler wire to join the base metals in a lap configuration by DW-300 DAIHEN alternating current pulse gas metal arc welding (AC pulse GMAW) process. Table 1 and Table 2 show the chemical compositions and mechanical properties of the base metals and filler wire, respectively. The base metals were cleaned with acetone before welding. The aluminum alloy was set on the steel plate with 20 mm overlap. Rectangular shape jigs were clamped on the base metals with 15 mm away from the weld line, and 1.2 mm thick backing jig was set under the aluminum to prevent deformation during welding. The welding torch was tilted at travel and working angles of 15° to maintain stable arc from the fume, respectively. Pure argon gas (99.9%) was used as the shielding gas at a flow rate of 15 L/min to protect the weld from oxidation. The overall experimental setup is illustrated in Figure 2.
The current waveform in the AC pulse GMAW in this study was cyclically alternated in electrode positive (EP) and electrode negative (EN) modes as shown in Figure 3, and the time ratio of the EN sector in a given current waveform cycle was defined as the EN ratio (r, %) as follows:
r = I N × T N I N × T N + I P × T P × 100
where IN and TN are the average current and time period of the EN sector, respectively. Similarly, IP and TP represent the average current and time period of the EP sector, respectively. The time-averaged welding current Iav (A), voltage Vav (V) and heat input Q (J/mm) at a given welding speed (S) can be defined as follows:
I a v = i = 0 n I P i T P i + i = 0 n I N i T N i i = 0 n T P i + i = 0 n T N i
V a v = i = 0 n V P i T P i + i = 0 n V N i T N i i = 0 n T P i + i = 0 n T N i
Q = η P i = 0 n I P i T P i / i = 0 n T P i i = 0 n V P i T P i / i = 0 n T P i 1 r / 100 + η N i = 0 n I N i T N i / i = 0 n T N i i = 0 n V N i T N i / i = 0 n T N i r / 100 S
where ηP and ηN indicate the process efficiency of the DCEP and DCEN modes in GMAW, respectively. Together with the change of polarity in a current wave form cycle, the rate of heat energy to base metal and to filler wire that directly affect heat input of the joining process also follow the current waveform in AC pulse GMAW. Kiran et al. [42] suggested that the empirical model of available energy ratio to melt down the filler wire (αHS) and that to the base metal (βEN) as a function of welding current and voltage in aluminum welding by AC pulse GMAW. The calculated values of αHS and βEN are denoted in Table 3. Further, the heat input to the wire to be molten is known as follows:
Q d = π r 2 ρ C T α T 0 + L
where Qd indicates the required heat energy to melt down the filler wire, r is radius, ρ is density of the filler wire, respectively, C is specific heat, and L is latent heat. Tα and T0 refer droplet temperature and ambient temperature. Those values were adopted for 0.6 mm. In addition, 6900 kg m−3, 697 J kg−1 K−1, 247,000 J kg−1, 2673 K, and 300 K, respectively. In this study, the available energy ratio model and the required heat energy to melt down the filler wire which is described in Equation (5) were adopted to modify the heat input of AC pulse GMAW depending on the EN ratio that is described in Equation (1). The total heat, Q ˙ , on the workpiece was considered as below,
Q ˙ = 1 r α H S η V I +   r β E N η V I S Q d S
Process efficiency, η, was adopted as 0.64. [43] The welding parameters are shown in Table 3. The average welding current and EN ratio were varied in the range of 40–60 A and 0–20%, respectively. The contact tip-to-weld metal distance (CTWD), flow rate of pure Ar gas (99.99%) as shielding gas, and welding speed were fixed at 15 mm, 15 L/min, and 10 mm/s. Moreover, the welding torch was tilted 15 degrees each on working and travel angle to protect the arc from the fume during welding. At 0% EN ratio condition, the joining process was considered as DC pulse GMAW due to the nonexistence of EN sector. In this study, each experimental condition with welding current, and EN ratio was simply described; e.g., welding current 50 A with 20% EN ratio as 50 A 20%.
All joint samples for metallurgical evaluation were polished with SiC papers of 400 to 4000 grit and 9, 3, and 1 µm diamond suspensions. After polishing the samples, they were etched with a 5% nital reagent (ethanol 100 mL + nitric acid 5 mL) for 5 s and Tucker’s reagent (HCl 45 mL + HNO3 15 mL + HF 15 mL + distilled water 25 mL) for 10 s. EPMA and SEM-EDS analysis were conducted to characterize the joints and determine their composition. In addition, the phases present in the intermetallics formed at the joint interface were identified by X-ray diffraction (XRD) using monochromatic CuKa radiation. Micro Vickers hardness test value was measured along the transverse direction of the cross-section of the welded specimen with a gap of 0.5 mm, load of 500 g, and dwell time of 10 s. Based on ASTM E8 standard, tensile-shear test was carried out on five specimens for each process condition to investigate joint strength through universal testing machine at room temperature at a crosshead speed of 1 mm/min.

3. Results and Discussion

3.1. Bead Profiles

The top–bottom and cross-sectional bead profiles of joints obtained by the AC pulse GMAW process at welding currents of 40, 50, and 60 A with EN ratios of 0, 10, and 20% are compared in Figure 4 and Figure 5, respectively, and the corresponding dimensions are listed in Table 4. It was confirmed that the weld seams obtained in all conditions were fairly smooth, but the steel was not completely molten as the melting temperature of steel (1918 K) is much higher than that of aluminum (933 K). In other words, in this joining process, the aluminum was welded, while the steel was brazed. Furthermore, it was found that the bottom side of the steel plate was swollen because the Zn layer on its surface evaporated, owing to heat conduction during the joining process. When the EN ratio was fixed as 0% and the current was increased from 40 to 60 A, the wet length was increased from 6.92 to 10.45 mm as the increased heat input increased the amount of molten aluminum filler wire, which was later deposited on the steel surface. In contrast, as the EN ratio increased, the wet length was decreased under all current conditions while the bead height and wet angle were increased. At higher EN ratio, the increased time period of the electrode negative polarity in a current wave form allows the energy to be concentrated on the wire to be heated than on the base metal; hence, it increases the amount of wire melting and gives less heat input to the base metal simultaneously. Consequently, the molten aluminum is less spread on the steel plate in AC pulse condition than that in the DC pulse condition.
In Figure 5, at 40 A 20%, there was a lack of fusion and unfused root which were observed due to insufficient heat input. Compared to EN ratio 0% condition, 20% condition allows the cathode spot which has high current density providing intensive Joule heating to be formed on the filler wire for 20% of time period in a current wave form cycle. This indicates the rate of energy to the filler wire is increased in increased EN ratio; hence, the decreased heat is input in the base metal. Moreover, porosities were found in the joints, mainly concentrated in the root and toe area, and partially near from the top surface of the bead. This may be attributed to the Zn-coated layer on the GI steel surface, whose melting (693 K) and evaporation (1180 K) temperatures are lower than the aluminum and the steel, which was evaporated with high vapor pressure and could not escape because of the turbulent flow of melting pool during welding. For example, a blow hole was observed in the joint of 40 A 10% condition, and a blow hole and warm hole were observed additionally in that of 60 A 10%. This presence of blow hole and warm hole, which can be easily formed when the growth of porosity is faster than the solidification of the weld, confirms that the evaporated Zn with high vapor pressure was not be extracted to outside of the weld. Especially in 60 A with 0 and 10% condition, the porosities that are blow hole and warm hole, and cracks propagated from them were mainly observed near to the joint interface. The formation of the porosities may be attributed to the drastic evaporation of Zn as discussed above, and the propagation of crack from the porosity can be due to the large difference of the thermal expansion coefficients between the aluminum and the steel induced the thermophysical stress during cooling. About the distribution of porosity, more porosities were observed in the root area than in the toe area due to their structural difference. Compared to the toe area, the heat flow in the root area located next to the aluminum HAZ is mainly governed by the heat conduction which has a stronger effect than convection; hence, this part is solidified earlier than in the toe side. As a result, the evaporated Zn is trapped more easily in the root, where it is fully covered with the aluminum HAZ which would be solidified quickly than the toe. Compared to the DC pulse condition, the porosities are more concentrated in the middle of the weld along the vertical direction in the AC pulse conditions. This can be explained by the varied viscosity of the molten pool whose temperature is decreased, and the change of polarity during AC pulse process which results in the arc impacting the Zn bubbles to be disassembled with more turbulent flow of the melting pool. Additionally, the porosities near the top surface of the bead were decreased as the current was increased because of the slowed-down cooling speed of the molten aluminum to solid phase by the increased heat input that provided the sufficient time to the absorbed hydrogen in the melting pool to be extracted.

3.2. Metallurgical Characteristics

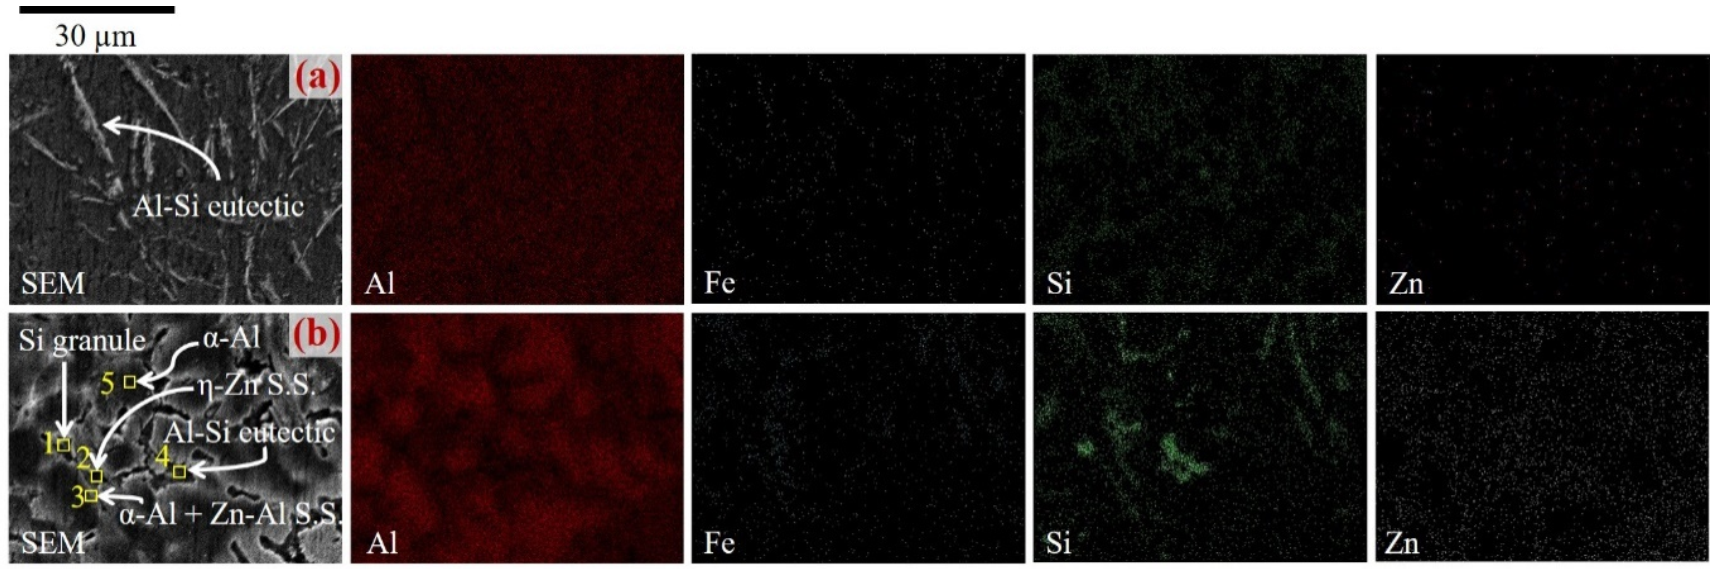
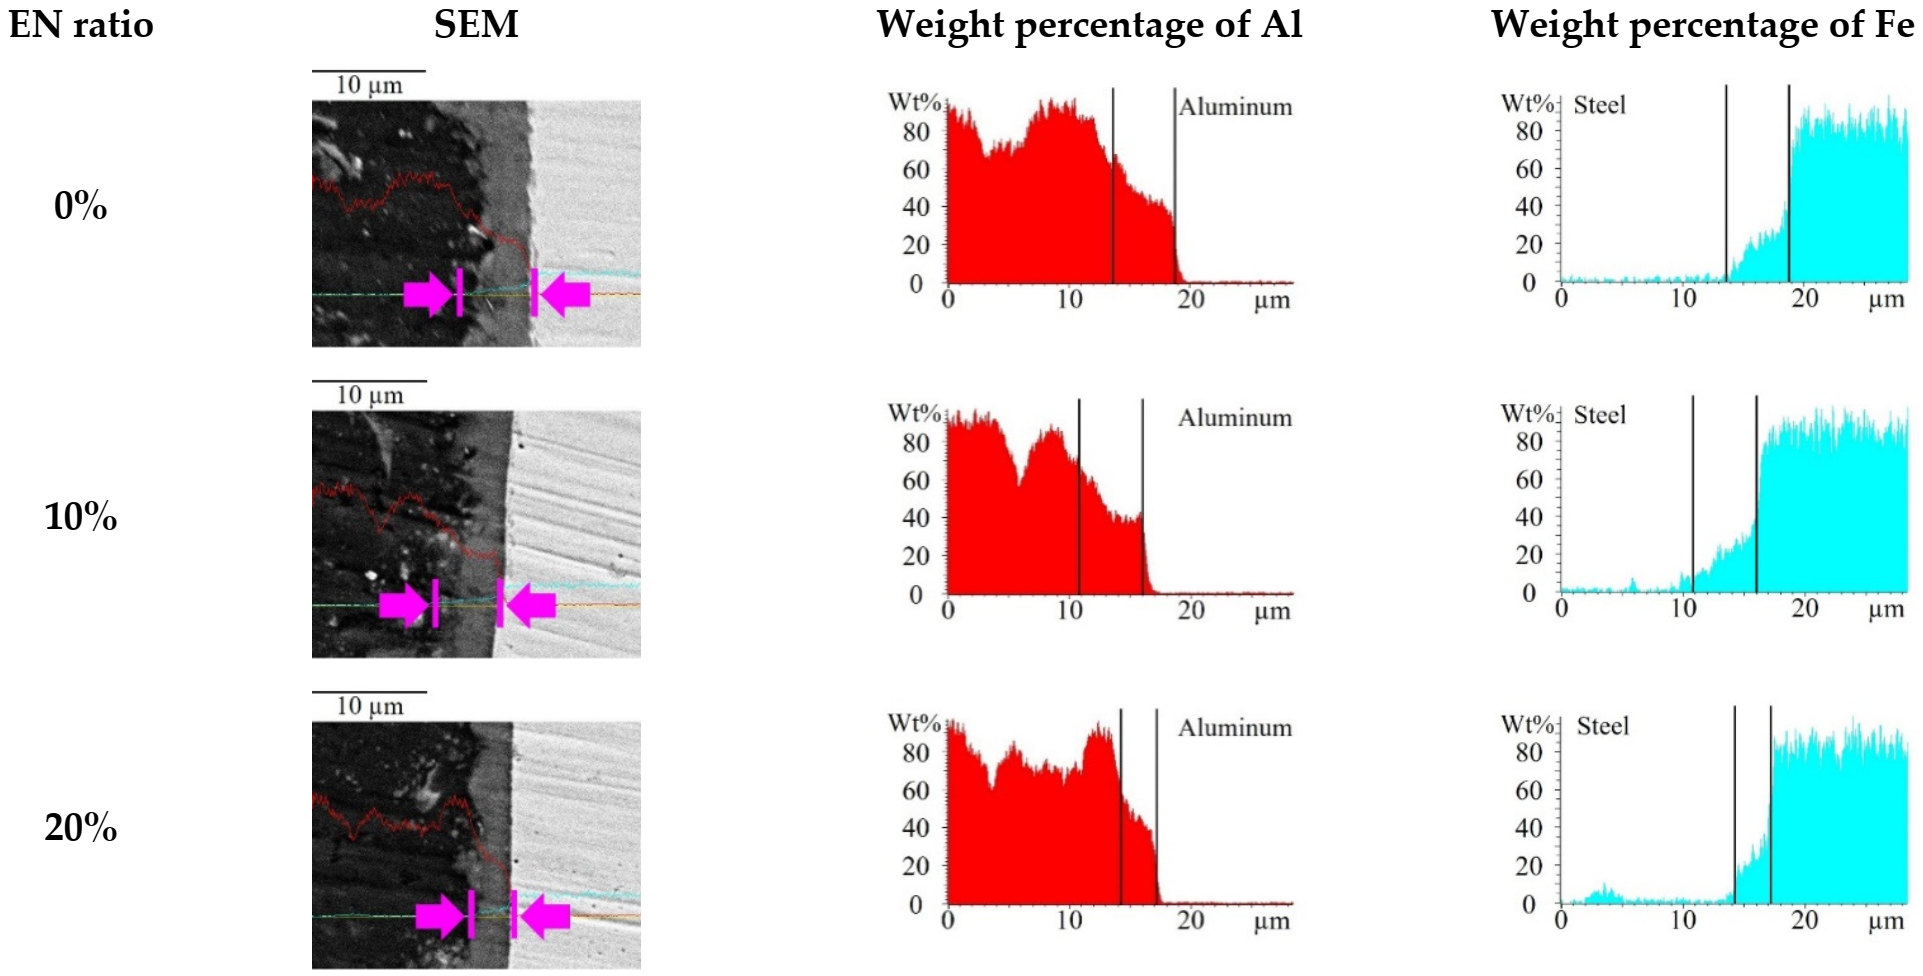
3.2.1. Zinc Distribution of the Joints

In joining aluminum to GI steel, it is known that the zinc layer on the steel surface promotes the wettability of the molten aluminum to steel, but its much lower melting and evaporating temperature than the aluminum and steel can generate defects such as porosities or crack in the joints. Hence, the distribution of Zn element was investigated to evaluate the microstructural characteristics of the fusion zone through SEM-EDS analysis. The measured locations of the fusion zone at the welding condition of 50 A 20% are illustrated in Figure 6, and the corresponding SEM images with the element distribution (Zn, Al, Si, Fe) are shown in Figure 7 and Table 5, respectively. In Figure 7a where the filler wire was deposited to the aluminum base metal, Al-Si eutectics were observed at the grain boundaries of the α-Al. However, the Si was more spread with Al-Si eutectics but less than in Figure 7b, which is the root area joined with the steel base metal. In Figure 7b, on the other hand, it was observed that the Zn element is concentrated due to the melting and evaporation of the Zn layer during the deposition of the molten aluminum. Because Zn has lower melting point than both the steel and the aluminum, the melting or evaporation of Zn occurs more quickly than them. Thus, the molten or evaporated Zn is transported to the root by the capillary effect [44] and by the flow of melting pool because of the temperature gradient which is simply shown in Figure 8; therefore, the Zn element is concentrated to the side edge of the joints in consequence. Furthermore, Si granules, Al-Zn eutectic, and η-Zn were observed at the grain boundaries.
To investigate the effect of current waveform on the Zn layer at the steel surface, which helps the molten aluminum to spread on the steel surface due to its high electric affinity and induces defects such as porosity in the weld, EPMA analysis was carried out at the locations of 0.5 and 4 mm away from the root in joints by 50 A 0 and 20% conditions. Based on the schematics of the measured location that is Figure 9, the obtained back-scattered electron (BSE), Zn, Al, and Fe images are shown in Figure 10.
Considering Table 6 in which Zn has lower melting point, boiling point, and work function, it was confirmed that the most of Zn on the steel surface in Figure 10a was molten or evaporated, and the Zn layer was substituted with molten metals and moved to the root side Figure 10b of the joints by the capillary effect with its lower surface tension than aluminum and by the flow of melting pool due to the arc pressure. Compared to the 0% condition, the 20% condition resulted in a higher amount of Zn at Figure 10b. In the presence of the EN sector which is periodic change of the polarity between the electrode and base metal in each current waveform cycle, the electron-flow direction is changed and resulting in the higher energy spending to melt the wire. This in turn leads an increase of the amount of molten wire and a decrease of heat input to the base metal. In other words, the fluctuation of electron flow direction in EN sector decreases the arc pressure and the temperature to higher viscosity of the molten metal. Thus, the evaporated Zn from the steel surface was not sufficiently extracted from the molten aluminum. At the same time, the low heat input at a higher EN ratio allowed rapid solidification in the root area with the large amount of Zn. About the IMC, the Fe-Al IMC at the joint interface showed smooth morphology on the steel side but a scattered needle-like shape on the aluminum side in both Figure 10a,b, but the aluminum side in the joint interface by AC pulse GMAW showed thinner thickness and smaller size of needle-like shape IMC phase than that by DC pulse GMAW. Since AC pulse GMAW, which forms the cathode spot on the filler wire during the change of polarity to EN section, provides less and smoother temperature variation per unit time to the joints than DC pulse GMAW does, it can be deduced that the diffusion of Fe to Al per unit length is significantly dependent on the temperature variation in the unit time within the given heat.

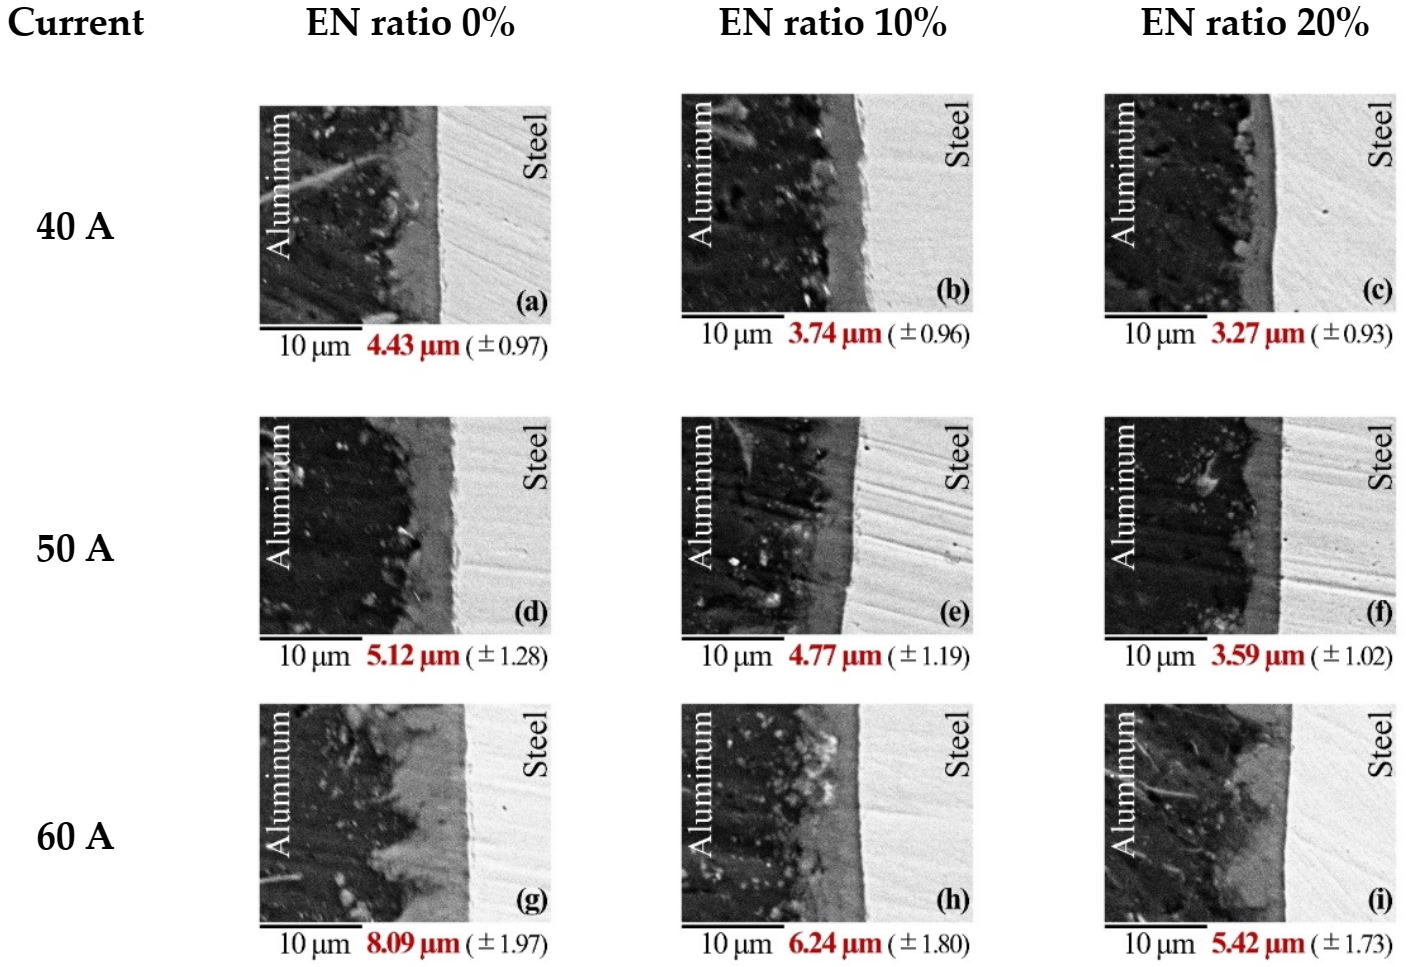
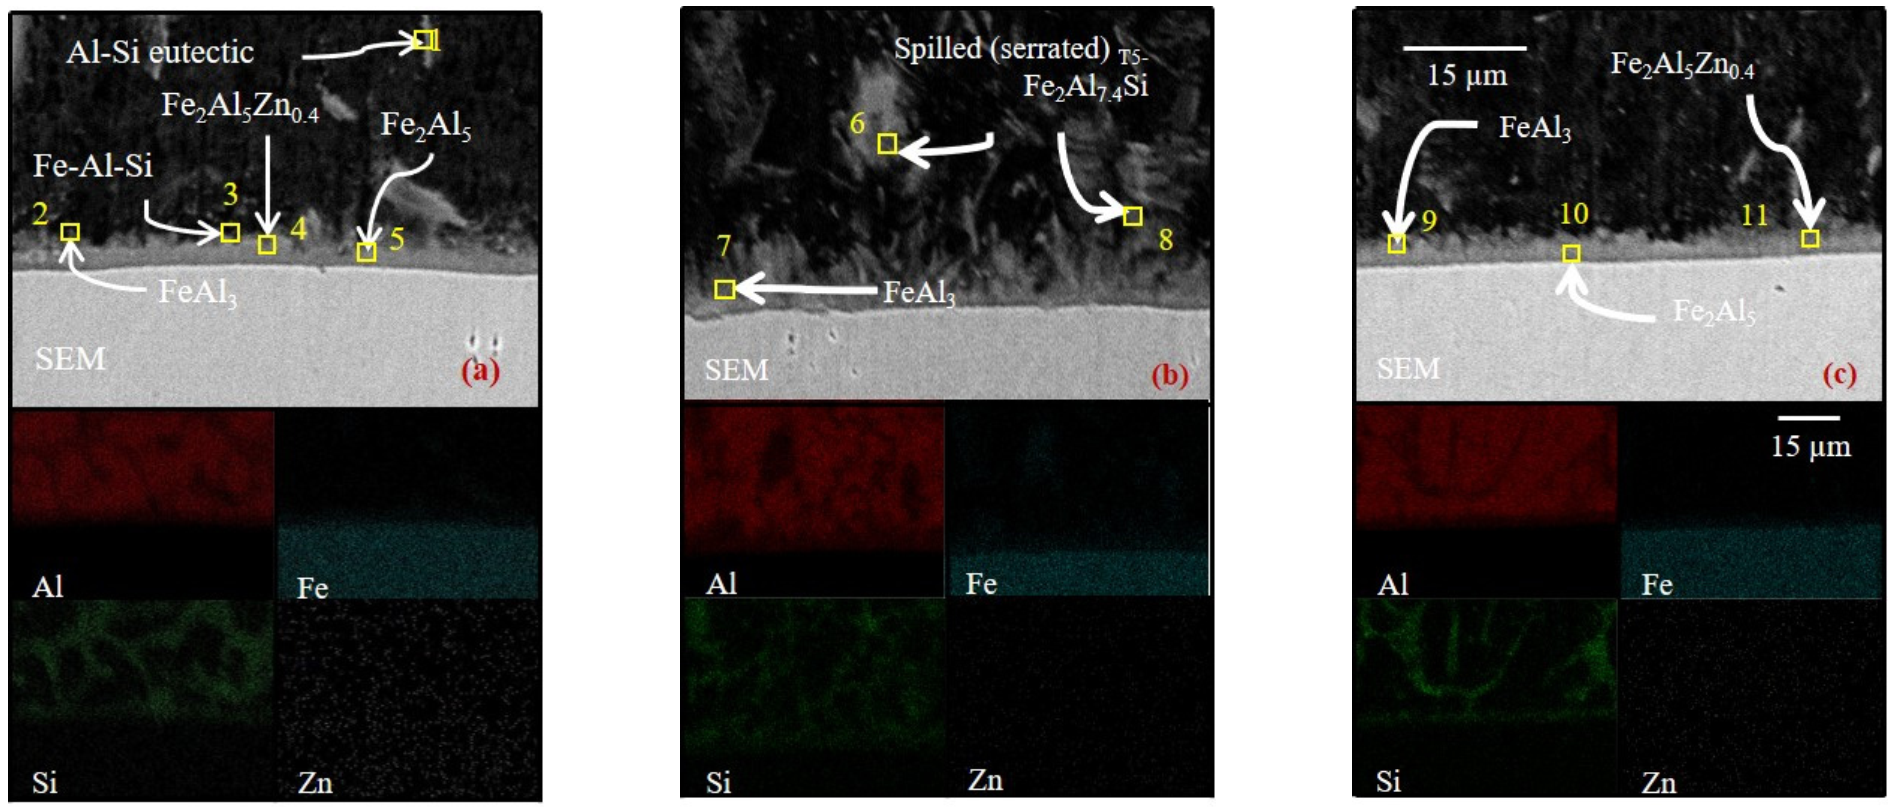
3.2.2. Formation of IMC Layer

The SEM macrographs of the joint interface 2 mm away from the root, which is schematically illustrated in Figure 11 (obtained at 40, 50, and 60 A with 0%, 10%, and 20%) are shown in Figure 12. The thickness of the IMC layer was measured at 20 points along the joint interface with the same distance and calculated to average value, and its standard deviation was considered. In Figure 12, the aluminum is located at the left side of the interface, while the steel is located on the opposite side. The morphology of the IMC layer in the joint interface showed a relatively flat and smooth shape toward the steel side while the serrated shape was oriented toward the aluminum side, implying a nonuniform diffusion of Fe and Al. In the DC pulse GMAW (EN 0%) process depicted in Figure 12a,d,g, which represent the DC pulse GMAW that forms the cathode spot on the base metal during whole current waveform cycle, the average IMC layer thickness at the joint interface increased by 4.43 (±0.97), 5.12 (±1.28), and 8.09 (±1.97) μm as the current increased from 40 to 60 A. When the current was increased, moreover, it was observed that the degree of serrated shape IMC layer and distribution of the scattered IMC in the aluminum side is increased. In contrast, as the EN ratio was increased from 0 to 20%, the IMC layer thickness was decreased from 4.43 (±0.97), 5.12 (±1.28), and 8.09 (±1.97) μm to 3.27 (±0.93), 3.59 (±1.02), and 5.42 (±1.73) μm showing the flatter IMC layer shape in 40, 50, and 60 A, respectively. Hence, it can be considered that the growth of Fe-Al IMC layer thickness by nonuniform diffusion of Fe to Al can be accelerated at increased surface energy by higher heat input indicating more drastic temperature variation in the unit time at the joint interface.
The variation in the chemical composition of Fe and Al in the IMC layer at 50 A with 0 to 20% was identified by SEM-EDS line analysis. Figure 13 shows the concentration of Al and Fe along the IMC layer. In Figure 13, it is confirmed that both the aluminum and steel decrease from the base metal to the joint interface, respectively. The concentration in weight percentage of the aluminum and steel along the IMC layer varied from 23 to 74% and 1 to 52%, respectively. This variation indicates that it is possible to form various Fe-Al IMC in the joint interface. By substituting the values of the Al and Fe in Figure 13 to the Fe-Al binary phase diagram [46] shown in Figure 14, it was confirmed that Al-rich IMC such as FeAl2, Fe2Al5, and FeAl3 could be formed easily. Furthermore, it was also confirmed that Fe-rich IMC, which are more ductile than Al-rich IMC [47], can be formed on the steel side.
SEM-EDS spot analysis was carried out at different spots on the joint interface produced at 50 A 20% condition. As shown in Figure 15, IMC layer in the locations of 1 and 4 mm away from the root and 1 mm away from the toe were measured. The following results of SEM macrographs and distribution of Al, Fe, Si, and Zn are depicted in Figure 16 with Table 7, and the thickness of IMC layer in the measured locations is compared in Figure 17. The morphology of the IMC layer showed a smooth interface between the IMC and steel, whereas needle-like and serrated structures were observed on the aluminum side in Figure 16. In the joint interface, two types of Al-rich IMC such as FeAl3 to the aluminum side and Fe2Al5 to the steel side were mainly found, respectively. Kobayashi et al. [48] reported that the FeAl3 IMC grows from the Fe2Al5 layer to the aluminum surface direction above 1073 K, and it is coarsened with increase of immersion temperature. Notably, in Figure 16b, which is in the middle of the weld, spilled shapes of the T5-Fe2Al7.4Si IMC were distributed as attached or separated from the joint interface on the aluminum side. The distribution of the spilled shaped IMC may due to the re-dissolution of Fe and its diffusion in the molten aluminum near to the joint interface by the convection movements of the aluminum liquid. Furthermore, not only Fe-Al IMC, but also the Al-Si, Fe-Si, Fe-Al-Si, and Fe-Al-Zn compounds were observed. Especially, it was confirmed that the Si containing compounds such as Al-Si and Fe-Al-Si was located around the boundaries of the aluminum grains to the joint interface and of the Fe-Al IMC layers to both the steel and the aluminum side, respectively. In other words, Si within the molten aluminum wire occupied the structural vacancies of Fe2Al5. Thus, it can be inferred that Si from the filler wire suppressed the growth of the IMC by blocking possible diffusion paths between Al and Fe. This result shows a fair agreement with several other studies; Agudo et al. and Jacome et al. [49,50] also found that adopting Si filler wire can restrict the growth of the Fe2Al5 by Si, which can change the interfacial reaction mechanism along the boundary of the IMC layer. In Figure 16a,c, which received relatively less heat input than in Figure 16b, a Zn-containing compound (Fe2Al5Zn0.4) was observed between the Fe-Al IMC layer and steel surface. This may because the remaining Zn, which has higher work function and ionization energy than Al, Fe, and Al-Fe on the steel surface, reacted and diffused to the Fe-Al IMC during welding. In addition, it can also be inferred that Zn, which has a lower boiling point, can decrease the heat input from the arc at the joint interface by its latent heat for evaporation during welding and ensures a lower maximum temperature compared to adopting the steel without Zn coating. This induces decreased diffusion of Fe to Al in the given time; hence, the presence of Zn layer can contribute to the restriction of the Fe-Al IMC layer formation. In Figure 17, it was found that the thickness of the IMC layer increased from the root Figure 16a as 3.54 (±0.87) μm to the center of the bead Figure 16b as 5.69 (±2.03) μm and decreased again at the toe Figure 16c to 1.44 (±0.03) μm. This can be explained with the energy distribution of the heat source. In GMAW process, the energy distribution of arc with droplets from the molten filler wire tends to follow the Gaussian distribution. Hence, the biggest amount of heat is transferred from the center of the heat source to the base metal and that heat is exponentially decreased as the distance from the center of the heat source in increased. Additionally, the root side Figure 16a shows a thicker IMC layer than the toe side Figure 16c because of the difference of heat conductivity by the different geometry of those two areas. Compared to the toe, the root is set tightly against both aluminum and steel, so the root has higher heat conductivity than the toe. This implies that solidification occurs more rapidly on the root side rather than on the toe side. Thus, the IMC layers in Figure 16a,c, which are subjected to different diffusion time and temperature, showed different average thicknesses.

3.3. Mechanical Characteristics

3.3.1. Hardness

To investigate the effect of EN ratio on the mechanical characteristics of the joints, micro Vickers hardness test was carried out. Figure 18 and Figure 19 show the hardness distribution measured along the middle line of transverse cross section of 50 A varying EN ratio, and along the 0.3, 0.6, and 0.9 mm away from the bottom side of the aluminum at 50 A 20% condition, respectively. In this study, the joints on the aluminum side can be divided into three distinct zones, viz. the base metal zone (BM), heat affected zone (HAZ), and weld metal zone (WM). The average hardness of the BM (AA5052 alloy) was found to be 65 Hv, but this value reduced to less than 60 Hv, which is lesser than that of the base metal in the HAZ because of softening due to the annealing effect, which is recrystallization and grain growth. Compared to the 0% condition which has 4.5 mm of HAZ, it was observed that the range of HAZ was decreased to approximately 3.5 mm as the EN ratio increased. In WM, the hardness values were increased approximately to 93 Hv in average due to the presence of Al-Si eutectics which has higher hardness than the aluminum. In the WM of 50 A 10% joints; however, the minimum hardness value as 42 Hv was also obtained which is much lower than the BM or HAZ. It can be inferred that the evaporization of Zn during the joining process formed porosity and significantly deteriorated the value.

3.3.2. Tensile-Shear Strength

The comparison of tensile-shear strength of the AC pulse GMAW joints varying the welding current from 40 to 60 A with EN ratio 0 to 20% is shown in Table 8 and Figure 20. The tensile-shear test was carried out on five specimens in each condition. In the welding current of 50 A and 60 A conditions, the tensile-shear strength increased as the EN ratio was increased. At 40 A, in contrast, the strength was decreased as the EN ratio increased due to insufficient heat input. The maximum average tensile shear strength of the DC pulse GMAW joints was 145.6 MPa, and their joint efficiency was approximately 66% of that of the Al base metal at the welding current of 50 A. The maximum average tensile-shear strength of the AC pulse GMAW joints was 171.0 MPa at 50 A 20% condition. At 50 A 20%, the maximum tensile strength reached its joint efficiency of approximately 78% as the increase in the EN ratio decreased the heat input to the base metal. However, the average tensile-shear strength decreased significantly with an increase in the EN ratio at 40 A; at which point, there is an insufficient heat input. This in turn results in a lack of fusion and the unfused zone at the joint interface has a strength of 110 MPa (joint efficiency of 50%). Conventionally, in the view of morphics in arc welding, it is considered that the joint strength is affected by the leg length and penetration depth. However, instead of leg length and penetration depth, in this study, the wet length of the bead was considered as the morphological factor because the joining process is brazing that only aluminum is molten and wet to the steel. However, the correlation between tensile shear showed an irregular result between strength and wet length, as can be confirmed in Table 4 but there was a good correspondence with heat input. Thus, it can be confirmed that the tensile shear strength of dissimilar material joints, such as aluminum to GI steel, by AC pulse GMAW is significantly affected by heat input from the current waveform. Figure 21 shows the failure mode of the tensile-shear test specimens. In addition, Figure 22a,b depicts SEM pictures of the fracture surface by 50 A 20% condition, respectively. In all joining conditions in Figure 20, the specimen failed in the weld, especially near or along the fusion line, along the vertical direction of the weldment. From the dimples observed in Figure 22a,b, it can be inferred that the porosities which are formed by the evaporation of Zn worked as notch for stress intensification in the root and resulted in a ductile fracture. Consequently, it can be confirmed that the joint strength can be enhanced by the decreasing the heat input to 51.46 J/mm with controlling of Zn evaporation during joining.

4. Conclusions

In this study, dissimilar materials, AA5052 aluminum alloy and GI steel, were joined using the AC pulse GMAW process. The effect of the current waveform on the distribution of zinc, the formation of the IMC layer, and the following mechanical characteristics of the joints were analyzed. The major conclusions of this study can be summarized as follows:
(1)
Compared to DC pulse GMAW joints, AC pulse joints showed relatively smooth bead geometries which have decreased the wet length and increased bead height. This is attributed to the decreased heat input to the base metal but the increased amount of the filler wire due to changes of the polarity. However, insufficient heat input at 40 A with 20% EN induced defects, which include porosity and unfused zone due to drastic Zn evaporation and lack of fusion in the root area. Asymmetric heat conduction in the root and toe in the joints induced more porosities in the root area than in the toe area. This is because the higher heat conductivity due to the tight set between aluminum and steel in the root resulted in faster solidification when compared to the toe side, and hence, evaporated Zn was trapped more easily.
(2)
Compared to the average IMC layer thickness of DC pulse GMAW joints, the AC pulse process resulted in a thinner IMC layer. This decrease can be attributed to the less heat generation at higher EN ratio. The measured average IMC layer thickness at the joint interface satisfied the required the maximum thickness (<10 μm) to achieve sound joint strength. It is realized that heat generation in the unit length per time at the joint interface significantly affects the growth of IMC layer thickness.
(3)
The morphology of the Fe-Al IMC layer was a smooth interface between the IMC and the steel, the but needle-like and serrated type interface was observed toward the aluminum side. This is because of the nonuniform diffusion of aluminum and steel. Furthermore, Fe-Al-Si and Fe-Al-Zn compounds were formed at the boundary of the Fe-Al IMC. It can be inferred that the presence of Si and Zn contributed to improving the joint strength by restricting the growth of brittle Fe-Al IMC.
(4)
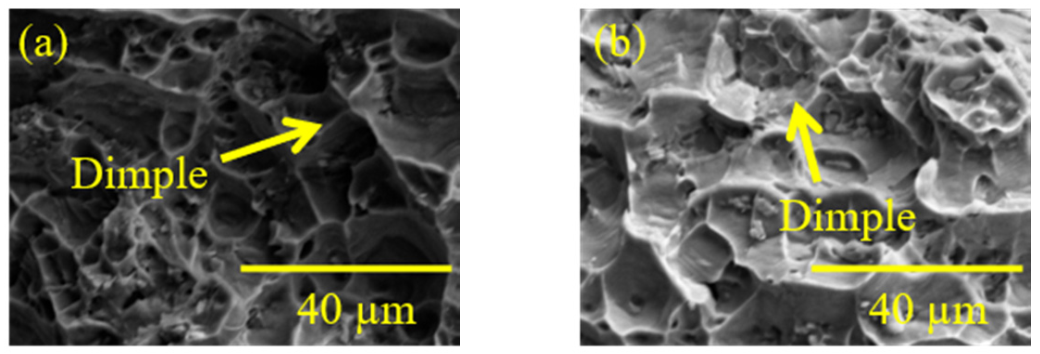
The highest average tensile-shear strength was achieved as 171 MPa (joint efficiency of 78%) adopting 51.46 J/mm of heat input by 50 A 20%. The result showed 11% higher joint efficiency than the maximum tensile-shear strength of DC pulse GMAW joints. This is ascribed to the decrease in the heat input as the EN ratio increased. The failure mode of the joints followed a ductile fracture pattern from the fusion line along the vertical direction to the weldment; in this case, the porosities corresponding to evaporated Zn worked as stress-intensification notches in the root.
It is confirmed that the cyclical polarity applied during the AC pulse GMAW process improved the joint quality of AA5052 aluminum alloy–hot-dip galvanized steel by decreasing the heat input. These results may guide future research on controlling the heat input and controlling the zinc distribution while joining aluminum alloys to zinc-coated steel using the AC pulse GMAW process.

Author Contributions

S.M.H.; investigation, S.M.H.; writing, S.T.; supervision, H.-S.B.; supervision, M.T.; supervision. All authors have read and agreed to the published version of the manuscript.

Funding

This research received no external funding.

Conflicts of Interest

The authors declare no conflict of interest.

References

  1. Kim, I.S.; Basu, A. A mathematical model of heat transfer and fluid flow in the gas metal arc welding process. J. Mater. Process. Technol. 1998, 77, 17–24. [Google Scholar] [CrossRef]
  2. Xu, G.; Hu, J.; Tsai, H.L. Three-dimensional modeling of the plasma arc in arc welding. J. Appl. Phys. 2008, 104, 103301. [Google Scholar] [CrossRef]
  3. Schnick, M.; Fuessel, U.; Hertel, M.; Haessler, M.; Spille-Kohoff, A.; Murphy, A.B. Modelling of gas–metal arc welding taking into account metal vapour. J. Phys. D Appl. Phys. 2010, 43, 434008. [Google Scholar] [CrossRef] [Green Version]
  4. Tanaka, K.; Shigeta, M.; Tanaka, M.; Murphy, A.B. Investigation of the bilayer region of metal vapor in a helium tungsten inert gas arc plasma on stainless steel by imaging spectroscopy. J. Phys. D Appl. Phys. 2019, 52, 354003. [Google Scholar] [CrossRef]
  5. Fan, H.G.; Kovacevic, R. A unified model of transport phenomena in gas metal arc welding including electrode, arc plasma and molten pool. J. Phys. D Appl. Phys. 2004, 37, 2531. [Google Scholar] [CrossRef]
  6. Wu, D.; Tashiro, S.; Wu, Z.; Nomura, K.; Hua, X.; Tanaka, M. Analysis of heat transfer and material flow in hybrid KPAW-GMAW process based on the novel three dimensional CFD simulation. Int. J. Heat Mass Transf. 2020, 147, 118921. [Google Scholar] [CrossRef]
  7. Coelho, R.S.; Kostka, A.; Dos Santos, J.F.; Kaysser-Pyzalla, A. Friction-stir dissimilar welding of aluminium alloy to high strength steels: Mechanical properties and their relation to microstructure. Mater. Sci. Eng. A 2012, 556, 175–183. [Google Scholar] [CrossRef]
  8. Bruckner, J. Cold metal transfer has a future joining steel to aluminum. Weld. J. 2005, 84, 38–40. [Google Scholar]
  9. Pouranvari, M. Critical assessment 27: Dissimilar resistance spot welding of aluminium/steel: Challenges and opportunities. Mater. Sci. Technol. 2017, 33, 1705–1712. [Google Scholar] [CrossRef] [Green Version]
  10. Song, J.L.; Lin, S.B.; Yang, C.L.; Fan, C.L.; Ma, G.C. Analysis of intermetallic layer in dissimilar TIG welding-brazing butt joint of aluminium alloy to stainless steel. Sci. Technol. Weld. Join. 2010, 15, 213–218. [Google Scholar] [CrossRef]
  11. Lin, S.B.; Song, J.L.; Yang, C.L.; Ma, G.C. Metallurgical and mechanical investigations of aluminium-steel butt joint made by tungsten inert gas welding-brazing. Sci. Technol. Weld. Join. 2009, 14, 636–639. [Google Scholar] [CrossRef]
  12. Dong, H.; Yang, L.; Dong, C.; Kou, S. Improving arc joining of Al to steel and Al to stainless steel. Mater. Sci. Eng. A 2012, 534, 424–435. [Google Scholar] [CrossRef]
  13. He, H.; Yang, C.; Lin, S.; Fan, C.; Chen, Z.; Chen, Z. Flux modification for AC-TIG braze welding of aluminium to stainless steel. Sci. Technol. Weld. Join. 2014, 19, 527–533. [Google Scholar] [CrossRef]
  14. Zhang, H.T.; Feng, J.C.; He, P.; Hackl, H. Interfacial microstructure and mechanical properties of aluminium-zinc-coated steel joints made by a modified metal inert gas welding-brazing process. Mater. Charact. 2007, 58, 588–592. [Google Scholar] [CrossRef]
  15. Cao, R.; Sun, J.H.; Chen, J.H.; Wang, P. Weldability of CMT joining of AA6061-T6 to boron steels with various coatings. Weld. J. 2014, 93, 193s–204s. [Google Scholar]
  16. Murakami, T.; Nakata, K.; Tong, H.; Ushio, M. Dissimilar metal joining of aluminum to steel by MIG arc brazing using flux cored wire. ISIJ Int. 2003, 43, 1596–1602. [Google Scholar] [CrossRef] [Green Version]
  17. Zhang, H.; Liu, J. Microstructure characteristics and mechanical property of aluminum alloy/stainless steel lap joints fabricated by MIG welding-brazing process. Mater. Sci. Eng. A 2011, 528, 6179–6185. [Google Scholar] [CrossRef]
  18. Sierra, G.; Peyre, P.; Beaume, F.D.; Stuart, D.; Fras, G. Steel to aluminium braze welding by laser process with Al-12Si filler wire. Sci. Technol. Weld. Join. 2008, 13, 430–437. [Google Scholar] [CrossRef]
  19. Dharmendra, C.; Rao, K.P.; Wilden, J.; Reich, S. Study on laser welding-brazing of zinc coated steel to aluminum alloy with a zinc based filler. Mater. Sci. Eng. A 2011, 528, 1497–1503. [Google Scholar] [CrossRef]
  20. Windmann, M.; Röttger, A.; Kügler, H.; Theisen, W.; Vollertsen, F. Laser beam welding of aluminum to Al-base coated high-strength steel 22MnB5. J. Mater. Process. Technol. 2015, 217, 88–95. [Google Scholar] [CrossRef]
  21. Bang, H.S.; Lee, W.R.; Hong, S.M.; Lee, S.Y.; Song, J.H.; Kim, J.M.; Bang, H.S. Mechanical Properties of Dissimilar A356/SAPH440 Lap Joints by the Friction Stir Spot Welding and Self-Piercing Riveting. Strength Mater. 2018, 50, 63–71. [Google Scholar] [CrossRef]
  22. Mamat, S.B.; Tashiro, S.; Masri, M.N.; Hong, S.M.; Bang, H.S.; Tanaka, M. Application of pulse plasma MIG welding process to Al/steel dissimilar joining. Weld. World 2020, 1–15. [Google Scholar] [CrossRef]
  23. Bang, H.S.; Hong, S.M.; Das, A.; Bang, H.S. Study on the weldability and mechanical characteristics of dissimilar materials (Al5052-DP590) by TIG assisted hybrid friction stir welding. Met. Mater. Int. 2019, 1–12. [Google Scholar] [CrossRef]
  24. Kashaev, N.; Ventzke, V.; Çam, G. Prospects of laser beam welding and friction stir welding processes for aluminum airframe structural applications. J. Manuf. Process. 2018, 36, 571–600. [Google Scholar] [CrossRef]
  25. Yaduwanshi, D.K.; Bag, S.; Pal, S. Numerical modeling and experimental investigation on plasma-assisted hybrid friction stir welding of dissimilar materials. Mater. Des. 2016, 92, 166–183. [Google Scholar] [CrossRef]
  26. Yagati, K.P.; Bathe, R.N.; Rajulapati, K.V.; Rao KB, S.; Padmanabham, G. Fluxless arc weld-brazing of aluminium alloy to steel. J. Mater. Process. Technol. 2014, 214, 2949–2959. [Google Scholar] [CrossRef]
  27. Dong, H.; Hu, W.; Duan, Y.; Wang, X.; Dong, C. Dissimilar metal joining of aluminum alloy to galvanized steel with Al-Si, Al-Cu, Al-Si-Cu and Zn-Al filler wires. J. Mater. Process. Technol. 2012, 212, 458–464. [Google Scholar] [CrossRef]
  28. Lemmens, B.; Springer, H.; Duarte, M.J.; De Graeve, I.; De Strycker, J.; Raabe, D.; Verbeken, K. Atom probe tomography of intermetallic phases and interfaces formed in dissimilar joining between Al alloys and steel. Mater. Charact. 2016, 120, 268–272. [Google Scholar] [CrossRef]
  29. Kang, M.; Kim, C. Joining Al 5052 alloy to aluminized steel sheet using cold metal transfer process. Mater. Des. 2015, 81, 95–103. [Google Scholar] [CrossRef]
  30. Zhou, Y.; Lin, Q. Wetting of galvanized steel by Al 4043 alloys in the first cycle of CMT process. J. Alloys Compd. 2014, 589, 307–313. [Google Scholar] [CrossRef]
  31. Hasanniah, A.; Movahedi, M. Welding of Al-Mg aluminum alloy to aluminum clad steel sheet using pulsed gas tungsten arc process. J. Manuf. Process. 2018, 31, 494–501. [Google Scholar] [CrossRef]
  32. Goecke, S.F.; Makwana, P.; Shome, M.; De, A. Probing joint strength and distortion in gas metal arc lap joining of aluminum and steel sheets. Weld. World 2019, 63, 229–236. [Google Scholar] [CrossRef]
  33. Das, A.; Shome, M.; Das, C.R.; Goecke, S.F.; De, A. Joining of galvannealed steel and aluminium alloy using controlled short circuiting gas metal arc welding process. Sci. Technol. Weld. Join. 2015, 20, 402–408. [Google Scholar] [CrossRef]
  34. Das, A.; Shome, M.; Goecke, S.F.; De, A. Joining of aluminium alloy and galvanized steel using a controlled gas metal arc process. J. Manuf. Process. 2017, 27, 179–187. [Google Scholar] [CrossRef]
  35. Zhang, H.T.; Feng, J.C.; He, P. Interfacial phenomena of cold metal transfer (CMT) welding of zinc coated steel and wrought aluminium. Mater. Sci. Technol. 2008, 24, 1346–1349. [Google Scholar] [CrossRef]
  36. Su, Y.; Hua, X.; Wu, Y.; Zhang, Y.; Guo, Y. Characterization of intermetallic compound layer thickness at aluminum-steel interface during overlaying. Mater. Des. 2015, 78, 1–4. [Google Scholar] [CrossRef]
  37. Nishimoto, K. Mechanical properties of laser-pressure-welded joint between dissimilar galvannealed steel and pure aluminum. Quar. J. JWS 2008, 26, 174–180. [Google Scholar]
  38. So, W.J.; Kang, M.J.; Kim, D.C. Weldability of pulse GMAW joints of 780 MPa dual-phase steel. Arch. Mater. Sci. Eng. 2010, 41, 53–60. [Google Scholar]
  39. Kumar, R.; Dilthey, U.; Dwivedi, D.K.; Ghosh, P.K. Thin sheet welding of Al 6082 alloy by AC pulse-GMA and AC wave pulse-GMA welding. Mater. Des. 2009, 30, 306–313. [Google Scholar] [CrossRef]
  40. Park, H.J.; Kim, D.C.; Kang, M.J.; Rhee, S. The arc phenomenon by the characteristic of EN ratio in AC pulse GMAW. Int. J. Adv. Manuf. Technol. 2013, 66, 867–875. [Google Scholar] [CrossRef]
  41. Park, H.J.; Rhee, S.; Kang, M.J.; Kim, D.C. Joining of steel to aluminum alloy by AC pulse MIG welding. Mater. Trans. 2009, 50, 2314–2317. [Google Scholar] [CrossRef] [Green Version]
  42. Kiran, D.V.; Cheon, J.; Arif, N.; Chung, H.; Na, S.J. Three-dimensional finite element modeling of pulsed AC gas metal arc welding process. Int. J. Adv. Manuf. Technol. 2016, 86, 1453–1474. [Google Scholar] [CrossRef]
  43. Messler, R.W., Jr. Principles of Welding; WILEY-VCH: Weinheim, Germany, 2004. [Google Scholar]
  44. Milani, A.M.; Paidar, M.; Khodabandeh, A.; Nategh, S. Influence of filler wire and wire feed speed on metallurgical and mechanical properties of MIG welding-brazing of automotive galvanized steel/5754 aluminum alloy in a lap joint configuration. Int. J. Adv. Manuf. Technol. 2016, 82, 1495–1506. [Google Scholar] [CrossRef]
  45. Hu, J.; Guo, H.; Tsai, H.L. Weld pool dynamics and the formation of ripples in 3D gas metal arc welding. Int. J. Heat Mass Transf. 2008, 51, 2537–2552. [Google Scholar] [CrossRef] [Green Version]
  46. Davis, J.R. (Ed.) ASM Specialty Handbook, Heat-Resistant Materials; ASM International: Materials Park, OH, USA, 1997; pp. 389–414. [Google Scholar]
  47. Yasuyama, M. Spot welding of aluminium and steel sheet with insert of aluminium clad steel sheet-Part I. Quar. J. JWS 1996, 14, 314–320. (In Japanese) [Google Scholar]
  48. Kobayashi, S.; Yakou, T. Control of intermetallic compound layers at interface between steel and aluminum by diffusion-treatment. Mater. Sci. Eng. A 2002, 338, 44–53. [Google Scholar] [CrossRef]
  49. Agudo, L.; Weber, S.; Pinto, H.; Arenholz, E.; Wagner, J.; Hackl, H.; Pyzalla, A. Study of microstructure and residual stresses in dissimilar Al/steels welds produced by cold metal transfer. In Materials Science Forum; Trans. Tech. Publications Ltd.: Kapellweg, Switzerland, 2008; Volume 571, pp. 347–353. [Google Scholar] [CrossRef]
  50. Jácome, L.A.; Weber, S.; Leitner, A.; Arenholz, E.; Bruckner, J.; Hackl, H.; Pyzalla, A.R. Influence of filler composition on the microstructure and mechanical properties of steel—Aluminum joints produced by metal arc joining. Adv. Eng. Mater. 2009, 11, 350–358. [Google Scholar] [CrossRef]
Figure 1. SEM image of the galvanized (GI) steel surface and wt.% concentration of Zn.
Metals 11 00561 g001
Figure 2. Schematics of experimental setup: (a) experimental setup for welding and (b) jig positioning.
Metals 11 00561 g002
Figure 3. Schematic of the current waveform in the alternating current pulse gas metal arc welding (AC pulse GMAW).
Metals 11 00561 g003
Figure 4. Top and bottom bead profiles of AC pulse GMAW joints.
Metals 11 00561 g004
Figure 5. Cross-sectional bead profiles of AC pulse GMAW joints.
Metals 11 00561 g005
Figure 6. Schematic of measured locations by SEM-EDS.
Metals 11 00561 g006
Figure 7. SEM-EDS images of the joints at 50 A 20%: (a) Observed image of location (a) in Figure 6 and (b) Observed image of location (b) in Figure 6.
Metals 11 00561 g007
Figure 8. Schematics of fluid flow in melting pool [45]: (a) fluid flow from top view and (b) fluid flow from the cross-sectional view.
Metals 11 00561 g008
Figure 9. Schematic of measured locations by electron probe microanalyzer (EPMA).
Metals 11 00561 g009
Figure 10. Comparison of element distribution of Zn, Al, and Fe at 50 A condition: (a) EPMA image of 50 A 0% condition at location (a) in Figure 9, (b) EPMA image of 50 A 0% condition at location (b) in Figure 9, (c) EPMA image of 50 A 0% condition at location (a) in Figure 9, (d) EPMA image of 50 A 0% condition at location (b) in Figure 9.
Metals 11 00561 g010
Figure 11. Schematic of measured locations for intermetallics (IMC) layer thickness by SEM.
Metals 11 00561 g011
Figure 12. Comparison of IMC layer thickness at different welding current and electrode-negative (EN) ratio: (a) 40A EN ratio 0%, (b) 40A EN ratio 10%, (c) 40A EN ratio 20%, (d) 50A EN ratio 0%, (e) 50A EN ratio 10%, (f) 50A EN ratio20%, (g) 60A EN ratio 0%, (h) 60A EN ratio 10%, and (i) 60A EN ratio 20%.
Metals 11 00561 g012
Figure 13. Weight percentage of Al and Fe in the IMC layer in 50 A condition with different EN ratio.
Metals 11 00561 g013
Figure 14. Fe-Al phase diagram [46].
Metals 11 00561 g014
Figure 15. Schematic of the SEM-EDS measured locations of IMC layer at the joint interface by 50 A 20%.
Metals 11 00561 g015
Figure 16. Comparison of element distribution of Zn, Al, Fe, and Zn by SEM-EDS at 50 A 20% condition joint interface: (a) Observed image at the location corresponding to (a) in Figure 15, (b) Observed image at the location corresponding to (b) in Figure 15, and (c) Observed image at the location corresponding to (c) in Figure 15.
Metals 11 00561 g016
Figure 17. IMC layer thickness of 50 A 20% condition joints at different locations.
Metals 11 00561 g017
Figure 18. Comparison of hardness values with respect to the EN ratio at 50 A condition.
Metals 11 00561 g018
Figure 19. Comparison of hardness values at different locations in 50 A 20% joints.
Metals 11 00561 g019
Figure 20. Comparison of tensile-shear strength.
Metals 11 00561 g020
Figure 21. Failure mode in AC pulse GMAW joints.
Metals 11 00561 g021
Figure 22. Fracture surface of the joints by 50 A 20%; (a) dimples at the steel direction and (b) dimples at the aluminum direction.
Metals 11 00561 g022
Table 1. Chemical composition of the base metals and filler wire.
MaterialChemical Composition (wt.%)
AA5052MgMnZnFeSiCrCuTiAl
2.50.10.10.40.250.150.10.15Bal.
AA4047SiFeCuMnMgZnBeAl-
11.0–13.00.80.30.150.10.20.0003Bal.-
GI steelCSiMnPSSol-AlFe--
0.0120.010.150.0150.0070.032Bal.--
Table 2. Mechanical properties of the base metals and filler wire.
MaterialYield Strength
(MPa)
Ultimate Tensile Strength (MPa)Elongation
(%)
AA505219322012
AA404713126817
GI steel16429453
Table 3. Welding parameters.
Welding Current
(A)
Wire Feed Rate
(m/min)
Welding Voltage
(V)
Welding Speed (mm/s)EN Ratio
(%)
CTWD
(mm)
Shielding Gas Flow
(L/min)
Torch Inclination
(Working-Travel, °)
Torch Position to Al
(mm)
αHSEN
(%)
Heat Input
(J/mm)
402.919.1100151515–15229:7154.06
1033:6746.99
2037:6341.13
503.719.6031:6966.31
1044:5658.14
2058:4251.46
604.220.2032:6878.33
1035:6569.12
2039:6161.57
Table 4. Bead dimensions of the joints by AC pulse GMAW joints.
Welding Current (A)EN Ratio (%)Wet Length (mm)Bead Height (mm)Wet Angle (o)
4006.921.3117.7
106.531.4223.9
206.481.4829.4
5009.181.5316.4
108.631.619.2
208.161.6420.6
60010.451.5418.5
1010.051.718.9
209.131.7320
Table 5. Element composition (at.%) of the measured locations in Figure 7.
PointAlFeSiZn
10.65-98.331.02
244.710.91.9952.4
374.88-0.9823.91
481.32-18.560.02
598.010.810.780.4
Table 6. Material properties of Al, Fe, Zn, and Si.
PropertiesAlFeZnSi
Melting temperature (K)93318086931683
Boiling temperature (K)2792313411803538
Work function (eV)4.264.814.44.85
Ionization voltage (V)5.997.878.159.39
Table 7. Element composition (at.%) of the measured locations in Figure 16.
PointAlFeSiZn
184.44-15.56-
274.6325.37--
372.924.52.6-
464.1230.74.33-
567.5627.03-5.41
671.1728.83--
774.9425.06--
873.217.918.20.3
975.1424.85--
1054.2145.79--
1160.8533.6-5.55
Table 8. Tensile-shear strength of AC pulse GMAW joints.
Current
(A)
EN Ratio
(%)
Tensile-Shear Strength (MPa)Joint Efficiency
(%)
MinimumMaximumAverage
40087.2130.0133.160.5
10125.3152.2123.156.0
2088.9141.7110.350.1
500123.9175.3145.666.2
10128.3157.5159.472.5
20147.8188.6171.077.7
600132.2156.7140.263.7
10138.6159.2153.569.8
20142.2172.2164.074.5
Publisher’s Note: MDPI stays neutral with regard to jurisdictional claims in published maps and institutional affiliations.

