Abstract
The applicability of both prediction methods for low-cycle fatigue life of powder superalloy based on the Manson-Coffin equation and damage mechanics were addressed. Both fatigue life prediction models were evaluated by low-cycle fatigue experimental data of powder superalloy FGH96 with non-destructive standard parts and those with inclusions. Due to the characteristics of high strength and low plasticity of powder superalloy FGH96, errors in calculating the plastic strain amplitude deviate severely the prediction outcomes when using Manson-Coffin method. Meanwhile, by introducing the damage variable which characterizes the material damage, the damage evolution equation can be built by fitting the experimental data of standard parts and also applied to powder superalloy specimens containing inclusion. It is indispensable to accurately calculate the damage characterization parameter through finite element analysis in local stress concentration around the inclusion. The applicability of the prediction model was verified by the test life cycles of experimental specimens with different types and sizes of inclusions subsequently. Testing and simulation work showed much better prediction accuracies globally for the damage mechanics approach.
1. Introduction
Since the emergence of powder superalloys in the 1970s, the material revolution of aeroengine turbine disks has never stopped. At present, four generations of powder superalloy have been developed in the United States. China is catching up in this field, and has produced first- and second-generation powder superalloys represented by FGH95 and FGH96, and is overcoming the technical difficulties associated with third-generation powder superalloys [1,2,3]. With the development of powder superalloys, the particle size of the powders forming the superalloy is getting smaller and smaller, from the initial 100 μm to the current 50 μm [4]. At the same time, the strengthening term of the alloy has gradually become more complicated, and more trace elements have been added to the matrix material. This leads to a problem: it is more and more difficult to screen the inclusion particles, and the composition of the inclusions is becoming more complex. Consequently, it is difficult to predict the influence of the inclusion on fatigue properties of the superalloy due to the large randomness of the inclusion in the shape, location, size and other aspects.
Many experimental studies have proved that the existence of inclusions leads to obvious stress concentration in the stress field around the inclusions during the loading process, which has become the main reason for the decrease of low-cycle fatigue life of powder superalloy caused by inclusions [5,6]. Besides, the relationship between crack initiation mechanisms and microstructure of alloys must not be neglected [7], and parameters of profile and surface shape ought to be considered in fatigue characterization [8]. However, when the Manson-Coffin equation is applied for the fatigue life prediction, it obviously cannot take this kind of micro defect into account, nor can it reflect the fatigue crack initiation information of powder superalloy containing inclusions [9]. In addition, the powder superalloy FGH96 has obvious high strength and low plasticity [10,11,12]. Zhou et al. [13] observed the cyclic hardening and cyclic softening of FGH96 at 750 ℃ by controlling the strain ratio to 0.05, and established Manson-Coffin life prediction model and Zheng method life prediction model, respectively. By comparison, it was found that Zheng method includes the strain fatigue limit, which is more concise and accurate than Manson-coffin method. Liu [14] pointed out noticeably on the basis of experiments that, when using the Manson-Coffin equation to predict the life of FGH96, sometimes the plastic strain is negative, which is obviously unreasonable. The main reason is that FGH96 has obvious high strength and low plasticity. Meanwhile, Manson-Coffin equation can hardly reflect the influence of inclusions on the low-cycle fatigue performance of FGH96. Therefore, parameters that characterize defects and damage should be introduced. Hu et al. [15] developed a modified Manson-Coffin model taking the inclusion parameter into account for FGH96 based on the micro-damage mechanism. The powder superalloy FGH96 was revealed through analysis to be very sensitive to surface defects and the inclusion involving its location and size has an important influence on the FGH96 superalloy’s low-cycle fatigue lifetime.
In this research, the evaluation of the Manson-Coffin fatigue life prediction model was reported on the basis of experimental data. Meanwhile, the damage evolution equation was formed after introducing the damage characterization parameter through experimental data fitting. The applicable analysis of both the Manson-Coffin model and model based on damage mechanics was respectively performed for low-cycle fatigue crack initiation life prediction of powder superalloy containing various types of inclusions and the applicability was assessed by comparison with experimental data.
2. Basic Principles
2.1. Basic Principle of Manson-Coffin Theory
Basquin [16] proposed for the first time in 1910 that there is a linear relationship between stress amplitude and fatigue life in a double logarithmic coordinate system under cyclic loading. In 1954, Manson and Coffin [17,18] conducted a large number of experiments. Summing up the experimental data, it was found that there was a linear relationship between the plastic strain amplitude and the fatigue life to cyclic failure in the double logarithmic coordinate system.
The total strain amplitude is the sum of the elastic strain amplitude and the plastic strain amplitude:
The material strain-life relationship can be obtained by Formula (1), which is called the Manson-Coffin equation:
2.2. Basic Principle of Damage Mechanics
In the middle of the 20th century, Kachanov pointed out in the process of studying the creep damage and fracture of materials that a continuous variable can be introduced to characterize the gradual decline of mechanical properties of materials. Since then, damage mechanics has sprouted. Subsequently, Kachanov’s student Rabotnov put forward the idea of damage parameter, which pointed out the direction for the development and research of damage mechanics. After decades of continuous development, damage mechanics has gradually become a discipline based on continuum mechanics and irreversible thermodynamics, and has become an effective means to trace the entire process of materials from deformation, damage to failure or instability.
From the perspective of thermodynamics, Lemaitre [19] pointed out that the fatigue damage process of material can be regarded as an irreversible dissipation process of energy inside the material, which can be known from the first law of thermodynamics:
In the formula, ΔE refers to the change of internal energy of the material, Q refers to the incoming heat, and U refers to the work done on the interior of the material by the external environment.
Taking the control body dx1 dx2 dx3, the internal energy increment ΔE can be written as a differential form:
where e is the internal energy mass density per unit volume.
The damage of the material is formed in the process of continuous external work. When the material does external work, internal energy decreases and internal entropy increases. The Helmholtz unit volume free energy density g is introduced as a state function:
where T is the temperature and s is the unit volume entropy of the material.
The physical meaning of g is the internal energy that can be used to do external work in the material during the isothermal process. g is related to the state of the material, so g is used to characterize the state of the material in the damage process. g can be described by elastic strain tensor , damage degree variable D and temperature T:
The damage characterization parameter Y can be introduced:
where Y, known as damage driving force, is a variable related to the damage degree D, which represents the free energy dissipation caused by the internal damage of the material. W is the strain energy density of the material. During material damage process, the damage degree D continues to increase, Helmholtz free energy g continues to be dissipated in form of thermal energy, and the ability of material to do external work decreases. Therefore, the relationship between Y and g can be established:
The cyclic damage evolution equation can be obtained by integrating Equation (8):
Among them, a and m are damage parameters. K, called as cyclic load characteristic value, is a parameter introduced to characterize cyclic load characteristics, which is a function of strain ratio R.
When the cyclic load is tension-tension:
When the cyclic load is a tension-compression:
3. Manson-Coffin Life Prediction Model
3.1. Establishment of Manson-Coffin Life Prediction Model for Powder Superalloys
The experiments were carried out for the axial strain fatigue test of the FGH96 specimens at 530 °C and 600 °C respectively, so as to obtain the fatigue data of the standard parts and fit the test data to get values of relevant parameters for establishing the Manson-Coffin fatigue life prediction model. The experimental conditions under 530 °C are listed as shown in Table 1.

Table 1.
Experimental conditions at 530 °C.
According to the data provided by the test results, the total strain amplitude, elastic strain amplitude, and plastic strain amplitude were calculated, which are listed in the Appendix A together with the experimental fatigue life.
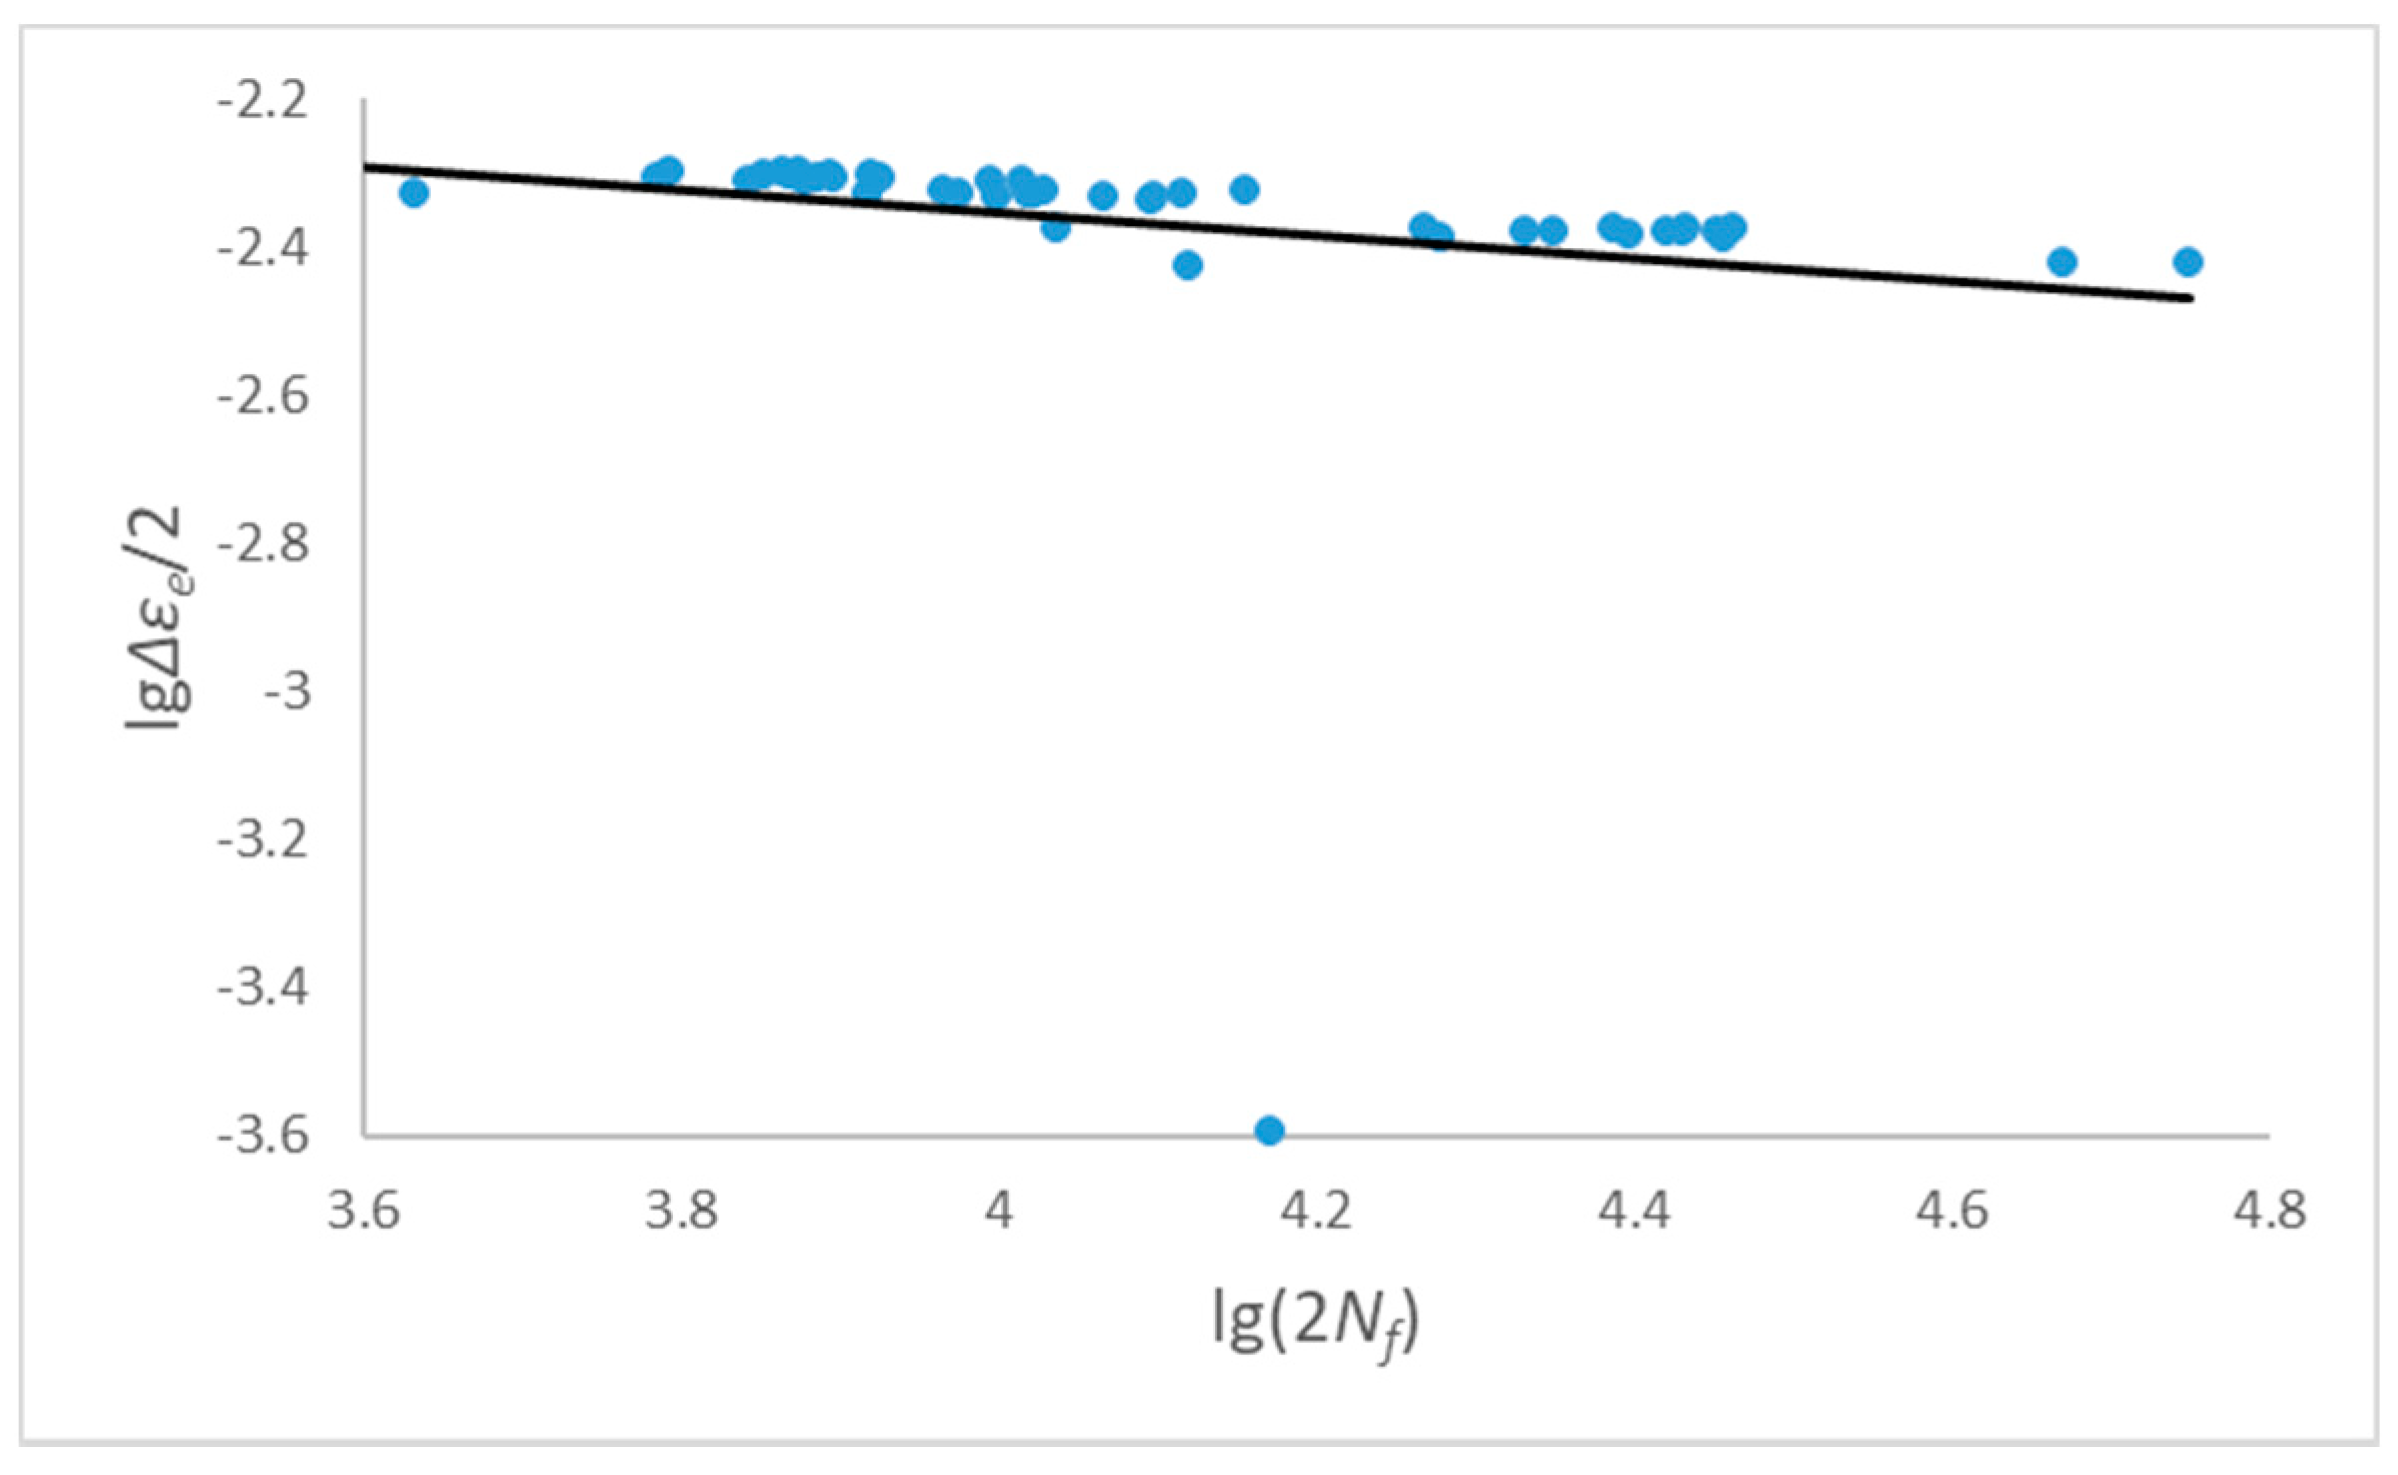
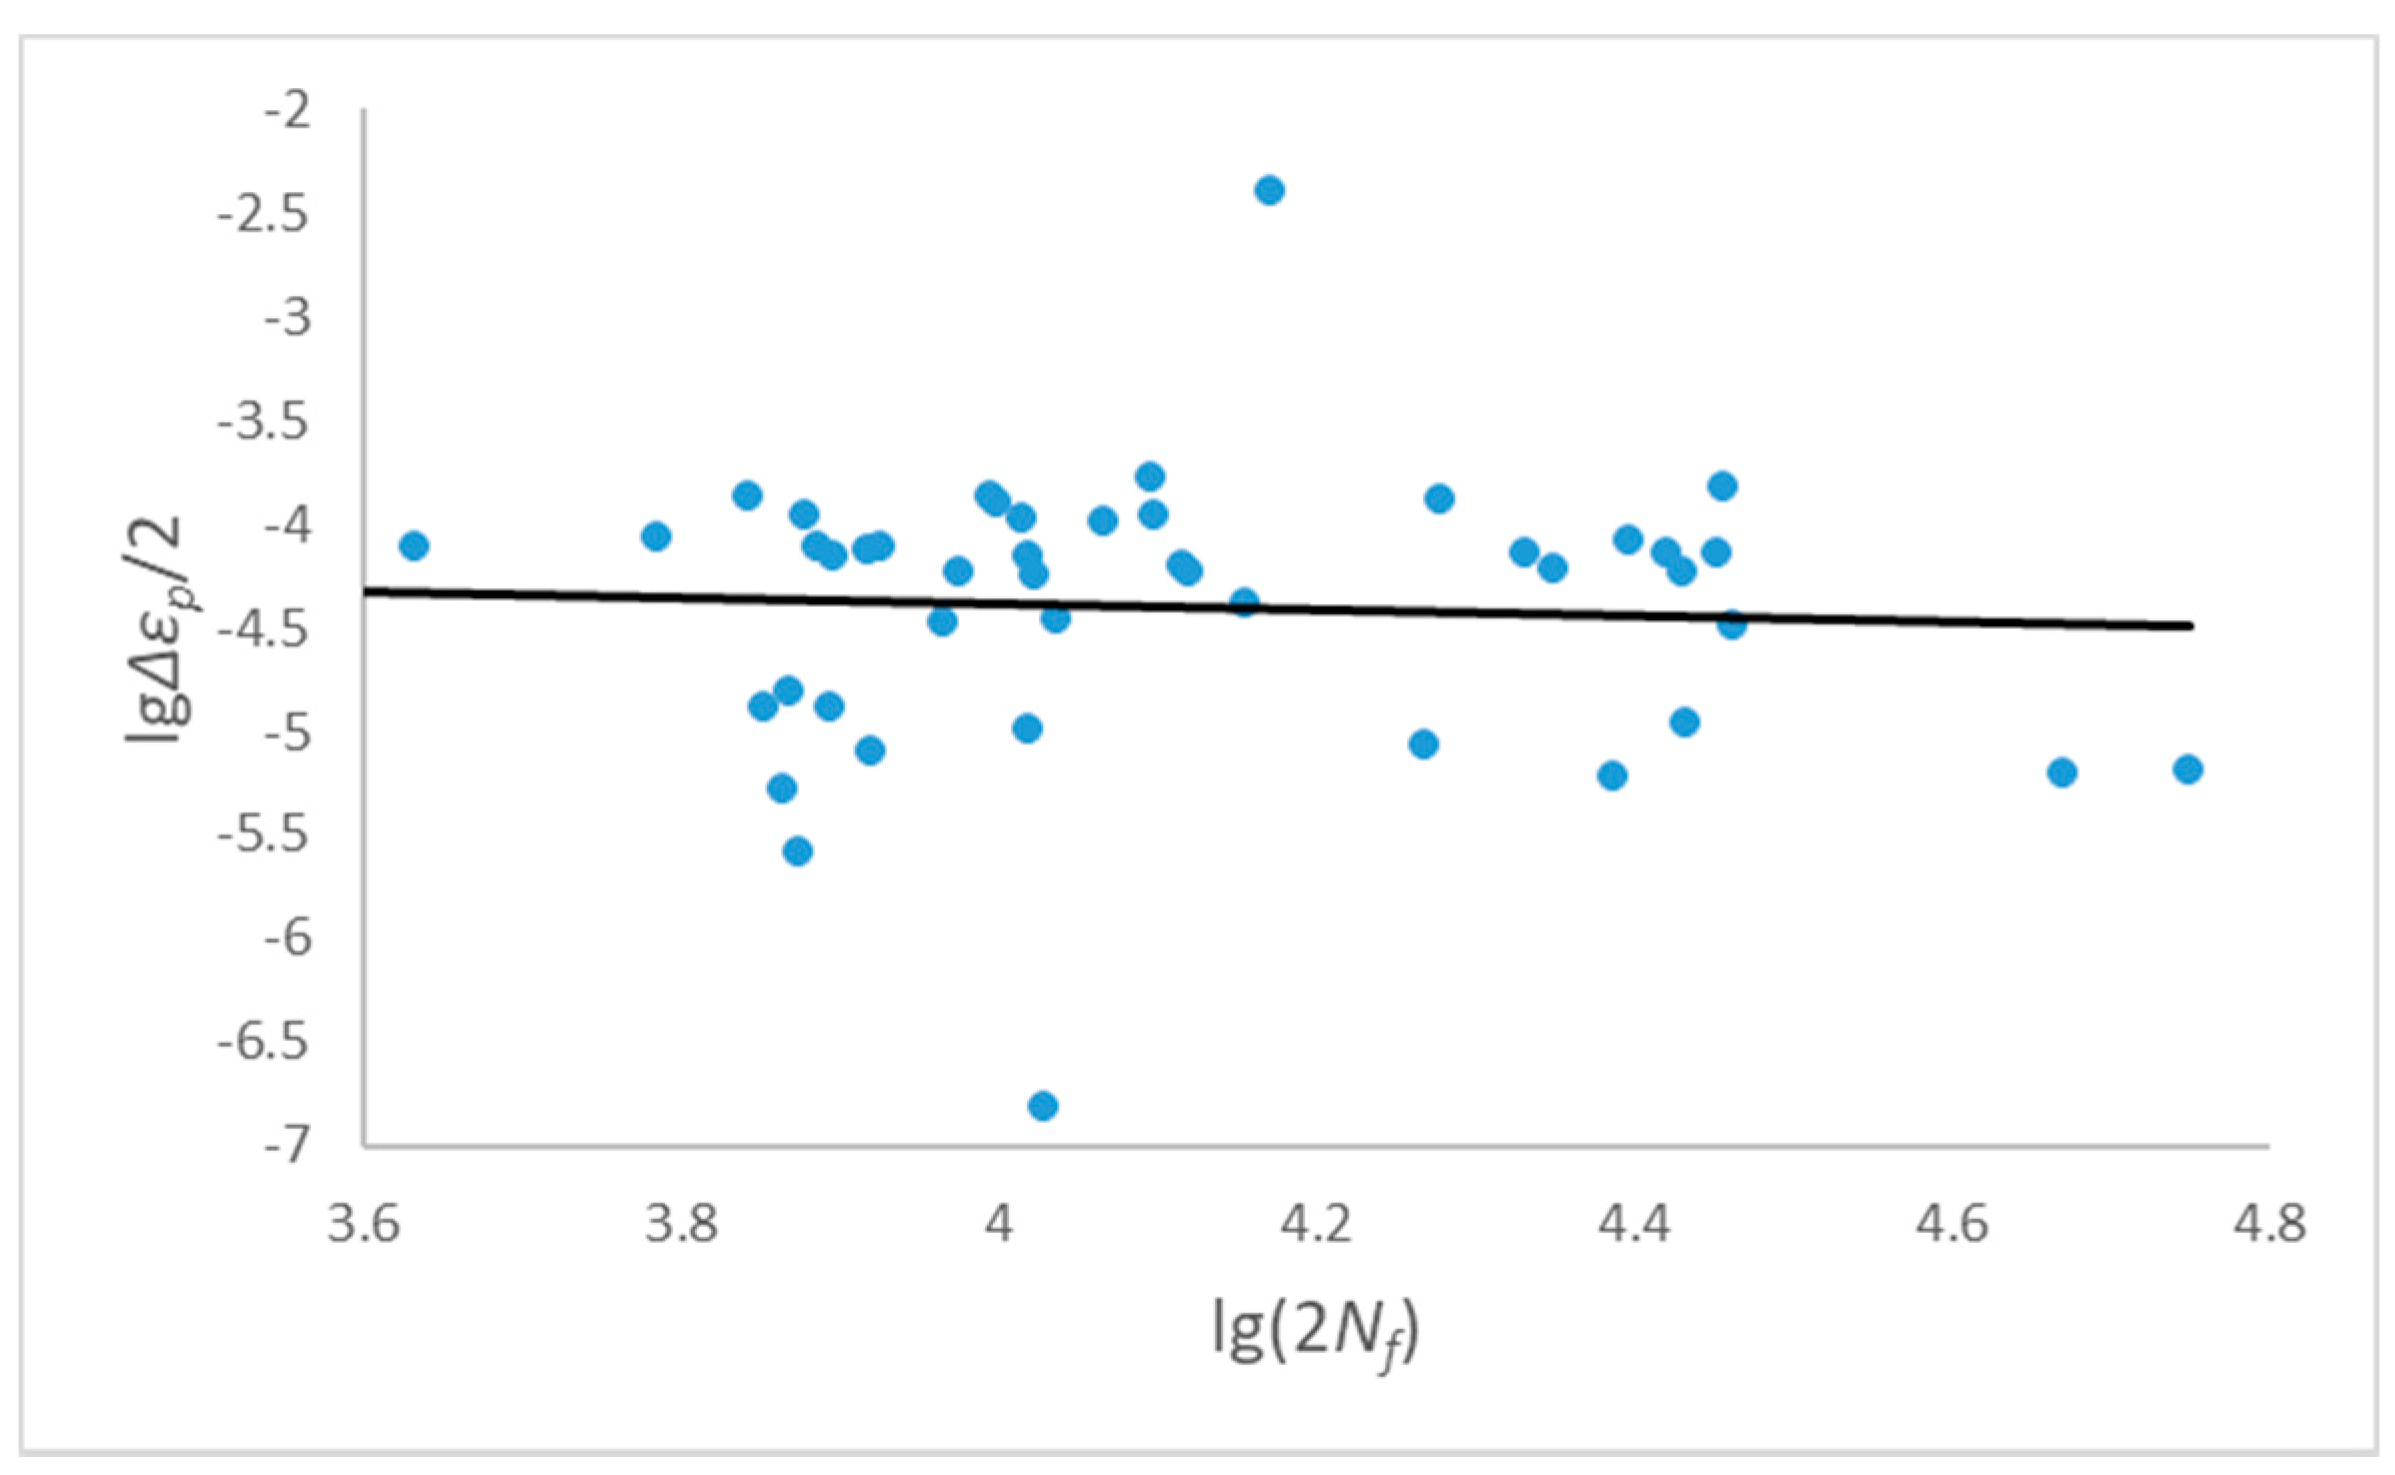
It was observed that in the axial strain fatigue test of FGH96 from the calculated strain amplitude data, the elastic strain amplitude is approximately equal to the total strain amplitude, while the plastic strain amplitude is very small. The plastic strain amplitude of some experimental specimens is negative by assessment. This may come from that the plastic strain itself is very small and is overwhelmed by test errors and calculation errors. The specimens with negative plastic strain amplitude were eliminated, then the logarithm of the elastic strain amplitude εe, plastic strain amplitude εp and the inverse number 2Nf were taken, and the parameters of Manson-coffin were obtained by linear fitting according to the least squares method as shown in Figure 1 and Figure 2. The following Table 2 is the result of data fitting.
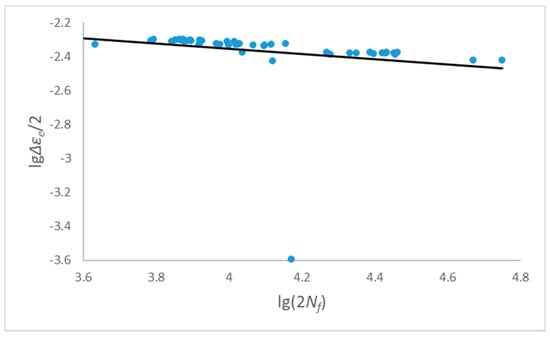
Figure 1.
Fitting of elastic parameters when R = 0.05.
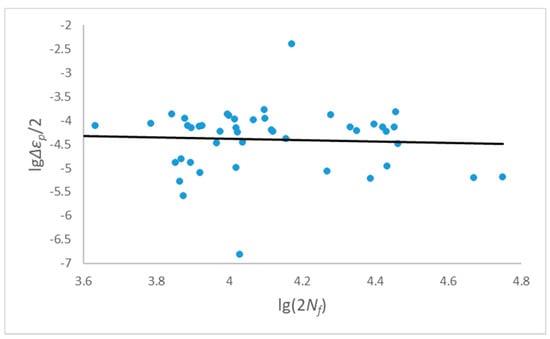
Figure 2.
Fitting of plastic parameters when R = 0.05.
Table 2.
Parameter fitting results under 530 °C experimental conditions.
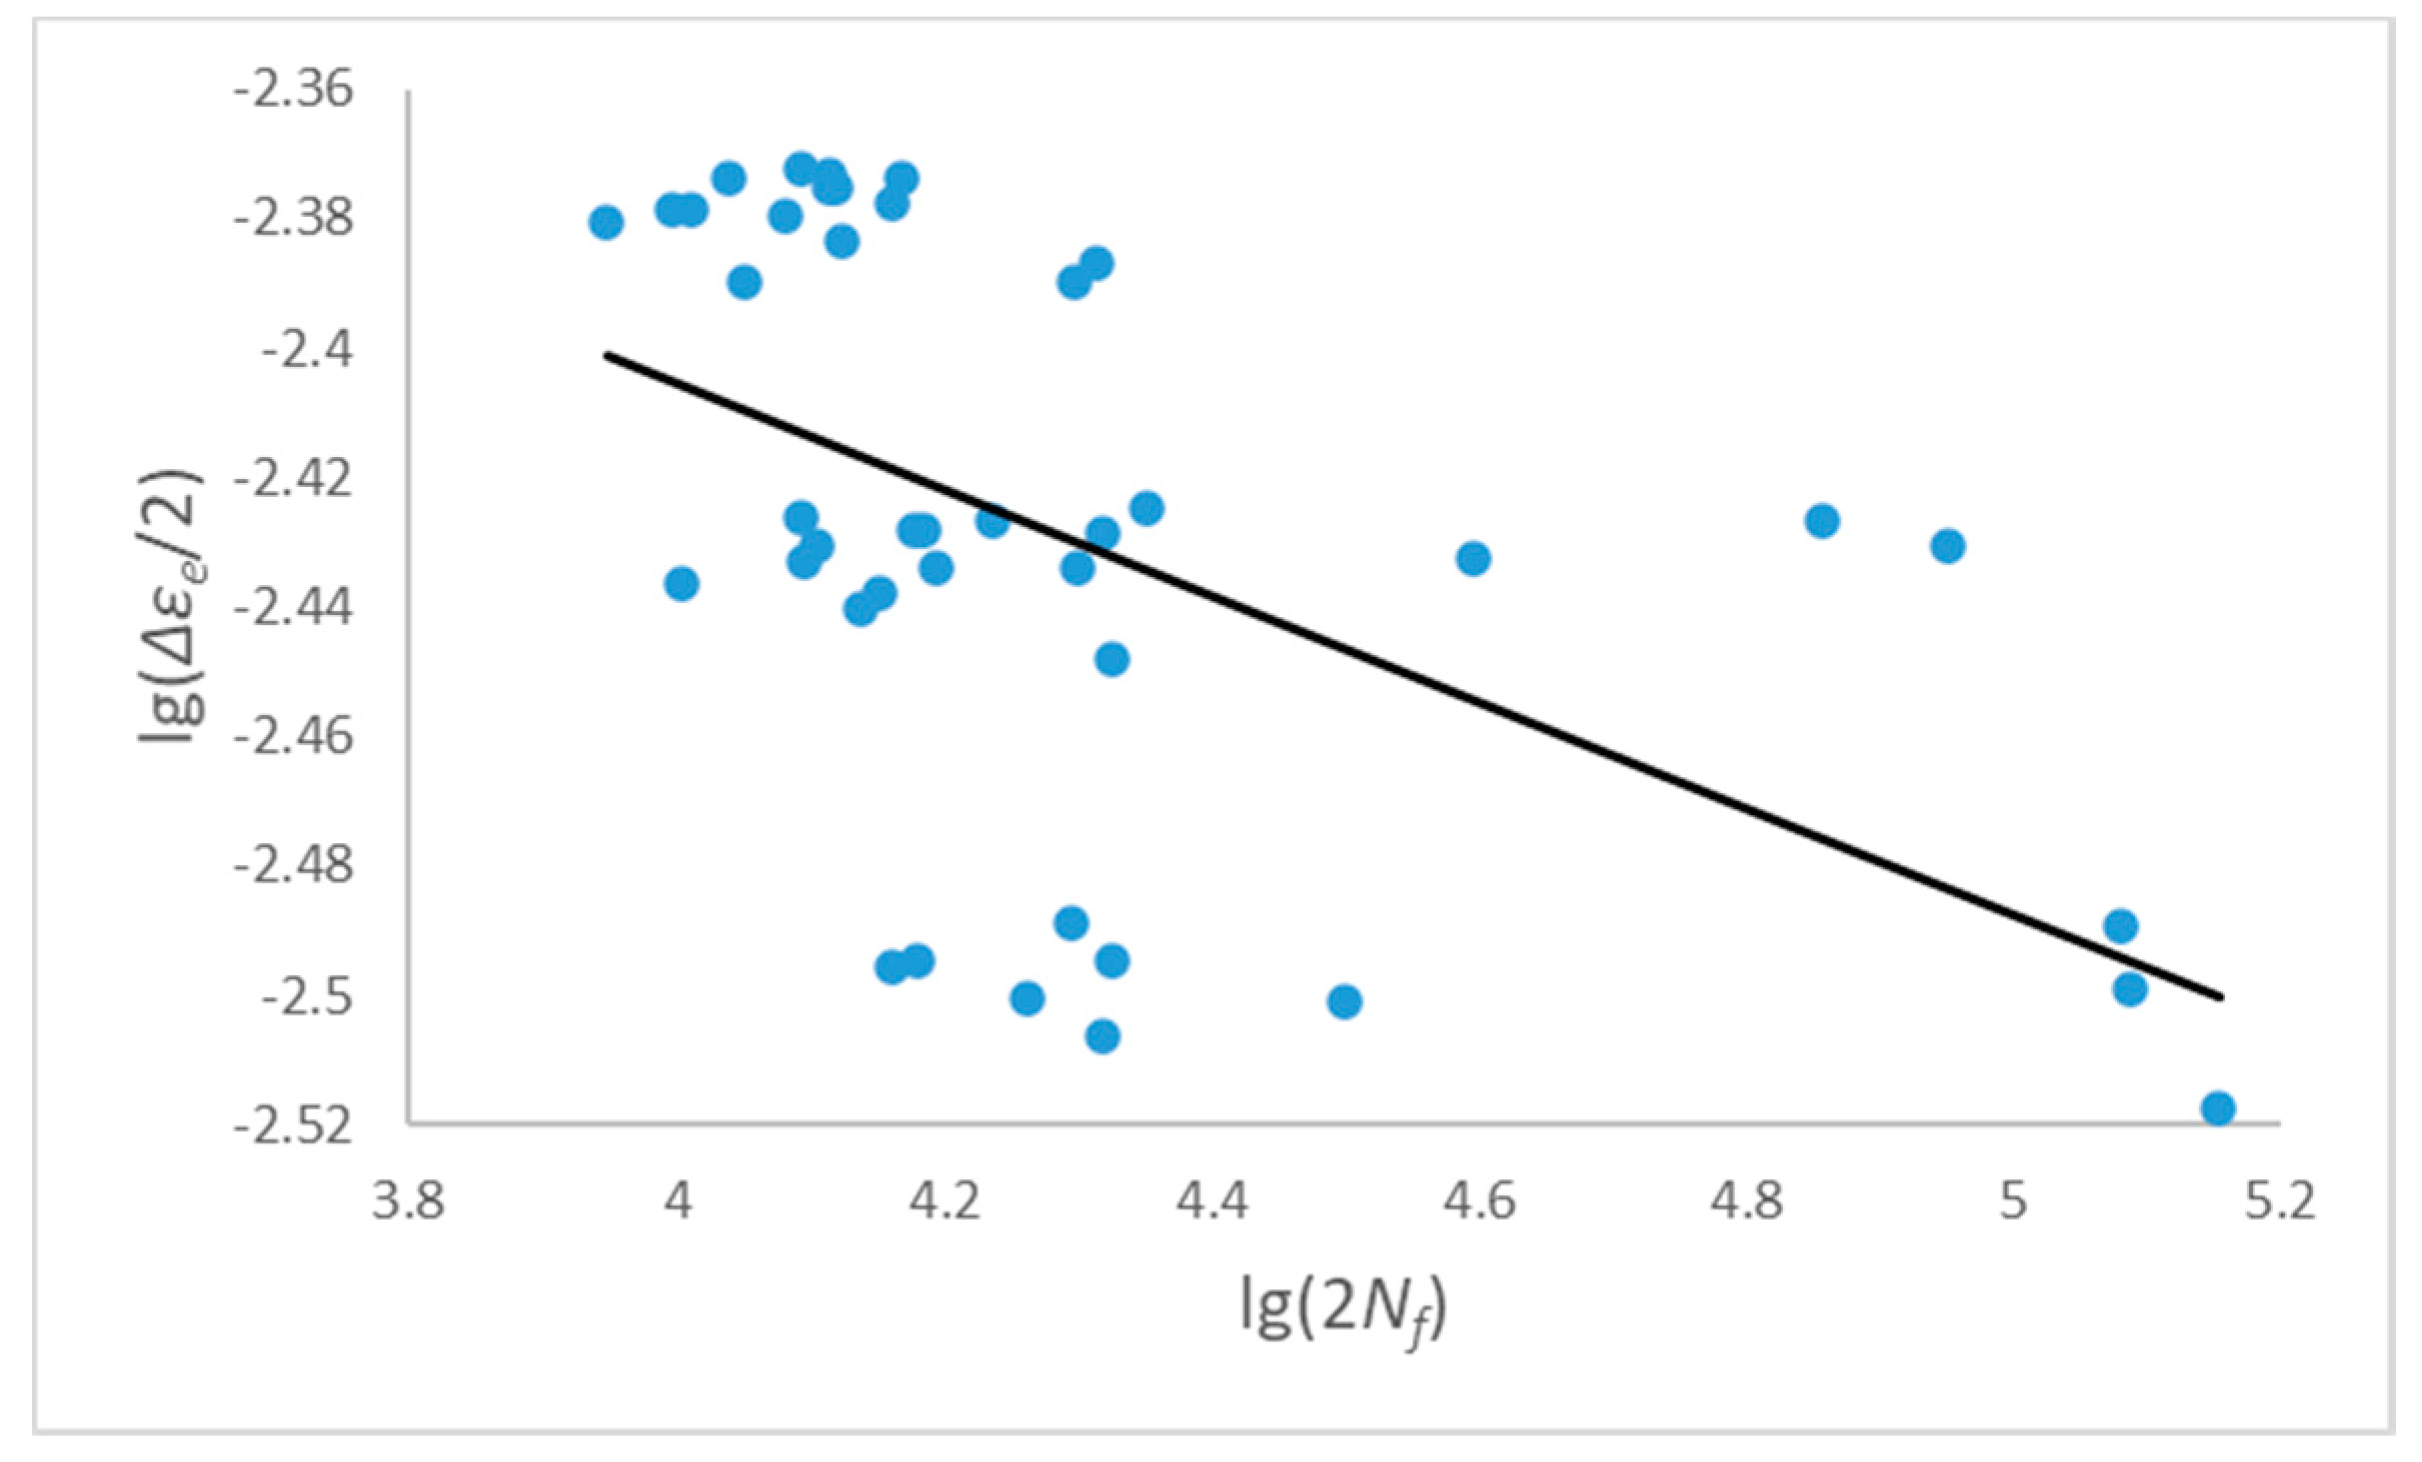
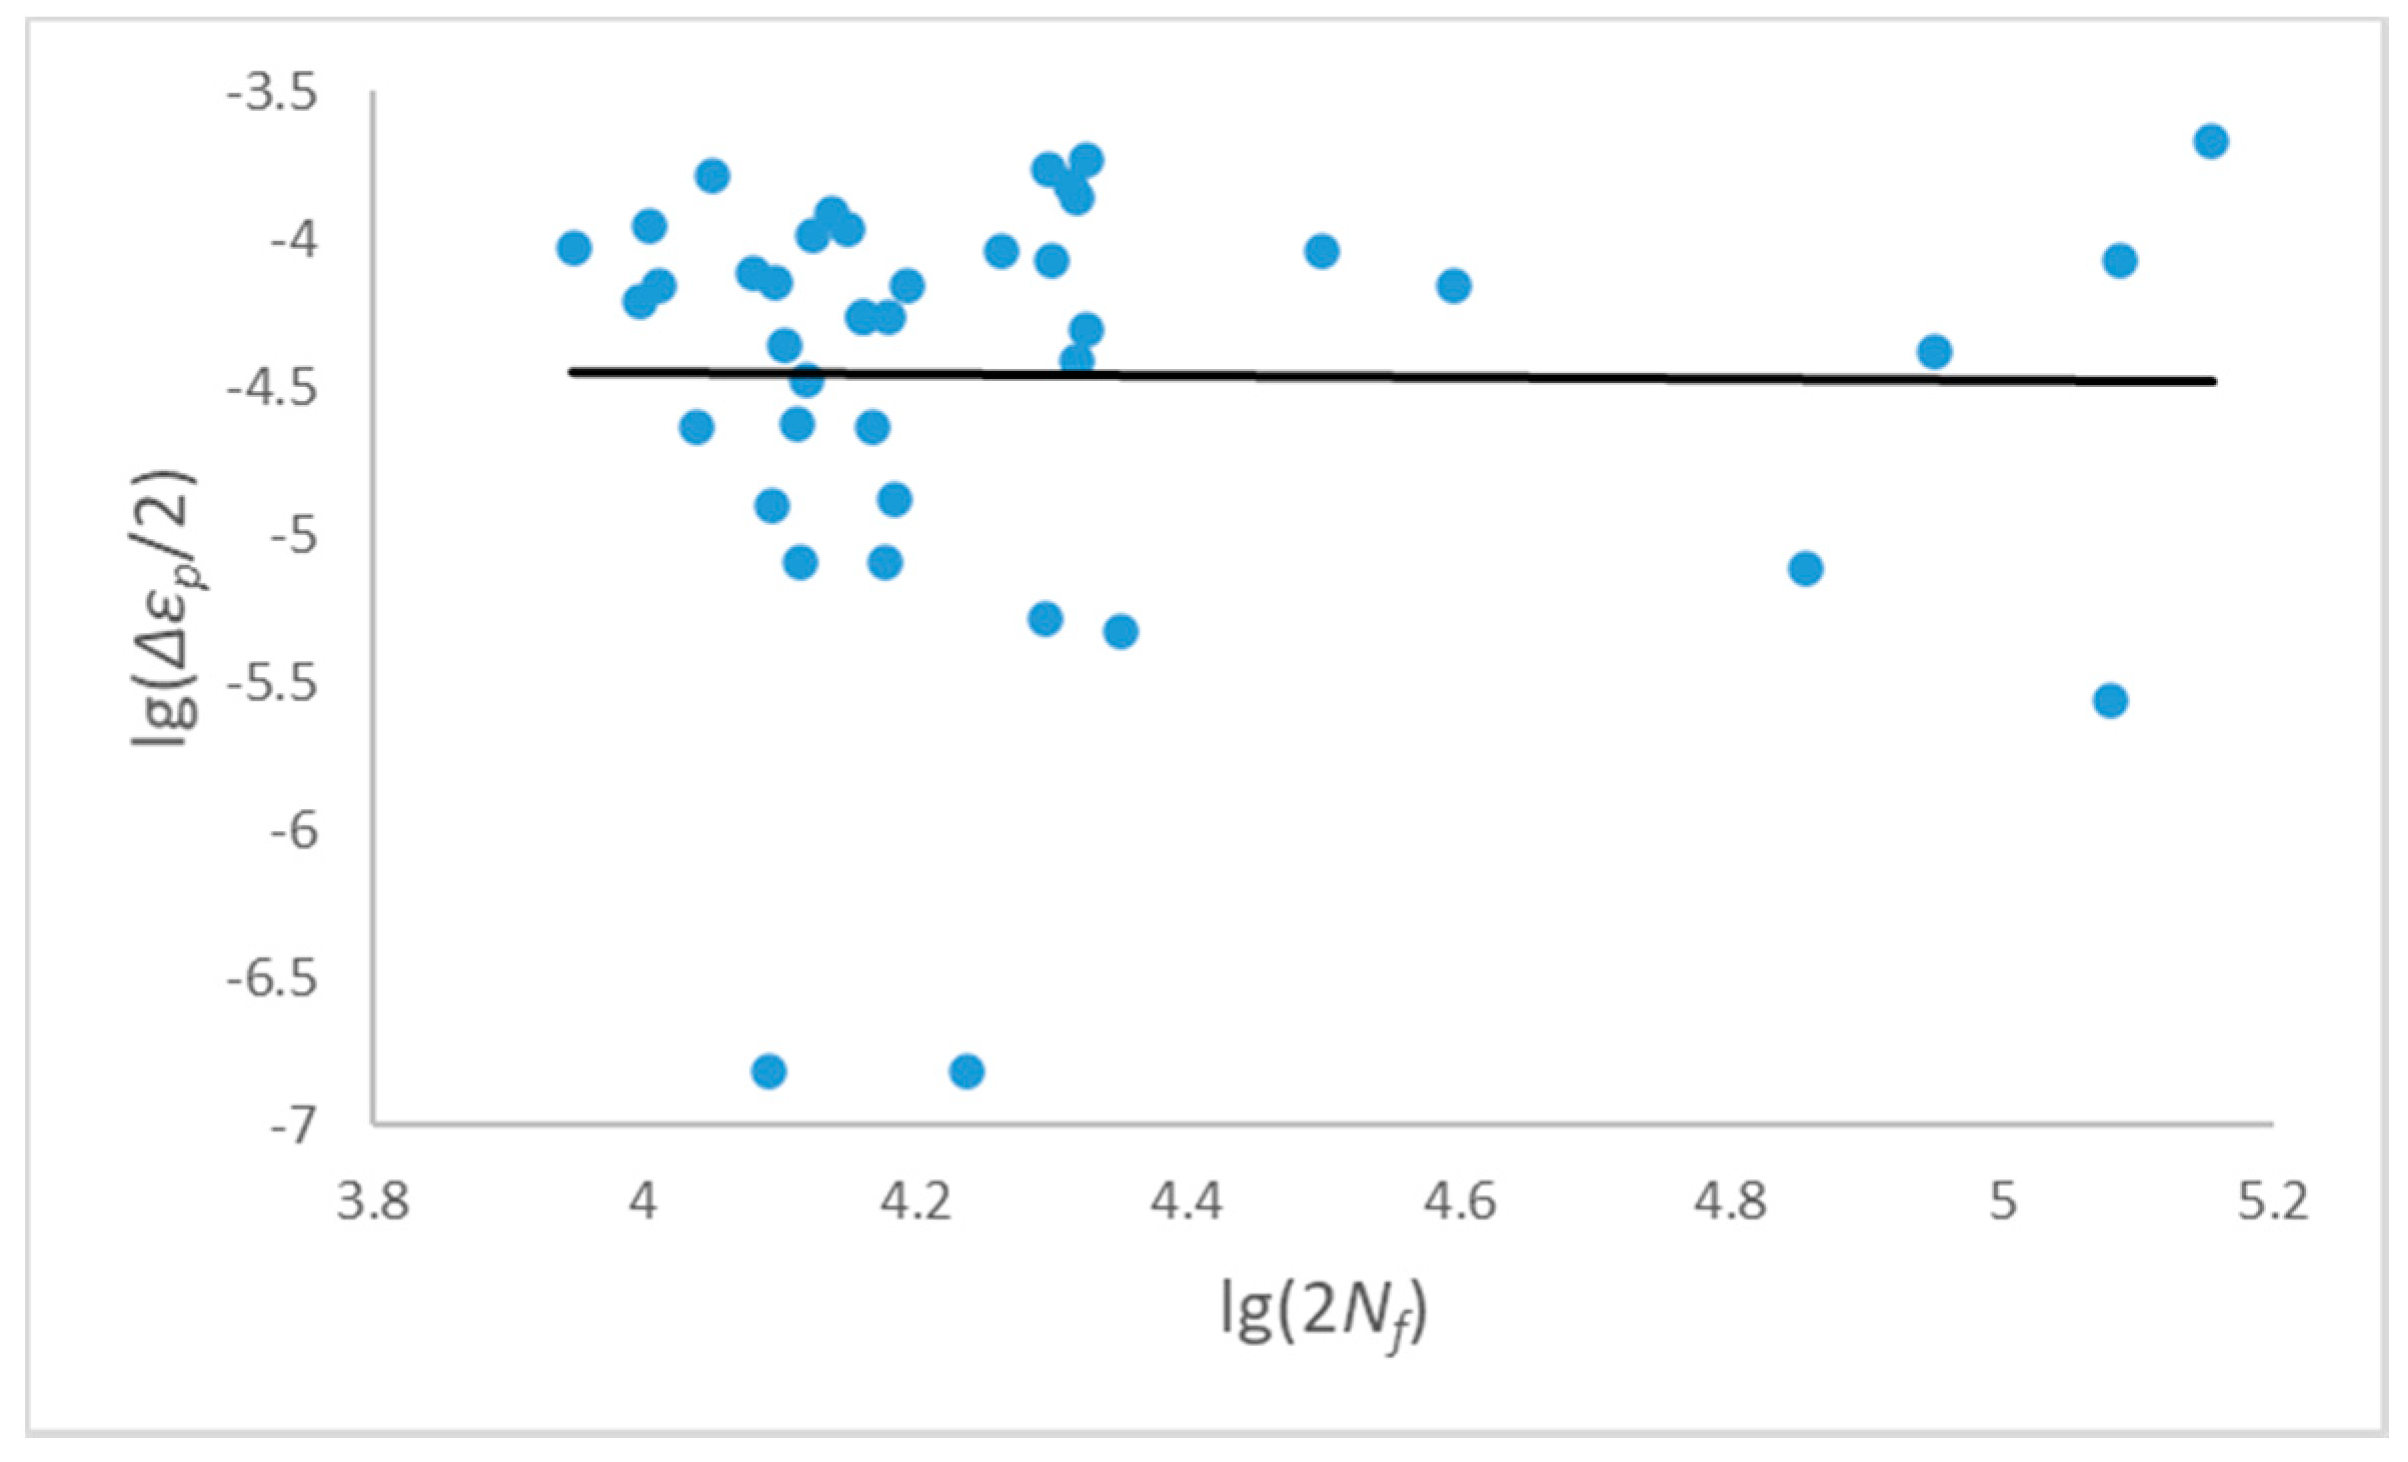
The experimental strain amplitude data at 600 °C are listed in the Appendix B together with the experimental fatigue life. Similarly, the uniaxial strain fatigue data of the smooth non-destructive FGH96 specimen at 600 °C were also fitted as shown in Figure 3 and Figure 4, with experimental conditions and fitting results summarized in Table 3 and Table 4 respectively.
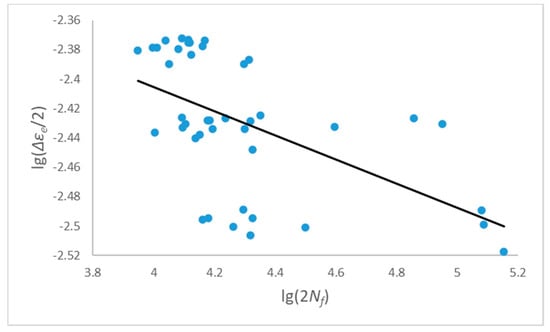
Figure 3.
Fitting of elastic parameters when R = 0.2.

Figure 4.
Fitting of plastic parameters when R = 0.2.
Table 3.
Experimental conditions at 600 °C.
Table 4.
Parameter fitting results under 600 °C test conditions.
It can be seen from the parameter fitting diagrams above that the experimental data with strain ratio R = 0.05 have obviously better regressions than those with strain ratio R = 0.2, and the parameters obtained by fitting are more accurate. It is also noted that both good regressions can be achieved in the elastic strain amplitudes for R = 0.05 and R = 0.2, whereas the corresponding regression in the plastic strain amplitude is rather poor. The parameters of the plastic part were suspected to be the main source of error for the fatigue life prediction model.
The fatigue life prediction model based on Manson-Coffin equation can be obtained by introducing the data fitting parameters into Equation (2). When R = 0.05, the fatigue life prediction model is:
Whereas when R = 0.2, the fatigue life prediction model is:
3.2. Applicability Analysis of Manson-Coffin Model
In order to verify the applicability of fatigue life prediction model based on the Manson-Coffin equation to low-cycle fatigue life of powder superalloy containing powder inclusions, 15 experimental specimens with strain ratio R = 0.05 were selected for fatigue life prediction, and the resulted predicted life values was compared with those tested life. Table 5 lists these 15 selected experimental data and predicted life where specimens take with strain ranges of 0.95%, 0.85% and 0.76%, each in fact accounted for one-third respectively. The inclusion types and sizes are also listed in the table. By introducing the strain amplitude of the selected specimen into Equation (12), the predicted fatigue life of the specimen under this load condition can be calculated and assessed by error percentage to corresponding experimental life.
Table 5.
Fatigue life prediction results of selected fifteen specimens.
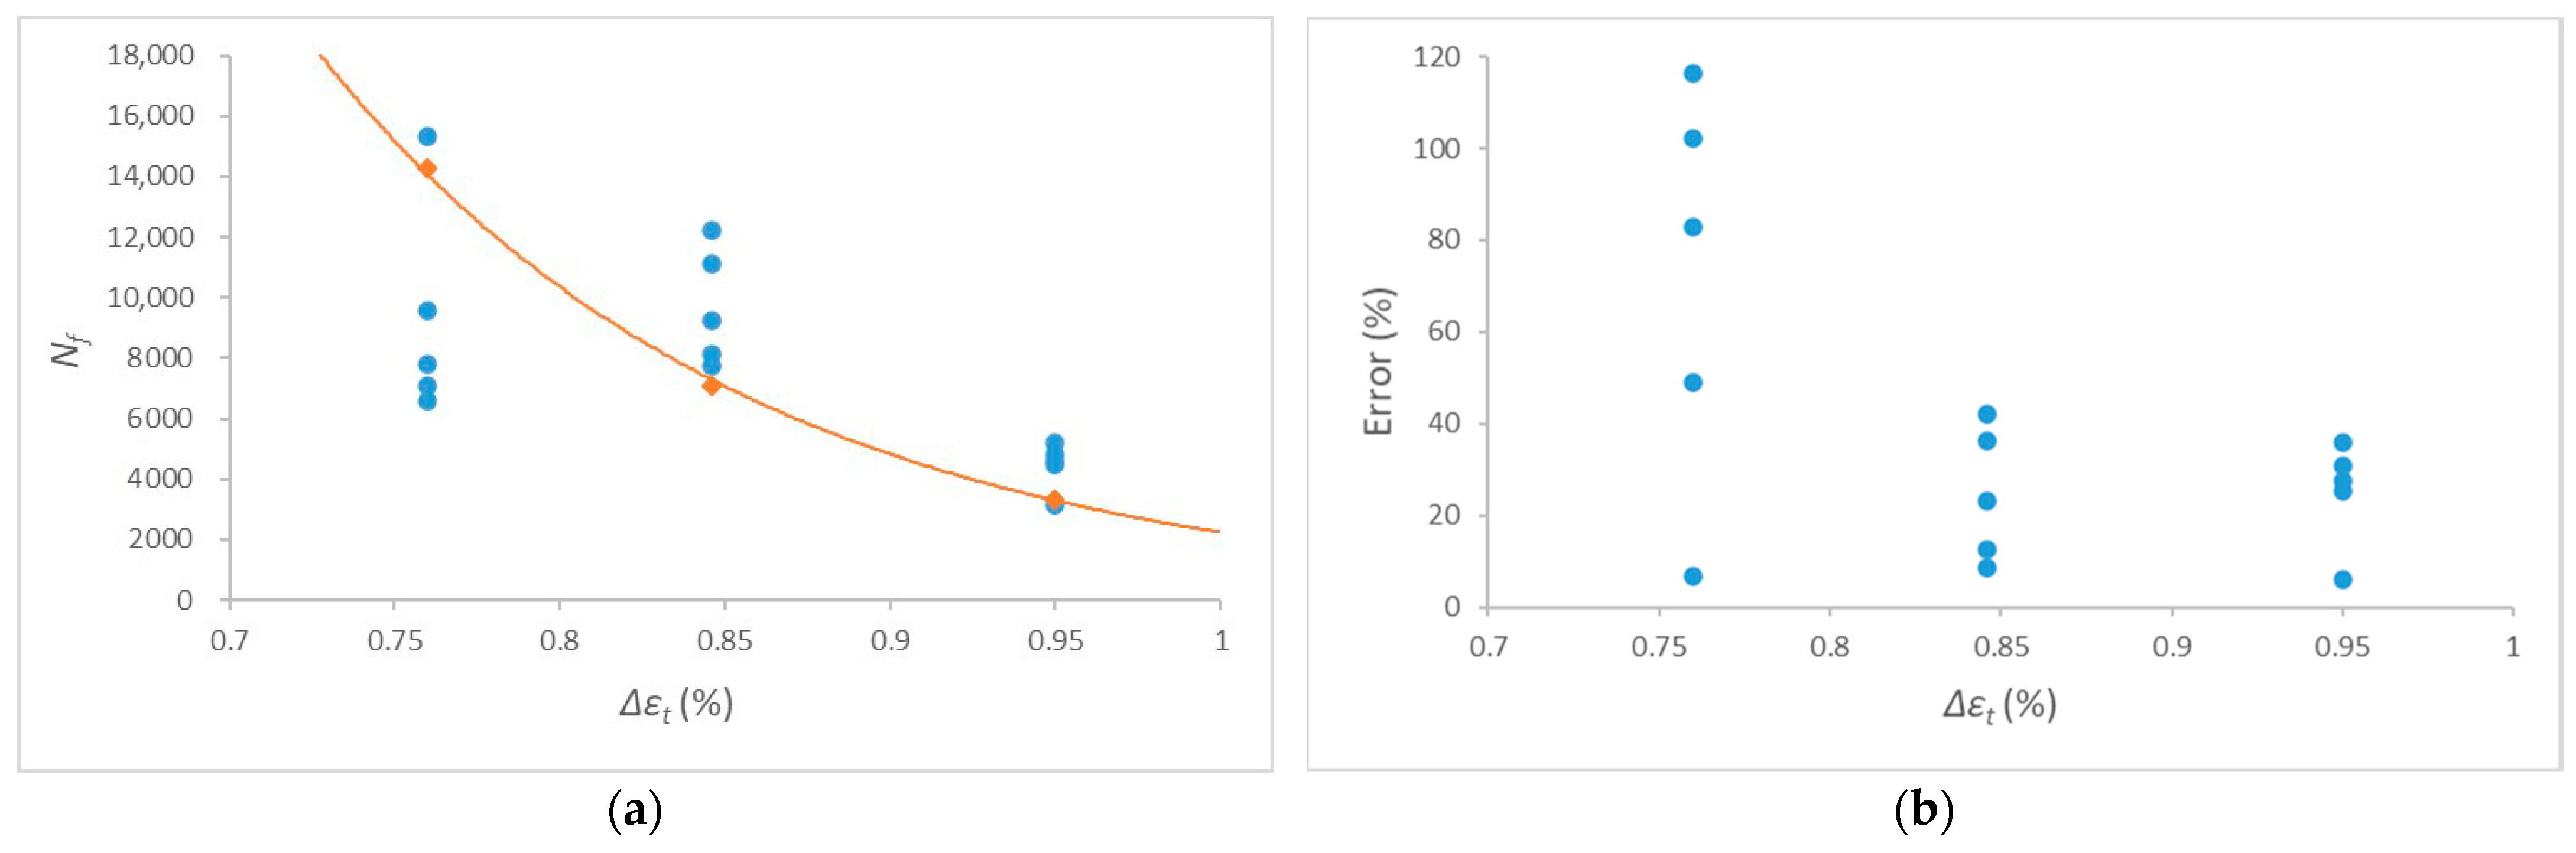
The curve shown in Figure 5a is the fatigue life prediction curve with strain ratio R = 0.05 by Manson-Coffin method, where small triangle marks are those experimental life of the selected specimens. Figure 5b gives the fatigue life errors predicted by the Manson-Coffin model compared with the corresponding experimental life at designed three strain ranges of 0.95, 0.846 and 0.76%.
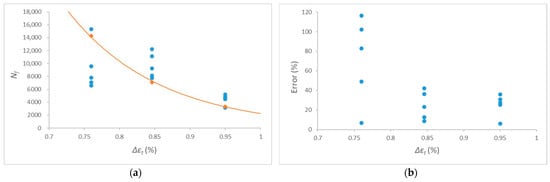
Figure 5.
Fatigue life prediction results of selected specimens: (a) Fatigue life prediction curve (b) Fatigue life prediction error.
It can be seen from Table 5 and Figure 5 that fatigue life of the powder superalloy predicted by Manson-Coffin theoretical model has relatively large error with the experimental life in many cases. The tendency reveals that the smaller the strain amplitude of the specimen, the larger the fatigue life error predicted by the model. It is believed through analysis that this is mainly due to the characteristics of high strength and low plasticity of powder superalloy FGH96. When the load displacement is small, the strain amplitude of the specimen is mainly concentrated on the elastic strain, which leads to extremely small plastic strain of the specimen. However, the error in calculating the plastic strain amplitude increases when using Manson-Coffin method, which magnifies the calculated error of the plastic part in the fatigue life prediction, thus the increased deviation prediction result may be produced, which is unreasonable.
4. Prediction Model Based on Damage Mechanics
4.1. Establishment of Life Prediction Model Based on Damage Mechanics
There is only one strain component in the load direction in the uniaxial strain fatigue test of the smooth non-destructive specimen, so the damage characterization parameter Y can be reduced to:
The damage evolution equation under uniaxial strain fatigue test can be obtained by substituting Equation (14) into Equation (9):
The linear relationship between fatigue life N and strain εmax can be obtained by integrating Equation (15) in the load history and taking logarithm at both ends:
where the constant .
It is obviously from Equation (16) that, the unknown damage parameters a and m can be fitted by using the uniaxial strain fatigue test data of the smooth non-destructive standard specimen under specific conditions, and then the damage mechanics fatigue life prediction model under the corresponding conditions can be established.
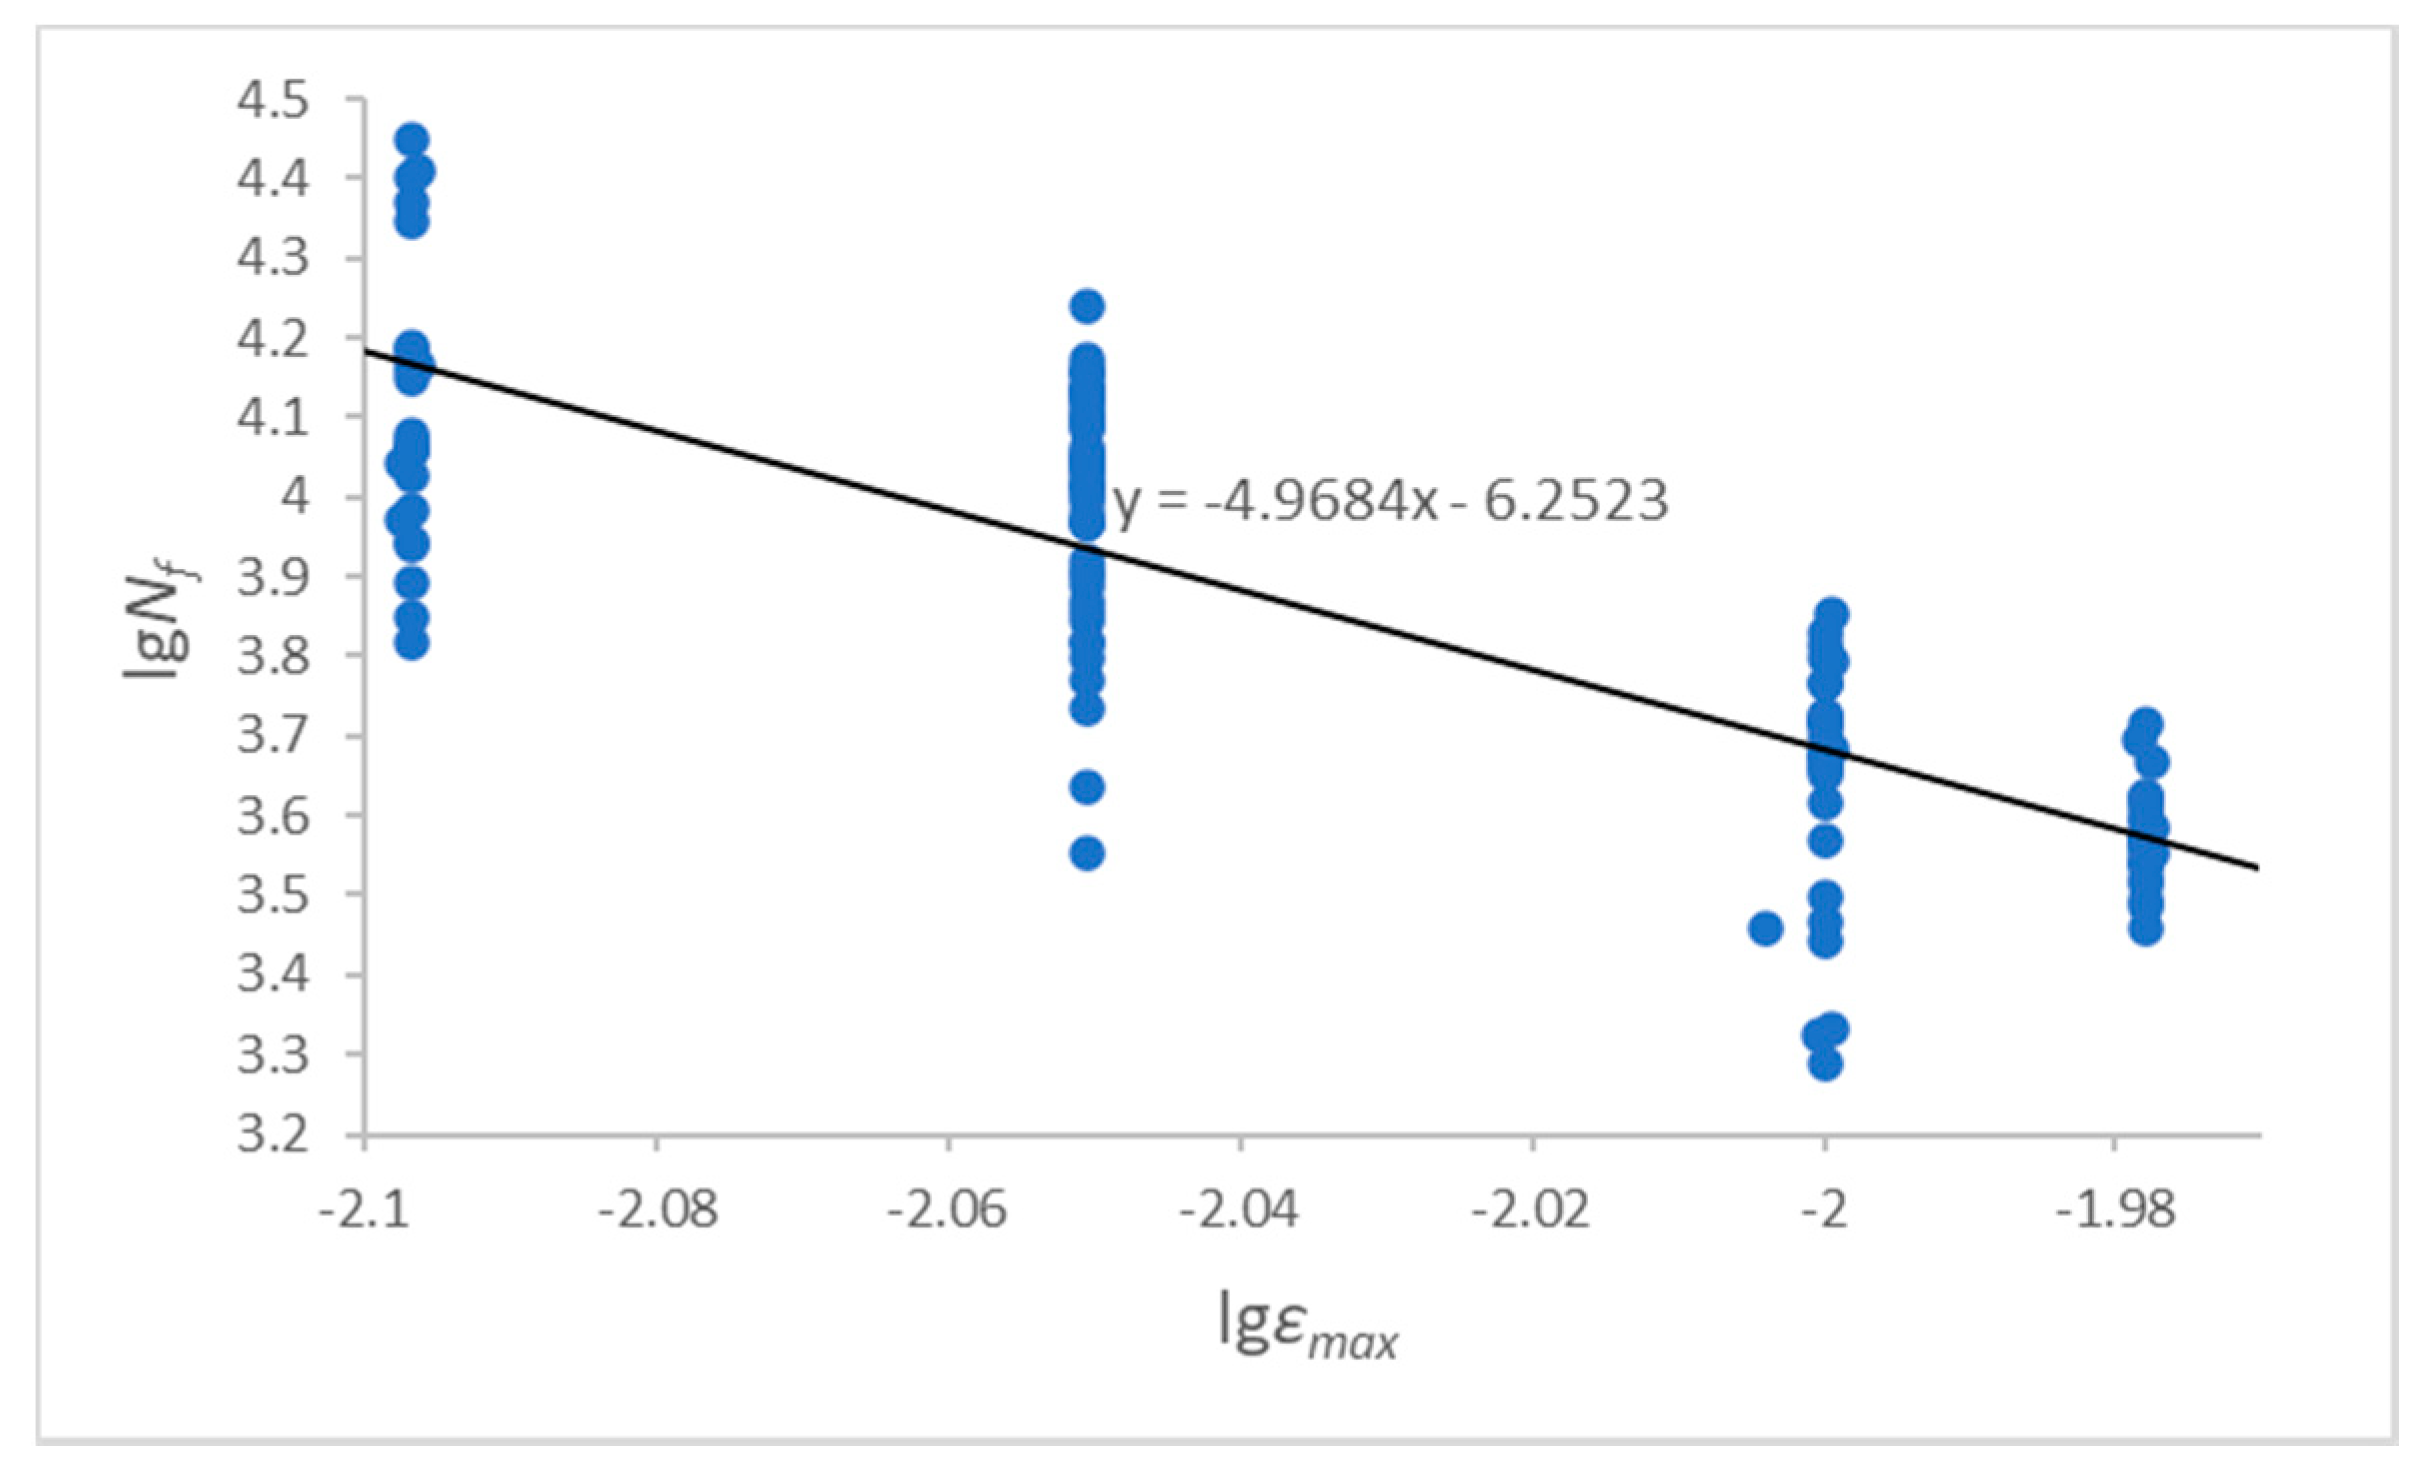
The damage parameters under corresponding conditions can be obtained as shown in Figure 6 by using program to fit the uniaxial strain fatigue experimental data of the smooth non-destructive FGH96 specimen with a temperature of 530 °C and a strain ratio of 0.05, which are listed in the Appendix A.
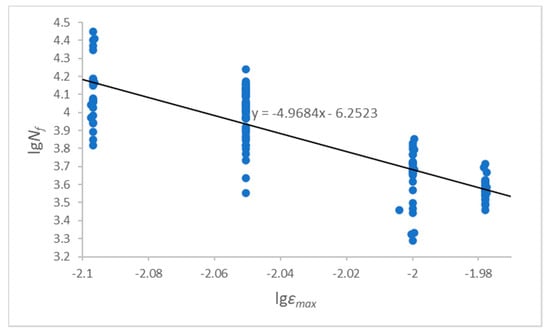
Figure 6.
Fitting of damage parameters when R = 0.05.
From the fitting result, when R = 0.05, m = 4.9684 and lgC = −6.2523;
According to the definition of cyclic load characteristic value:
Substituting the value into , and a = 8.1966 × 10⁻⁷ is calculated.
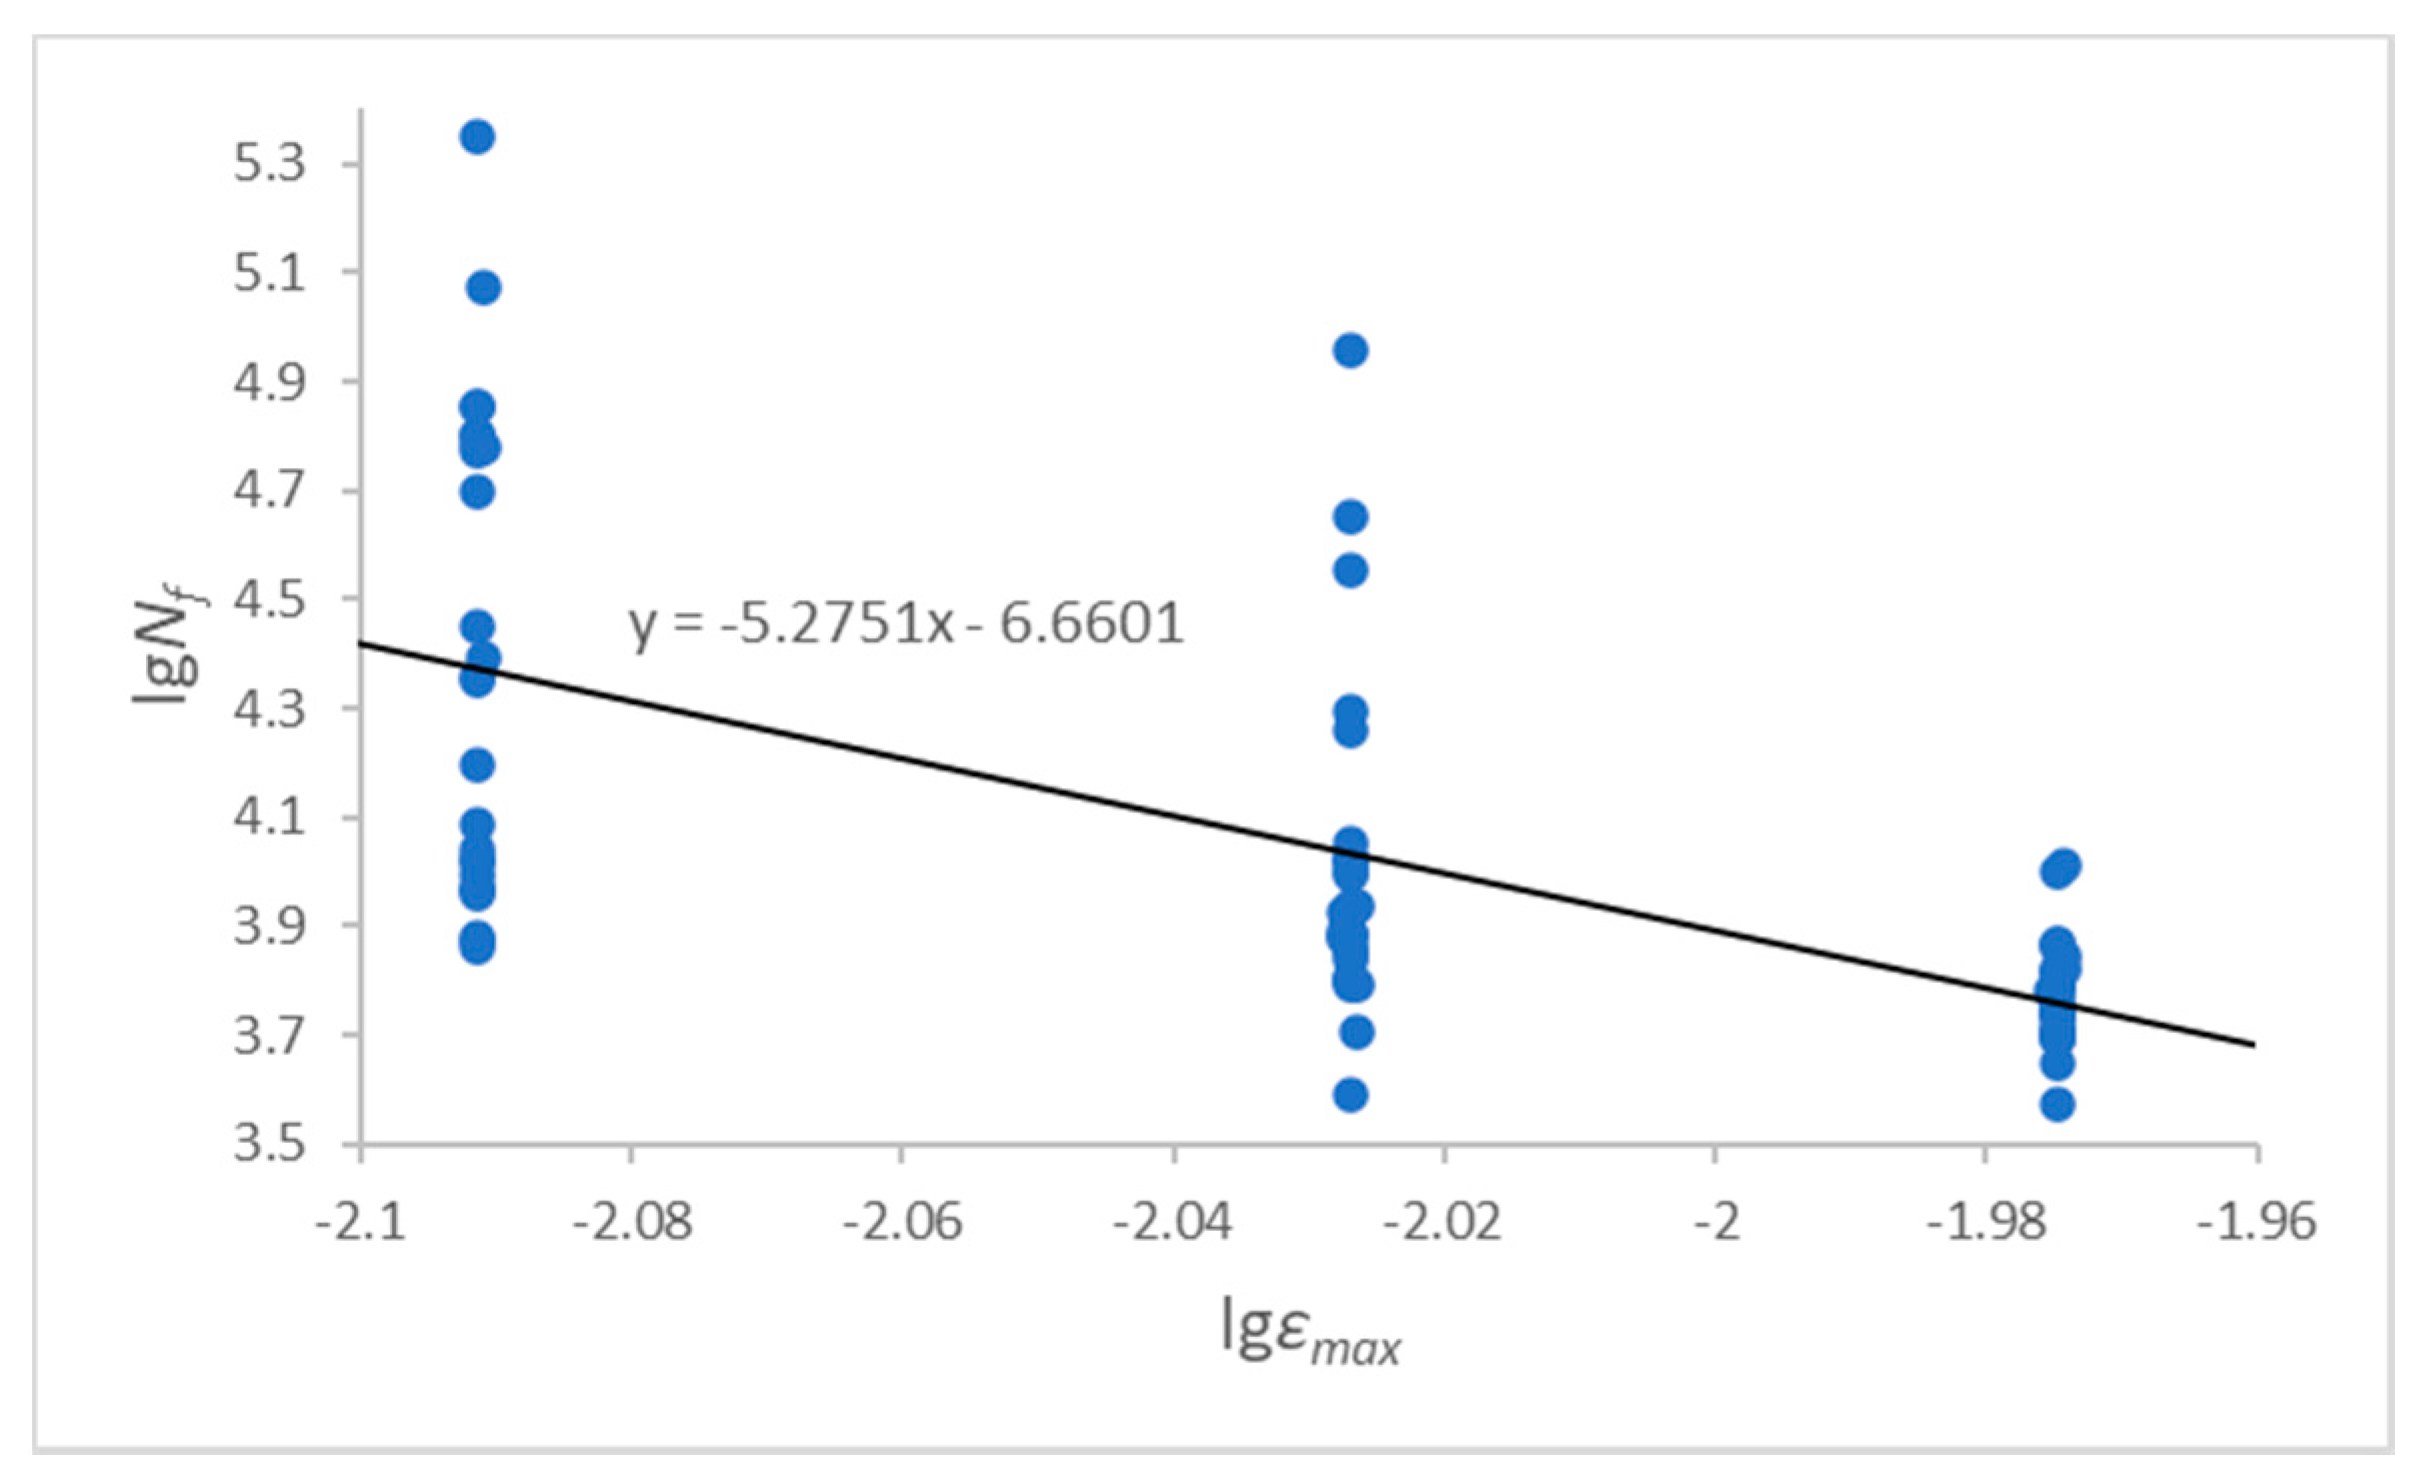
In the same way, the experimental data with a temperature of 600 °C and a strain ratio of 0.2 were fitted, shown in Figure 7, and the damage parameters were calculated.
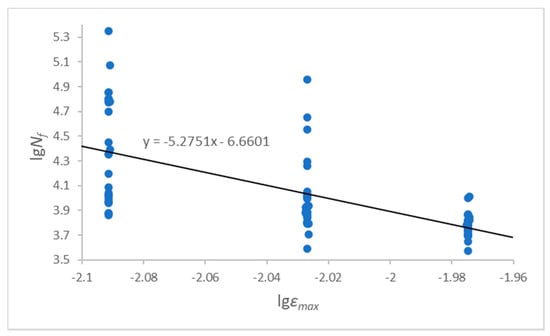
Figure 7.
Fitting of damage parameters when R = 0.2.
According to the fitting calculation, m = 5.2751, lgC = −6.6601; K≈1, a = 3.6295× 10⁻⁷.
4.2. Applicability Analysis of Model Based on Damage Mechanics
The life prediction of both smooth non-destructive standard specimen and specimen with inclusion was carried out in this section by using the damage mechanics method, and the applicability of the damage mechanics model is verified by comparing with the experimental life.
The relationship between fatigue life and damage characterization parameter Y can be obtained by integrating Equation (9) in the damage interval (D = 0–1):
The fatigue life prediction models under different strain ratios can be obtained by incorporating he damage parameters a and m in the previous section into Equation (18).
When R = 0.05,
When R = 0.2,
4.2.1. Life Prediction of Standard Parts without Inclusions
It can be seen from Equation (14) that when the specimen is subjected to uniaxial fatigue load:
The fatigue life prediction model of smooth specimen without inclusions can be obtained by incorporating Equation (21) into Equations (19) and (20) respectively.
When R = 0.05,
When R = 0.2,
The corresponding fatigue life can be obtained by substituting the strain ratio R and the strain amplitude Δε into the above formula.
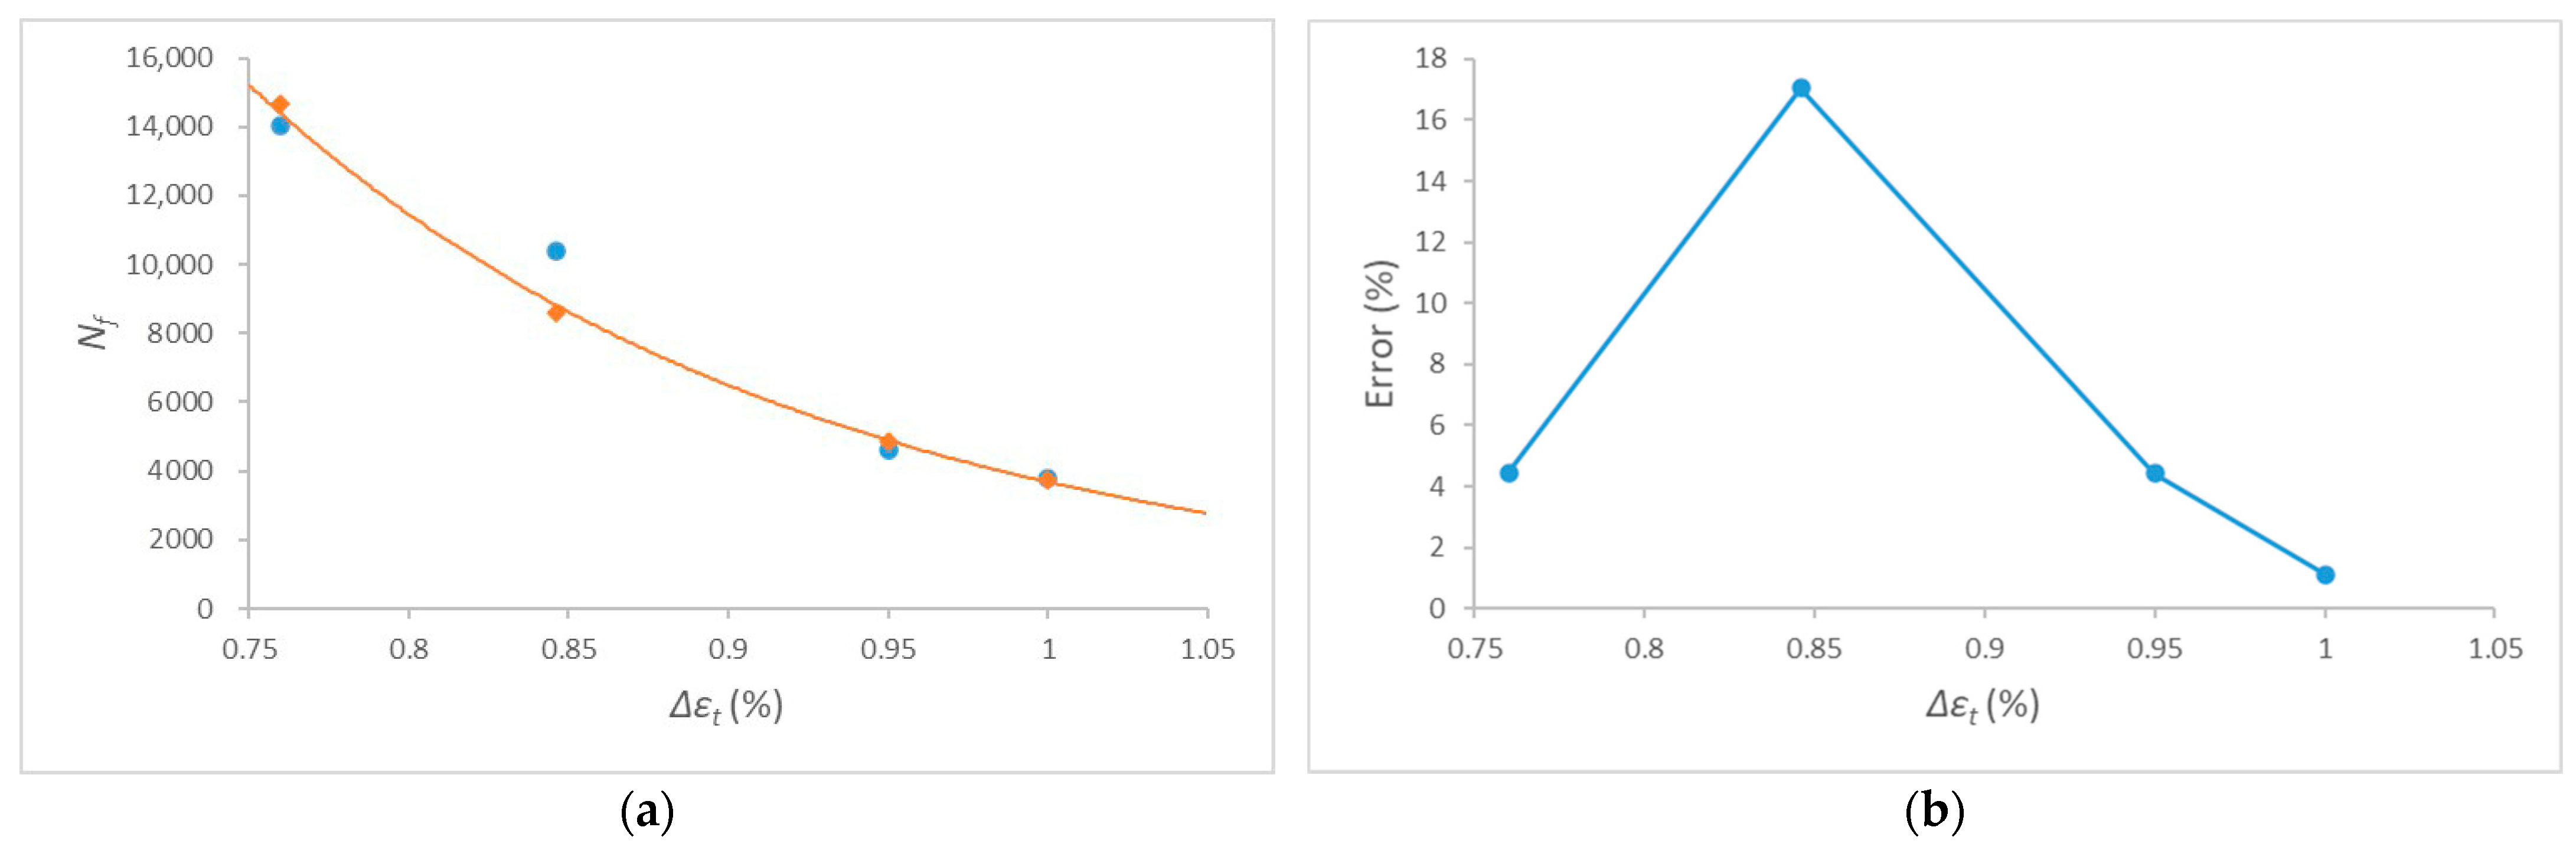
The life of selected experimental specimens with a strain ratio of R = 0.05 and strain ranges of 0.76%, 0.85%, 0.95% and 1% were predicted by using the formula, and the results were compared with the corresponding experimental life, as shown in Figure 8a, with the error shown in Figure 8b.
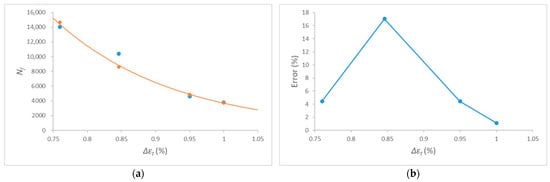
Figure 8.
Life prediction of non-destructive specimens with R = 0.05: (a) Fatigue life prediction curve (b) Fatigue life prediction error.
It obviously showed a good applicability to powder superalloy specimens without inclusion from Table 6 when R = 0.05, and the fatigue life prediction error can be controlled within 20%.
Table 6.
Life prediction of non-destructive specimens with R = 0.05.
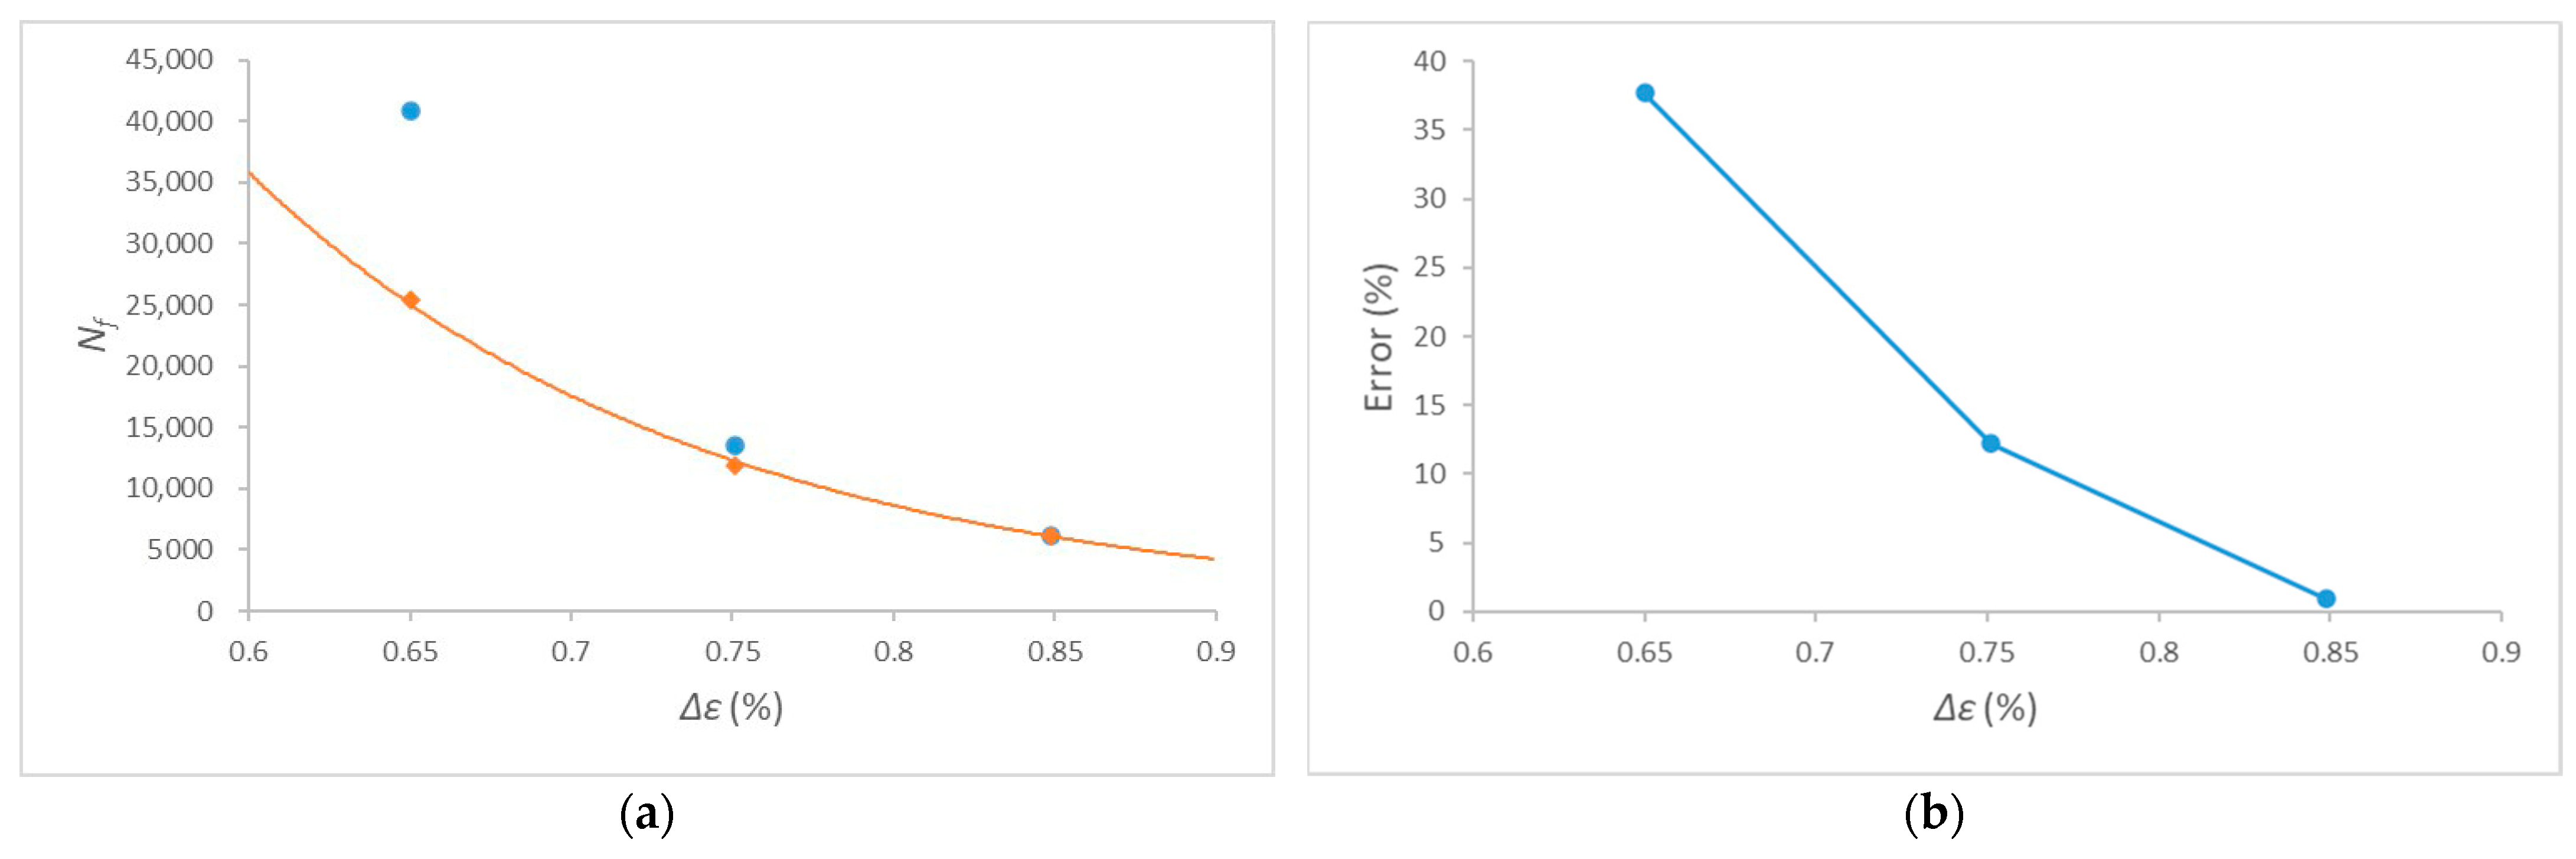
Similarly, the life of selected experimental specimens with a strain ratio of R = 0.2 and different strain ranges were predicted and compared as shown in Figure 9 and Table 7.
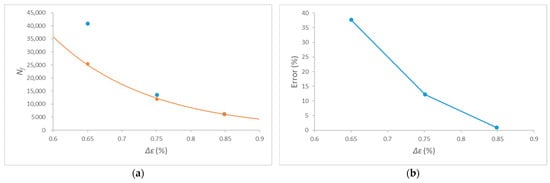
Figure 9.
Life prediction of non-destructive specimens with R = 0.2: (a) Fatigue life prediction curve (b) Fatigue life prediction error.
Table 7.
Life prediction of non-destructive specimens with R = 0.2.
Under the experimental conditions of strain ratio R = 0.2 and strain range of 0.751 and 0.849%, the fatigue life prediction model of damage mechanics has also good applicability, and the prediction errors can be controlled within 15%. However, 37.9% of the prediction error exists when the strain range is 0.65%, which is relatively large. It is found from experimental data that the extremely large experimental fatigue life cycle of individual specimens under experimental conditions of strain ratio R = 0.2 and strain range 0.65%. For example, the experimental life of specimen B10 is more than 220,000, and that of specimen B17 is more than 110,000. These individual data increase the experimental life value, resulting in a relatively high error here. Once these individual data are eliminated, the damage mechanics fatigue life prediction model still has good applicability.
4.2.2. Life Prediction of Powder Superalloy Containing Inclusions
When inclusions exist in the powder superalloy, cracks often initiate inside or around the inclusions due to the inconsistency between the deformation of the inclusions and the matrix, the sharp shapes of inclusions and other reasons. The fatigue life calculated by the nominal stress-strain cannot reflect the local stress concentration caused by inclusions. Therefore, the degraded form of damage characterization parameter Y applied in Equation (17) is no longer suitable for fatigue life prediction of powder superalloy containing inclusions. It is indispensable to accurately calculate the damage characterization parameter Y by numerical calculation, then the fatigue life can be predicted.
In this paper, ANSYS APDL (ANSYS, Inc. (NASDAQ: ANSS), Canonsburg, PA, USA) is used for numerical calculation and the PLANE82 element in ANSYS APDL is applied in the modeling process, which is a 2D 8-node solid element. Each node allows translational displacement in X, Y, and Z directions. The element has good mesh adaptability and high accuracy even when hybrid grid is adopted.
In the process of finite element modeling, size parameters are set according to experimental data. In view of the fact that the vast majority of experimental specimens are equal cross-section cylinders with a diameter of 6 mm. Therefore, in the modeling process, the overall model is a 6 mm × 6 mm quadrilateral model, and symmetrical boundaries conditions are used to reduce the size of the model and increase the calculation speed.
Inclusions can be roughly divided into three shapes: circle, ellipse, and polygon, in which ellipse is most of the cases. When massive inclusions are encountered, they are usually modeled as rectangular inclusiona. Inclusions can be divided into soft and hard. When the inclusion is composed of a mixture of multiple materials, the inclusion is regarded as soft inclusion. After experimental measurement, the elastic modulus is E = 150 GPa and Poisson’s ratio is 0.3. When the inclusion is a single aluminum oxide, it is regarded as a hard inclusion. After experimental measurement, its elastic modulus is E = 400 GPa, and Poisson’s ratio is 0.3. The classic elastoplastic constitutive relation is adopted for matrix material FGH96. The elastic modulus E = 183.5 GPa, the hardening index n = 0.144, the hardening coefficient K = 2702.7 MPa, and Poisson’s ratio is taken as 0.35.
In the modeling process, quadrilateral mapping mesh is mainly used to improve the accuracy and speed of calculation. In addition, the mesh inside and around the inclusions is appropriately densified to improve the calculation precision. In the process of load setting, the equivalent linear displacement is applied to load the model.
In post-processing, the strain value of each element is extracted and brought into Equation (12) for calculation, the damage cloud chart is output, and the maximum damage parameter Ymax is brought into Equations (22) and (23) to calculate fatigue life.
The finite element modeling process and numerical calculation results of specimen No. 53 are introduced as follow.
Scanning electron micrographs of the fracture area of specimen No. 53 were taken and are shown in Figure 10. It can be seen from Table 8 that the specimen No. 53 is a standard uniform cross-section cylinder with a diameter of 6mm. The inclusion is at the surface position, and its shape is semi-elliptical with a semi-major axis of 32 mm and a semi-minor axis of 13 mm.
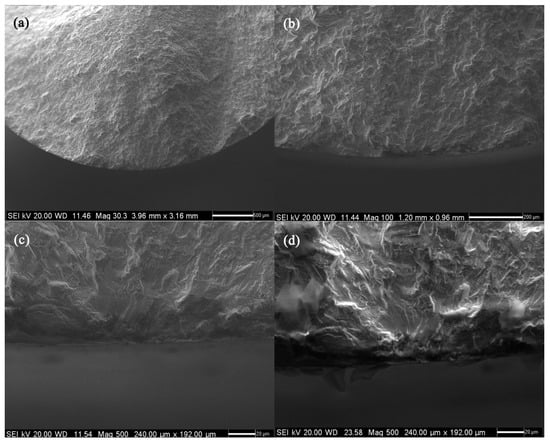
Figure 10.
The morphology of the fracture area of specimen No. 53: (a) Macro fracture morphology, (b) Crack source area and crack propagation region, (c,d) Crack source area.
Table 8.
Experimental data of specimen No. 53.
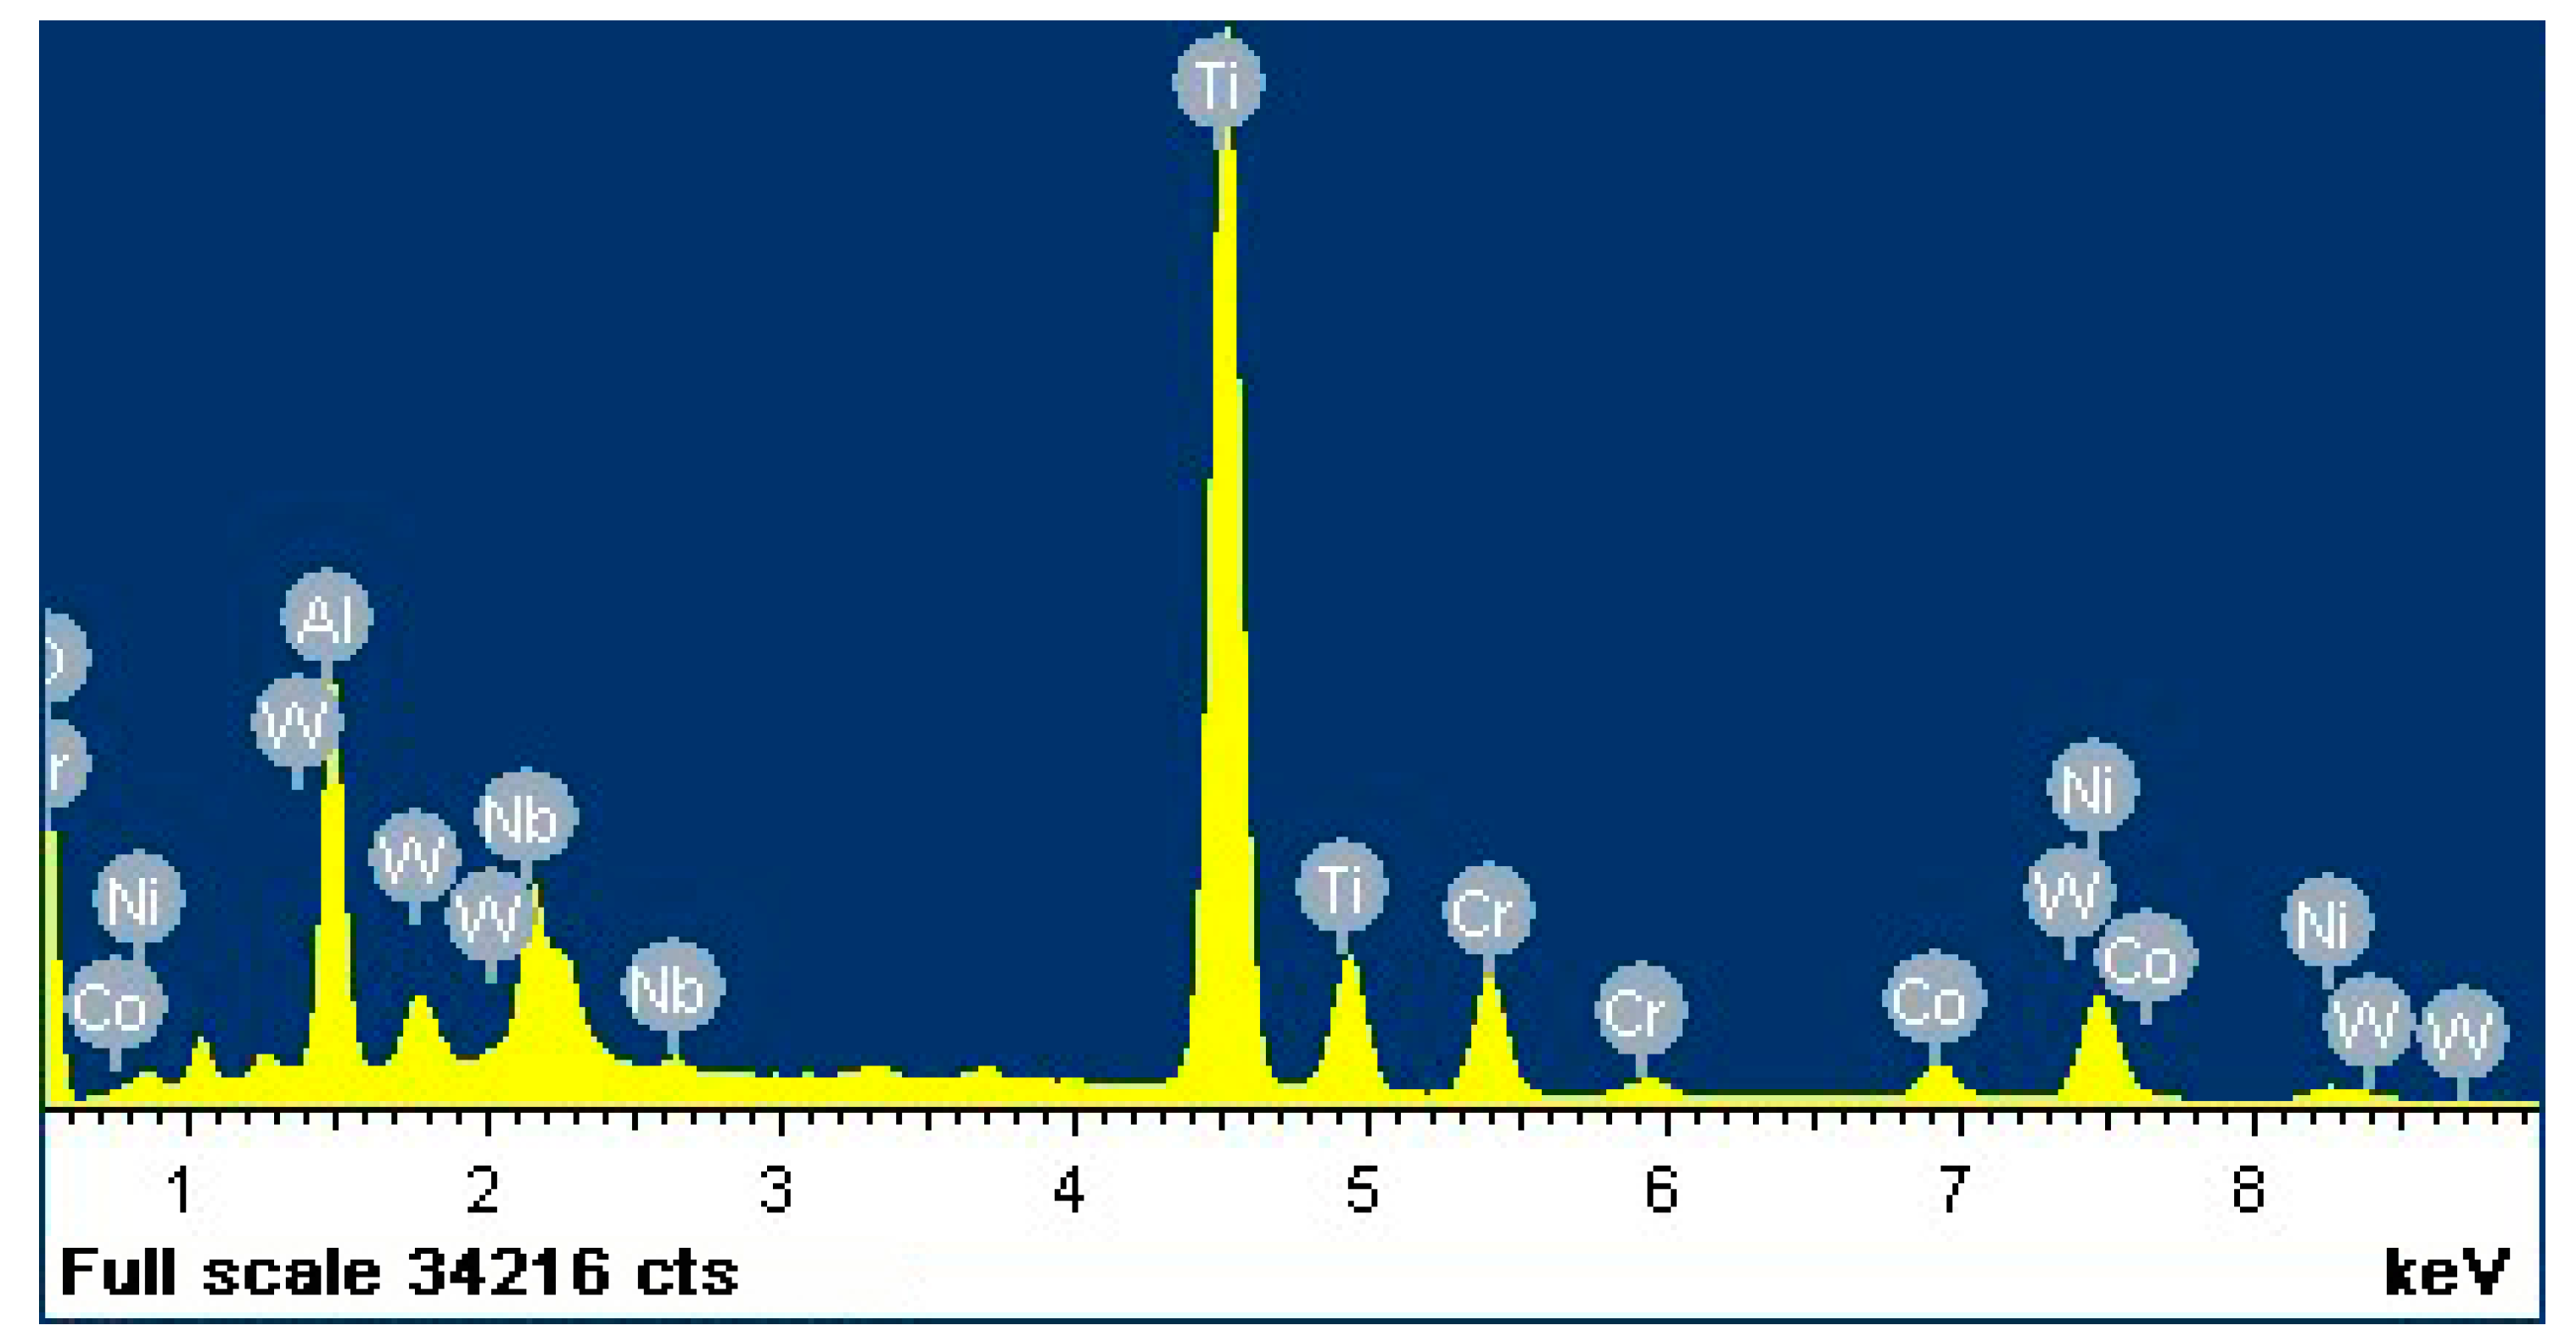
From Figure 11 and Table 9, it can be known that the main component of the inclusion is titanium oxide, and a small amount of other elements are mixed at the same time. The elastic modulus is taken as E = 150 GPa. The experimental temperature of the experimental specimen is 530 °C, the control strain ratio is R = 0.05, and the control strain range is 0.846%.
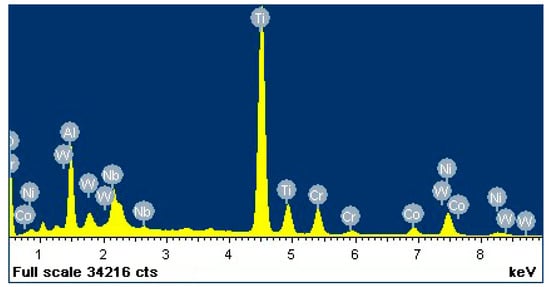
Figure 11.
Fracture defect energy spectrum of specimen No. 53.
Table 9.
Fracture defect composition of specimen No. 53.
When establishing the finite element model, the PLANE82 element is applied and a 6 mm × 3 mm two-dimensional plane model is established by using the boundary symmetry principle. Meanwhile, the location of the inclusion is divided by the method of surface segmentation.
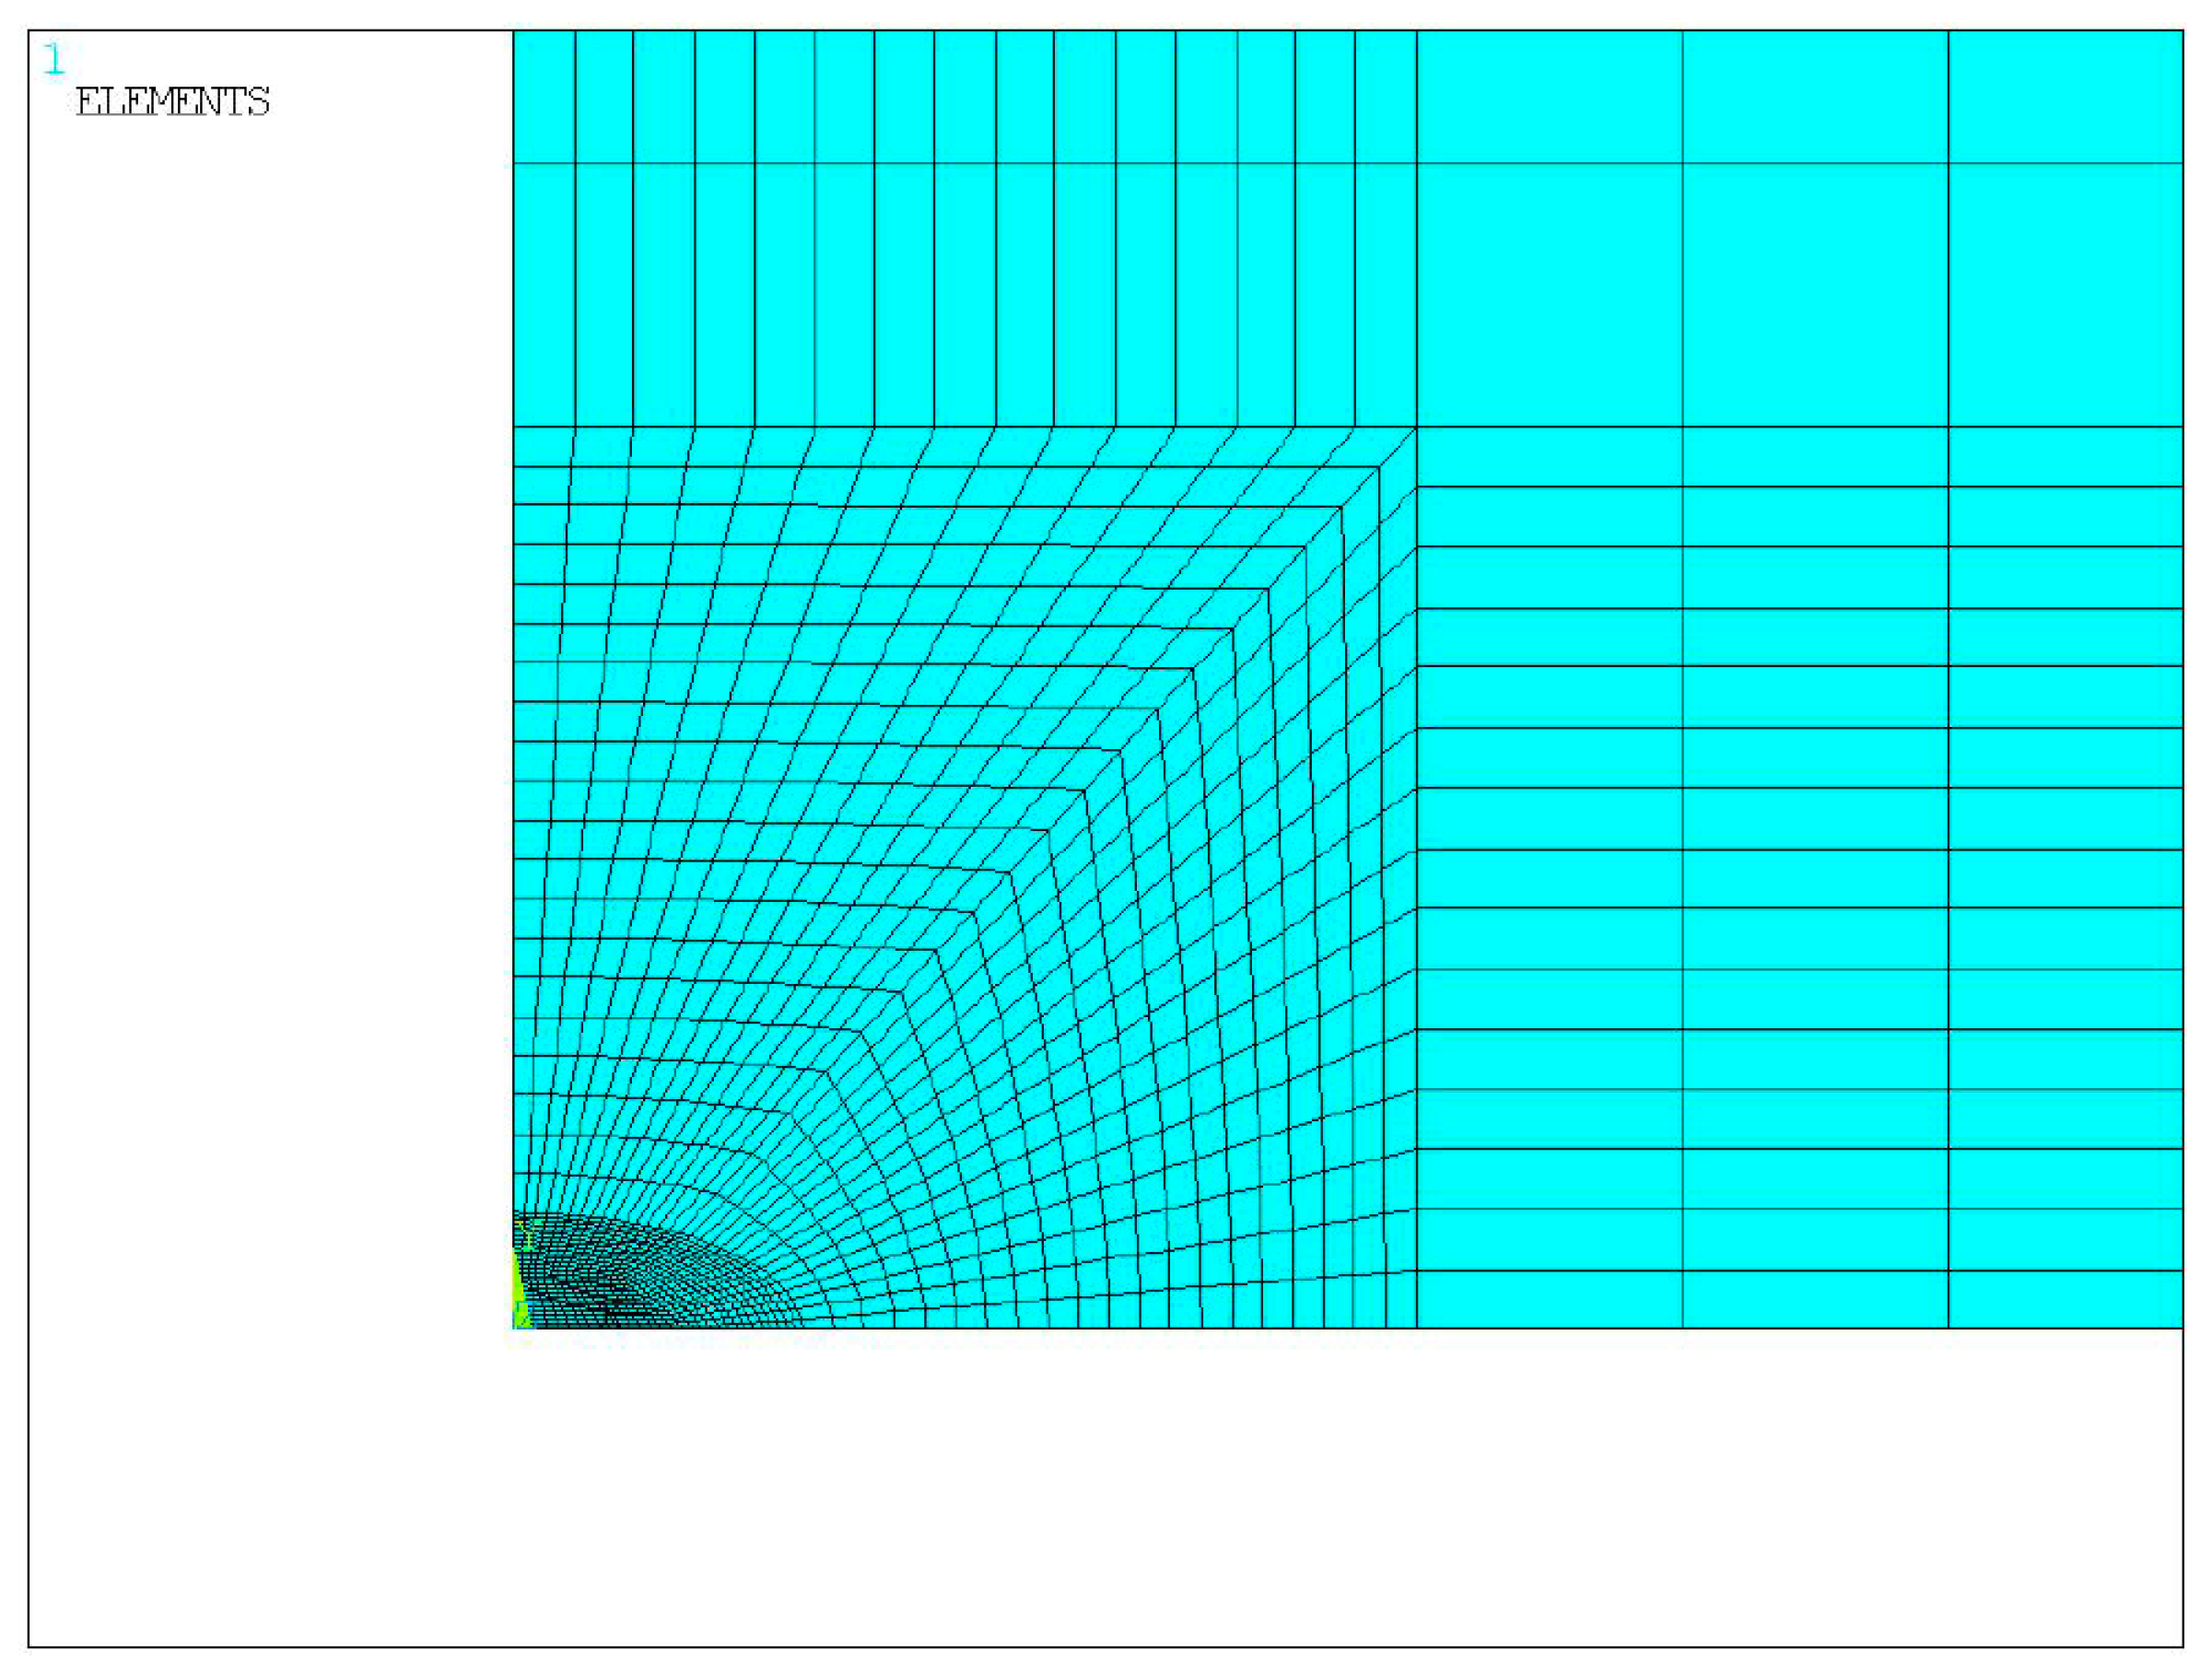
Then element types and material properties are assigned to the matrix material and the inclusion material respectively by ASEL command family and the AATT command. Each key line is divided into mesh attribute and size in turn. For inclusion and its surrounding area, the lines should be subdivided appropriately to refine the mesh and improve the calculation accuracy. Then, the mesh shape and mesh generation method are controlled through MSHKEY and MSHAPE. Finally, the mesh is generated as shown in Figure 12. The total number of the whole model elements is 25,775.
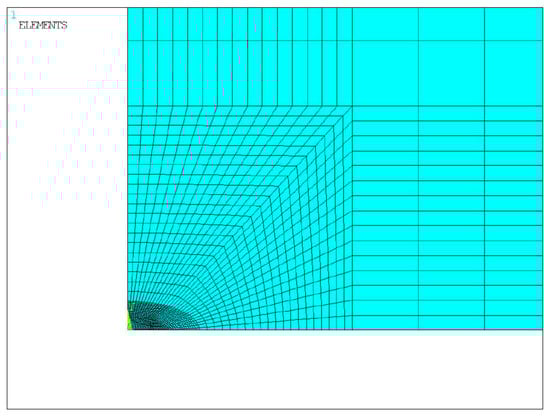
Figure 12.
Partial mesh generation of specimen No. 53.
After the completion of the mesh generation, the solution stage is entered. The constant amplitude strain loading method is adopted to the specimen, the strain ratio R = 0.05, and the strain range is 0.846%, so the equivalent displacement load can be calculated as: . The corresponding line displacement is applied on the upper part of the finite element model, and the symmetrical boundary conditions are set on the lower part of the finite element model. Then all elements and nodes are selected to solve the problem.
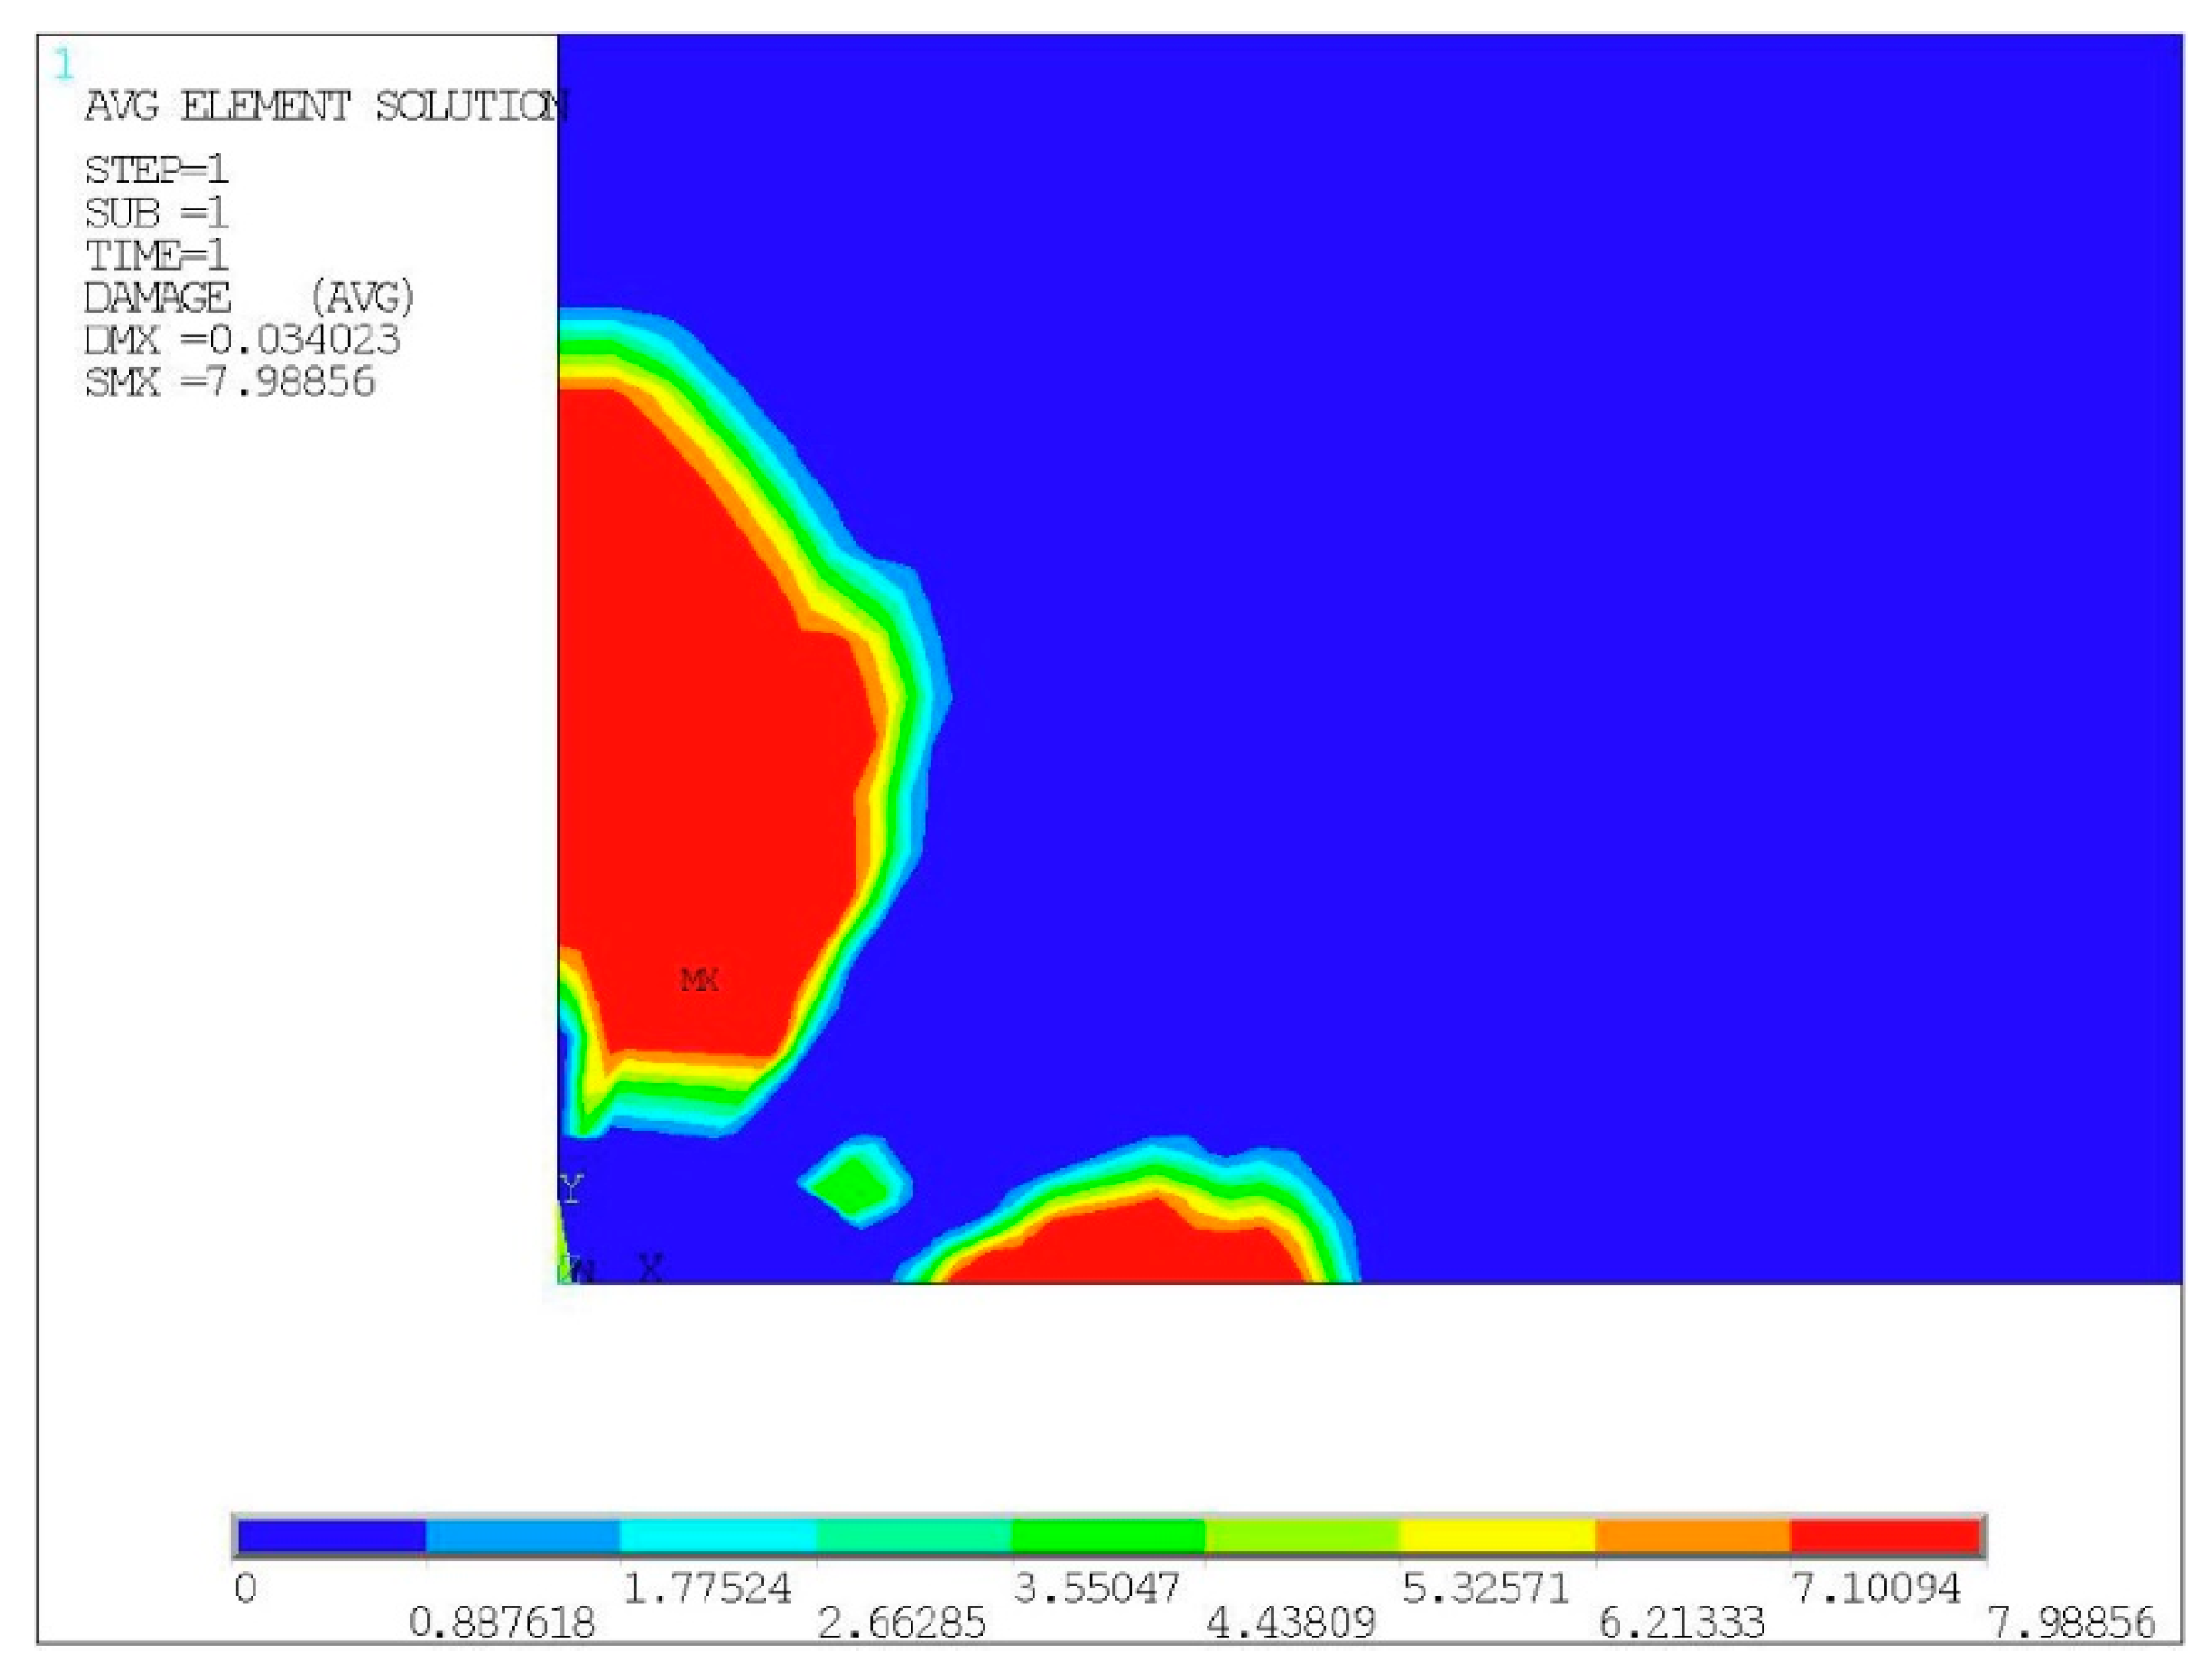
After the solution is completed, the general post-processor is entered. The strain components in all directions of all elements are extracted and substituted into Equation (12) to calculate the damage characterization parameter Y of each element, and then the damage cloud chart of the finite element model is output, as shown in the Figure 13. It shows that for the specimens with semi-elliptical inclusion on the surface, fatigue cracks mainly initiate near the endpoints of the major and minor axes of the semi-elliptical inclusion. The maximum damage characterization parameter Ymax = 7.98856, which is substituted into Equation (22), and the fatigue life can be calculated as 6990 cycles, while the experimental fatigue life of the experimental specimen is 7247 cycles. The error of fatigue life predicted by damage mechanics fatigue life prediction model is only 3.55%.
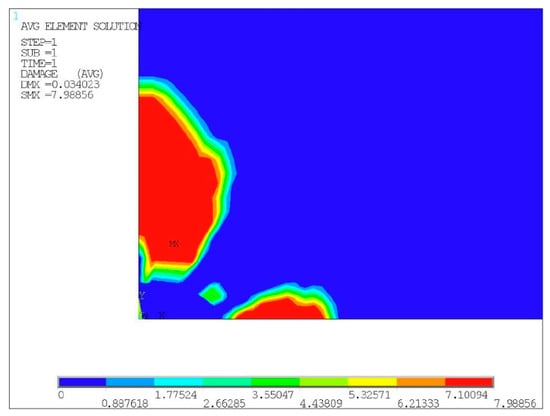
Figure 13.
Damage cloud chart of specimen No. 53.
In addition to the above-mentioned specimen, the author also used the damage mechanics fatigue life prediction model to calculate the fatigue life of several experimental specimens under different experimental conditions and the error was analyzed by comparing with the experimental life, as shown in Table 10.
Table 10.
Life prediction of specimens containing inclusion.
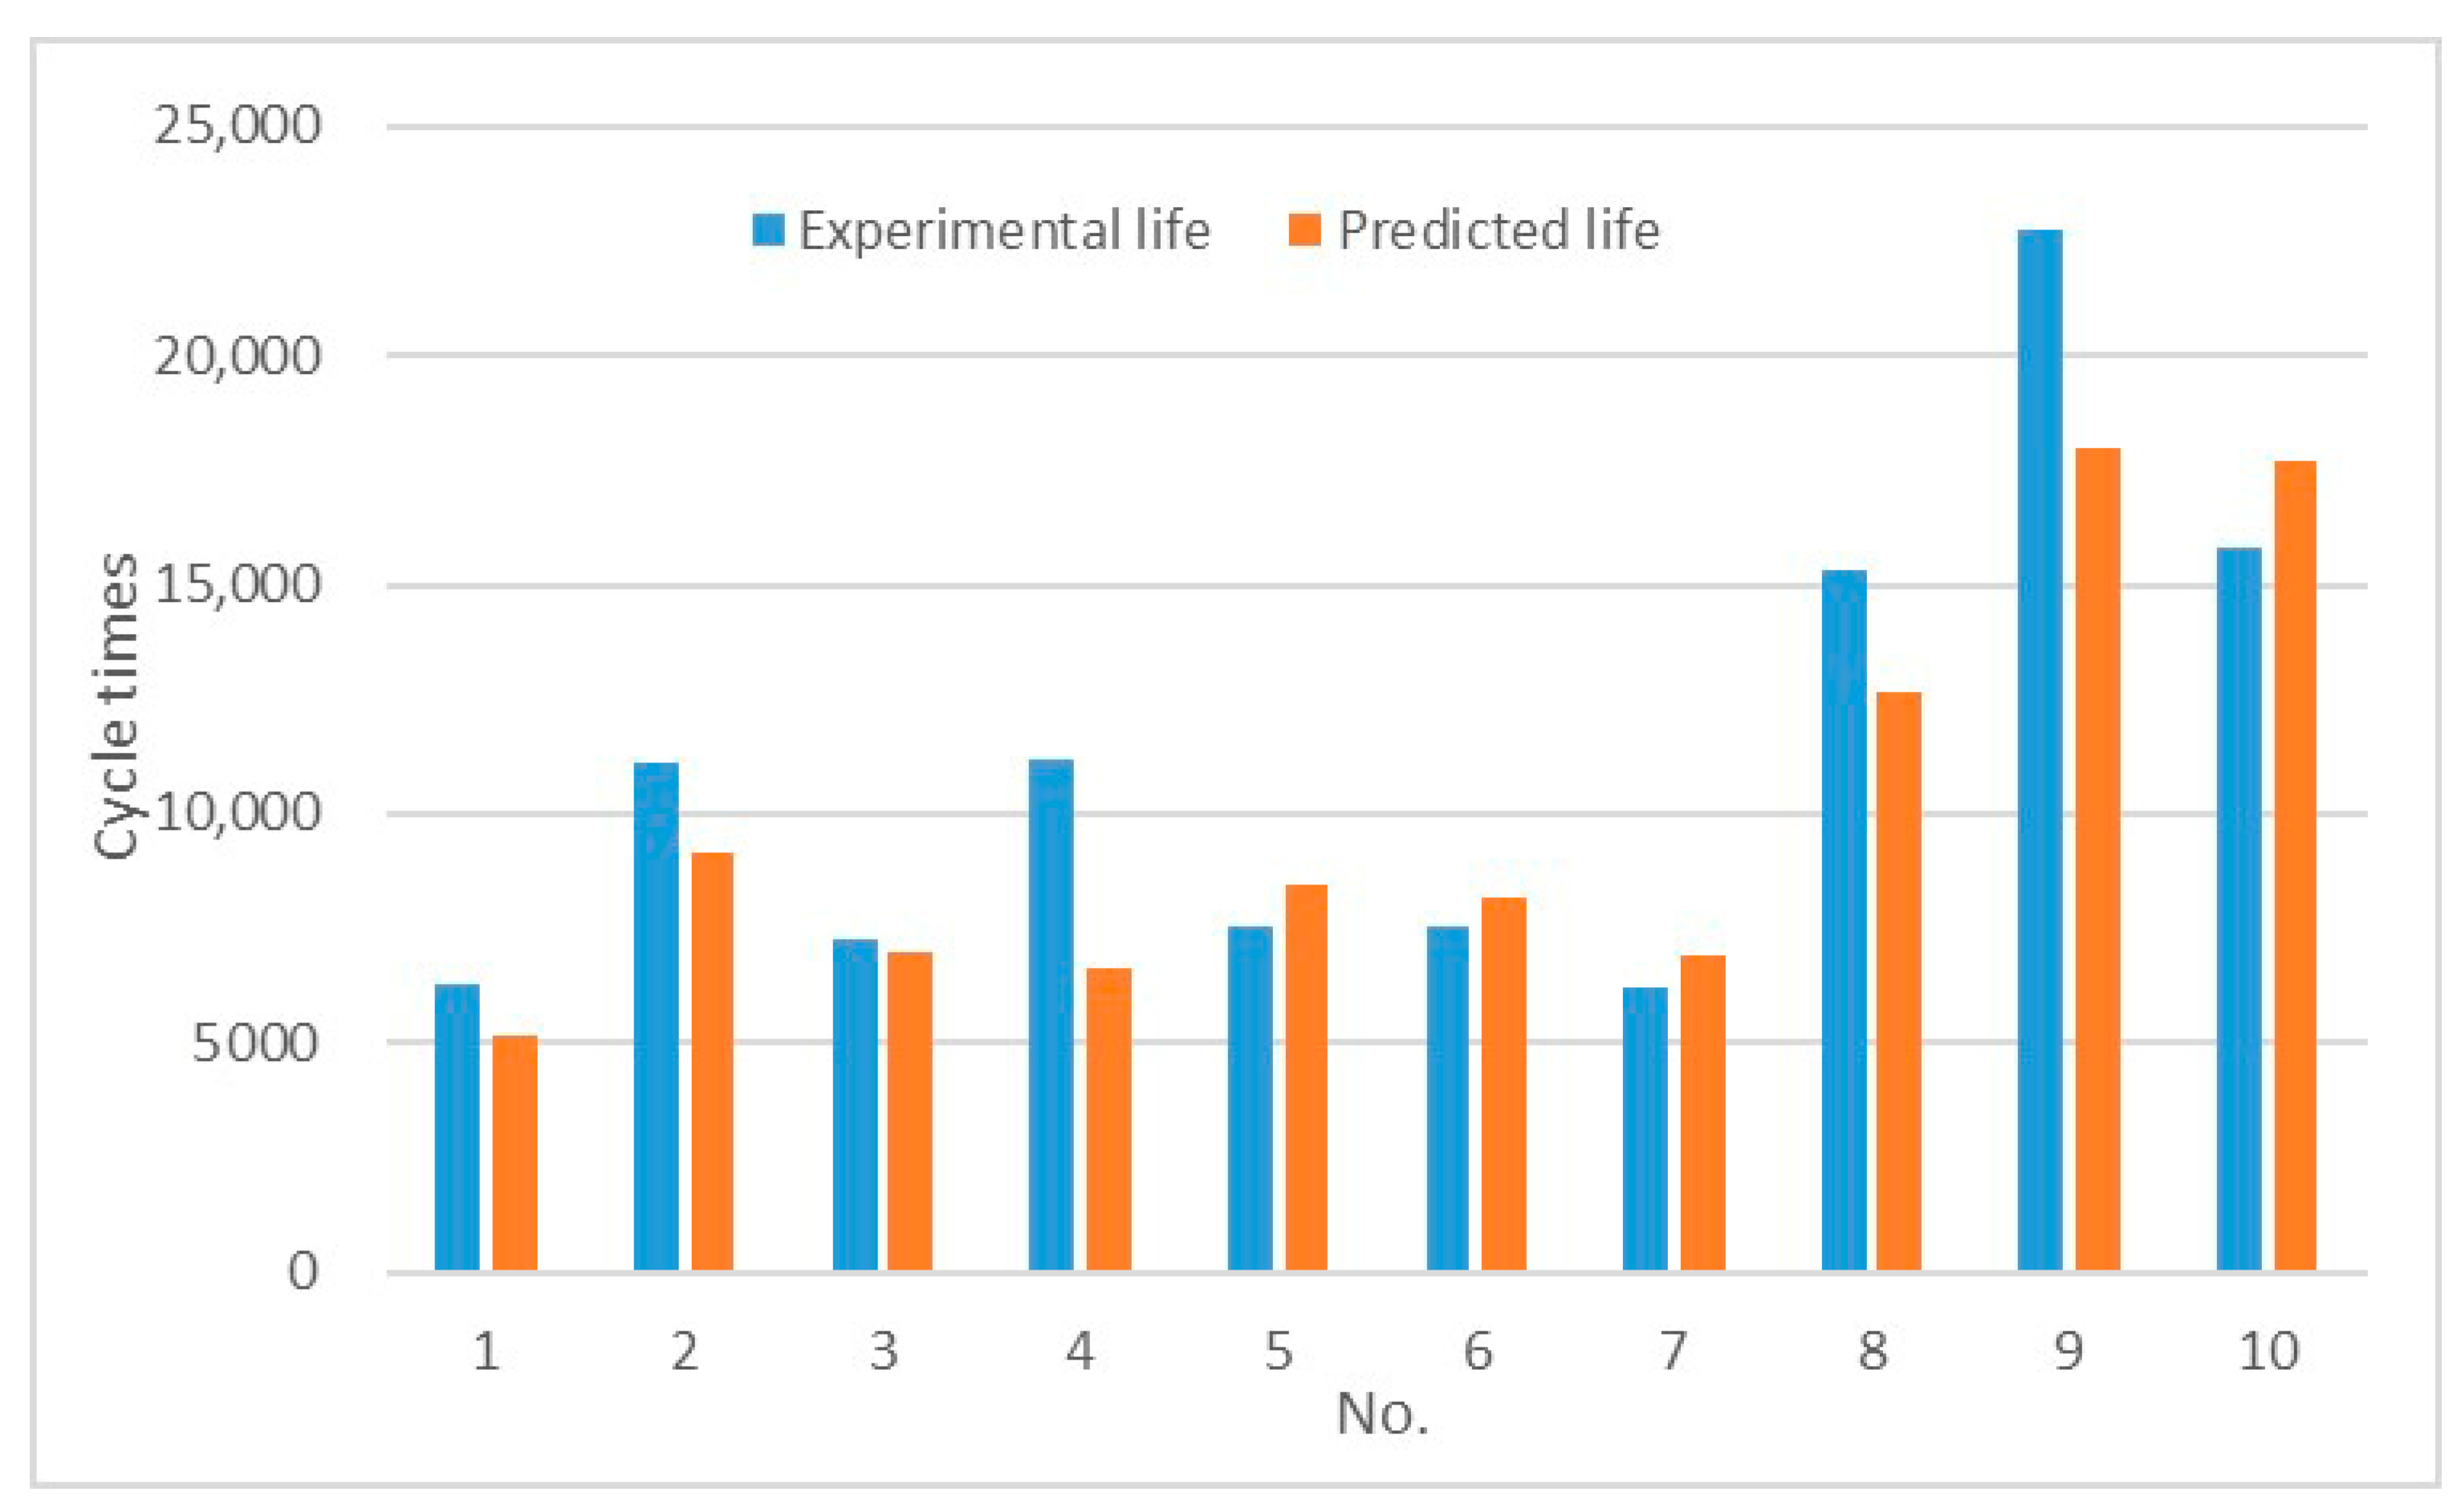
It can be seen from the calculation results in the Table 10 that there are mainly three shapes of inclusions in powder superalloy, which are elliptical, semi-elliptical and polygonal massive inclusions, and the inclusions are mainly located on the surface or subsurface. Figure 14 shows the comparison between experimental life and predicted life in the table, where blue refers to the experimental life and orange is the predicted one. It is found through the diagram that the fatigue life model based on damage mechanics has acceptable applicability for the prediction of low-cycle fatigue life of powder superalloy containing inclusion. The highest error is 40.49% among the experimental specimens participating in the life prediction calculation, and the life prediction error of most of the specimens is less than 20%.

Figure 14.
Experimental life vs. Predicted life.
5. Conclusions
In this paper, starting from the strain-life relationship, a prediction model of low-cycle fatigue life of powder superalloy based on the Manson-Coffin equation is established and its applicability is verified. Subsequently, from the perspective of damage mechanics, the damage evolution equation was established by damage characterization parameter, and the fatigue life prediction model of powder superalloy with inclusion suitable for strain ratio R = 0.05 and R = 0.2 was further established. The applicability of the model was verified by the life prediction of experimental specimens by finite element software.
The life prediction error of most specimens with and without inclusion of the damage mechanics method is less than 20%; while that of most specimens of Manson-Coffin model is more than 25%. The maximum error of damage mechanics method is 40.49%, and that of Manson-Coffin reaches above 100%. Testing and simulation work showed much better prediction accuracies globally for damage mechanics approach. Furthermore, it is proved through finite element calculation that the fatigue life prediction model of powder superalloy with inclusion based on damage mechanics built in this paper has acceptable applicability for experimental specimens under different strain ratios and strain ranges.
After verification, it is found that the main reasons for the inaccuracy of the Manson-Coffin model in predicting the fatigue life of powder superalloys containing inclusion are as follows:
- The powder superalloy FGH96 has obvious high strength and low plasticity. When using the Manson-Coffin equation to establish the fatigue life prediction model, in the fatigue test of FGH96 standard parts, the plastic deformation of the specimen is extremely small and the data dispersion is large, which leads to the poor regression of the experimental data in the plastic strain parameter fitting.
- The existence of inclusion leads to the obvious stress concentration in the stress field around the inclusions during the loading process, which is the main reason for the decrease of low cycle fatigue life of powder superalloy caused by inclusion. The Manson-coffin equation obviously cannot take this kind of micro defect into account, also, the fatigue crack initiation information of powder superalloy FGH96 containing inclusion cannot be reflected.
The life prediction error calculated by the perdition model based on the damage mechanics method mainly comes from several aspects:
- When a smooth non-destructive specimen is used for data fitting, there are certain errors in the damage parameters obtained, which introduced an error for the life prediction model.
- When the finite element model is established for numerical calculation, the matrix material and inclusions were simplified to 2D plane model, which reduces the number of degrees of freedom of nodes, and cannot well simulate the material flow of the specimen under load in the actual situation.
- Only two sizes of inclusion were used during the modeling of inclusions, which cannot reflect the actual shape of inclusions well. Inclusions may have more significant characteristics in another dimension than the model size data, which leads to errors between experimental life and predicted life.
Author Contributions
Conceptualization, Y.X.; methodology, H.C.; software, X.L.; validation, T.H.; formal analysis, X.C.; writing—original draft preparation, S.Z.; writing—review and editing, S.Z. All authors have read and agreed to the published version of the manuscript.
Funding
This research was funded by National High-tech R&D Program grant number [2015AA034401].
Acknowledgments
This work was sponsored by AECC Beijing Institute of Aeronautical Materials.
Conflicts of Interest
The authors declare no conflict of interest.
Appendix A
Table A1.
Experimental strain amplitude data at T = 530 °C, R = 0.05.
Table A1.
Experimental strain amplitude data at T = 530 °C, R = 0.05.
| Strain Range 0.95% | |||||||||
| No. | Max Strain εmax | Δεe/2 | Δεp/2 | Cycle Times Nf | No. | Max Strain εmax | Δεe/2 | Δεp/2 | Cycle Times Nf |
| 1 | 0.01001 | 4.68 × 10⁻³ | 7.72 × 10⁻⁵ | 2141 | 16 | 0.01 | 4.76 × 10⁻³ | −1.29 × 10⁻⁵ | 5210 |
| 2 | 0.01 | 4.67 × 10⁻³ | 7.47 × 10⁻⁵ | 4135 | 17 | 0.01 | 4.83 × 10⁻³ | −7.73 × 10⁻⁵ | 4756 |
| 3 | 0.01 | 4.64 × 10⁻³ | 1.11 × 10⁻⁴ | 6268 | 18 | 0.01 | 4.90 × 10⁻³ | −1.42 × 10⁻⁴ | 1937 |
| 4 | 0.01 | 4.68 × 10⁻³ | 6.96 × 10⁻⁵ | 5232 | 19 | 0.01 | 4.82 × 10⁻³ | −7.47 × 10⁻⁵ | 2939 |
| 5 | 0.01 | 4.72 × 10⁻³ | 3.35 × 10⁻⁵ | 4610 | 20 | 0.00991 | 4.85 × 10⁻³ | −1.88 × 10⁻⁴ | 2880 |
| 6 | 0.01 | 4.74 × 10⁻³ | 1.55 × 10⁻⁷ | 5333 | 21 | 0.01 | 4.90 × 10⁻³ | −1.64 × 10⁻⁴ | 2770 |
| 7 | 0.01 | 4.69 × 10⁻³ | 5.93 × 10⁻⁵ | 4732 | 22 | 0.01 | 4.82 × 10⁻³ | −7.22 × 10⁻⁵ | 3700 |
| 8 | 0.01001 | 4.71 × 10⁻³ | 4.11 × 10⁻⁵ | 7146 | 23 | 0.01 | 4.62 × 10⁻³ | 1.26 × 10⁻⁴ | 4988 |
| 9 | 0.01 | 4.69 × 10⁻³ | 6.19 × 10⁻⁵ | 6535 | 24 | 0.01 | 4.82 × 10⁻³ | −6.70 × 10⁻⁵ | 5842 |
| 10 | 0.00999 | 4.75 × 10⁻³ | −5.00 × 10⁻⁶ | 2114 | 25 | 0.01 | 4.79 × 10⁻³ | −3.87 × 10⁻⁵ | 4745 |
| 11 | 0.01 | 4.69 × 10⁻³ | 5.69 × 10⁻⁵ | 5267 | 26 | 0.01 | 4.93 × 10⁻³ | −1.75 × 10⁻⁴ | 4490 |
| 12 | 0.01 | 4.79 × 10⁻³ | −3.61 × 10⁻⁵ | 6724 | 27 | 0.01 | 4.65 × 10⁻³ | 1.00 × 10⁻⁴ | 5820 |
| 13 | 0.01 | 4.82 × 10⁻³ | −7.22 × 10⁻⁵ | 4560 | 28 | 0.01001 | 4.79 × 10⁻³ | −3.11 × 10⁻⁵ | 4823 |
| 14 | 0.01 | 4.90 × 10⁻³ | −1.49 × 10⁻⁴ | 3142 | 29 | 0.01001 | 4.59 × 10⁻³ | 1.65 × 10⁻⁴ | 6235 |
| 15 | 0.01 | 4.74 × 10⁻³ | 1.03 × 10⁻⁵ | 5210 | |||||
| Strain range 0.846% | |||||||||
| No. | Max strain εmax | Δεe/2 | Δεp/2 | Cycle times Nf | No. | Max strain εmax | Δεe/2 | Δεp/2 | Cycle times Nf |
| 30 | 0.0089 | 4.30 × 10⁻³ | −7.14 × 10⁻⁵ | 8301 | 53 | 0.0089 | 2.53 × 10⁻⁴ | 3.97 × 10⁻³ | 7427 |
| 31 | 0.0089 | 4.35 × 10⁻³ | −1.23 × 10⁻⁴ | 10,454 | 54 | 0.0089 | 4.32 × 10⁻³ | −9.72 × 10⁻⁵ | 7771 |
| 32 | 0.0089 | 4.32 × 10⁻³ | −9.20 × 10⁻⁵ | 11,376 | 55 | 0.0089 | 4.32 × 10⁻³ | −9.46 × 10⁻⁵ | 10,289 |
| 33 | 0.0089 | 4.17 × 10⁻³ | 5.75 × 10⁻⁵ | 13,500 | 56 | 0.0089 | 4.28 × 10⁻³ | −5.85 × 10⁻⁵ | 10,877 |
| 34 | 0.0089 | 4.22 × 10⁻³ | 5.93 × 10⁻⁶ | 12,219 | 57 | 0.0089 | 4.27 × 10⁻³ | −4.56 × 10⁻⁵ | 5911 |
| 35 | 0.0089 | 4.22 × 10⁻³ | 8.51 × 10⁻⁶ | 9285 | 58 | 0.0089 | 4.38 × 10⁻³ | −1.51 × 10⁻⁴ | 6276 |
| 36 | 0.0089 | 4.14 × 10⁻³ | 8.32 × 10⁻⁵ | 12,504 | 59 | 0.0089 | 4.27 × 10⁻³ | −4.56 × 10⁻⁵ | 9246 |
| 37 | 0.0089 | 4.09 × 10⁻³ | 1.32 × 10⁻⁴ | 9509 | 60 | 0.0089 | 4.25 × 10⁻³ | −2.24 × 10⁻⁵ | 13,204 |
| 38 | 0.0089 | 4.43 × 10⁻³ | −2.05 × 10⁻⁴ | 11,116 | 61 | 0.0089 | 4.34 × 10⁻³ | −1.15 × 10⁻⁴ | 12,249 |
| 39 | 0.0089 | 4.35 × 10⁻³ | −1.20 × 10⁻⁴ | 7962 | 62 | 0.0089 | 4.36 × 10⁻³ | −1.36 × 10⁻⁴ | 13,716 |
| 40 | 0.0089 | 4.32 × 10⁻³ | −9.46 × 10⁻⁵ | 11,518 | 63 | 0.0089 | 4.15 × 10⁻³ | 7.29 × 10⁻⁵ | 14,174 |
| 41 | 0.0089 | 4.27 × 10⁻³ | −4.05 × 10⁻⁵ | 7209 | 64 | 0.0089 | 4.30 × 10⁻³ | −7.40 × 10⁻⁵ | 14,856 |
| 42 | 0.0089 | 4.15 × 10⁻³ | 7.29 × 10⁻⁵ | 13,182 | 65 | 0.0089 | 4.16 × 10⁻³ | 6.01 × 10⁻⁵ | 11,188 |
| 43 | 0.0089 | 4.31 × 10⁻³ | −8.94 × 10⁻⁵ | 6544 | 66 | 0.0089 | 4.31 × 10⁻³ | −8.69 × 10⁻⁵ | 13,672 |
| 44 | 0.0089 | 4.42 × 10⁻³ | −1.95 × 10⁻⁴ | 12,900 | 67 | 0.0089 | 4.43 × 10⁻³ | −2.03 × 10⁻⁴ | 10,308 |
| 45 | 0.0089 | 4.41 × 10⁻³ | −1.90 × 10⁻⁴ | 11,031 | 68 | 0.0089 | 4.15 × 10⁻³ | 7.29 × 10⁻⁵ | 10,726 |
| 46 | 0.0089 | 4.40 × 10⁻³ | −1.77 × 10⁻⁴ | 6567 | 69 | 0.0089 | 4.29 × 10⁻³ | −6.37 × 10⁻⁵ | 17,389 |
| 47 | 0.0089 | 4.19 × 10⁻³ | 3.17 × 10⁻⁵ | 14,521 | 70 | 0.0089 | 4.34 × 10⁻³ | −1.18 × 10⁻⁴ | 10,084 |
| 48 | 0.0089 | 4.29 × 10⁻³ | −6.37 × 10⁻⁵ | 8125 | 71 | 0.0089 | 4.46 × 10⁻³ | −2.36 × 10⁻⁴ | 3568 |
| 49 | 0.0089 | 4.34 × 10⁻³ | −1.10 × 10⁻⁴ | 12,616 | 72 | 0.0089 | 4.43 × 10⁻³ | −2.00 × 10⁻⁴ | 4330 |
| 50 | 0.0089 | 4.43 × 10⁻³ | −2.00 × 10⁻⁴ | 9254 | 73 | 0.0089 | 4.49 × 10⁻³ | −2.62 × 10⁻⁴ | 6996 |
| 51 | 0.0089 | 4.21 × 10⁻³ | 1.11 × 10⁻⁵ | 13,550 | 74 | 0.0089 | 4.08 × 10⁻³ | 1.48 × 10⁻⁴ | 14,295 |
| 52 | 0.0089 | 4.34 × 10⁻³ | −1.15 × 10⁻⁴ | 9857 | 75 | 0.0089 | 4.19 × 10⁻³ | 3.43 × 10⁻⁵ | 5434 |
| Strain range 0.76% | |||||||||
| No. | Max strain εmax | Δεe/2 | Δεp/2 | Cycle times Nf | No. | Max strain εmax | Δεe/2 | Δεp/2 | Cycle times Nf |
| 76 | 0.008 | 3.85 × 10⁻³ | −4.79 × 10⁻⁵ | 9584 | 89 | 0.008 | 3.80× 10⁻³ | −9.12 × 10⁻⁶ | 8765 |
| 77 | 0.008 | 3.83 × 10⁻³ | −2.73 × 10⁻⁵ | 22,138 | 90 | 0.008 | 3.95× 10⁻³ | −1.51 × 10⁻⁴ | 11,387 |
| 78 | 0.008 | 3.84 × 10⁻³ | −3.51 × 10⁻⁵ | 10,633 | 91 | 0.008 | 3.87× 10⁻³ | −7.11 × 10⁻⁵ | 8689 |
| 79 | 0.008 | 3.85 × 10⁻³ | −5.55 × 10⁻⁵ | 25,297 | 92 | 0.00801 | 3.92× 10⁻³ | −1.13 × 10⁻⁴ | 25,615 |
| 80 | 0.008 | 3.88 × 10⁻³ | −8.64 × 10⁻⁵ | 11,755 | 93 | 0.00799 | 3.84× 10⁻³ | −5.28 × 10⁻⁵ | 10,985 |
| 81 | 0.008 | 3.82 × 10⁻³ | −1.70 × 10⁻⁵ | 11,522 | 94 | 0.008 | 3.84× 10⁻³ | −4.28 × 10⁻⁵ | 11,970 |
| 82 | 0.008 | 3.78 × 10⁻³ | 6.50 × 10⁻⁶ | 28,084 | 95 | 0.008 | 3.87× 10⁻³ | −6.10 × 10⁻⁵ | 14,817 |
| 83 | 0.008 | 3.80 × 10⁻³ | −4.12 × 10⁻⁶ | 15,332 | 96 | 0.008 | 3.85× 10⁻³ | −5.29 × 10⁻⁵ | 14,042 |
| 84 | 0.008 | 3.82 × 10⁻³ | −1.70 × 10⁻⁵ | 7801 | 97 | 0.008 | 3.86× 10⁻³ | −5.07 × 10⁻⁵ | 14,443 |
| 85 | 0.008 | 3.74 × 10⁻³ | 5.79 × 10⁻⁵ | 6595 | 98 | 0.008 | 3.85× 10⁻³ | −4.55 × 10⁻⁵ | 15,368 |
| 86 | 0.008 | 3.79 × 10⁻³ | 6.34 × 10⁻⁶ | 23,388 | 99 | 0.008 | 3.86× 10⁻³ | −5.82 × 10⁻⁵ | 11,467 |
| 87 | 0.008 | 3.85 × 10⁻³ | −5.31 × 10⁻⁵ | 7064 | 100 | 0.00801 | 3.90× 10⁻³ | −9.19 × 10⁻⁵ | 14,666 |
| 88 | 0.00799 | 3.83 × 10⁻³ | −3.23 × 10⁻⁵ | 9360 | |||||
| Strain range 1% | |||||||||
| No. | Max strain εmax | Δεe/2 | Δεp/2 | Cycle times Nf | No. | Max strain εmax | Δεe/2 | Δεp/2 | Cycle times Nf |
| 101 | 0.01052 | 5.05 × 10⁻³ | −4.64 × 10⁻⁵ | 3663 | 114 | 0.01052 | 4.89 × 10⁻³ | 1.06 × 10⁻⁴ | 5166 |
| 102 | 0.01052 | 4.98 × 10⁻³ | 1.55 × 10⁻⁵ | 3693 | 115 | 0.01053 | 5.02 × 10⁻³ | −1.82 × 10⁻⁵ | 4649 |
| 103 | 0.01052 | 4.90 × 10⁻³ | 1.08 × 10⁻⁴ | 3768 | 116 | 0.01052 | 5.00 × 10⁻³ | 2.58 × 10⁻⁶ | 3742 |
| 104 | 0.01052 | 5.13 × 10⁻³ | −1.29 × 10⁻⁴ | 3255 | 117 | 0.01052 | 4.99 × 10⁻³ | 1.29 × 10⁻⁵ | 3916 |
| 105 | 0.01052 | 4.93 × 10⁻³ | 6.96 × 10⁻⁵ | 3935 | 118 | 0.01052 | 4.99 × 10⁻³ | 5.16 × 10⁻⁶ | 3654 |
| 106 | 0.01052 | 4.99 × 10⁻³ | 1.29 × 10⁻⁵ | 3564 | 119 | 0.01052 | 5.01 × 10⁻³ | −5.16 × 10⁻⁶ | 4196 |
| 107 | 0.01052 | 5.04 × 10⁻³ | −3.87 × 10⁻⁵ | 3449 | 120 | 0.01052 | 4.92 × 10⁻³ | 7.73 × 10⁻⁵ | 4217 |
| 108 | 0.01052 | 5.01 × 10⁻³ | −7.73 × 10⁻⁶ | 3334 | 121 | 0.01052 | 4.99 × 10⁻³ | 7.89 × 10⁻⁶ | 4149 |
| 109 | 0.01052 | 4.87 × 10⁻³ | 1.34 × 10⁻⁴ | 3472 | 122 | 0.01052 | 5.02 × 10⁻³ | −1.56 × 10⁻⁵ | 3475 |
| 110 | 0.01052 | 5.00 × 10⁻³ | 0.00 | 3108 | 123 | 0.01053 | 4.93 × 10⁻³ | 7.70 × 10⁻⁵ | 3843 |
| 111 | 0.01052 | 4.91 × 10⁻³ | 8.52 × 10⁻⁵ | 3050 | 124 | 0.01052 | 5.06 × 10⁻³ | −6.17 × 10⁻⁵ | 4051 |
| 112 | 0.01051 | 4.86 × 10⁻³ | 1.34 × 10⁻⁴ | 4938 | 125 | 0.01052 | 5.05 × 10⁻³ | −4.40 × 10⁻⁵ | 2883 |
| 113 | 0.01053 | 5.03 × 10⁻³ | −2.85 × 10⁻⁵ | 3589 | |||||
Appendix B
Table A2.
Experimental strain amplitude data at T = 600 °C, R = 0.2.
Table A2.
Experimental strain amplitude data at T = 600 °C, R = 0.2.
| Strain Range 0.65% | |||||||||
| No. | Max Strain εmax | Δεe/2 | Δεp/2 | Cycle Times Nf | No. | Max Strain εmax | Δεe/2 | Δεp/2 | Cycle Times Nf |
| 1 | 0.0081 | 3.16 × 10⁻³ | 9.02 × 10⁻⁵ | 9153 | 14 | 0.0081 | 3.26 × 10⁻³ | −1.53 × 10⁻⁵ | 22,531 |
| 2 | 0.0081 | 3.20 × 10⁻³ | 5.40 × 10⁻⁵ | 7562 | 15 | 0.00811 | 3.30 × 10⁻³ | −5.41 × 10⁻⁵ | 24,563 |
| 3 | 0.0081 | 3.20 × 10⁻³ | 4.90 × 10⁻⁵ | 10,603 | 16 | 0.00811 | 3.24 × 10⁻³ | 2.73 × 10⁻⁶ | 60,078 |
| 4 | 0.0081 | 3.15 × 10⁻³ | 9.04 × 10⁻⁵ | 15,806 | 17 | 0.0081 | 3.27 × 10⁻³ | −1.80 × 10⁻⁵ | 59,511 |
| 5 | 0.0081 | 3.27 × 10⁻³ | −1.80 × 10⁻⁵ | 9394 | 18 | 0.0081 | 3.38 × 10⁻³ | −1.34 × 10⁻⁴ | 49,963 |
| 6 | 0.0081 | 3.24 × 10⁻³ | 5.16 × 10⁻⁶ | 9855 | 19 | 0.00811 | 3.31 × 10⁻³ | −5.69 × 10⁻⁵ | 118,213 |
| 7 | 0.0081 | 3.42 × 10⁻³ | −1.78 × 10⁻⁴ | 12,295 | 20 | 0.0081 | 3.31 × 10⁻³ | −6.19 × 10⁻⁵ | 9280 |
| 8 | 0.0081 | 3.32 × 10⁻³ | −6.70 × 10⁻⁵ | 22,738 | 21 | 0.0081 | 3.28 × 10⁻³ | −3.35 × 10⁻⁵ | 10,970 |
| 9 | 0.0081 | 3.20 × 10⁻³ | 5.41 × 10⁻⁵ | 7242 | 22 | 0.0081 | 3.17 × 10⁻³ | 8.49 × 10⁻⁵ | 61,160 |
| 10 | 0.0081 | 3.04 × 10⁻³ | 2.11 × 10⁻⁴ | 71,233 | 23 | 0.0081 | 3.28 × 10⁻³ | −3.09 × 10⁻⁵ | 7497 |
| 11 | 0.0081 | 3.26 × 10⁻³ | −1.03 × 10⁻⁵ | 63,615 | 24 | 0.0081 | 3.32 × 10⁻³ | −7.97 × 10⁻⁵ | 63,512 |
| 12 | 0.0081 | 3.12 × 10⁻³ | 1.39 × 10⁻⁴ | 10,415 | 25 | 0.0081 | 3.26 × 10⁻³ | −1.03 × 10⁻⁵ | 71,581 |
| 13 | 0.0081 | 3.28 × 10⁻³ | −2.35 × 10⁻⁵ | 28,211 | 26 | 0.0081 | 3.29 × 10⁻³ | −4.11 × 10⁻⁵ | 224,817 |
| Strain range 0.751% | |||||||||
| No. | Max strain εmax | Δεe/2 | Δεp/2 | Cycle times Nf | No. | Max strain εmax | Δεe/2 | Δεp/2 | Cycle times Nf |
| 27 | 0.0094 | 3.76 × 10⁻³ | −3.09 × 10⁻⁷ | 90,839 | 42 | 0.0094 | 3.79 × 10⁻³ | −3.62 × 10⁻⁵ | 6293 |
| 28 | 0.0094 | 3.70 × 10⁻³ | 6.91 × 10⁻⁵ | 19,729 | 43 | 0.0094 | 3.88 × 10⁻³ | −1.11 × 10⁻⁴ | 7231 |
| 29 | 0.0094 | 3.80 × 10⁻³ | −4.15 × 10⁻⁵ | 18,217 | 44 | 0.0094 | 3.75 × 10⁻³ | 1.26 × 10⁻⁵ | 6205 |
| 30 | 0.0094 | 3.65 × 10⁻³ | 1.08 × 10⁻⁴ | 7080 | 45 | 0.00939 | 3.68 × 10⁻³ | 6.96 × 10⁻⁵ | 7811 |
| 31 | 0.0094 | 3.76 × 10⁻³ | 4.69 × 10⁻⁶ | 11,246 | 46 | 0.0094 | 3.76 × 10⁻³ | −1.79 × 10⁻⁵ | 9815 |
| 32 | 0.0094 | 3.71 × 10⁻³ | 4.37 × 10⁻⁵ | 6353 | 47 | 0.00939 | 3.73 × 10⁻³ | 8.04 × 10⁻⁶ | 7546 |
| 33 | 0.0094 | 3.71 × 10⁻³ | 4.12 × 10⁻⁵ | 44,595 | 48 | 0.0094 | 3.74 × 10⁻³ | 1.55 × 10⁻⁷ | 8629 |
| 34 | 0.0094 | 3.56 × 10⁻³ | 1.86 × 10⁻⁴ | 10,614 | 49 | 0.0094 | 3.68 × 10⁻³ | 8.46 × 10⁻⁵ | 9986 |
| 35 | 0.0094 | 3.74 × 10⁻³ | 7.73 × 10⁻⁶ | 35,915 | 50 | 0.0094 | 3.78 × 10⁻³ | −2.59 × 10⁻⁵ | 3910 |
| 36 | 0.0094 | 3.77 × 10⁻³ | −2.32 × 10⁻⁵ | 8402 | 51 | 0.0094 | 3.73 × 10⁻³ | 3.82 × 10⁻⁵ | 10,397 |
| 37 | 0.0094 | 3.63 × 10⁻³ | 1.21 × 10⁻⁴ | 6865 | 52 | 0.00941 | 3.69 × 10⁻³ | 7.19 × 10⁻⁵ | 6244 |
| 38 | 0.00941 | 3.79 × 10⁻³ | −3.37 × 10⁻⁵ | 8648 | 53 | 0.00939 | 3.87 × 10⁻³ | −1.31 × 10⁻⁴ | 7540 |
| 39 | 0.00939 | 3.77 × 10⁻³ | −3.56 × 10⁻⁵ | 8399 | 54 | 0.0094 | 3.78 × 10⁻³ | −2.84 × 10⁻⁵ | 6365 |
| 40 | 0.0094 | 3.73 × 10⁻³ | 1.30 × 10⁻⁵ | 7651 | 55 | 0.0094 | 3.76 × 10⁻³ | −5.31 × 10⁻⁶ | 10,565 |
| 41 | 0.00941 | 3.66 × 10⁻³ | 1.10 × 10⁻⁴ | 5053 | 56 | 0.0094 | 3.88 × 10⁻³ | −1.21 × 10⁻⁴ | 7643 |
| Strain range 0.849% | |||||||||
| No. | Max strain εmax | Δεe/2 | Δεp/2 | Cycle times Nf | No. | Max strain εmax | Δεe/2 | Δεp/2 | Cycle times Nf |
| 57 | 0.0106 | 4.16 × 10⁻³ | 0.000092629 | 4439 | 72 | 0.0106 | 4.33 × 10⁻³ | −0.000077320 | 5476 |
| 58 | 0.0106 | 4.26 × 10⁻³ | −0.000010309 | 5961 | 73 | 0.0106 | 4.23 × 10⁻³ | 0.000023196 | 7360 |
| 59 | 0.0106 | 4.27 × 10⁻³ | −0.000028196 | 6209 | 74 | 0.0106 | 4.24 × 10⁻³ | 0.000000155 | 6188 |
| 60 | 0.0106 | 4.25 × 10⁻³ | −0.000005000 | 6176 | 75 | 0.0106 | 4.30 × 10⁻³ | −0.000051546 | 4952 |
| 61 | 0.0106 | 4.31 × 10⁻³ | −0.000061701 | 4927 | 76 | 0.0106 | 4.22 × 10⁻³ | 0.000023505 | 6504 |
| 62 | 0.0106 | 4.26 × 10⁻³ | −0.000017732 | 7330 | 77 | 0.0106 | 4.29 × 10⁻³ | −0.000046237 | 5079 |
| 63 | 0.0106 | 4.32 × 10⁻³ | −0.000067010 | 5746 | 78 | 0.01061 | 4.26 × 10⁻³ | −0.000010309 | 6999 |
| 64 | 0.0106 | 4.28 × 10⁻³ | −0.000033351 | 5462 | 79 | 0.0106 | 4.23 × 10⁻³ | 0.000008041 | 6517 |
| 65 | 0.0106 | 4.30 × 10⁻³ | −0.000053969 | 6241 | 80 | 0.01059 | 4.17 × 10⁻³ | 0.000077320 | 6038 |
| 66 | 0.0106 | 4.19 × 10⁻³ | 0.000054278 | 7242 | 81 | 0.0106 | 4.08 × 10⁻³ | 0.000172680 | 9946 |
| 67 | 0.0106 | 4.23 × 10⁻³ | 0.000023196 | 5468 | 82 | 0.0106 | 4.18 × 10⁻³ | 0.000069588 | 5139 |
| 68 | 0.0106 | 4.18 × 10⁻³ | 0.000062010 | 4971 | 83 | 0.0106 | 4.35 × 10⁻³ | −0.000090361 | 3724 |
| 69 | 0.0106 | 4.25 × 10⁻³ | −0.000007577 | 5065 | 84 | 0.01061 | 4.10 × 10⁻³ | 0.000151907 | 10,289 |
| 70 | 0.0106 | 4.07 × 10⁻³ | 0.000165258 | 5614 | 85 | 0.0106 | 4.27 × 10⁻³ | −0.000035619 | 5481 |
| 71 | 0.01061 | 4.14 × 10⁻³ | 0.000103402 | 6652 | 86 | 0.0106 | 4.22 × 10⁻³ | 0.000033505 | 6590 |
References
- Shi, C.X.; Zhong, Z.Y. Development and innovation of superalloy in China. Acta. Metall. Sin. 2010, 46, 1281–1288. [Google Scholar] [CrossRef]
- Yang, L.B.; Ren, X.N.; Ge, C.C.; Yan, Q.Z. Status and development of powder metallurgy nickel−based disk superalloys. Int. J. Mater. Res. 2019, 110, 901–910. [Google Scholar] [CrossRef]
- Zhang, G.Q.; Zhang, Y.W.; Zheng, L.; Peng, Z.C. Research progress in powder metallurgy superalloys and manufacturing technologies for aero−engine application. Acta. Metall. Sin. 2019, 55, 1133–1144. [Google Scholar]
- Zhang, Y.; Zhang, Y.W.; Zhang, F.G.; Tao, Y.; Chen, X.C. Effect of powder particle size on microstructure and mechanical property of Ni−based P/M superalloy product. J. Iron Steel Res. Int. 2003, 10, 71–74. [Google Scholar]
- Kantzos, P.; Bonacuse, P.; Telesman, J.; Gabb, T.; Barrie, R.; Banik, A. Effect of powder cleanliness on the fatigue behavior of powder metallurgy Ni−disk alloy Udimet 720. Superalloys 2004, 409–417. [Google Scholar] [CrossRef]
- Zhao, K.; Liu, X.L.; He, Y.H. Influence of inclusions on low cycle fatigue life of PM superalloy. In IOP Conference Series: Materials Science and Engineering, Proceedings of the The 2017 4th International Conference on Advanced Materials, Mechanics and Structural Engineering (4th AMMSE 2017), Tianjin, China, 22–24 September 2017; IOP Publishing: Bristol, UK, 2017; Volume 269, p. 012005. [Google Scholar]
- Yu, D.; Yang, W.; Deng, W.; Zhu, S.; Dai, Q.; Zhang, D. Crack initiation mechanism in casting AC4B aluminum alloy parts with complex structure. Metals 2021, 11, 97. [Google Scholar] [CrossRef]
- Macek, W.; Branco, R.; Szala, M.; Marciniak, Z.; Ulewicz, R.; Sczygiol, N.; Kardasz, P. Profile and areal surface parameters for fatigue fracture characterisation. Materials 2020, 13, 3691. [Google Scholar] [CrossRef] [PubMed]
- Zhang, P.; Zhu, Q.; Chen, G.; Qin, H.Y.; Wang, C.J. Grain size based low cycle fatigue life prediction model for nickel−based superalloy. Trans. Nonferrous Met. Soc. China 2018, 28, 2102–2106. [Google Scholar] [CrossRef]
- Liu, X.L.; Zhao, K.; Liu, C.J. Fatigue behavior and surface sensitivity of board−shaped sample of powder metallurgy FGH 96. 11th Int. Fatigue Cong. 2014, 891, 1723–1728. (In Chinese) [Google Scholar] [CrossRef]
- Zhen, A.; Hao, H.; Li, F.L.; Ruiz, F.; Meng, G.H.; Xv, D.; Jing, C.; Fu, B.Q.; Peng, K. Microstructure and mechanical properties of FGH96 alloy. Rare. Metal. Mat. Eng. 2019, 48, 2297–2304. [Google Scholar]
- Li, B.K.; Ding, W.F.; Yang, C.Y.; Li, C.H. Grindability of powder metallurgy nickel−base superalloy FGH96 and sensibility analysis of machined surface roughness. Int. J. Adv. Manuf. Technol. 2019, 101, 2259–2273. [Google Scholar] [CrossRef]
- Zhou, L.; Wang, H.; Zhang, G.D. Research on low cycle fatigue behavior of powder metallurgy superalloy FGH96. J. Plast. Eng. 2009, 16, 149–154. (In Chinese) [Google Scholar]
- Liu, X.L.; Tao, C.H. Damage behavior and life prediction of FGH96 powder metallurgy superalloy. Fail. Anal. Prev. 2011, 6, 124–129. (In Chinese) [Google Scholar]
- Hu, D.Y.; Wang, T.; Ma, Q.H.; Liu, X.; Shang, L.H.; Li, D.; Pan, J.; Wang, R. Effect of inclusions on low cycle fatigue lifetime in a powder metallurgy nickel−based superalloy FGH96. Int. J. Fatigue 2019, 118, 237–248. [Google Scholar] [CrossRef]
- Basquin, O.H. The exponential law of endurance tests. ASTM Proc. 1910, 10, 625–630. [Google Scholar]
- Manson, S.S. Behaviour of Materials under Condition of the Thermal Stress; NACA TN−2933; NTRS: Washington, DC, USA, 1954. [Google Scholar]
- Coffin, L.F. A study of the effects of cyclic thermal stresses on a ductile metal. Trans. Am. Soc. Mech. Eng. 1954, 76, 931–950. [Google Scholar]
- Lemaitre, J. A Course on Damage Mechanics; Springer: Berlin/Heidelberg, Germany, 1996. [Google Scholar]

Publisher’s Note: MDPI stays neutral with regard to jurisdictional claims in published maps and institutional affiliations. |
© 2021 by the authors. Licensee MDPI, Basel, Switzerland. This article is an open access article distributed under the terms and conditions of the Creative Commons Attribution (CC BY) license (http://creativecommons.org/licenses/by/4.0/).