Article

Creep Behavior and Microstructural Evolution of Al–Cu–Mg–Ag Alloys with Various High Cu Contents

1
Key Laboratory of Material Physics, Ministry of Education, School of Physics and Microelectronics, Zhengzhou University, Zhengzhou 450001, China
2
College of Basic Sciences, Zhengzhou Institute of Technology, Zhengzhou 450044, China
*
Author to whom correspondence should be addressed.
Metals 2021, 11(3), 487; https://doi.org/10.3390/met11030487
Submission received: 9 February 2021 / Revised: 9 March 2021 / Accepted: 11 March 2021 / Published: 15 March 2021

Abstract

:
The creep behavior and microstructural evolution of three Al–Cu–Mg–Ag alloys with Cu content around its solid solubility limit in Al (5.65 wt %) were investigated at 180–240 °C and applied stress of 150–300 MPa. The creep resistance of aged alloy, which is mainly determined by the number density of Ω phase, is the best for 6.00 wt % Cu, better for 5.30 wt % Cu, and the worst for 5.65 wt % Cu. After solid-solution treatment, the lowest Cu content in the Al matrix for the alloy with 5.65 wt % Cu is observed due to the existence of more residual phases. It results in the lowest number density of Ω phase the following aging and poor creep resistance. Increasing temperature from 180 to 240 °C at the same stress (225 MPa), the steady creep rate of alloys increases by 225 times, which is apparently larger than that (26 times) for increasing stress from 225 to 300 MPa at the same temperature (180 °C). It indicates that the coarsening of the Ω phase with increasing temperature should be more serious than that with increasing stress. The creep mechanism of Al–Cu–Mg–Ag alloy can be attributed to the dislocation climb with the existence of threshold stress.

1. Introduction

With the fast development of aerospace industries, the requirements of the high-temperature performance of supersonic aircraft are increasing [1,2]. The temperature for the covering skin of supersonic aircraft can reach 150 °C in service and even reach 300 °C in some extreme cases, and then it is prone to creep fracture [3,4]. The Al–Cu–Mg–Ag alloy precipitates a fine and uniformly distributed plate-like Ω phase on the {111} planes of the matrix during the aging process, which can significantly enhance the mechanical properties and thermal stability of the alloy [5,6,7,8,9,10]. Compared to the materials, such as titanium alloys and metal matrix composites, the Al–Cu–Mg–Ag alloy has characteristics of good performance/price ratio [11]. Therefore, the Al–Cu–Mg–Ag alloy can meet the elevated-temperature mechanical properties and economic requirements of supersonic aircraft and has broad application prospects.
It is generally accepted that the Ω phase has the same composition as θ′(Al2Cu) phase, and the nucleation and precipitation of the Ω phase are affected by the diffusion of Cu atoms [12,13]. As the main alloying element, the Cu element plays an important part in improving the mechanical properties of Al–Cu–Mg–Ag alloy [11]. Xiao et al. [14] reported that the tensile strength at room temperature and high-temperature both increased with the increase of Cu content from 4 to 8 wt %. In recent years, much research has been carried out on the creep behavior of Al–Cu–Mg–Ag alloy. Reddy et al. [15] found that the creep-resistant property of Al–Cu–Mg alloy was significantly improved by Ag addition. The results from Skrotzki [16] revealed that the stable microstructure of Ω and θ’ phases under the creep conditions of 135 °C/207 MPa and 107 °C/276 MPa resulted in excellent creep resistance of the Al–Cu–Mg–Ag alloy. As reported by Gazizov [17], increasing the strain of plastic deformation of Al–Cu–Mg–Ag alloy prior to artificial aging led to an improvement of the static mechanical properties and reduction of creep resistance. In addition, it was found that the under-aged Al–Cu–Mg–Ag alloy had much superior creep resistance than the peak-aged alloy, which was related to the secondary precipitation of the main strengthening phases Ω and θ’ in the under-aged sample during the creeping process [18,19,20]. It is generally believed that the excess Cu atoms in the alloy will form the residual phases and reduce the number of solid-solution Cu atoms, resulting in a decrease in the number density of strengthening precipitates, such as Ω and θ’. It has been reported that Al–Cu–Mg–Ag alloy containing Sc with Cu content above its limit solid solubility in Al forms the residual phases, such as Al8-xCu4-xSc [21], also noted as W phase in [22], and AlCuFeMn phase in [23]. Lee et al. [24] found that Al–Cu–Mg–Ag-Sc-Zr alloy had lower tensile strength and hardness compared to Al–Cu–Mg–Ag alloy, which should be caused by the decreasing Cu concentration in the Al matrix due to the formation of the W (AlCuSc) phase. Lower Cu solute atoms in the Al matrix could result in the lower density of Ω and θ’ strengthening precipitates. Therefore, the mechanical properties of the alloys with Cu content close to its solid solubility limit are considered to be reduced, and the effects of Cu content on the creep behavior of Al–Cu–Mg–Ag alloy for the Cu content near or above its solid solubility limit in Al (5.65 wt %) have not received much attention.
The objective of this study is to investigate the effects of Cu content (5.30 wt %, 5.65 wt %, 6.00 wt %) near its solid solubility limit on the creep behavior of Al–Cu–Mg–Ag alloy. It is well-known that the creep behavior of the material is determined by the creep temperature and applied stress. Therefore, the difference in creep resistant property of three Al–Cu–Mg–Ag alloys and the effects of creep temperature and external stress on the creep behavior were studied using creep tests. Transmission electron microscopy (TEM) was introduced to clarify the microstructure evolution of three alloys. In addition, the creep mechanism and threshold stress of the Al–Cu–Mg–Ag alloy were investigated in detail. This work can provide an important basis for the development and engineering application of the new heat-resistant alloy with high Cu content.

2. Materials and Methods

2.1. Material

The experimental materials Al–xCu–0.4Mg–0.4Ag–0.3Mn–0.1Ti–0.2Zr–0.1Sc with different content of Cu (x = 5.30 wt %, 5.65 wt %, 6.00 wt %) were prepared with pure Al, pure Mg, and Al–50.2Cu, Al–9.71Ag, Al–4.52Zr, Al–10.13Mn, Al–5.05Ti, Al–2.02Sc master alloys by ingot metallurgy in a crucible furnace. The chemical compositions for three alloys are listed in Table 1. The ingot was homogenized at 500 °C for 24 h and then extruded to a round bar with the extrusion ratio of 7:1 at 430 °C. The specimens were cut into the tensile dog-bone-shaped specimens with a gauge cross-section of 4.0 mm × 3.0 mm and a gauge length of 20.0 mm. Finally, these creep specimens were solid solution treated at 515 °C for 2 h; subsequently, water quenched and immediately aged at 180 °C for 8 h (under-aged condition).

2.2. Creep Tests and Microstructural Analysis

The creep tests were performed on the MTS GWT1304 at 180 °C, 200 °C, 220 °C and 240 °C and the stress range from 150 to 300 MPa, for dwell time up to 50 h unless the specimens were ruptured within 50 h. During the creep testing, the samples were tested with temperature stability of ±1 °C after a soak at the testing temperature for 0.5 h to ensure a uniform temperature.
Microstructural characterizations were conducted by transmission electron microscope (TEM, JEM-2100 F, Japan) operating at 200 kV. The specimens were mechanically thinned to 60 μm and then electro-polished using twin-jet equipment with a mixture of 70% methanol acid and 30% nitric, operated at about −30 °C, and a voltage of 15 V. Quantitative measures of the average diameter and number density of Ω phases were determined by the Image-Pro Plus (IPP) software, and at least 10 fields for each sample were analyzed. The backscattered electron images were observed by scanning electron microscope (SEM, Helios G4 CX), and the compositions of residual particles were distinguished by an energy-dispersive spectrometer (EDS).

3. Results and Discussion
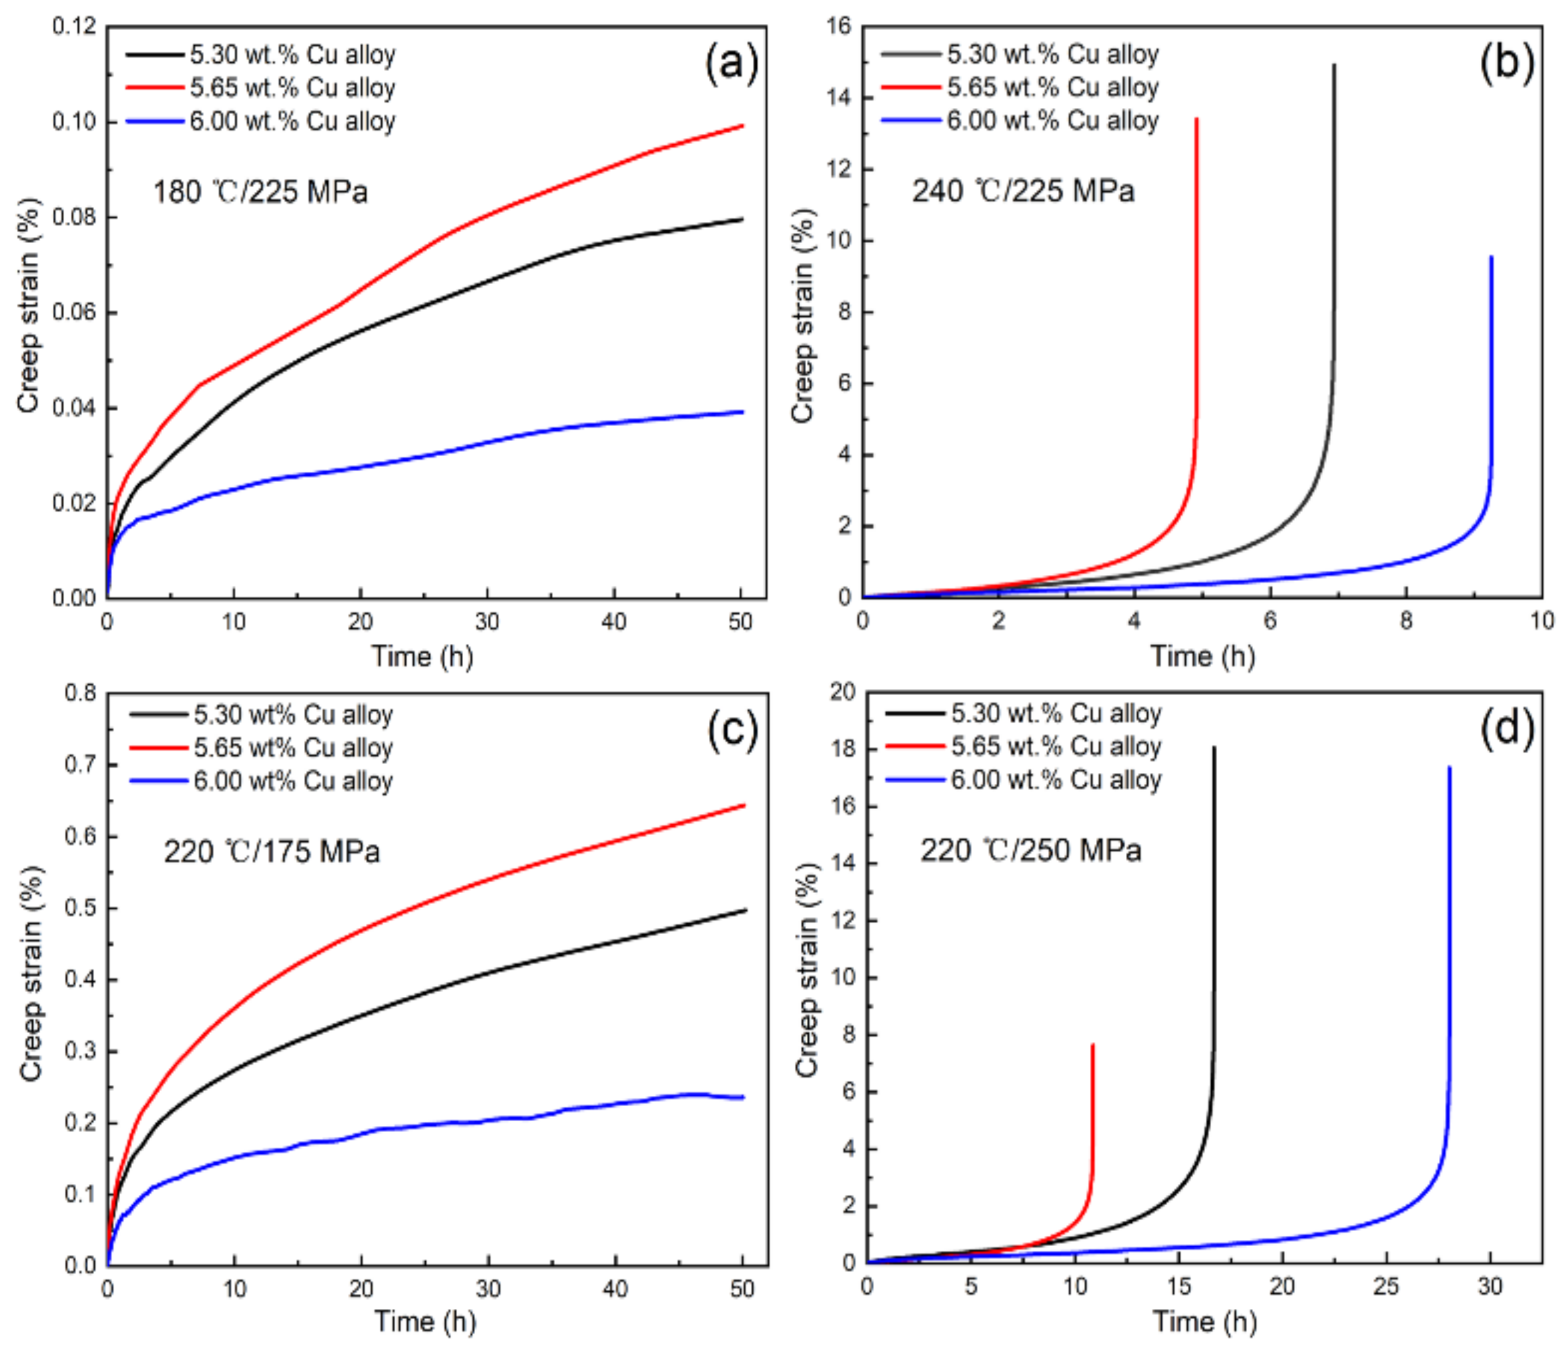
3.1. Creep Behavior

Figure 1 shows the creep curves of three Al–Cu–Mg–Ag alloys test at 180 °C and 240 °C with the same stress of 225 MPa, 175 MPa and 250 MPa with the same temperature of 220 °C, respectively. It can be seen that when the creep temperature or creep stress is low, the creep curves show the occurrence of a short primary stage of creep, which lasts for about 10 h, followed by the steady creep stage (Figure 1a,c). When the creep temperature or creep stress is high, three alloys all fracture at different times (Figure 1b,d).
The corresponding creep properties of three alloys under different creep conditions are summarized in Table 2. It can be seen that the alloy with 6.00 wt % Cu exhibits the best creep resistant properties due to the lowest creep strain and longest creep life compared to the alloys with 5.30 wt % Cu and 5.65 wt % Cu.
During the creep process, the plastic deformation of the alloy mainly occurs in the steady stage, and temperature and stress have an important influence on the steady creep rate. Table 3 lists the steady creep rates of three Al–Cu–Mg–Ag alloys creeping at different conditions. It can be seen that the steady creep rates increase with increasing external stress or creep temperature and maintain at 1 × 10⁻⁸ ~1 × 10⁻⁵ s−1. Besides, the steady creep rate of the alloy with 6.00 wt % Cu is 9.67 × 10⁻⁸ s−1 at 180 °C under 225 MPa. It increases to be 2.59 × 10⁻⁶ s−1 with increasing stress to 300 MPa at the same temperature of 180 °C, which increases by 26 times. With increasing temperature to 240 °C instead of increasing stress, it is 2.19 × 10⁻⁵ s−1, which increases by 225 times. Similar results are obtained for alloys with 5.30 wt % Cu and 5.65 wt % Cu, indicating that the creep temperature has greater effects on the creep resistance than the external stress.
It can also be seen from Table 3 that the steady creep rates of the alloy with 6.00 wt % Cu are always the lowest, which are 26–151% lower than those of the alloy with 5.30 wt % Cu and 87–408% lower than those of the alloy with 5.65 wt % Cu under different creep conditions, respectively. Therefore, according to the creep strain, steady creep rate and creep life, the order of the creep resistance of three alloys is the alloy with 6.00 wt % Cu> the alloy with 5.30 wt % Cu> the alloy with 5.65 wt % Cu.

3.2. Microstructural Evolution

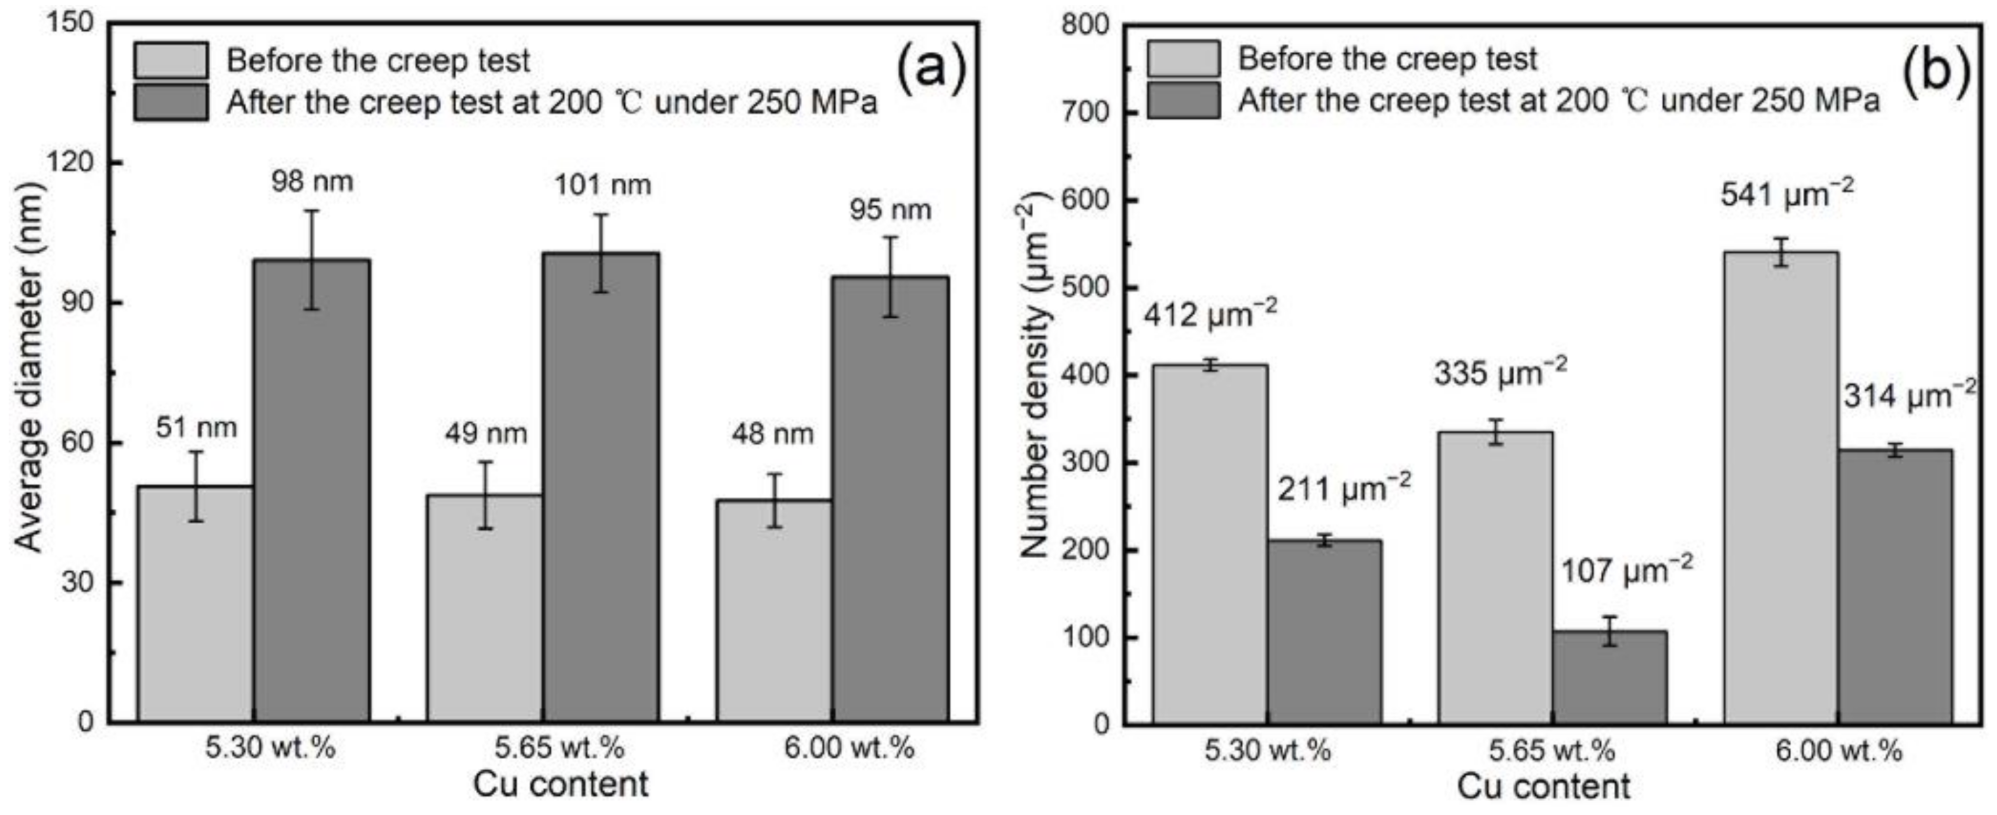
3.2.1. The Effect of Cu Content on the TEM Microstructure

Figure 2 reveals the TEM images of three Al–Cu–Mg–Ag alloys before and after the creep test at 200 °C under 250 MPa, and the electron beam is close to <110>α. The corresponding quantitative analysis results of the Ω phases evolution are given in Figure 3. Before the creep test, a large number of fine and uniformly distributed Ω phases are dominant in three Al–Cu–Mg–Ag alloys, and strong diffraction spots are observed at the 1/3 and 2/3{022} α-Al positions in corresponding selected-area electron diffraction (SED) patterns. As shown in Figure 3, there is almost no difference in the average diameter of the Ω phase in three alloys (about 50 nm), but the number density of the Ω phases has a big difference before the creep test, the number density of Ω phases in the alloy with 6.00 wt % Cu is the largest in three alloys, followed by the alloy with 5.30 wt % Cu, and the lowest is that of the alloy with 5.65 wt % Cu. The order of number density of Ω phases in the alloy is consistent with the creep resistance, as shown in Table 2 and Table 3.
Therefore, the creep resistance of alloy has a close relationship with the Ω phases. In the creep test, the Ω phases in the alloy will be coarsening or partially dissolved, which is affected by the creep temperatures and the applied stresses. As shown in Figure 3, the average diameter of the Ω phases increases to 98 nm, 101 nm and 95 nm in three alloys with 5.30 wt % Cu, 5.65 wt % Cu and 6.00 wt % Cu after 50 h of creep at 200 °C and 250 MPa, respectively. Meanwhile, the number density of the Ω phases rapidly drops to 211 ± 7 μm−2, 107 ± 17 μm−2 and 314 ± 7 μm−2 in three alloys, respectively. By contrast, the thickness of the Ω phase remains stable during the creep test. It increases from about 2 nm to about 3–4 nm, which can be confirmed from the high-resolution TEM (HRTEM) images in Figure 4, indicating that the Ω phases have good thermal stability at high temperatures, and this is consistent with some research results [25,26,27,28].
In addition to good thermal stability, the Ω phases, as an aging strengthening phase, also have a strong pinning effect on the dislocation and impede the deformation during the creep process [14,15,16,17,18,19,20]. Therefore, the good thermal stability and high deformation resistance of Ω phases make the Al–Cu–Mg–Ag alloy possess good creep resistance. The more the Ω phases in the alloy, the better the creep resistance of the alloy. The number density of the Ω phases in the alloy with 6.00 wt % Cu is higher than that in the other two alloys. As a result, the alloy with 6.00 wt % Cu exhibits the best creep resistant properties compared to the alloy with 5.30 wt % Cu and the alloy with 5.65 wt % Cu, as shown in Figure 1 and Table 2 and Table 3. Therefore, the order of the creep resistance of alloy consistent with the number density of the Ω phases in the alloy is: the alloy with 6.00 wt % Cu> the alloy with 5.30 wt % Cu> the alloy with 5.65 wt % Cu. However, these orders are not consistent with the Cu content in the alloy. Compare with the alloy with 5.65 wt %, the alloy with 5.30 wt % Cu has the lowest Cu content but has a higher number density and better creep resistance.

3.2.2. The Effect of Cu Content on the SEM Microstructure

In order to investigate the cause of the inconsistency between the orders of the Cu content and the number density of Ω phases of three alloys, the backscattered electron (BSE) images of three Al–Cu–Mg–Ag alloys after solid solution treatments are presented in Figure 5. Less residual phases form in the alloy with 5.30 wt % Cu. With the Cu content increase to 5.65 wt % Cu and 6.00 wt % Cu, a larger number of residual phases are clearly found in the alloys. Compared with the alloy with 5.65 wt % Cu, the alloy with 6.00 wt % Cu has smaller and fewer residual phases. The EDS analysis of these residual phases is listed in Table 4 and indicates they are mainly composed of two phases: W phase (Al8−xCu4+xSc) (signed A and C in Figure 5) and AlCuMnFe phase (signed B and D in Figure 5).
The W phase (Al8−xCu4+xSc) and AlCuMnFe phase in the solid solution alloys are transformed from the AlCu phase containing Sc, Zr or Mn, Fe, which form during non-equilibrium solidification [21,22,23,29]. During the homogenization and solid solution treatment, most of this AlCu phase dissolves into the matrix and leads to the increase of Cu, Sc, Zr, Mn Fe content in the matrix. Meanwhile, part of the AlCu phases with higher alloy content will be transformed into W phases (Al8−xCu4+xSc) or AlCuMnFe phases by supplying alloy atoms from the matrix. Moreover, Sc and Zr addition in Al alloys will form secondary Al3(Sc, Zr) precipitates with a diameter of about 10 nm during aging at a temperature higher than 300 °C, which can apparently increase the mechanical property at both ambient and relatively high temperatures [30,31]. The absence of nanosized Al3(Sc, Zr) precipitates in the present work should be caused by the low aging temperature. Therefore, the contribution of the Al3(Sc, Zr) phase to creep resistance cannot be the dominating strengthening factor.
Due to the Cu content in the alloy with 5.30 wt % Cu below the solid solubility limit of Cu in Al, fewer residual phases remain in the alloy, as shown in Figure 5a. However, when the Cu content in the alloy increases to 5.65 wt % Cu, which is about the solid solubility limit of Cu in Al, a large number of AlCu phases will be formed during the solidification process. These AlCu phases cannot be completely dissolved in the subsequent heat treatment process, which results in more residual phases and less solid-solution Cu atoms, as shown in Figure 5b and Table 4. Therefore, the lower number density of Ω phases can be formed in the alloy with 5.65 wt % Cu, compared with the alloy with 5.30 wt % Cu, as shown in Figure 3b.
However, the alloy with higher Cu content (6.00 wt % Cu) forms fewer residual phases than that in the alloy with lower Cu content (5.65 wt % Cu). This abnormal residual phase content in the alloys with 5.65 wt % Cu and 6.00 wt % Cu closely relates to the dissolubility of the AlCu phases. During the solidification process, the alloy with a higher Cu content (6.00 wt % Cu) should form more AlCu phases than the alloy with a lower Cu content (5.65 wt %). However, because the contents of other alloying elements (Sc, Zr, Mn, Fe) in the alloy are equal, as shown in Table 1. Therefore, more AlCu phases form in the alloy with 6.00 wt % Cu will lead to a lower content of Mn, Fe and Sc, Zr in the AlCu phases, as shown in Table 4. Therefore, compared with an alloy containing 5.65 wt % Cu, AlCu phase in alloy with 6.00 wt % Cu has good dissolubility and is easy to dissolve in the matrix during both homogenization (500 °C for 24 h) and solid solution process (515 °C for 2 h), resulting in less and smaller W phases (Al8−xCu4+xSc) or AlCuMnFe phases, as shown in Figure 5c. Therefore, the Al matrix of the alloy with 6.00 wt % Cu has a higher Cu content. Correspondingly, the low Cu content in the Al matrix of the alloy with 5.65 wt % Cu is due to the residual phase with relatively high alloy content, which is difficult to dissolve, as shown in Figure 5b.
In this way, the Cu content in the alloy determines the characteristics of the residual phases in the alloy (that is, the size and the content of insoluble alloying elements) and the dissolubility of the residual phases, which determines the level of Cu content in Al matrix after solution treatment. As a result, the Cu content in the Al matrix is 4.3 wt %, 4.0 wt % and 4.8 wt % in three alloys with 5.30 wt % Cu, 5.65 wt % Cu and 6.00 wt % Cu, respectively (signed E in Figure 5a, F in Figure 5b and G in Figure 5c, respectively). Therefore, the order of number density of Ω phases in the alloy is consistent with the Cu content in the Al matrix in the solid solution alloys, as follows: the alloy with 6.00 wt % Cu> the alloy with 5.30 wt % Cu> the alloy with 5.65 wt % Cu, so as the order of the creep resistance, as shown in Figure 3 and Table 2 and Table 3. In summary, the higher the Cu content in the Al matrix in the solid solution alloy, the higher the number density of Ω phases after aging, the better creep resistance of the alloy.

3.2.3. The Effect of Creep Temperature and Creep Stress on the TEM Microstructure

Figure 6 exhibits the TEM images of the alloy with 6.00 wt % Cu tests at 180 °C under 225 MPa, 180 °C under 300 MPa, 240 °C under 225 MPa and the corresponding quantitative analysis of the Ω phases. It can be seen that the Ω phases have various degrees of coarsening and reduction in number density under three creep conditions. As shown in Figure 6d, the average diameter of the Ω phases increases by 27% (from 78 nm to 99 nm) when the alloy creeps from 225 MPa to 300 MPa under 180 °C, while it increases by 88% (from 78 nm to 147 nm) when the alloy creeps from 180 °C to 240 °C under 225 MPa. Moreover, the number density of the Ω phases drops dramatically for the alloy tests at higher temperatures.
From the results of Table 3 and Figure 6, it can be concluded that both the high-temperature and external stress can cause the growth and dissolution of Ω phases during the creep process. The coarsening of the Ω phase accelerates, and its effect on hindering the movement of dislocations weakens with the increase of creep temperature or external stress, which leads to poor creep resistant property of Al–Cu–Mg–Ag alloy. The work of Liu [20] shows that the creep temperature has fewer effects on the creep resistance of Al–Cu–Mg–Ag alloy creeps at 100–150 °C compared to the external stress, which profits from the good thermal stability of Ω phase at these temperatures. However, the creep temperature has greater effects on the creep behavior than the external stress in the present experimental conditions (180–240 °C). This is mainly due to the fact that the coarsening of the Ω phase is more sensitive to the temperature than to the stress when the alloy creeps at elevated temperature, as shown in Figure 6.

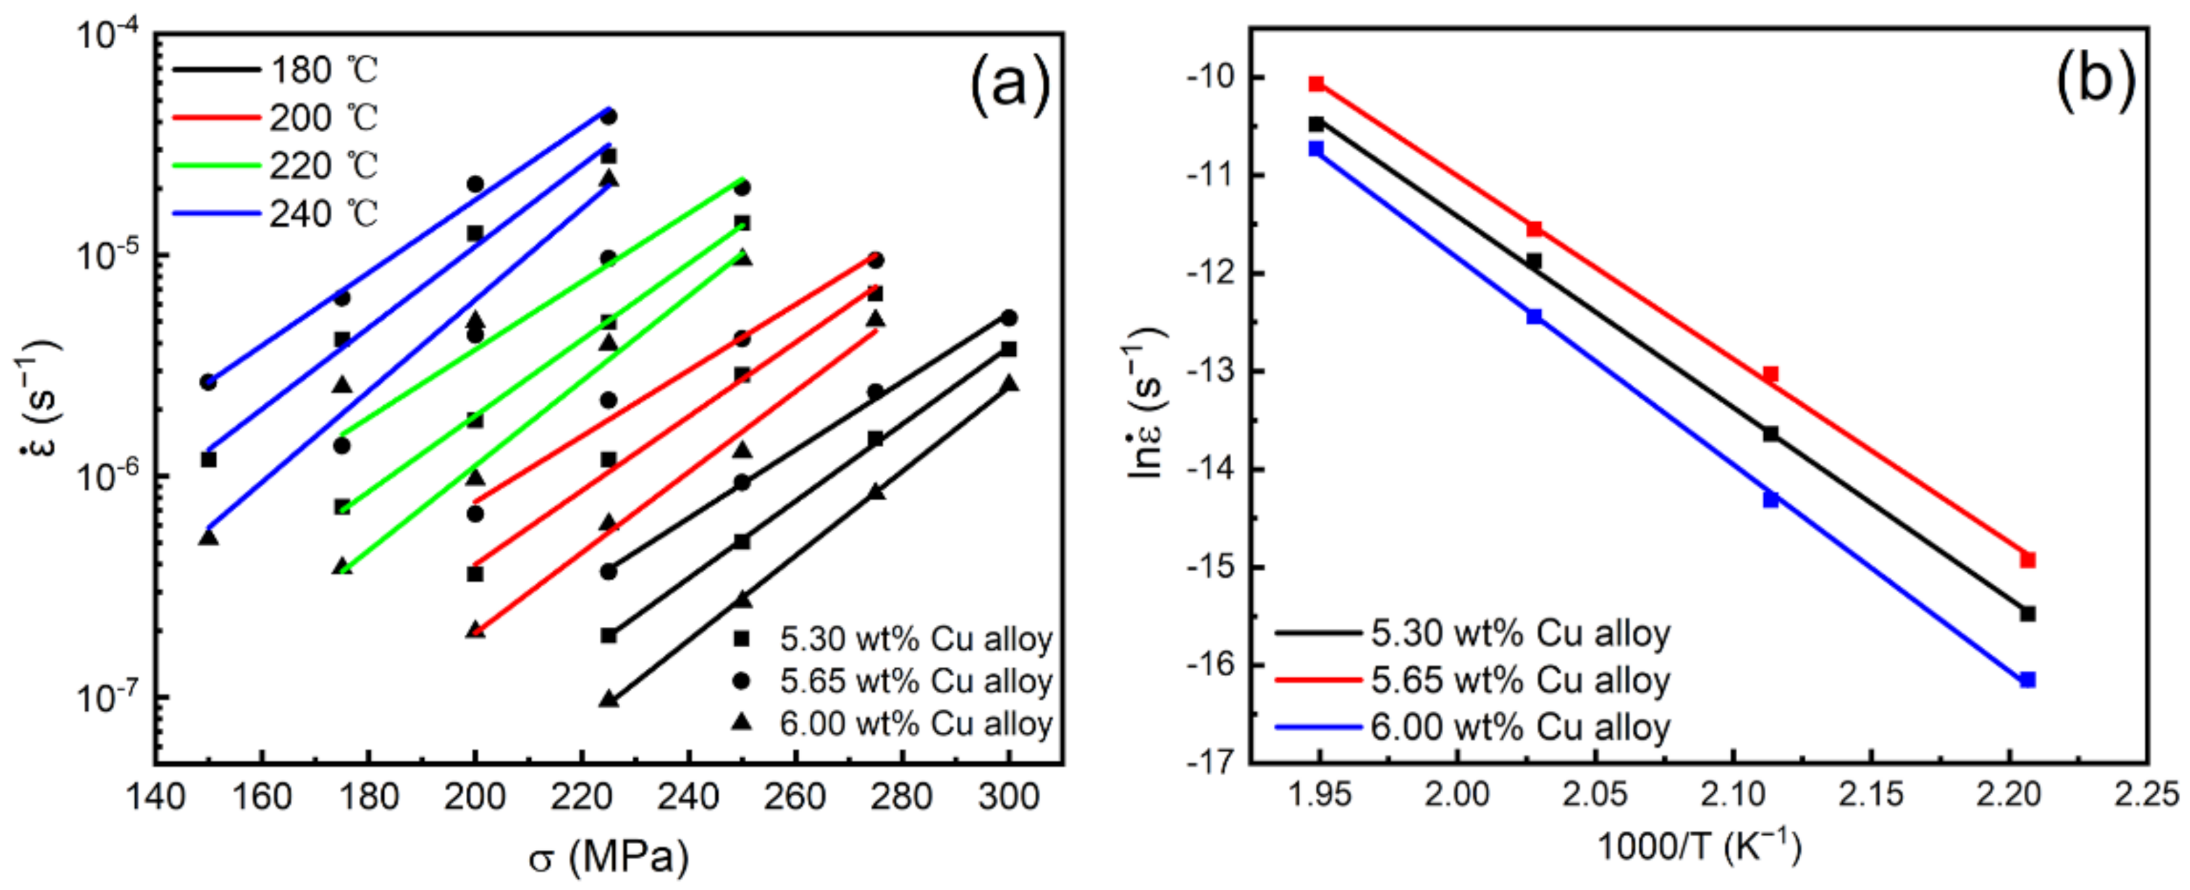
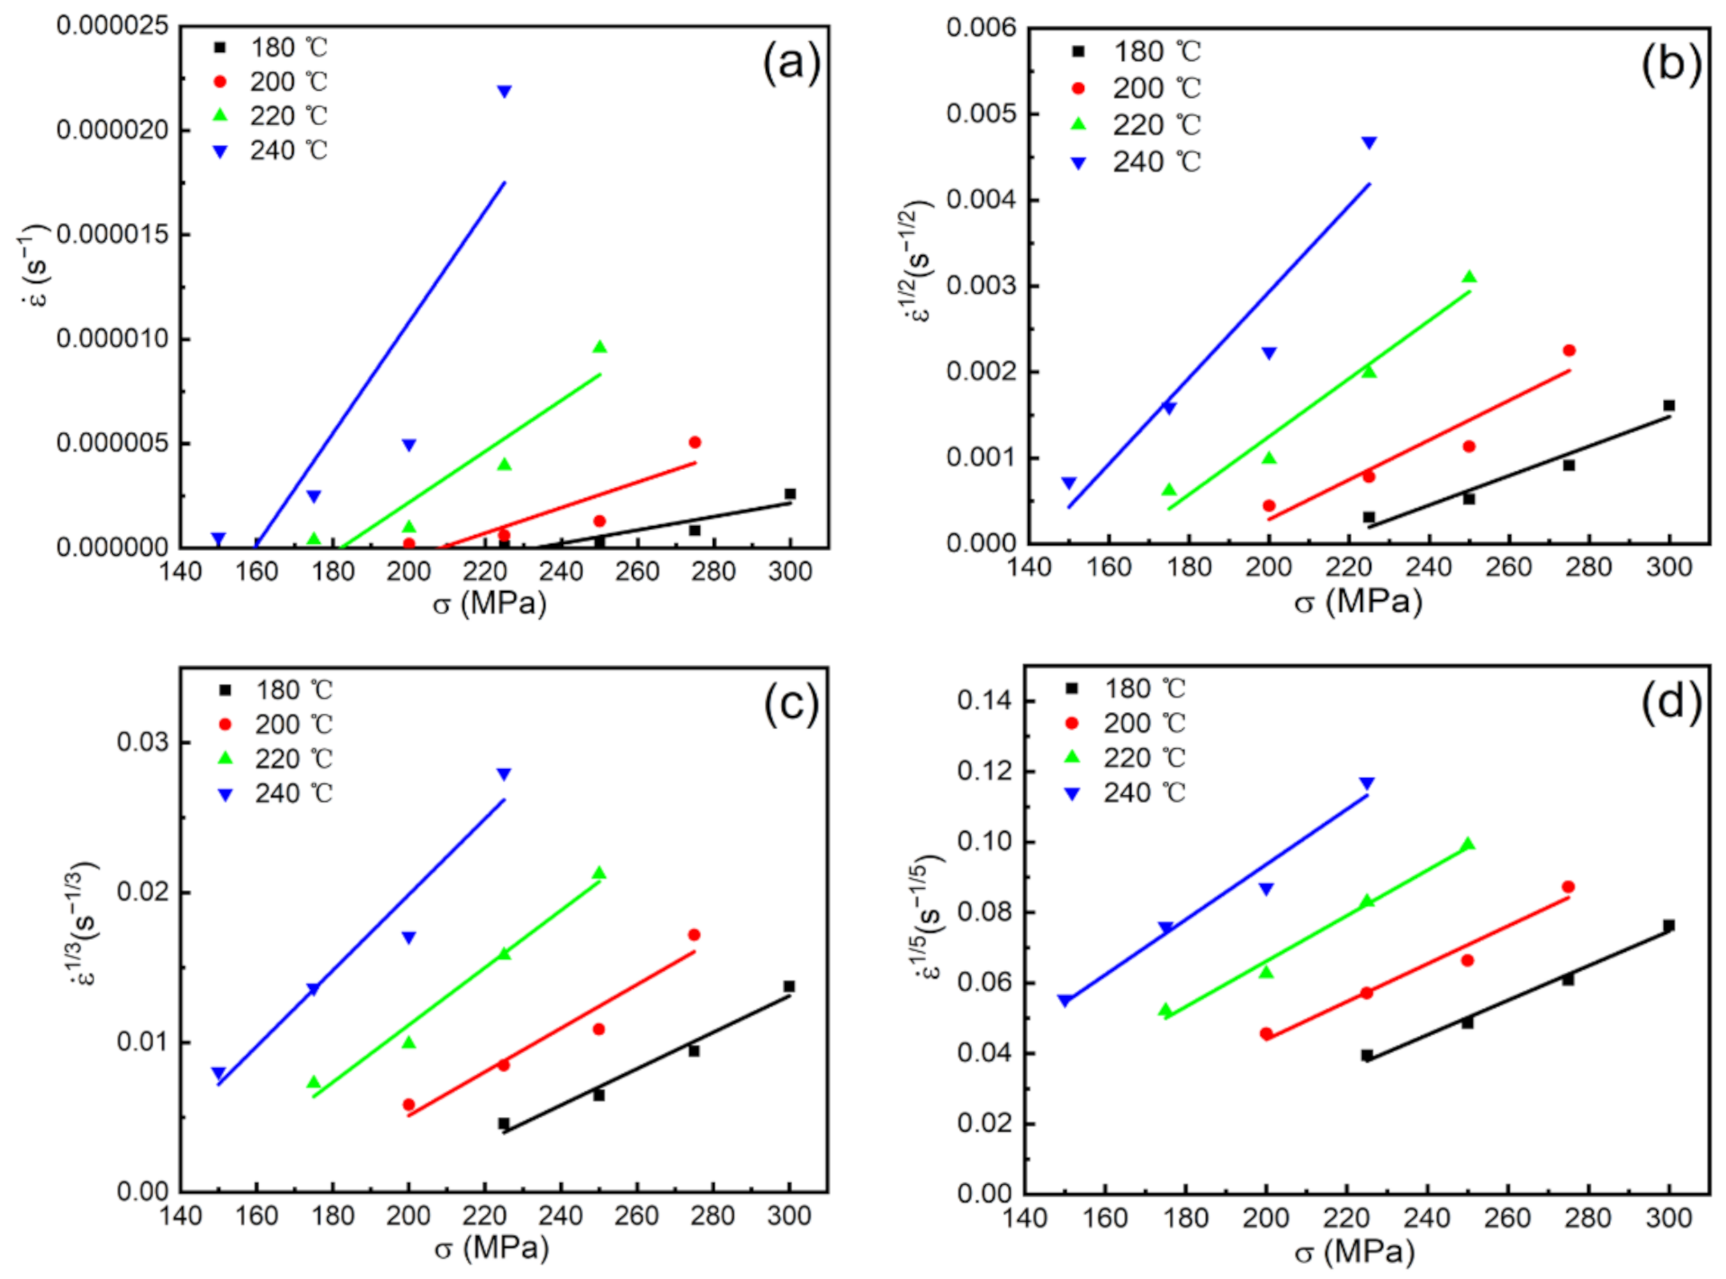
3.3. Creep Mechanism and Threshold Stress

The relationship between the steady creep rate and applied stress can be described by a power-law equation as follows [20]:
ε ˙ = A σ n e x p Q a R T
where ε ˙ is the steady creep rate, A is a structure-dependent constant, σ is the applied stress, n and Q a are the apparent stress exponent and apparent activation energy, respectively, R and T are the gas constant and absolute temperature, respectively.
Figure 7a presents the variation of the steady creep rate with the applied stress for three Al–Cu–Mg–Ag alloys at 180 °C, 200 °C, 220 °C and 240 °C, respectively. The values of the apparent stress exponent can be calculated from the slopes of the linear regression lines for the logarithmic plots of ε ˙ versus σ, as indicated by Equation (1). The apparent stress exponents of three alloys with 5.30 wt % Cu, 5.65 wt % Cu and 6.00 wt % Cu at 180 °C, 200 °C, 220 °C and 240 °C are 10.4, 9.1, 8.3, 7.9; 9.7, 8.1, 7.5, 7.0 and 11.4, 9.8, 9.3, 8.8, respectively. Figure 7b displays the linear relation between the logarithm of the steady creep rate and the reciprocal of temperature for three Al–Cu–Mg–Ag alloys at a constant stress of 225 MPa. The Q a Q a = R l n ε ˙ /   1 / T of three alloys can be obtained as 162.2 kJ/mol, 155.4 kJ/mol and 175.3 kJ/mol, respectively.
It is noted that the apparent stress exponents and apparent activation energies of three Al–Cu–Mg–Ag alloys are much larger than those of pure Al (4.4 and 142 kJ/mol, respectively), which suggests the existence of a threshold stress σth [32,33,34]. The driving force for creep deformation is the effective stress (σ-σth), so the power-law Equation (1) can be modified by introducing threshold stress as:
ε ˙ = A σ σ th n exp Q R T
where σth is the threshold stress, n is the true stress exponent, Q is the true activation energy, the rest symbols in Equation (2) have the same meanings as indicated in Equation (1).
Assuming that σth independent of the creep stress, if an appropriate value of n can be fitted to a straight line through the data points in the plot of ε ˙ 1 / n versus σ, the threshold stress σth at each temperature can be obtained by extrapolating the linear regression line to the zero-creep rate [32,33,34]. The value of the true stress exponent n can indirectly reflect the creep mechanism [32,33,34,35,36]: n = 1 for diffusional creep, n = 2 for creep controlled by the grain boundary sliding, n = 3 for creep controlled by the dislocation viscous glide process, and n = 5 for creep controlled by the dislocation climb. Figure 8 shows the ε ˙ 1 / n -σ plots of the alloy with 6.00 wt % Cu for n = 1, 2, 3 and 5. The results reveal that the stress exponent of 5 yields the best linear fit of ε ˙ 1 / n versus σ (Pearson’s correlation coefficient r = 0.98~0.99). Similar results are obtained for the alloy with 5.30 wt % Cu and the alloy with 5.65 wt % Cu. It suggests that the creep behavior of the Al–Cu–Mg–Ag alloys are controlled by the dislocation climb mechanism.
Figure 9 shows the relationship between σth and T. It can be seen that the threshold stresses decrease with the increase of temperatures. Moreover, the threshold stresses of three alloys are ranked as the alloy with 6.00 wt % Cu> the alloy with 5.30 wt % Cu> the alloy with 5.65 wt % Cu. This is in good accordance with the results of Figure 1 and Table 2 and Table 3.

4. Conclusions

The creep behavior and microstructural evolution of three Al–Cu–Mg–Ag alloys with various high Cu contents around its solid solubility limit in Al (5.65 wt %) were investigated. The following conclusions can be drawn:
(1)
The creep resistance of the aged alloy is the best for 6.00 wt % Cu, better for 5.30 wt % Cu, and the worst for 5.65 wt % Cu. It is mainly determined by the difference of density number of Ω phase;
(2)
The density number of the Ω phase depends on the content of Cu in Al matrix in solid solution alloys, rather than the total Cu content in alloys. The difference of the content of Cu in the Al matrix should be determined by both the content and solubility of residual phases formed during non-equilibrium solidification;
(3)
Both high temperature and external stress have significant effects on the creep behavior of aged alloys. The coarsening of Ω phase is more sensitive to the temperature between 180 and 240 °C and has a greater effect on the creep behavior compared to the applied stress;
(4)
By introducing the threshold stress into the power-law equation, the true stress exponent n is confirmed to be 5. It suggests that the creep mechanism of Al–Cu–Mg–Ag alloy can be attributed to being the dislocation climb mechanism with the existence of threshold stress.

Author Contributions

Conceptualization, J.W.; data curation, F.P.; funding acquisition, B.C.; investigation, F.P. and Y.X.; methodology, F.P., Y.X. and G.Z.; supervision, J.W. and R.Y.; writing—original draft, F.P.; writing—review and editing, J.W. and R.Y. All authors have read and agreed to the published version of the manuscript.

Funding

This work was supported by the National Natural Science Foundation of China (Grant No. 11974316).

Institutional Review Board Statement

Not applicable.

Informed Consent Statement

Not applicable.

Data Availability Statement

Date sharing not applicable.

Conflicts of Interest

The authors declare no conflict of interest.

References

  1. Belov, V.V. Thermal stresses in the structural elements of the supersonic aircraft cockpit. AIP Conf. Proc. 2019, 2125, 1–9. [Google Scholar] [CrossRef]
  2. Xu, Y.; Han, Z.H.; You, Y.C.; Chen, L. Progress and challenges of next generation green supersonic civil aircraft. Chin. Sci. Bull. 2020, 65, 127–133. [Google Scholar] [CrossRef] [Green Version]
  3. Huda, Z.; Zaharinie, T.; Min, G.J. Temperature effects on material behavior of aerospace aluminum alloys for subsonic and supersonic Aircraft. J. Aerosp. Eng. 2010, 23, 124–128. [Google Scholar] [CrossRef]
  4. Robinson, J.S.; Cudd, R.L.; Evans, J.T. Creep resistant aluminium alloys and their applications. Mater. Sci. Technol. 2003, 19, 143–155. [Google Scholar] [CrossRef]
  5. Gazizov, M.; Kaibyshev, R. Precipitation structure and strengthening mechanisms in an Al-Cu-Mg-Ag alloy. Mater. Sci. Eng. A 2017, 702, 29–40. [Google Scholar] [CrossRef]
  6. Bai, S.; Ying, P.Y.; Liu, Z.Y.; Wang, J.; Li, J.L. Quantitative transmission electron microscopy and atom probe tomogra-phy study of Ag-dependent precipitation of Ω phase in Al-Cu-Mg alloys. Mater. Sci. Eng. A 2017, 687, 8–16. [Google Scholar] [CrossRef]
  7. Liu, X.Y.; Pan, Q.L.; Lu, Z.L.; Cao, S.F.; He, Y.B.; Li, W.B. Microstructure and mechanical properties of Al-Cu-Mg-Ag alloy during thermal exposed at elevated temperature. Adv. Mater. Res. 2010, 152–153, 1426–1436. [Google Scholar] [CrossRef]
  8. Bai, S.; Zhou, X.W.; Liu, Z.Y.; Xia, P.; Liu, M.; Zeng, S. Effects of Ag variations on the microstructures and mechanical properties of Al–Cu–Mg alloys at elevated temperatures. Mater. Sci. Eng. A 2014, 611, 69–76. [Google Scholar] [CrossRef]
  9. Zhemchuzhnikova, D.A.; Gazizov, M.R.; Kaibyshev, R.O. Crack resistance of an alloy of the Al–Cu–Mg–Ag system. Met. Sci. Heat Treat. 2017, 59, 498–503. [Google Scholar] [CrossRef]
  10. Wang, J.; Liu, Z.Y.; Bai, S.; Cao, J.; Zhao, J.G.; Zeng, D.P. Microstructure and Three-Point Bending Fatigue Behavior of Al-Cu-Mg-Ag Alloys with Various Mg Contents. J. Mater. Eng. Perform. 2019, 28, 6614–6625. [Google Scholar] [CrossRef]
  11. Polmear, I.J.; Pons, G.; Barbaux, Y.; Octor, H.; Sanchez, C.; Morton, A.J.; Borbidge, W.E.; Rogers, S. After Concorde: Evaluation of creep resistant Al–Cu–Mg–Ag alloys. Mater. Sci. Technol. 1999, 15, 861–868. [Google Scholar] [CrossRef]
  12. Chang, Y.C.; Howe, J.M. Composition and stability of Ω phase in an Al-Cu-Mg-Ag Alloy. Metall. Mater. Trans. A 1993, 24, 1461–1470. [Google Scholar] [CrossRef]
  13. Reich, L.; Murayama, M.; Hono, K. Evolution of Ω phase in an Al–Cu–Mg–Ag alloy—A three-dimensional atom probe study. Acta Mater. 1998, 46, 6053–6062. [Google Scholar] [CrossRef]
  14. Xiao, D.H.; Wang, J.N.; Ding, Y.D.; Chen, S.P. Effect of Cu content on the mechanical properties of an Al-Cu-Mg-Ag alloy. J. Alloys Compd. 2002, 343, 77–81. [Google Scholar] [CrossRef]
  15. Reddy, A.S. Fatigue and creep deformed microstructures of aged alloys based on Al–4%Cu–0.3%Mg. Mater. Des. 2008, 29, 763–768. [Google Scholar] [CrossRef]
  16. Skrotzki, B.; Hargarter, H.; Atarke, E.A., Jr. Microstructural stability under creep conditions of two Al-Cu-Mg-Ag alloys. Mater. Sci. Forum 1996, 217-222, 1245–1250. [Google Scholar] [CrossRef]
  17. Gazizov, M.; Zuiko, I.; Kaibyshev, R. Effect of cold plastic deformation prior to ageing on creep resistance of an Al-Cu-Mg-Ag alloy. Mater. Sci. Forum 2014, 794-796, 278–283. [Google Scholar] [CrossRef]
  18. Lumley, R.N.; Morton, A.J.; Polmear, I.J. Enhanced creep performance in an Al-Cu-Mg-Ag alloy through underageing. Acta Mater. 2002, 50, 3597–3608. [Google Scholar] [CrossRef]
  19. Liu, P.; Liu, X.Y.; Cui, Z.H.; Gao, F. Effect of aging treatment on the creep resistance of Al-Cu-Mg-Ag alloy. IOP Conf. Ser. Mater. Sci. Eng. 2018, 452, 022149. [Google Scholar] [CrossRef]
  20. Liu, X.Y.; Pan, Q.L.; Zhang, X.L.; Liang, S.H.; Gao, F.; Zheng, L.Y.; Li, M.X. Creep behavior and microstructural evolution of deformed Al–Cu–Mg–Ag heat resistant alloy. Mater. Sci. Eng. A 2014, 599, 160–165. [Google Scholar] [CrossRef]
  21. Bai, S.; Yi, X.L.; Liu, G.H.; Liu, Z.Y.; Wang, J.; Zhao, J.G. Effect of Sc addition on the microstructures and age-hardening behavior of an Al–Cu–Mg–Ag alloy. Mater. Sci. Eng. A 2019, 756, 258–267. [Google Scholar] [CrossRef]
  22. Gazizov, M.; Teleshov, V.; Zakharov, V.; Kaibyshev, R. Solidification behaviour and the effects of homogenisation on the structure of an Al-Cu-Mg-Ag-Sc alloy. J. Alloys Compd. 2011, 509, 9497–9507. [Google Scholar] [CrossRef]
  23. Bai, S.; Huang, T.T.; Xu, H.; Liu, Z.Y.; Wang, J.; Yi, X.L. Effects of small Er addition on the microstructural evolution and strength properties of an Al–Cu–Mg–Ag alloy aged at 200 °C. Mater. Sci. Eng. A 2019, 766, 138351. [Google Scholar] [CrossRef]
  24. Lee, L.S.; Wu, C.T.; Chen, Y.D. Effects of Minor Sc and Zr on the Microstructure and Mechanical Properties of Al-4.6Cu-0.3Mg-0.6Ag Alloys. J. Mater. Eng. Perform. 2015, 24, 1165–1172. [Google Scholar] [CrossRef]
  25. Xia, Q.K.; Liu, Z.Y.; Li, Y.T. Microstructure and properties of Al-Cu-Mg-Ag alloy exposed at 200 ℃ with and without stress. Trans. Nonferr. Met. Soc. China 2008, 18, 789–794. [Google Scholar] [CrossRef]
  26. Song, S.Y.; Gao, D.L.; Feng, C.; Liu, Z.Y. Effects of thermal exposure on the mechanical properties and microstructure stability of an Al-Cu-Mg-Ag Alloy. Adv. Mater. Res. 2012, 554–556, 671–681. [Google Scholar] [CrossRef]
  27. Song, Y.F.; Pan, Q.L.; Wang, Y.; Li, C.; Feng, L. Elevated-temperature mechanical properties and thermal stability of Al-Cu-Mg-Ag heat-resistant alloy. J. Cent. South Univ. 2014, 21, 3434–3441. [Google Scholar] [CrossRef]
  28. Gu, Y.X.; Liu, Z.Y.; Yu, D.E.; Liu, B.B.; Lin, M.; Zeng, S.M. Growth of Ω plates and its effect on mechanical properties in Al-Cu-Mg-Ag alloy with high content of silver. J. Mater. Eng. Perform. 2013, 22, 1708–1715. [Google Scholar] [CrossRef]
  29. Yang, R.B.; Zhi, Q.; Wang, F.Z.; Zhang, Y.J.; Liu, Z.X.; Wang, J.F.; Tan, X.R.; Chen, Y.D.; Cao, Y.J. Effects of enhanced solution treatment on microstructure and mechanical properties of Al-Cu-Li-Sc alloy. Mater. Sci. Technol. 2018, 34, 1201–1211. [Google Scholar] [CrossRef]
  30. Booth-Morrison, C.; Mao, Z.; Diaz, M.; Dunand, D.C.; Wolverton, C.; Seidman, D.N. Role of silicon in accelerating the nucleation of Al3(Sc, Zr) precipitates in dilute Al–Sc–Zr alloys. Acta Mater. 2012, 60, 4740–4752. [Google Scholar] [CrossRef]
  31. Guan, R.G.; Shen, Y.F.; Zhao, Z.Y.; Wang, X. A high-strength, ductile Al-0.35Sc-0.2Zr alloy with good electrical conductivity strengthened by coherent nanosized-precipitates. J. Mater. Sci. Technol. 2017, 33, 215–223. [Google Scholar] [CrossRef]
  32. Li, W.J.; Cai, B.; Wang, Y.C.; Liu, Z.X.; Yang, S. Creep of Al–0.2Sc–0.04Zr alloys after different cold-rolling and ageing combinations. Mater. Sci. Eng. A 2014, 615, 148–152. [Google Scholar] [CrossRef]
  33. Zhao, W.G.; Wang, J.G.; Zhao, H.L.; Yao, D.M.; Jiang, Q.C. High creep resistance behavior of the cast Al–Cu alloy modified by nano-scale PrxOy. Mater. Sci. Eng. A 2009, 515, 10–13. [Google Scholar] [CrossRef]
  34. Tian, W.S.; Zhao, Q.L.; Zhang, Q.Q.; Qiu, F.; Jiang, Q.C. Superior creep resistance of 0.3 wt.% nano-sized TiCp/Al-Cu composite. Mater. Sci. Eng. A 2017, 700, 42–48. [Google Scholar] [CrossRef]
  35. Zhang, P. Creep behavior of the die-cast Mg-Al alloy AS21. Scr. Mater. 2005, 52, 277–282. [Google Scholar] [CrossRef]
  36. Latha, S.; Mathew, M.D.; Parameswaran, P.; Bhanu Sankara Rao, K.; Mannan, S.L. Thermal creep properties of alloy D9 stainless steel and 316 stainless steel fuel clad tubes. Int. J. Press. Vessel. Pip. 2008, 85, 866–870. [Google Scholar] [CrossRef]
Figure 1. Creep curves of three Al–Cu–Mg–Ag alloys under different creep conditions: (a) 180 °C/225 MPa, (b) 240 °C/225 MPa, (c) 220 °C/175 MPa, and (d) 220 °C/250 MPa.
Metals 11 00487 g001
Figure 2. Bright-field TEM images and corresponding selected-area electron diffraction patterns of three Al–Cu–Mg–Ag alloys. All images are taken with the electron beam closed to the <110>α zone axis. Before the creep test: (a) 5.30 wt % Cu alloy, (b) 5.65 wt % Cu alloy, and (c) 6.00 wt % Cu alloy. After the creep test at 200 °C under 250 MPa: (d) 5.30 wt % Cu alloy, (e) 5.65 wt % Cu alloy, and (f) 6.00 wt % Cu alloy.
Metals 11 00487 g002
Figure 3. Statistical results of (a) average diameter and (b) number density of the Ω phase evolution of three Al–Cu–Mg–Ag alloys before and after the creep test at 200 °C under 250 MPa.
Metals 11 00487 g003
Figure 4. HRTEM images of Ω phases of the alloy with 6.00 wt % Cu (a,b) before, and (c,d) after the creep test at 200 °C under 250 MPa.
Metals 11 00487 g004
Figure 5. Backscattered electron (BSE) images of three Al–Cu–Mg–Ag alloys before the creep test: (a) 5.30 wt % Cu alloy, (b) 5.65 wt % Cu alloy, and (c) 6.00 wt % Cu alloy ( A-G are EDS analysis points).
Metals 11 00487 g005
Figure 6. Bright-field TEM images of the alloy with 6.00 wt % Cu creeps under different conditions: (a) 180 °C/225 MPa, (b) 180 °C/300 MPa, (c) 240 °C/225 MPa, and (d) the corresponding statistical results of the Ω phases of the alloy with 6.00 wt % Cu creeps under different conditions.
Metals 11 00487 g006
Figure 7. (a) The steady creep rate (logarithmic scale) as a function of applied stress (logarithmic scale) of three Al–Cu–Mg–Ag alloys at 180 °C, 200 °C, 220 °C and 240 °C. (b) Variation of the steady creep rate (logarithmic scale) with the reciprocal of the temperature of three Al–Cu–Mg–Ag alloys at 225 MPa.
Metals 11 00487 g007
Figure 8. Plots of ε ˙ 1 / n versus σ for (a) n = 1, (b) n = 2, (c) n = 3, and (d) n = 5 on linear scales for the alloy with 6.00 wt % Cu.
Metals 11 00487 g008
Figure 9. Plots of the threshold stress versus temperature of three Al–Cu–Mg–Ag alloys.
Metals 11 00487 g009
Table 1. Chemical compositions of the present alloys (in wt %).
CuMgAgMnTiZrScAl
5.30 wt % Cu Alloy5.300.400.400.300.100.200.10Bal.
5.65 wt % Cu Alloy5.650.400.400.300.100.200.10Bal.
6.00 wt % Cu Alloy6.000.400.400.300.100.200.10Bal.
Table 2. Creep properties of three Al–Cu–Mg–Ag alloys under different creep conditions indicated in Figure 1.
Creep Strain (%)Creep Life (h)
180 °C/225 MPa220 °C/175 MPa240 °C/225 MPa220 °C/250 MPa
5.30 wt % Cu alloy0.0780.5046.916.7
5.65 wt % Cu alloy0.0990.6474.910.7
6.00 wt % Cu alloy0.0390.2369.228.0
Table 3. Steady creep rates (s−1) of three Al–Cu–Mg–Ag alloys under different creep conditions.
180 °C 200 °C
5.30 wt % Cu5.65 wt % Cu6.00 wt % Cu 5.30 wt % Cu5.65 wt % Cu6.00 wt % Cu
225 MPa1.90 × 10−73.29 × 10−79.67 × 10−8200 MPa3.61 × 10−76.75 × 10−71.98 × 10−7
250 MPa5.04× 10−78.65 × 10−72.71 × 10−7225 MPa1.19 × 10−62.20 × 10−66.08 × 10−7
275 MPa1.48 × 10−62.40 × 10−68.35 × 10−7250 MPa2.87 × 10−64.18 × 10−61.29 × 10−6
300 MPa3.75 × 10−65.19 × 10−62.59 × 10−6275 MPa6.69 × 10−69.46 × 10−65.07 × 10−6
220 °C 240 °C
5.30 wt % Cu5.65 wt % Cu6.00 wt % Cu 5.30 wt % Cu5.65 wt % Cu6.00 wt % Cu
175 MPa7.26 × 10−71.37 × 10−63.85 × 10−7150 MPa1.19 × 10−62.66 × 10−65.23 × 10−7
200 MPa1.79 × 10−64.34 × 10−69.71× 10−7175 MPa4.15 × 10−66.40 × 10−62.54 × 10−6
225 MPa4.98 × 10−69.63 × 10−63.95 × 10−6200 MPa1.25 × 10−52.09 × 10−54.99 × 10−6
250 MPa1.40 × 10−52.02 × 10−59.59 × 10−6225 MPa2.81 × 10−54.23 × 10−52.19 × 10−5
Table 4. EDS results of the phases indicated in Figure 5 (in wt %).
SpotAlCuMgAgMnFeScTiZr
A79.018.00.30.30.10.11.50.10.7
B60.828.40.00.08.12.70.00.00.0
C84.613.20.10.20.10.11.10.10.5
D69.422.20.20.26.31.50.00.00.2
E93.7 ± 0.34.3 ± 0.10.00.00.00.00.00.00.0
F93.8 ± 0.34.0 ± 0.20.00.00.00.00.00.00.0
G94.0 ± 0.44.8 ± 0.20.00.00.00.00.00.00.0
Publisher’s Note: MDPI stays neutral with regard to jurisdictional claims in published maps and institutional affiliations.

