Article

Process Condition Diagram Predicting Onset of Microdefects and Fracture in Cold Bar Drawing

1
Department of Mechanical Engineering, Chung-Ang University, Seoul 06974, Korea
2
Department of Mechanical Engineering, Korea Advanced Institute of Science and Technology, Daejeon 34141, Korea
3
Materials Research Team, Samwon Steel Co., Ltd., Pohang 37875, Korea
4
School of Mechanics and Safety Engineering, Zhengzhou University, Zhengzhou 450001, China
*
Authors to whom correspondence should be addressed.
Metals 2021, 11(3), 479; https://doi.org/10.3390/met11030479
Submission received: 10 February 2021 / Revised: 5 March 2021 / Accepted: 9 March 2021 / Published: 13 March 2021
(This article belongs to the Special Issue Fracture and Damage Mechanics of Metals, Steels and Alloys)

Abstract

:
This paper presents a process condition diagram (PCD) that not only identifies conditions under which materials fracture during bar drawing, but also infers the presence or absence of microdefects such as microvoids and microcracks in the drawn material as accumulative damage changes owing to the die semi-angle and reduction ratio. The accumulative damage values were calculated by finite element (FE) analysis. The critical damage values were determined by performing a tensile test using a smooth round bar tensile specimen and performing FE analysis simulating the tensile test. High alloy steel with a 13 mm diameter was used for the draw bench testing in a wide range of drawing conditions. Scanning electron microscopy (SEM) analysis was performed to verify the usefulness of the PCD. SEM images showed that the accumulative damage roughly matched the size of microvoids around the non-metallic inclusions and the creation of microcracks, which eventually led to fractures of material being drawn. Hence, utilizing the proposed PCD, a process designer can design drawing conditions that minimize the occurrence of microdefects in the material being drawn while maximizing the reduction ratio.

1. Introduction

In multi-pass drawing, a long bulk material (e.g., steel, copper, or aluminum) is plastically deformed at room temperature by passing it through a set of converging dies of decreasing sizes. Drawn materials with high strength and durability are produced through the multi-pass drawing process in which complex physical and mechanical phenomena occur [1]. At the production site, the process of passing the long material through a die is called a pass. Multi-pass drawing commences with a 5.5–9.0 mm diameter coil material and, after several passes (usually 6–8 passes) [2], produces a long product with a 1.0–0.01 mm diameter, depending on the type of material and its intended end use.
In single-pass drawing, materials with a diameter greater than 10 mm are pulled at room temperature by a drawing machine with converging dies and sequentially cut into 2–6 m long sections during the operation. Cold-drawn materials produced via a single draft (reduction) are used as raw materials for manufacturing parts such as automotive springs, fasteners, bolts, screws, and nuts.
The microstructure of the material changes due to the hardening of the material due to large plastic deformation [3]. These microstructural changes also affect the macroscopic mechanical properties [4,5], as in their fatigue and fracture behavior [6,7]. Process designers prefer to maximize the reduction ratio in the cross-sectional area (r), in order to improve the mechanical properties of the cold-drawn materials, provided that the die semi-angle (α) is appropriate. However, this greatly increases the macroscopic fracture risk of the material being drawn. Macroscopic fracture of the material in the drawing process has been referred to as chevron cracking, internal cracking, or central bursts [8,9]. Macroscopic fracture is referred to as “fracture” from here on.
Alberti et al. [9] conducted a finite element (FE) analysis with the ductile fracture (DF) criterion proposed by Oyane [10] to predict the central bursting of UNI-3571 aluminum in wire drawing. They also performed drawing tests to verify the FE analysis. They plotted the predicted and experimental drawing test data on the α–r plane, where the horizontal axis represents α and the vertical axis represents r, and proposed a drawing-limit diagram (DLD) in which the safe zone (where no central bursting occurs) and unsafe zone (where central bursting occurs) are identified by an L-shaped curve. For convenience, this curve is called the identification curve (IC) hereafter.
McAllen and Phelan [11] predicted central bursting during drawing in 2011-aluminum alloy by implementing a user subroutine into a commercial FEA program, ABAQUS, and suggested a DLD. The drawing test data reported by Orbegozo [12] and McAllen and Phelan’s predicted results were used. They insisted that the IC exhibits a “nose shape” rather than a simple L shape when r attained a 39% value and α increased up to 25°.
Haddi [13] adopted the DF criterion proposed by Cockcroft and Latham [14] and proposed a DLD of copper (EPT 99% Cu) in wire drawing. They conducted FE simulations for 16 combinations of α and r and argued that the IC is L-shaped. However, verification efforts regarding the adequacy of the FE simulation results were poor, as only two sets of drawing test data were plotted on the α–r plane.
Recently, González et al. [15] conducted an FE analysis linked to a new DF criterion to predict the fracture of Al-2011 aluminum in single-pass wire drawing. They suggested a plot in which the horizontal axis represents r but the vertical axis indicates the damage index, which is a non-dimensional parameter expressed as a function of stress triaxiality and equivalent plastic strain.
These DLDs and the plot proposed by González [15], however, do not provide information on the damage state, that is, the accumulative damage of the material drawn under various combinations of α and r. From a metallurgical point of view, the term damage has been recognized generally as the nucleation of microvoids [16], and formation of microcracks and shear bands in ductile materials [17]. From a micromechanical viewpoint, this is usually associated with the degradation of macroscopic properties [18], such as stiffness and strength, under physical loading. Therefore, if a material with accumulated damage above a certain level is utilized as raw material for secondary forming processes such as forging and upsetting, the resulting parts may have a lower than expected fatigue life in service. Recently, the demand for processing high-strength materials (steels) by single-pass drawing has been increasing. However, high-strength bar steel has low ductility. Hence, it is necessary to carefully examine the damage accumulation, as well as the fracture of the material during drawing.
This study presents a process condition diagram (PCD) that not only finds the conditions under which the material fractures in the process of being drawn, but also infers the presence or absence of microvoids and microcracks and their sizes in the drawn material for various combinations of α and r. A high-carbon-chromium bearing steel (SUJ2Z) was selected for the material.
An FE analysis linked with the DF criterion (ductile damage model) [19] was conducted to calculate the accumulative damage of the steel during drawing and to determine the critical damage value at which the fracture of the steel being drawn begins for various combinations of α and r. A single-pass drawing test with a 20-ton tensile force draw bench was conducted for a combination of four r (10%, 20%, 36%, and 49%) and eight α (2, 4, 6, 8, 10, 12, 14, 16, and 20°) to confirm the reliability of the FE analysis performed in this study. The PCD was then constructed using the data generated from FE analyses.
To demonstrate the applicability of the PCD, scanning electron microscopy (SEM) analysis was conducted. The sizes of the microvoids around the non-metallic inclusions in the drawn steel under six combinations of α and r were compared with the corresponding predicted cumulative damage values. As cumulative damage value becomes large by the α and r combinations, the development of microvoids and microcracks, which are the predecessors of macrocrack onset, were also investigated.

2. Experiments

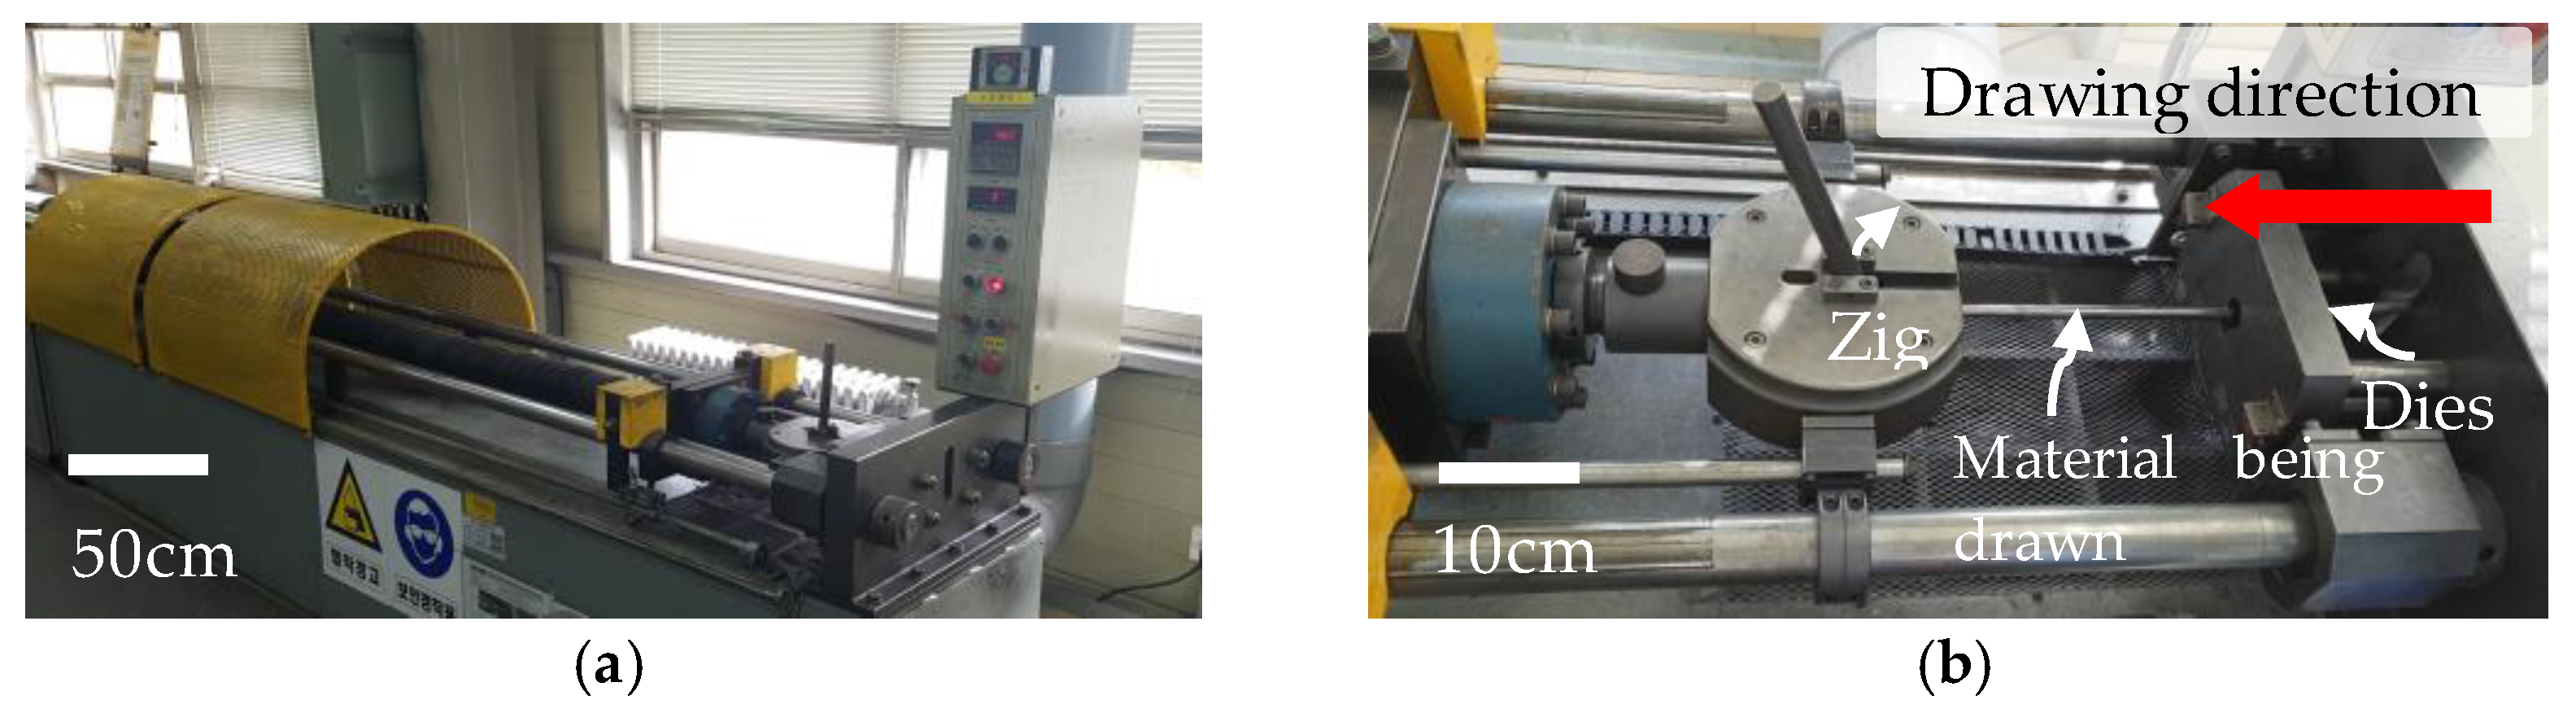
2.1. Draw Bench Testing

Table 1 shows the chemical composition of the SUJ2Z used for manufacturing a variety of industrial machine parts, including ball and ring bearings. The alloy compositions of SUJ2Z and JSUJ2 are actually the same. Both are used in rolling contact applications where high fatigue strength and wear resistance are required [20]. The letter “Z” corresponds to the orderer (customer’s) specifications. A 13 mm-diameter rod, produced at POSCO (Pohang, Korea), was received in a coil form of approximately 1.8 m diameter and was cut into rods approximately 500 mm long. The cut rods were used as specimens for the drawing test. The lead end of each specimen was reduced by several inches via swaging, such that it could pass freely through the die in a draw bench machine. In order to distinguish the specimen used in the drawing test from that used in the tensile test, the former is referred to as “material” from here on.
The draw bench used to pull the material through a converging die is illustrated in Figure 1 and consists of an entry table, die stand, carriage, and exit rack. The carriage is used to pull the material through the die, and is powered by hydraulic cylinders at a pulling speed of 1000 mm/min.
Twenty-nine drawing tests were performed for a combination of four r (10%, 20%, 36%, and 49%) and nine α (2, 4, 6, 8, 10, 12, 14, 16, and 20°). Pickling was conducted using hydrochloric acid. The lubrication spray D-321R (Dupon, Wilmington, NC, USA) was applied onto the material and dies to reduce the friction generated during the drawing test.

2.2. Tensile Testing

Uniaxial tensile tests were performed with a Zwick Z250 (ZwickRoell, Ulm, Germany) to measure the stress–strain curve of SUJ2Z used in the FE analysis. Standard round bar tensile specimens, with a 6.25 mm diameter and 25 mm gauge length, were machined according to ASTM A370 specifications. The mechanical properties of SUJ2Z are listed in Table 2.
The engineering stress–strain curve measured using a smooth round bar tensile specimen was divided into two sections: before and after necking. The Swift power model [21] was applied to express the stress–strain curve before necking into the constitutive equation, as follows:
σ ¯ = K ( ε 0 + ε ¯ ) n ,    ε ¯ ε ¯ n e c k i n g
Mirnia and Shamsari’s [22] approach was adopted to depict the stress-strain curve after necking, as shown in Equation (2)
σ ¯ = Q [ K ( ε 0 + ε ¯ ) n ] + ( 1 Q ) σ ¯ U T S ,    ε ¯ > ε ¯ n e c k i n g
K ,   ε 0 ,   n   and   σ ¯ U T S represent the strength coefficient, pre-strain, hardening exponent, and ultimate tensile true stress at the necking strain, respectively. The post-necking hardening parameter Q was determined by fitting Equation (2) to the measured stress-strain curve. The parameters used to depict the true stress-strain curve and their values are listed in Table 3.

3. FE Analysis

One of the main goals of the FE analysis in this study is to calculate the cumulative damage, w, of the material during drawing, and the critical damage value, ω c , triggering the fracture of the material being drawn. These topics are explained in the following two subsections.

3.1. Critical Damage Value Calculation

Modern DF criteria that consider the effects of both stress triaxiality η and the Lode parameter L (or Lode angle parameter θ ¯ ) were developed [23,24,25,26,27,28,29]. However, several constants must be determined, that is, calibrated, for the modern DF criteria to calculate the critical damage value. In order to determine these constants, we need to know the equivalent strain to the fracture loading condition relationship at which fracture begins under various load conditions. This means that specimens with various shapes, such as compression tests on cylinders, torsion tests, and tensile tests with notched round bars, butterfly specimens, and flat grooved specimens, are required to generate various loading conditions. However, in practice, it is difficult for process designers working in a drawing factory to machine those specimens and perform experiments on new materials.
Recently, Cho et al. [30] demonstrated that, for applying to bar drawing process, a tensile test using a smooth round bar tensile specimen was sufficient to calculate the cumulative damage with reasonable accuracy if the DF criterion proposed by Ko et al. [19] was used. The DF criterion [19] is expressed as
0 ε ¯ f σ 1 σ e q 1 + 3 η d ε ¯ = ω c
where   x = { x ,    f o r   x 0 0 ,    f o r   x < 0
In these equations, <…> represent the Macauley brackets, with <x> = x for x ≥ 0 and <x> = 0 for x < 0. σ 1 ,   σ e q , and η   =   σ m / σ e q are the maximum principal stress, equivalent stress, and stress triaxiality, respectively. σ m ( = σ 1 + σ 2 + σ 3 3 ) is the mean stress, and ε ¯ f is the equivalent strain for each element at the moment at which the material fractures in a tensile test. Cho et al. [30] insisted the maximum principal stress and stress triaxiality were the most important factors for predicting the fracture of the material being drawn with acceptable accuracy.
Depending on the degree of hardening of the matrix and the drawing speed, the sediment particles will be completely surrounded by the metal matrix or will form (micro) voids in front of and behind the particles due to the excessively high radial stress values necessary for the plastic flow of the material at these points. However, the DF criterion proposed by Ko et al. [19] did not explicitly consider the presence of inclusions and sediment particles surrounded by a metal matrix. They assumed that if the mean stress at a point in the material is positive (stress triaxiality > 0), the (micro) void develops at a point, and coalescences, resulting in microcracks at the point. The microcracks then merge and finally lead to (macro) fracture. On the other hand, if the mean stress is negative (stress triaxiality < 0), the void shrinks and a very large plastic deformation is required until fracture. They inferred their assumptions were reasonable after they compared the predicted ductile fracture with the measurements.
The DF criterion indicates that the fracture is triggered when the damage value ω reaches a predetermined critical damage level, ωc, which depends on the material class or grade. Hence, ωc is called the critical damage value and fracture begins at the element satisfying ω = ωc. In this study, ωc was determined by carrying out a tensile test using a smooth round bar tensile specimen (ASTM A370) and simultaneously performing an FE simulation corresponding to the tensile test.
We adopted a half model for the smooth round bar tensile specimen to reduce the run time. The element type was CAX4R, which is an axisymmetric solid, four-node, bilinear element with reduced Gaussian integration, hourglass control, and two active degrees of freedom [31]. In order to take into account strain localization, we modeled elements with a 0.2 mm center size. FE analysis was performed using the ABAQUS/Standard.

3.2. Calculation of Cumulative Damage during Drawing

We coded Equation (5) into a user-defined subroutine VUSDFLD using FORTRAN and integrated it into ABAQUS/Explicit to calculate the damage that accumulates in the center of the material while the material is being drawn.
0 ε ¯ d r σ 1 σ e q 1 + 3 η d ε ¯ = ω
where ε ¯ d r is the equivalent strain for each element in the material being drawn, but not the equivalent strain for an element at the moment at which the material fracture begins. Note that term “cumulative damage” has been used because the formula (Equation (5)) is expressed in the integral form. From here on, “damage value w” is used instead of cumulative damage, because the cumulative damage indicates the state of damage accumulated in the drawn material.
The 1000 mm/min velocity, which is the pull-out speed in the drawing test, was imposed at the front end of the material. The friction coefficient µ used for the FE analysis was 0.08 [30]. The axisymmetric sections of the material and die were modeled using CAX4R elements in a Lagrangian framework.
The cumulative damage value tended to converge when the number of meshes along the radial direction of the material being drawn exceeded 30. In this study, the number of elements in the radial direction was determined to be 33 for a 0.2 mm mesh size, considering the accuracy of the analysis and the calculation time. The total number of elements varied from 3366 to 25,938, owing to its dependence on α and r.

4. Results and Discussion

4.1. FE Analysis Verification

The drawing test results are compared with the corresponding FE analysis results in Table 4. Twenty-nine drawing tests were conducted for different r and α value combinations. Fractured and non-fractured materials were marked with X and O, respectively. It is observed that the predictions and measurements (fractured or non-fractured) are in agreement, except for four cases (α = 2° and r = 36%, α = 6° and r = 49%, α = 16° and r = 10%, α = 20° and r = 10%). Hence, it is deduced that the values of ω and ωc of the SUJ2Z, which are calculated from the FE analysis, are reliable.
Figure 2 shows the appearance of the materials after the drawing test is complete. Sixteen materials, representing 55% of the materials used in the drawing test, were fractured at various r and α combinations. The materials fractured when α exceeded 12° at all r values, except for r = 10%. This is because the stress triaxiality at the center of the material being drawn increased rapidly, owing to the higher r and α.
The discrepancy between the experiment and the prediction is explained as follows. The fracture of materials at α = 2° and r = 36% may be attributable to a combination of high r and low α, which leads to excessive pulling force due to the increased contact area between the material surface and the die. This is because FE analysis used the same coefficient of friction for all values of α. The fracture of material at α = 6° and r = 49% is estimated to be an experimental error.
In contrast, when α is high (16°, 20°) and r is low (10%) SUJ2Z fractured. This is not simply the result of high pulling forces but because of a dead zone [32]. If the α is too large, there will be an empty space between the die and the material [33]. This space is called the “dead zone”.
In Figure 3, the engineering stress–strain measured via the tensile tests with a standard round tensile specimen was compared with the responses predicted by the FE analysis of the tensile tests. A series of FE analyses were performed to determine the hardening parameter Q, as shown in Equation (2). Overall, the measured engineering stress–strain curve shape is very similar to predicted engineering stress–strain curve profile when Q = 0.65 (indicated by a solid red line), implying that the true stress–strain curves (constitutive relations) of SUJ2Z used in the FE analysis are appropriate.

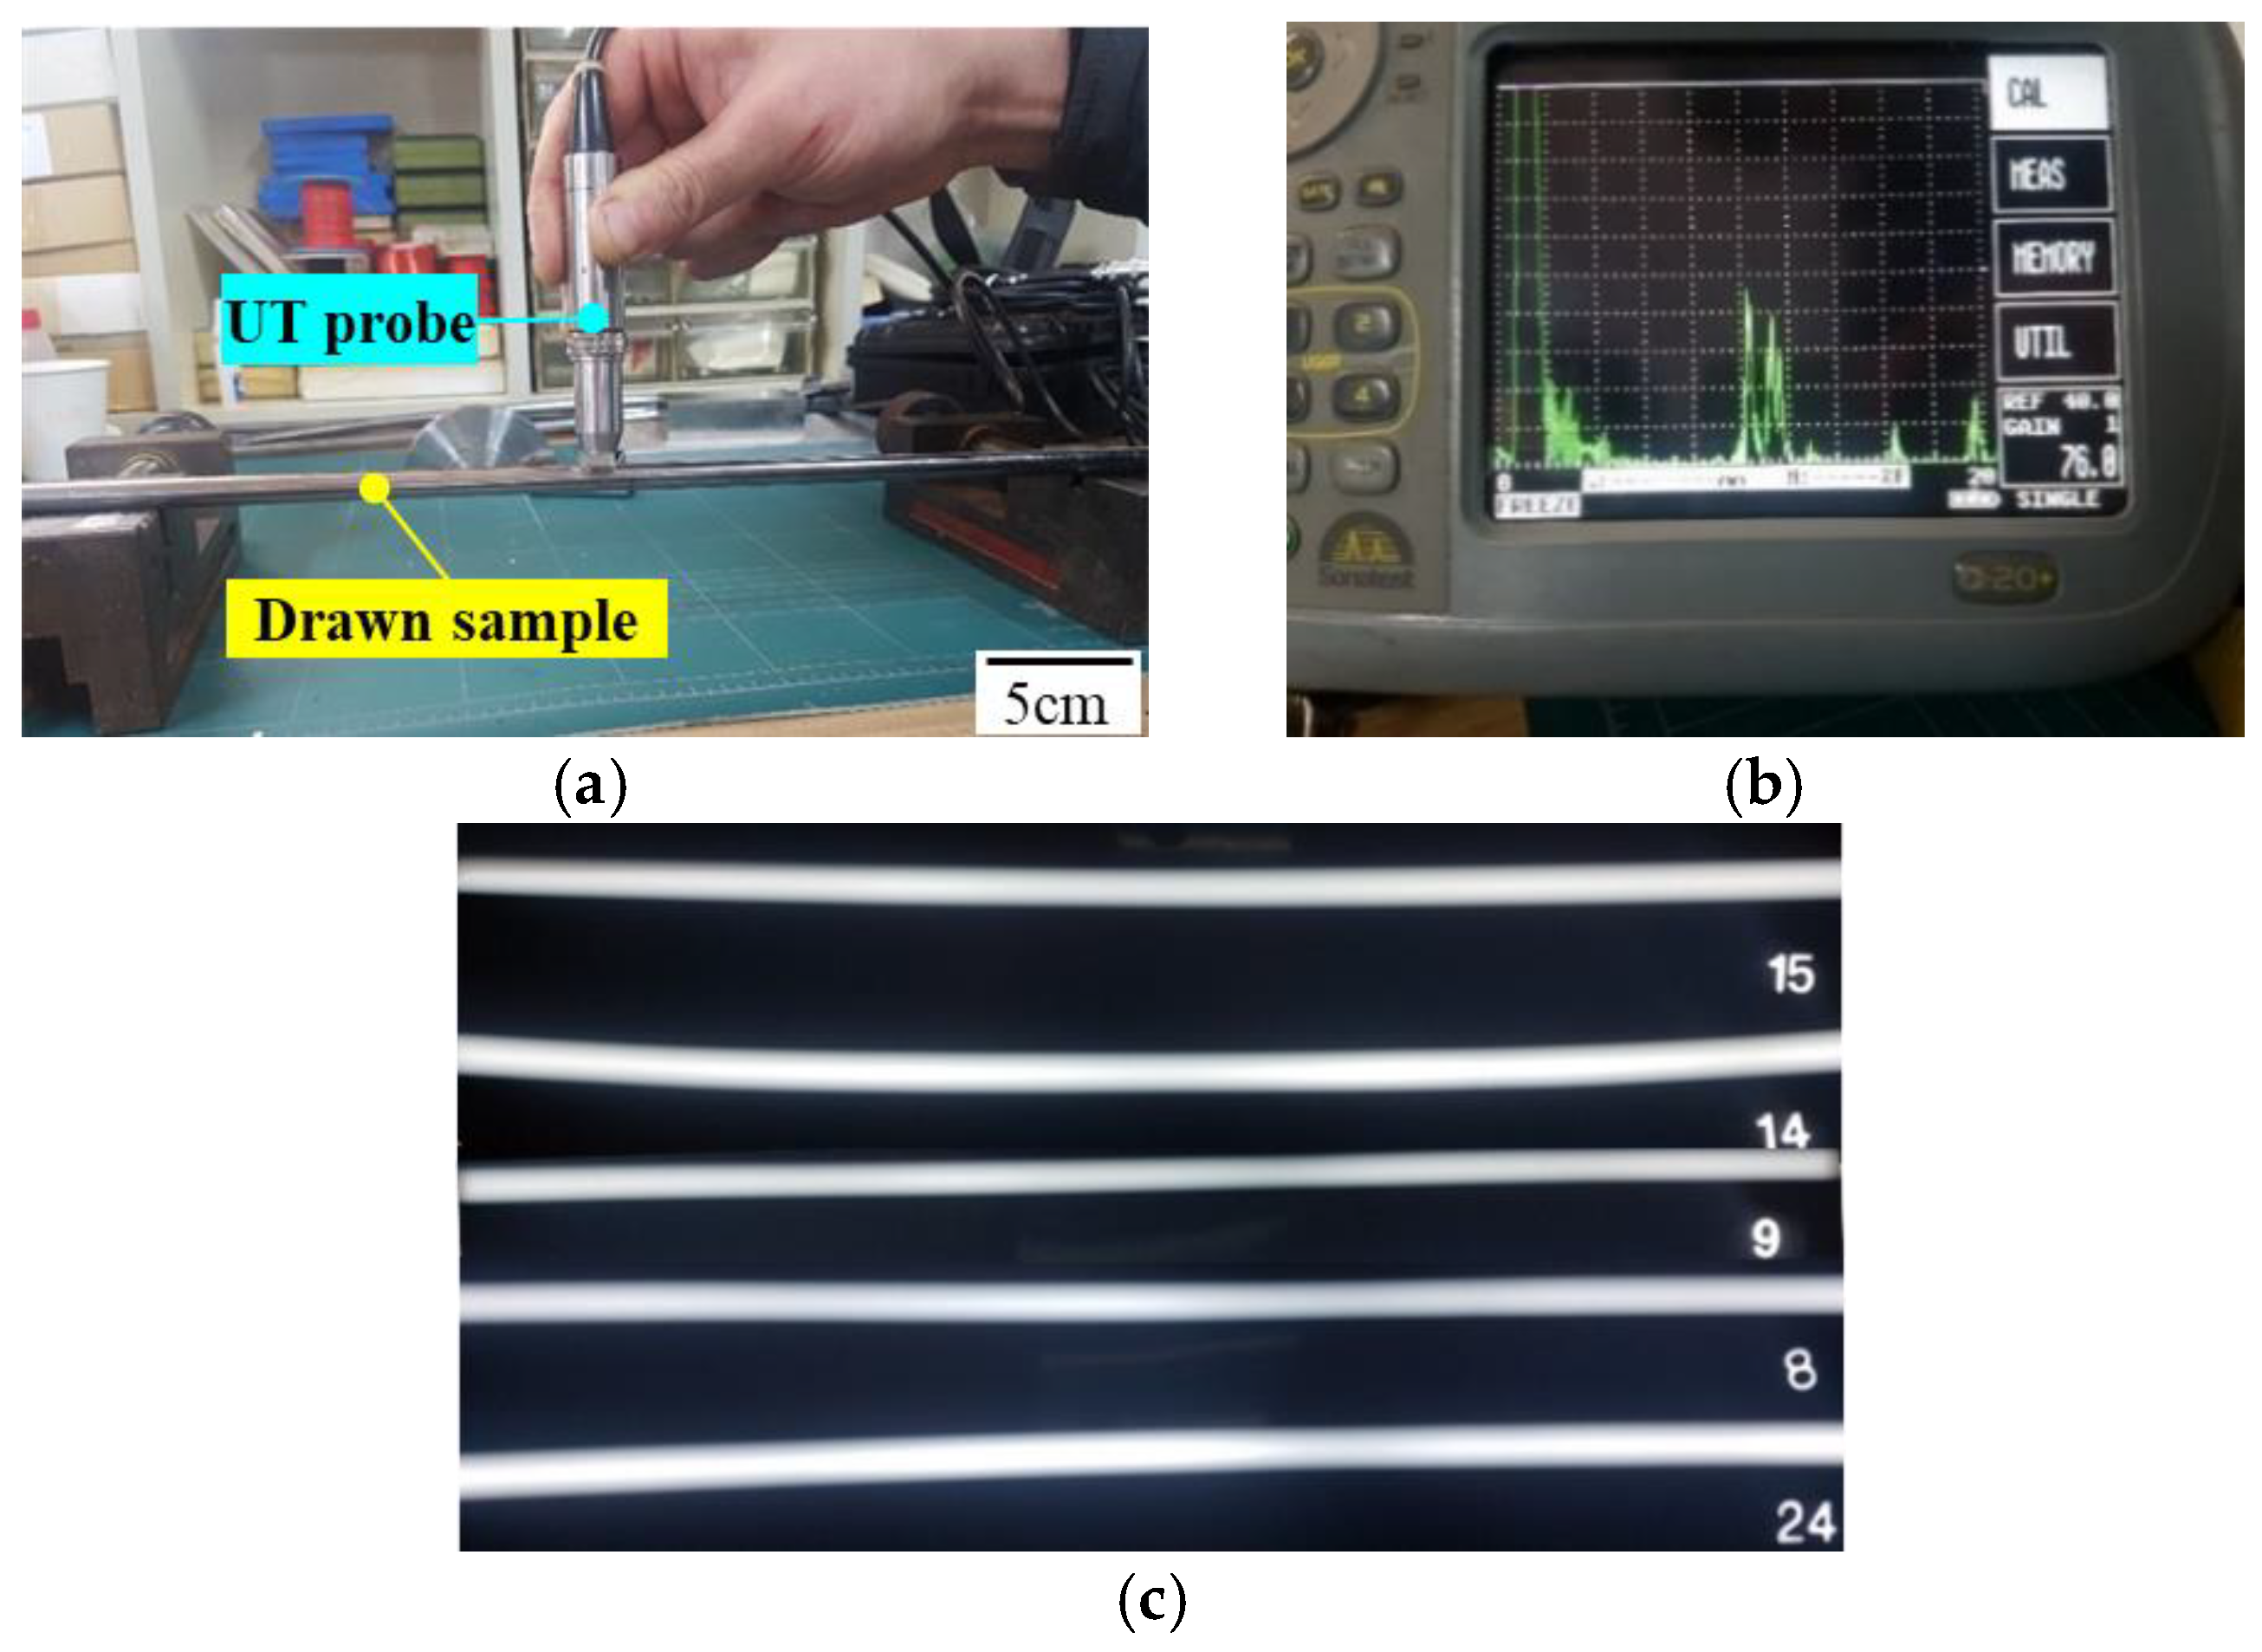
4.2. Non-Destructive Test

Non-destructive ultrasonic testing was also carried out to confirm the presence of any chevron cracks in the non-fractured material, as they cannot be seen with the naked eye. Hence, ultrasonic testing (UT), a common non-destructive inspection method, was employed using a Sitescan D-20 (Sonatest) (Figure 4a,b) to identify any chevron cracks. Radiographic testing (RT) was also performed to detect defects, such as discontinuities, in the drawn materials (Figure 4c). The test mode employed was pulse echo and transmit/receive, and the gain was set to 0–110 dB. No traces of chevron cracks or discontinuities were observed in the drawn materials.

4.3. Drawing-Limit Diagram (DLD)

DLDs reported in literatures [9,11,13] were analyzed for comparison purposes, as shown in Figure 5a, where O and X in bold type indicate fracture and no-fracture, respectively. The safe and unsafe zones are distinguished by an IC. Alberti et al. [9] generated many sets of drawing test data and were therefore able to obtain a reasonable IC. Meanwhile, it was deduced that the IC proposed by McAllen and Phelan [11] was generated arbitrarily, even though it was reinforced by the FE analysis results. The reliability of Haddi’s IC was low, since the number of data sets was very small. The two ICs (dot-dashed red line and green dashed line) are similar to each other, except for the top of the L-shaped IC, even though different materials were tested. It is believed that similar ICs are not a physical phenomenon, but rather an accidental match.
In Figure 5b, the DLD made with the drawing test data (Table 4) in this study is illustrated. The safe and unsafe zones are identified by the IC marked with the black dashed line. Note that the ICs were not determined arbitrarily. At this point, the process for determining the IC is described. The α and r intervals were divided more densely (α: up to 20° with 1° each, and r: up to 60% with 2% each) for FE analysis. Then, the damage values ω for each α and r combination were computed via a series of FE analyses, and plotted on the α–r plane. Then, ICs were determined by connecting the points where ω equals ωc. The DF criterion interprets the condition ω = ωc as the formation of an incipient macrocrack. As α is increased by more than 10.5° at r = 20% and more than 11.8° at r = 49%, the material fractured due to the damage accumulated during drawing. However, the IC proposed in this study has the following limitations. The IC does not accurately predict results for the three combinations (α = 2° and r = 36%, α = 16° and r = 10%, α = 20° and r = 10%). This is because Equation (3) does not take into account excessive pulling force and dead zone effects. It is observed that the IC of SUJ2Z becomes inverse S-shaped, rather than nose- or L-shaped, in a wide range of α and r drawing conditions.

4.4. Process Condition Diagram (PCD)

The prediction of the onset of microvoids in a material subjected to plastic deformation varies from researcher to researcher and from material to material. Alharbi et al. [34] studied the damage mechanisms in DP1000 steel. They showed that voids nucleated at inclusions at an early stage of deformation, for an applied specimen strain value as low as 2%. However, a more extensive damage mechanism was observed in their study for the failure of martensite islands, which initiated beyond the ultimate tensile strength (UTS). Zhai. et al. [35] observed that the void nucleation process in the tensile specimens occurs at the UTS in the process of developing a ductile damage model of commercially pure titanium. Void behavior (initiation, growth, and coalescence) generally arises as a result of the plastic strain applied after the UTS and is promoted in the presence of non-metallic inclusions. Hence, this study adopted Zhai et al.’s model to predict the onset of microvoids because SUJ2Z contains non-metallic inclusions (MnS).
Figure 6a shows the tensile force-displacement response and the change in w on the center element of the tensile specimen with increasing displacement. The damage value, w at UTS, was considered the criterion by which microvoid initiates, and is referred to as w U T S hereafter. Beyond w U T S , microvoids, which are a type of microdefects, are generated. Coalescence, following the growth of microvoids, is considered as the formation of an incipient macrocrack, which is a type of macrodefect. In the case of SUJ2Z, the value of w U T S at which microvoid nucleation begins is 0.139 and value of wc at which the tensile specimen fractures is 0.465. This means that the material stiffness and strength decrease from w U T S to just before wc, and the specimen fracture begins at the element satisfying ω = ωc.
Figure 6b shows the PCD of SUJ2Z in the 2 < r < 60% and 2° < α < 20° range, and the values on the contour lines indicate each value of w. The contour lines were constructed by calculating w values through FE simulation for a predetermined α and r combination. The predetermined α and r were as follows: α up to 20° with 1° intervals, and r up to 60% with 2% intervals. The red dash–dash contour line denotes the w U T S and black dash–dash contour line denotes the wc. Therefore, microdefects such as microvoids will occur and grow if the material is pulled in the region between the microdefect onset curve (MOC) and IC. On the other hand, the material will fracture if the w value of the material being drawn is in the region beyond the IC.
Material fractures occurred even for a low w value when r was high (40%) and α was low (2°). This is not due to damage that accumulates in the material during drawing, but rather due to the increase in the contact area between the material and the die. If α is larger than 11° on average, the fracture zone increases significantly, regardless of r. This is a fracture caused by the damage accumulated on the centerline when the drawing exceeded a critical value. When the material is drawn in the region between the IC and MOC, microvoids and microcracks are generated in the drawn material. Hence, if the materials drawn in this region are used in the secondary forming process as raw materials, the final manufactured parts may have serious quality issues.

4.5. Scanning Electron Microscopy (SEM)

SEM analysis was performed to see whether w, which depends on the values of α and r, can represent the evolution of microvoids around the non-metallic inclusions and the creation of microcracks that eventually lead to a fracture of the material being drawn. The boundary strength between the non-metallic inclusions and the base metal is slightly different depending on A-type (MnS), B-type (Al2O3), C-type (SiO2), or D-type (CaO) [36]. In general, the interfacial strength is high in the order of A-type > C-type > B-type > D-type. Therefore, it is easy to create microvoids at the interface between the non-metallic inclusions and the base material. Samples for SEM analysis were collected from the center of the drawn materials. The samples cut in the longitudinal direction were used to clearly observe the evolution of the microvoids and the formation of microcracks based on the α and r changes. From here on, for convenience, non-metallic inclusion is called “inclusion”.
In Figure 7a, the contour line in Figure 6b is divided more closely to indicate the damage value of the material being drawn. Figure 7a shows the PCD that not only determines the condition that the material fractures in the process of being drawn, but also infers the presence or absence of microvoids, occurrence of microcracks, and a tendency of larger damage to cause larger microcracks in the drawn material as w changes for various α and r combinations. The locations marked with Roman numerals are the positions where SEM photos were taken. The Roman numerals (i), (ii), …, (vi) in Figure 7a match with the SEM photo identification Roman numerals in Figure 7b.
Figure 7b shows the SEM images taken at each position. Image (i) shows the inclusion (MnS) and microvoids in the material drawn under α = 4° and r = 36%. This drawing condition is positioned near the MOC. The inclusion was identified as MnS through energy-dispersive X-ray spectroscopy analysis. The damage value w = 0.159 in this condition was only 1.14 times greater than that of w U T S = 0.139. Hence, only microvoids were observed on both sides of the inclusion (MnS). These microvoids are attributable to non-homogenous stress and strain fields, separating the interface between the matrix and the inclusion as the stress goes beyond the UTS [37].
Image (ii) is a SEM image of the inclusion and microvoids in the material drawn under α = 6° and r = 20%. This drawing condition is located close to the MOC. Damage value w = 0.161 in this condition was also only 1.16 times greater than that of w U T S   = 0.139. Hence, an early stage of microvoid formation was observed around the inclusions.
Image (iii) illustrates a SEM image of the inclusion and base material for α = 8° and r = 36%. The value of w corresponding to this drawing condition is 0.191. It was observed that the inclusion was almost ruptured; the decohesion of the interface between the matrix material and inclusion did not occur. At w = 0.191, it was shown that microcracks caused by void behavior preferentially propagated into the hard inclusions, leading to inclusion rupture.
Image (iv) is a SEM image for α = 10° and r = 36%. The value of w corresponding to this drawing condition is 0.351. A number of microcracks were observed instead of microvoid initiation since w = 0.351 was approximately 2.53 times larger than that of w U T S = 0.139. Similarly, when w is high, it was observed that void initiation and growth occur in the base material rather than at the interface between the inclusions and the base material.
Image (v) shows the inclusion and microvoids of the material drawn under α = 10° and r = 12%. The characteristics of this drawing condition are that r is low and α is high compared to the conditions mentioned above (Image (iv)). The value of w corresponding to this condition is 0.363, which is approximately 2.61 times greater than that of w U T S = 0.139. In this drawing condition, however, microcracks were not observed, but grown microvoids were observed after void initiation, which proceed from the hard inclusions toward the base metal. Hence, this drawing condition (position) is closer to the IC that distinguishes fracture and no-fracture of the drawn material.
Image (vi) shows the inclusion and microvoids for α = 10° and r = 20%. The value of w for this drawing condition is 0.442, which is 3.18 times greater than w U T S = 0.139, and is very close to w C = 0.465. A long microcrack and a growing microvoid were observed around the inclusion, as expected.
In summary, the SEM images show that the damage value, w, is somewhat consistent with the evolution of microvoids around the inclusions in the drawn material. Therefore, if we determine the damage value from a tensile test and corresponding FE simulation of the tensile test, we can roughly deduce the onset of microdefects such as microvoids and microcracks in the drawn material and fracture of the material being drawn for any α and r combinations without taking SEM photos after the drawing test. Hence, the proposed PCD will be useful for designing the drawing condition considering the secondary forming processes such as forging, extruding, and upsetting when the steel grade is changed.

5. Conclusions

This study presents a PCD that simultaneously provides information on the drawing conditions under which fracture occurs and roughly predicts the onset of microvoids and the creation of microcracks in the steel being drawn, which is difficult to control owing to their invisibility during drawing. This PCD was constructed via FE analysis integrating the ductile fracture criterion [19] into ABAQUS and carrying out a tensile test using a smooth round bar tensile specimen (SUJ2Z steel). The reliability of the FE analysis was verified via testing using a draw bench under a 20-ton tensile force. The conclusions are summarized as follows:
(1)
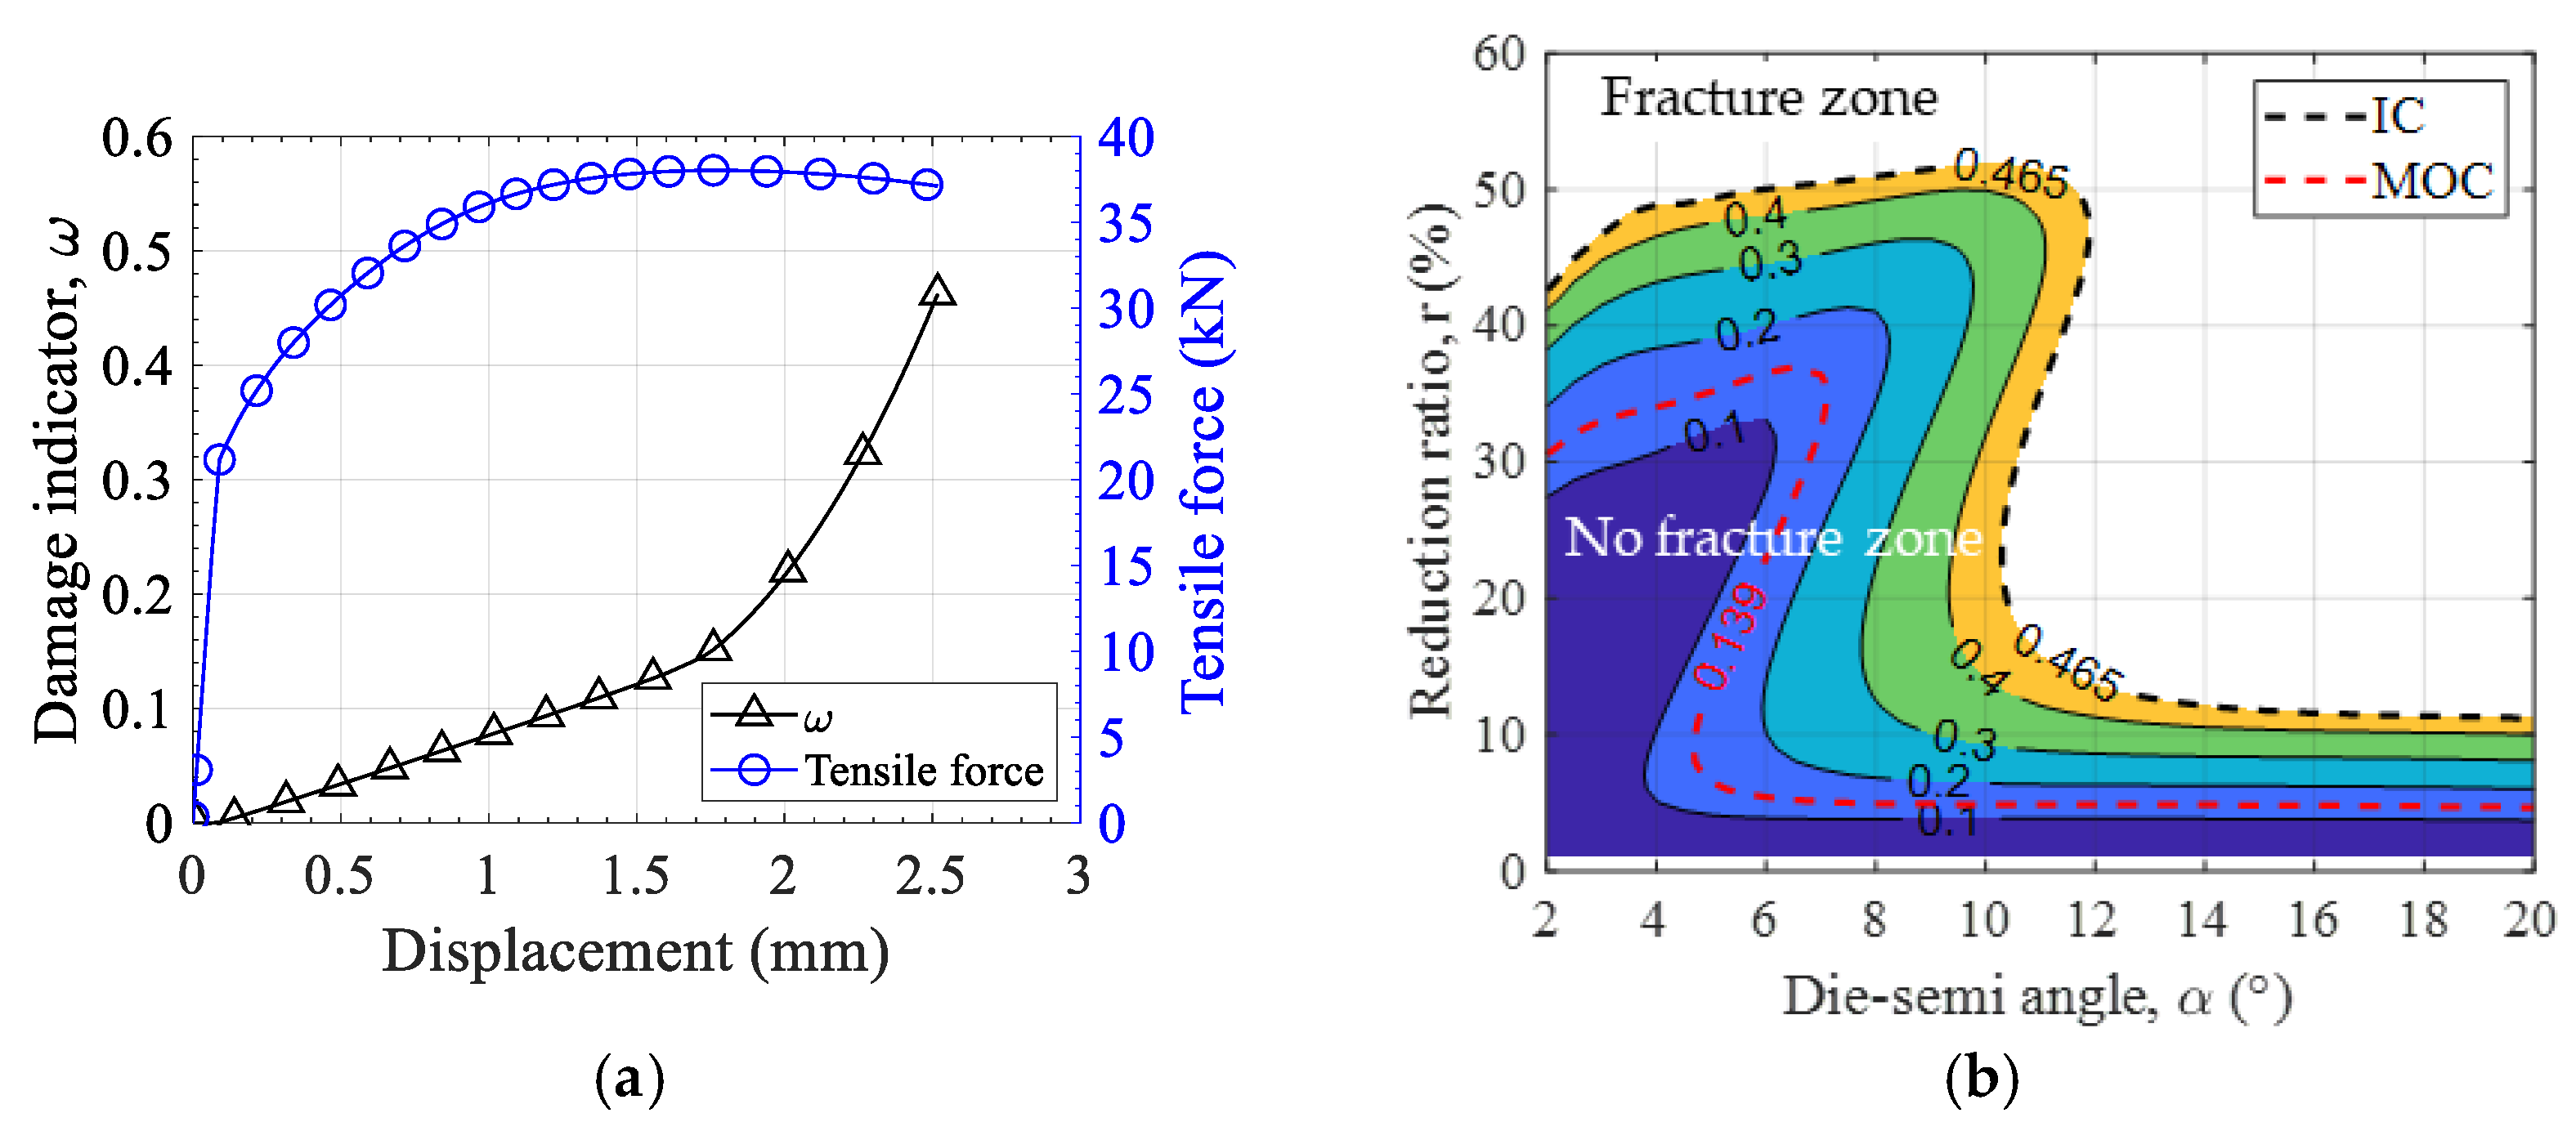
In a wide range of drawing conditions (α = 2~20° and r = 2~60%), the accumulative damage value w changes non-linearly and IC for SUJ2Z steel becomes inverse S-shaped rather than nose or L-shaped.
(2)
Because it is difficult to predict the size of microcracks and microvoids around inclusions in the SUJ2Z steel being drawn for any given α and r combinations, the proposed PCD can be used to roughly predict these for various combinations of α and r without taking SEM photos.
(3)
Using the PCD, we can quickly set the α and r (drawing condition) for the SUJ2Z steel that do not generate microvoids exceeding a certain level as required by secondary forming processes, such as forging, extruding, and upsetting.

Author Contributions

Conceptualization, Y.-H.R. and Y.L.; methodology, Y.-H.R. and Z.Y. and.; software, D.C.; validation, D.C. and Y.L.; formal analysis, Y.-H.R.; investigation, H.-C.C.; resources, D.C.; data curation, Y.-H.R.; writing—original draft preparation, Y.-H.R.; writing—review and editing, Z.Y. and Y.L.; visualization, H.-C.C.; supervision, Z.Y. and Y.L.; project administration, Y.L. All authors have read and agreed to the published version of the manuscript.

Funding

This research was supported by the Chung-Ang University Research Scholarship Grants in 2019.

Institutional Review Board Statement

Not applicable.

Informed Consent Statement

Not applicable.

Conflicts of Interest

The authors declare no conflict of interest.

References

  1. Tang, K.K.; Li, Z.X.; Wang, J. Numerical simulation of damage evolution in multi-pass wire drawing process and its applications. Mater. Des. 2011, 32, 3299–3311. [Google Scholar] [CrossRef]
  2. Toribio, J.; Kharin, V.; Lorenzo, M.; Vergara, D. Role of drawing-induced residual stresses and strains in the hydrogen embrittlement susceptibility of prestressing steels. Corros. Sci. 2011, 53, 3346–3355. [Google Scholar] [CrossRef]
  3. Toribio, J.; Ayaso, F.J.; González, B.; Matos, J.C.; Vergara, D.; Lorenzo, M. Tensile fracture behavior of progressively-drawn pearlitic steels. Metals 2016, 6, 114. [Google Scholar] [CrossRef] [Green Version]
  4. Zhang, X.; Godfrey, A.; Huang, X.; Hansen, N.; Liu, Q. Microstructure and strengthening mechanisms in cold-drawn pearlitic steel wire. Acta Mater. 2011, 59, 3422–3430. [Google Scholar] [CrossRef]
  5. Rastegari, H.; Kermanpur, A.; Najafizadeh, A. Effect of initial microstructure on the work hardening behavior of plain eutectoid steel. Mater. Sci. Eng. A 2015, 632, 103–109. [Google Scholar] [CrossRef]
  6. Toribio, J.; Matos, J.C.; González, B. A macro- and micro-approach to the anisotropic fatigue behaviour of hot-rolled and cold-drawn pearlitic steel. Eng. Fract. Mech. 2014, 123, 70–76. [Google Scholar] [CrossRef]
  7. Toribio, J.; Kharin, V.; Ayaso, F.J.; González, B.; Matos, J.C.; Vergara, D.; Lorenzo, M. Numerical and experimental analyses of the plasticity-induced fatigue crack growth in high-strength steels. Constr. Build. Mater. 2011, 25, 3935–3940. [Google Scholar] [CrossRef]
  8. Komori, K. Effect of ductile fracture criteria on chevron crack formation and evolution in drawing. Int. J. Mech. Sci. 2003, 45, 141–160. [Google Scholar] [CrossRef]
  9. Alberti, N.; Barcellona, A.; Masnata, A.; Micari, F. Central Bursting Defects in Drawing and Extrusion: Numerical and Ultrasonic Evaluation. CIRP Ann. Manuf. Technol. 1993, 42, 269–272. [Google Scholar] [CrossRef]
  10. Oyane, M.; Sato, T.; Okimoto, K. Criteria for ductile fracture and their applications. J. Mech. Work. Technol. 1980, 4, 1–22. [Google Scholar] [CrossRef]
  11. McAllen, P.; Phelan, P. Ductile fracture by central bursts in drawn 2011 aluminium wire. Int. J. Fract. 2005, 135, 19–33. [Google Scholar] [CrossRef]
  12. Orbegozo, J.I. Fracture in wire drawing. Ann. CIRP 16 1968, 16, 319–322. [Google Scholar]
  13. Haddi, A.; Imad, A.; Vega, G. The influence of the drawing parameters and temperature rise on the prediction of chevron crack formation in wire drawing. Int. J. Fract. 2012, 176, 171–180. [Google Scholar] [CrossRef]
  14. Cockcroft, M.G.; Latham, D.J. Ductility and the Workability of Metals. J. Inst. Met. 1968, 96, 33–39. [Google Scholar]
  15. González, A.A.; Celentano, D.J.; Cruchaga, M.A. Assessment of ductile failure models in single-pass wire drawing processes. Int. J. Damage Mech. 2018, 27, 1291–1306. [Google Scholar] [CrossRef]
  16. Cao, T.S.; Gaillac, A.; Montmitonnet, P.; Bouchard, P.O. Identification methodology and comparison of phenomenological ductile damage models via hybrid numerical-experimental analysis of fracture experiments conducted on a zirconium alloy. Int. J. Solids Struct. 2013, 50, 3984–3999. [Google Scholar] [CrossRef]
  17. Lian, J.; Sharaf, M.; Archie, F.; Münstermann, S. A hybrid approach for modelling of plasticity and failure behaviour of advanced high-strength steel sheets. Int. J. Damage Mech. 2013, 22, 188–218. [Google Scholar] [CrossRef]
  18. Münstermann, S.; Lian, J.; Bleck, W. Design of damage tolerance in high-strength steels. Int. J. Mater. Res. 2012, 103, 755–764. [Google Scholar] [CrossRef]
  19. Ko, Y.K.; Lee, J.S.; Huh, H.; Kim, H.K.; Park, S.H. Prediction of fracture in hub-hole expanding process using a new ductile fracture criterion. J. Mater. Process. Technol. 2007, 187–188, 358–362. [Google Scholar] [CrossRef]
  20. Egawa, K.; Yoshida, I.; Yoshida, H.; Mizobe, K.; Kida, K. Influence of repeated quenching-tempering on spheroidized carbide area in JIS SUJ2 bearing steel. IOP Conf. Ser. Mater. Sci. Eng. 2018, 307, 012045. [Google Scholar] [CrossRef]
  21. Swift, H.W. Plastic instability under plane stress. J. Mech. Phys. Solids 1952, 1, 1–18. [Google Scholar] [CrossRef]
  22. Mirnia, M.J.; Shamsari, M. Numerical prediction of failure in single point incremental forming using a phenomenological ductile fracture criterion. J. Mater. Process. Technol. 2017, 244, 17–43. [Google Scholar] [CrossRef]
  23. Bao, Y.; Wierzbicki, T. On the cut-off value of negative triaxiality for fracture. Eng. Fract. Mech. 2005, 72, 1049–1069. [Google Scholar] [CrossRef]
  24. Bai, Y.; Wierzbicki, T. A new model of metal plasticity and fracture with pressure and Lode dependence. Int. J. Plast. 2008, 24, 1071–1096. [Google Scholar] [CrossRef]
  25. Bai, Y.; Wierzbicki, T. Application of extended Mohr—Coulomb criterion to ductile fracture. Int. J. Fract. 2010, 161, 1–20. [Google Scholar] [CrossRef]
  26. Lou, Y.; Huh, H.; Lim, S.; Pack, K. New ductile fracture criterion for prediction of fracture forming limit diagrams of sheet metals. Int. J. Solids Struct. 2012, 49, 3605–3615. [Google Scholar] [CrossRef] [Green Version]
  27. Lou, Y.; Yoon, J.W.; Huh, H. Modeling of shear ductile fracture considering a changeable cut-off value for stress triaxiality. Int. J. Plast. 2014, 54, 56–80. [Google Scholar] [CrossRef]
  28. Mohr, D.; Marcadet, S.J. Micromechanically-motivated phenomenological Hosford-Coulomb model for predicting ductile fracture initiation at low stress triaxialities. Int. J. Solids Struct. 2015, 67–68, 40–55. [Google Scholar] [CrossRef]
  29. Hu, Q.; Li, X.; Han, X.; Chen, J. A new shear and tension based ductile fracture criterion: Modeling and validation. Eur. J. Mech. A/Solids 2017, 66, 370–386. [Google Scholar] [CrossRef]
  30. Cho, D.; Jang, Y.C.; Lee, Y. Evaluation of the prediction ability of ductile fracture criteria over a wide range of drawing conditions. J. Mech. Sci. Technol. 2019, 33, 4245–4254. [Google Scholar] [CrossRef]
  31. Abaqus, V. 6.14 Documentation. Dassault Syst. Simulia Corp. 2014, 651, 2–6. [Google Scholar]
  32. Avitzur, B. Hydrostatic Extrusion. J. Eng. Ind. 1965, 87, 487–493. [Google Scholar] [CrossRef]
  33. Avitzur, B. Analysis of central bursting defects in extrusion and wire drawing. J. Manuf. Sci. Eng. Trans. ASME 1968, 90, 79–90. [Google Scholar] [CrossRef]
  34. Alharbi, K.; Ghadbeigi, H.; Efthymiadis, P.; Zanganeh, M.; Celotto, S.; Dashwood, R.; Pinna, C. Damage in dual phase steel DP1000 investigated using digital image correlation and microstructure simulation. Model. Simul. Mater. Sci. Eng. 2015, 23, 085005. [Google Scholar] [CrossRef]
  35. Zhai, J.; Luo, T.; Gao, X.; Graham, S.M.; Baral, M.; Korkolis, Y.P.; Knudsen, E. Modeling the ductile damage process in commercially pure titanium. Int. J. Solids Struct. 2016, 91, 26–45. [Google Scholar] [CrossRef]
  36. Ånmark, N.; Karasev, A.; Jönsson, P.G. The effect of different non-metallic inclusions on the machinability of steels. Materials 2015, 8, 751–783. [Google Scholar] [CrossRef]
  37. Massé, T. Study and Optimization of High Carbon Steel Flat Wires. Ph.D. Thesis, Ecole Nationale Supérieure des Mines de Paris, Paris, France, 2010. [Google Scholar]
Figure 1. (a) Overall view of the draw bench equipment and control box. Maximum load is 20 tons and maximum drawing speed is 1 m/min. (b) Material being drawn, dies and a zig.
Metals 11 00479 g001
Figure 2. Fractured and non-fractured specimens for various r and α combinations. Thirteen specimens were not fractured, while sixteen specimens were fractured.
Metals 11 00479 g002
Figure 3. Engineering stress-strain responses measured from the tensile tests with a standard round specimen (ASTM E370) of SUJ2Z steel and those calculated from the FE simulation of the tensile tests.
Metals 11 00479 g003
Figure 4. (a) Non-destructive inspection being conducted on the drawn specimen, (b) ultrasonic testing (UT) monitor, and (c) drawn specimens inspected by radiographic testing (RT).
Metals 11 00479 g004
Figure 5. (a) Drawing limit diagrams (DLDs) reported in references [9,11,13] are analyzed for comparison purposes (reproduced). (b) DLD of SUJ2Z. Safe (no fracture) and unsafe (fracture) zones are distinguished by an identification curve (IC).
Metals 11 00479 g005
Figure 6. (a) Tensile force-displacement response and damage indicator w changes in the center element of the tensile specimen. (b) Process condition diagram (PCD) of SUJ2Z steel. Safe (no fracture) and unsafe (fracture) zones are distinguished by an IC. MOC represents a line connecting the set of points where the w crossed w U T S .
Metals 11 00479 g006
Figure 7. (a) PCD of SUJ2Z. (b) Scanning electron microscopy (SEM) micrographs for various α and r combinations: (i) α = 6°, r = 20%, and ω = 0.159; (ii) α = 4°, r = 36%, and ω = 0.161; (iii) α = 8°, r = 36%, and ω = 0.191; (iv) α = 10°, r = 36%, and ω = 0.351; (v) α = 10°, r = 12%, and ω = 0.363; and (vi) α = 10°, r = 20%, and ω = 0.442.
Metals 11 00479 g007
Table 1. Chemical composition of the SUJ2Z (%).
CSiMnPSCrMo
0.95~1.100.15~0.350.500.0250.0251.30~1.600.08
Table 2. Mechanical properties of SUJ2Z.
Young’s Modulus (GPa)Poisson’s RatioYS (MPa)UTS (MPa)Uniform Elongation (%)Fracture Elongation (%)Reduction of Cross Section Area at Fracture (%)
2000.36891218.471117
Table 3. Parameters used in expressing the true stress–strain curve and their values.
K (MPa)n ε 0 ε ¯ n e c k i n g σ ¯ U T S   ( MPa ) Q
1555.780.0670.0060.0671305.330.65
Table 4. Results of the draw bench test and the corresponding finite element (FE) analysis results, where “O” denotes no material fractured and “X” indicates material fracture occurred during drawing.
r (%)α (°)TestPredictionr (%)α (°)TestPrediction
1012OO362XO
14OO4OO
16XO6OO
20XO8OO
202OO10OO
4OO12XX
6OO14XX
8OO16XX
10OO492XX
12XX4XX
14XX6XO
16XX8OO
20XX10OO
12XX
14XX
16XX
Publisher’s Note: MDPI stays neutral with regard to jurisdictional claims in published maps and institutional affiliations.

