Article

Experimental and Computational Approach to Fatigue Behavior of Polycrystalline Tantalum

1
Centre des Matériaux (CMAT), MINES ParisTech, PSL University, CNRS UMR 7633, BP 87 91003 Evry, France
2
CEA Valduc, 21120 Is-sur-Tille, France
3
Laboratoire Interdisciplinaire Carnot de Bourgogne, UMR 5209 CNRS, Université de Bourgogne Franche Comté, 9 Avenue Alain Savary, BP 17870, 21078 Dijon CEDEX, France
*
Author to whom correspondence should be addressed.
Current address: Varinor SA Rue St Georges 7, 2800 Delémont, Switzerland.
Metals 2021, 11(3), 416; https://doi.org/10.3390/met11030416
Submission received: 23 January 2021 / Revised: 19 February 2021 / Accepted: 21 February 2021 / Published: 3 March 2021
(This article belongs to the Special Issue Trends in Plasticity of Metals and Alloys)

Abstract

:
This work provides an experimental and computational analysis of low cycle fatigue of a tantalum polycrystalline aggregate. The experimental results include strain field and lattice rotation field measurements at the free surface of a tension–compression test sample after 100, 1000, 2000, and 3000 cycles at ± 0.2 % overall strain. They reveal the development of strong heterogeneites of strain, plastic slip activity, and surface roughness during cycling. Intergranular and transgranular cracks are observed after 5000 cycles. The Crystal Plasticity Finite Element simulation recording more than 1000 cycles confirms the large strain dispersion at the free surface and shows evidence of strong local ratcheting phenomena occurring in particular at some grain boundaries. The amount of ratcheting plastic strain at each cycle is used as the main ingredient of a new local fatigue crack initiation criterion.

1. Introduction

Polycrystalline tantalum, a refractory material used in several industrial applications such as nuclear, biomedical, and chemical engineering, has been the subject of intensive research dealing with the understanding of plastic deformation modes, mainly at large strain and strain rates [1,2,3]. Modern experimental and computational techniques have been applied to body centered cubic (BCC) metals at the grain level [4]. They include Electron Back-Scatter Diffraction (EBSD) analysis of crystal lattice orientation and its evolution during deformation, Digital Image Correlation (DIC) analysis for the determination of strain fields [5], as well as Crystal Plasticity Finite Element simulations (CPFEM) at the continuum level relying on appropriate constitutive equations [6], and molecular dynamics simulations [7]. These techniques have been applied to tantalum polycrystals and oligocrystals in [8,9]. They give access to plastic slip mechanisms by identification of the traces of slip lines [10], to the lattice curvature and identification of Geometrically Necessary Dislocations (GND) densities [11], and to damage mechanisms [12].
All previous referenced works deal with the monotonic behavior of tantalum. In contrast, the cyclic behavior of tantalum has attracted only limited interest from the scientific community. Fatigue life assessment of polycrystalline tantalum is of the utmost importance in biomedical applications [13]. Reported results on High Cycle Fatigue (HCF) and Low Cycle Fatigue (LCF) behavior of tantalum seem to be limited to those in [14,15], respectively. In the latter reference, a macroscopic constitutive model was proposed to simulate the hysteresis stress–strain loops obtained experimentally. The shown experiments and proposed model include specific strain aging effects exhibited by pure tantalum in the form of a peak stress at the early plastic flow, due to interactions between dislocations and solute atoms like oxygen. An important feature of the cyclic response of metallic alloys is the ratcheting behavior which results from locally or globally non-symmetric stress loading conditions [16]. The authors of [17] provide unique computational results evaluating the amount of ratcheting inside the grains of a tantalum polycrystalline aggregate. The approach is based on the identification of tantalum single crystal model from single crystal monotonic and cyclic curves. An alternative single crystal model incorporating the effect of GNDs was proposed recently [18]. A major result in [17] is the clear evidence of a free surface effect in the ratcheting behavior which has implications in the initiation of fatigue cracks. Crystal plasticity-based fatigue initiation criteria make use of appropriate indicators involving the effects of resolved shear stress on the slip systems, cumulative slip and effect of normal to slip, or cleavage planes [19,20,21,22,23]. Statistical probabilistic fatigue criteria can then be proposed based on these indicators [24,25]. As an example, a fatigue crack nucleation criterion was developed for titanium Ti-6242 using accelerated crystal plasticity FEM simulations in [26].
The objectives of the present work is ( i ) to provide the first experimental results on plasticity and cracking at the free surface of a tantalum polycrystal by combining EBSD, DIC, and CPFEM, and ( i i ) to propose a novel fatigue crack initiation model at the continuum level of crystal plasticity. For that purpose, the results of an interrupted cyclic tensile–compression test are documented in terms of plastic slip activity, strain, and lattice rotation field measurements and detection of intergranular and transgranular cracks at the free surface of a tantalum polycrystalline aggregate. These results are compared with a unique CPFEM simulation of more than 1000 cycles on a semi-periodic polycrystalline aggregate. The experimentally observed and computed polycrystalline aggregates are distinct. The authors of [27,28] show that the full 3D grain structure is needed to make meaningful predictions of the plasticity at the surface by CPFEM. The experimental analysis is limited here to the surface description. No FIB image of the sample was available.
The original results of the present contribution deal with ( i ) evolution of the surface roughness, correlated with local EBSD and strain fields evolutions; ( i i ) dominance of intergranular or transgranular crack initiation observed after 5000 cycles; ( i i i ) numerical estimation of strain heterogeneities at the surface and in the bulk of a polycrystalline aggregate and ratcheting effects at the free surface; and ( i v ) design of a new fatigue crack initiation criterion at the mesoscale of the polycrystalline aggregate.
The paper is organized as follows. The experimental methods and results are presented in Section 2. Section 3 deals with the description of the FE simulation of a polycrystalline aggregate and the design of the fatigue crack initiation criterion. Experimental and computational results are discussed and compared in Section 4.
The index notation is used throughout the work to denote vectors and tensors: Cartesian coordinates x i of the material point and of the strain and stress tensors ε i j , σ i j , within the small strain framework.

2. Experimental Approach

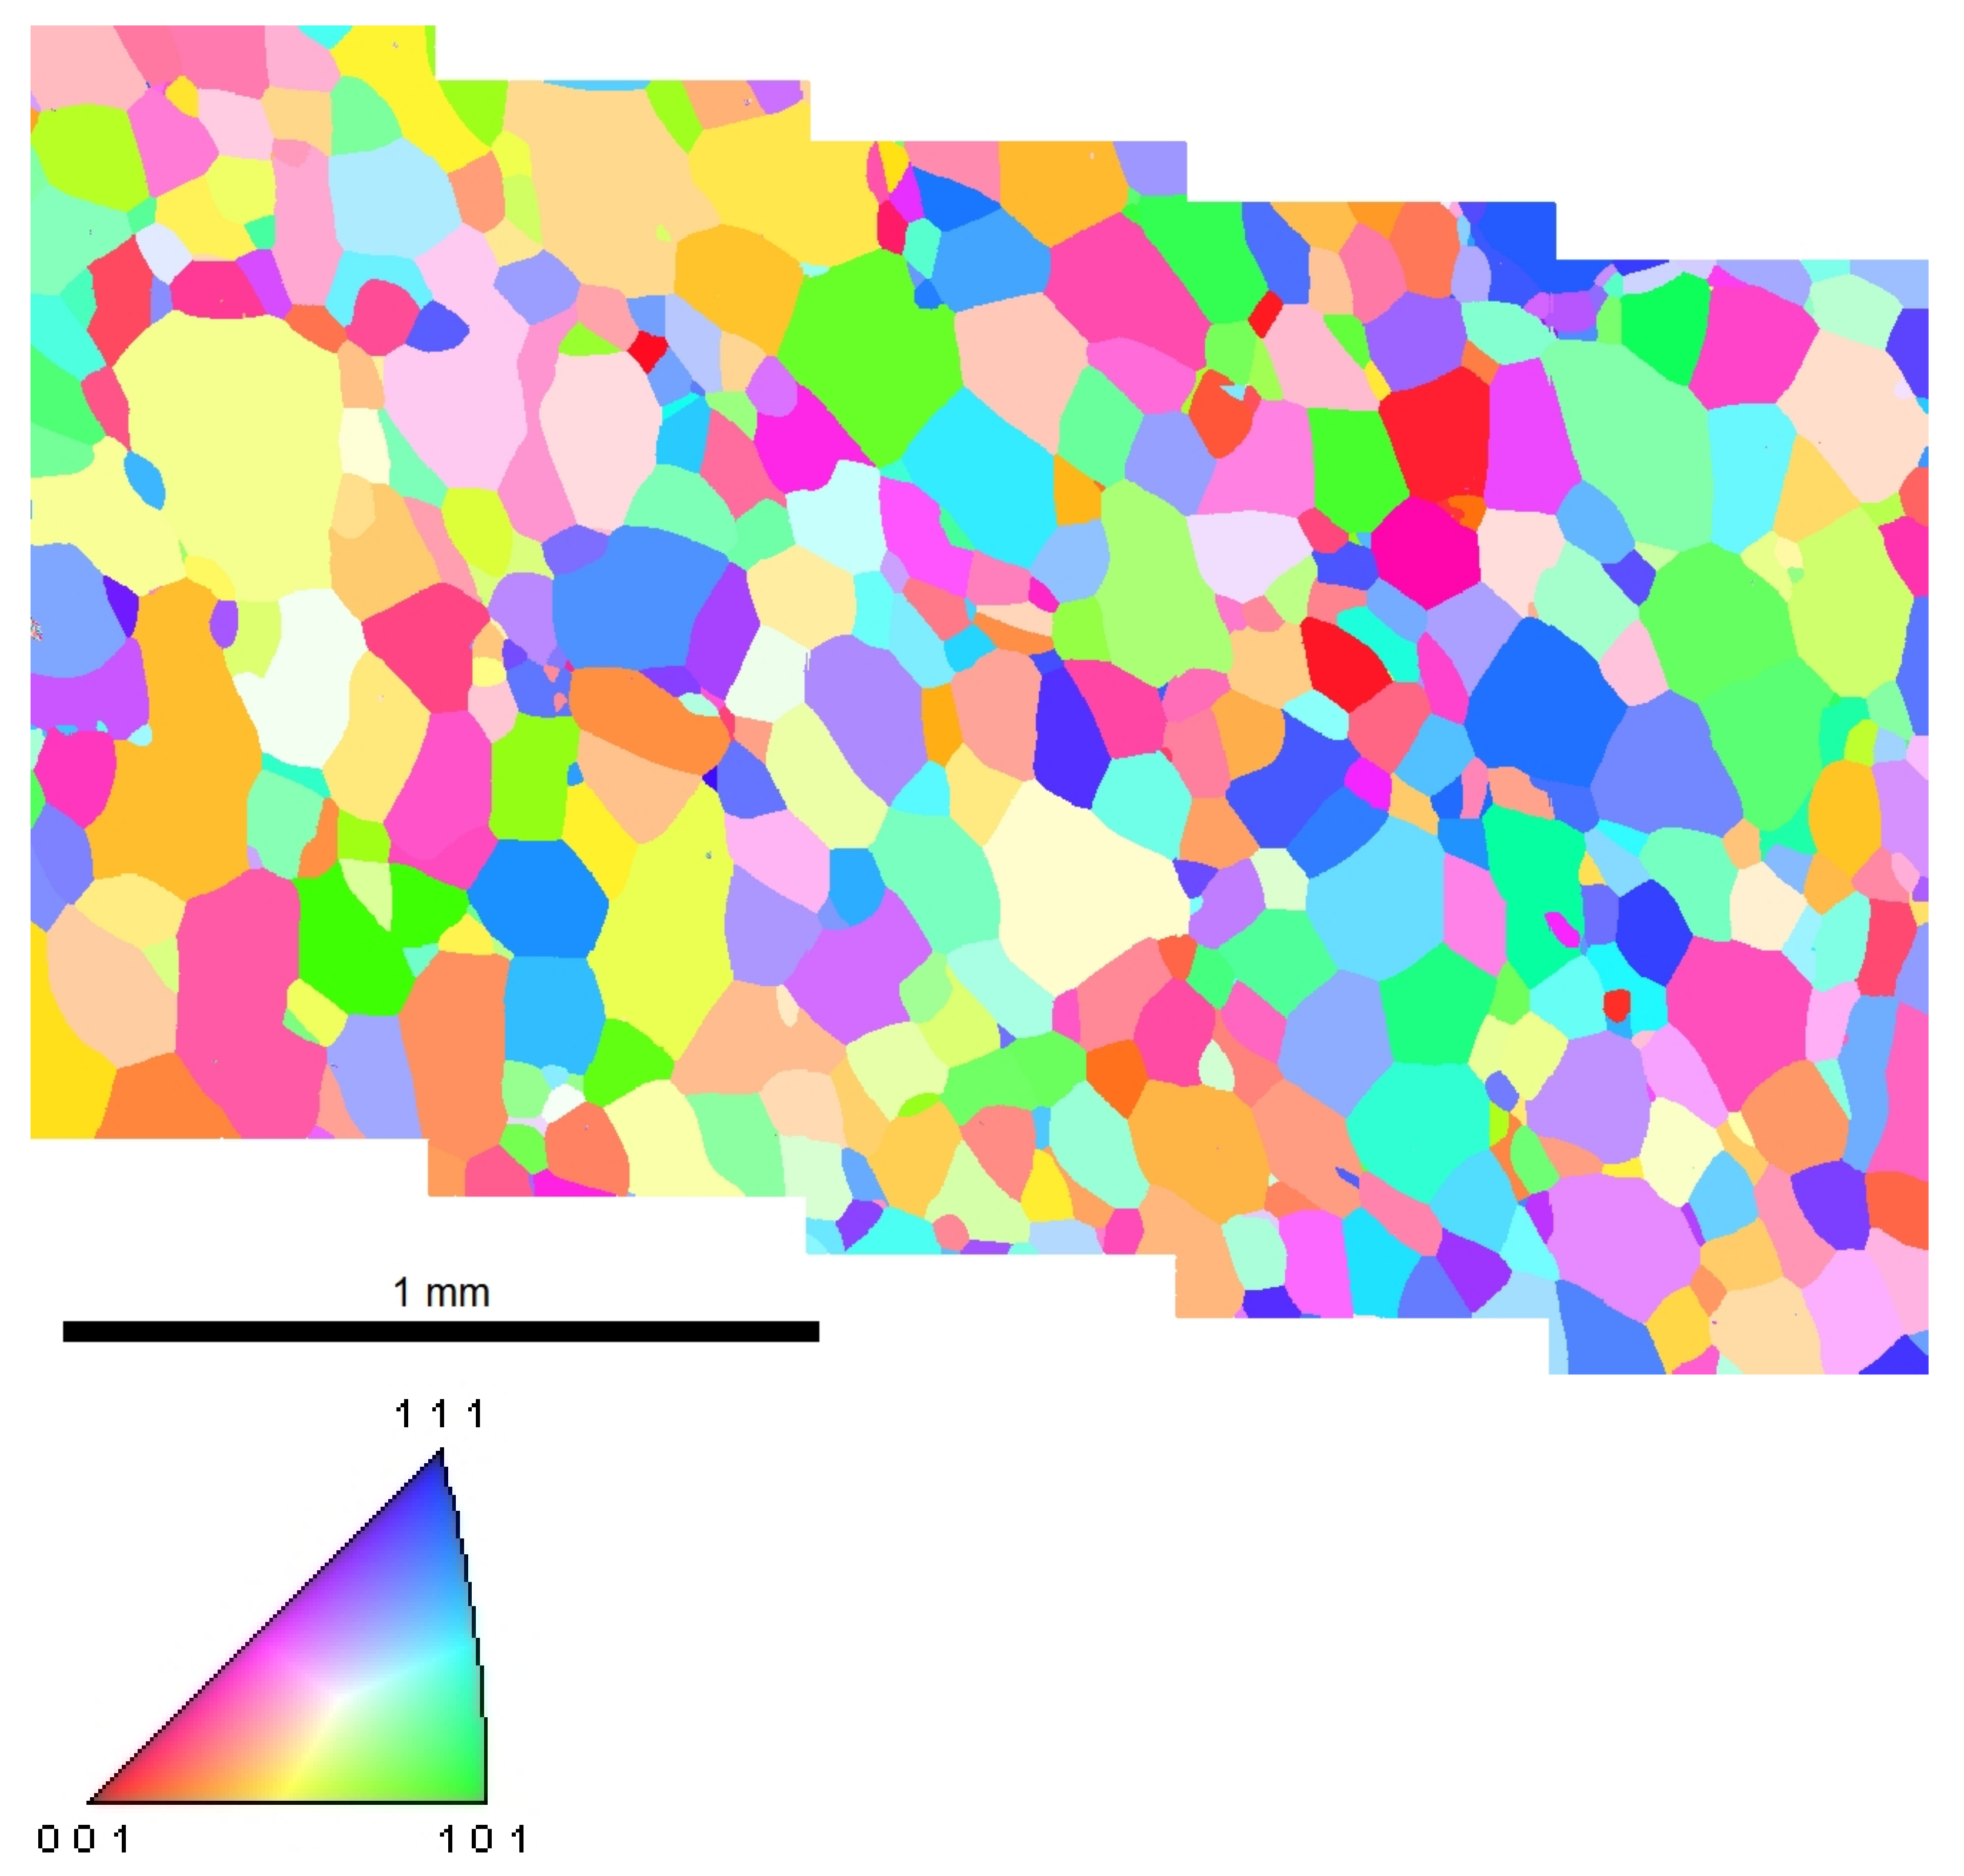
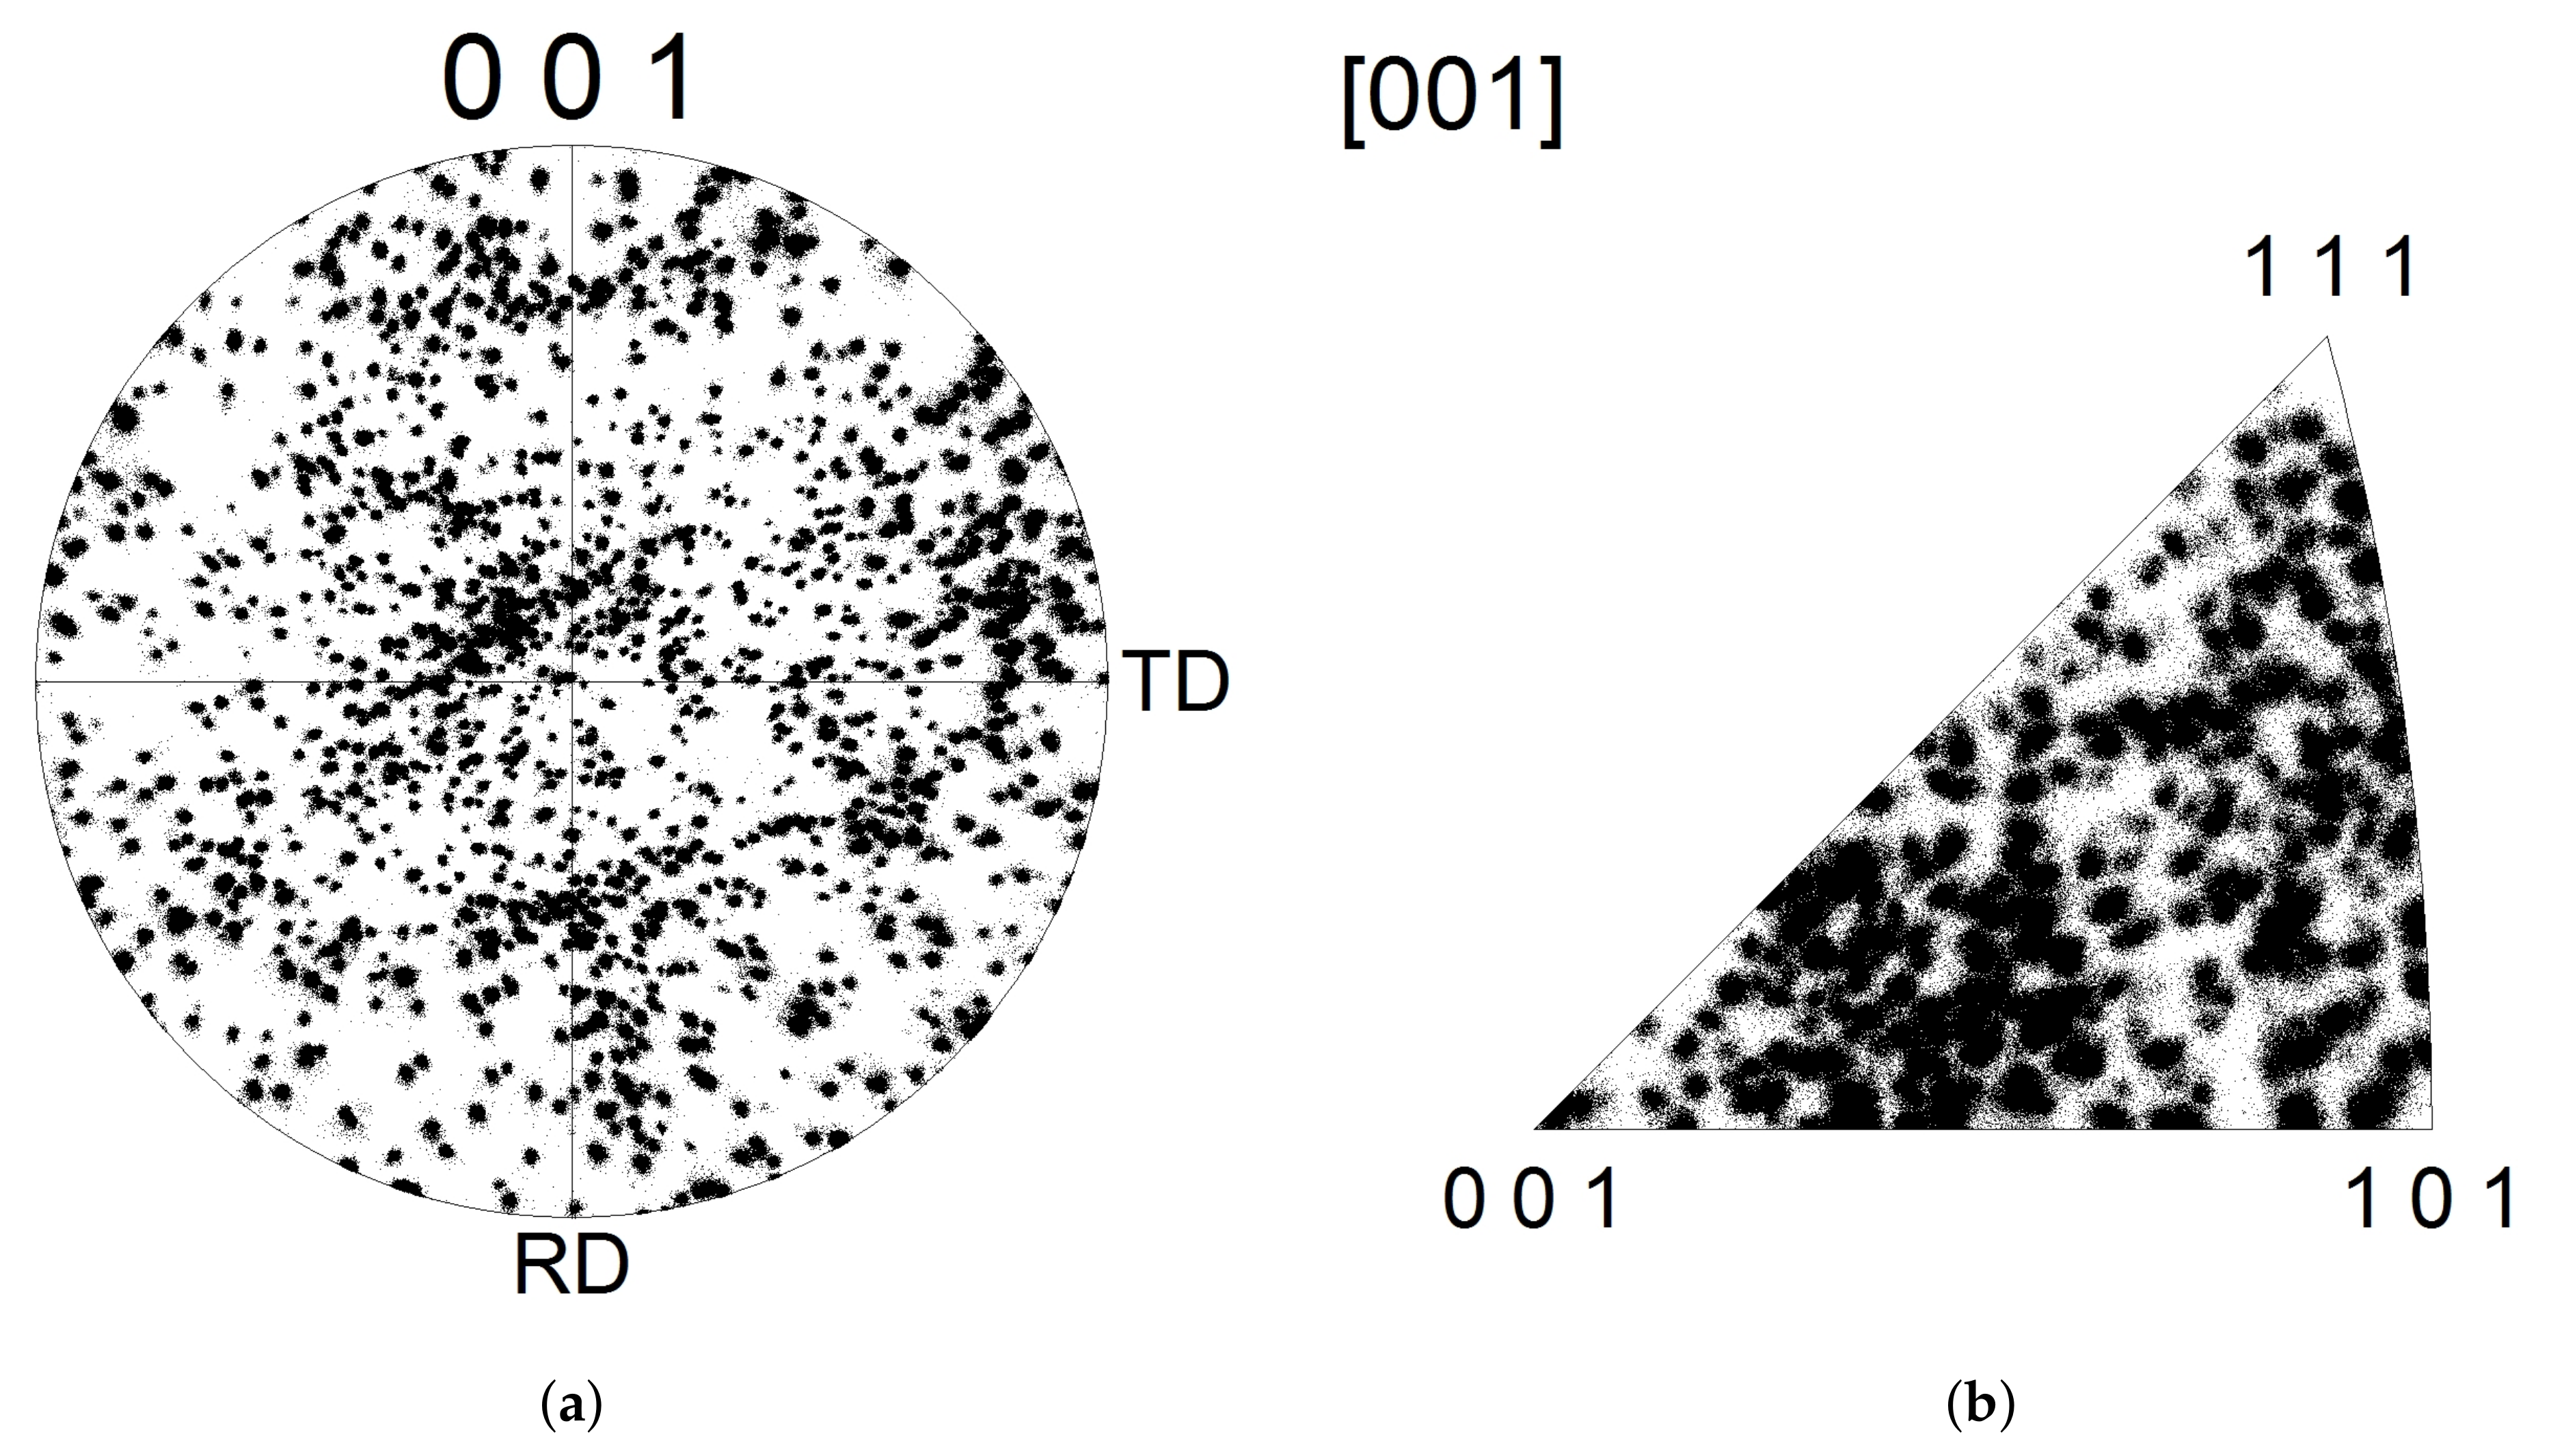
2.1. Material and Experimental Methods

Tantalum is a refractory material used in several industries such as nuclear, capacitors, lighting, biomedical, and chemical processing. The material studied is a commercially pure tantalum (99.95% w.) coming from Cabot Performance Materials (USA). The sheet used has been recrystallized during 2 h between 1000 and 1200 C and under 10 4 to 10 5 mbar. After recrystallization, the mean grain size is close to 120 μ m and the initial dislocation density is rather high, between ρ d 10 13 m 2 and ρ d 10 14 m 2 [29,30,31,32,33]. These values are in agreement with measurements of GND densities deduced from EBSD data for recrystallized tantalum in the references [9,34].
The tantalum purity is characterized by the following composition of solute atoms: C: 10, N: <10, O: 19, H: 6 ppm. Some of these elements are responsible for strain aging effects studied in [15].
The EBSD map over a large area on Figure 1 shows quasi-equiaxial grains without marked crystallographic texture. The fact that no predominant direction is observed is due to cross rolling of the sheets. Some curved grain boundaries are present, probably due to sub-optimal recrystallization conditions. The pole figure analysis on raw data does not show a significant crystallographic texture (cf. Figure 2). Thus, the hypothesis of an isotropic texture is adopted in the following work, particularly for the input data of the polycrystalline aggregate generation.
The macroscopic cyclic behavior of the considered polycrystalline tantalum has been investigated for various amplitudes and strain rates in another article by the same authors [15]. In the present paper, the attention is focused on the observation of local plasticity events at the surface of one single sample. An interrupted cyclic tension–compression test has been performed on a thick enough flat sample to avoid potential buckling. The dogbone specimen had a gauge part with dimensions 15 × 10 × 8 mm 3 , see Figure 1b in [15] for the detailed sample geometry. The specimen geometry is not a standard one but allows for DIC and microstructural observations on the flat surfaces. The strain rate was ε ˙ = 10 3 s 1 for a strain amplitude of Δ ε / 2 = 0.2 % .
The sample was polished before Electron Beam Lithography deposition. Several grids have been spread along the sample, consisting in 500 nm markers, with a 5 μ m pitch on a 400 × 400 μ m 2 zone.
The cyclic test has been interrupted after 100, 1000, 2000, and 3000 cycles. Each time, the sample was unloaded from the test machine and placed into a SEM for secondary, backscattered, and EBSD analyses of each grid. The testing machine used is a servo-hydraulic Instron 8800. All the SEM observations have been done using the same beam parameters and adjustments and the same magnification.
The shape of the hysteresis loops does not evolve significantly during the test, with a marked Bauschinger effect. The isotropic hardening of about 20 MPa reaches a saturation point after ≈50 cycles. The sample is unloaded at zero force, with an increment of macroscopic plastic strain about ε 22 = 0.001 after each sequence.

2.2. Local Evolution of the Surface during Cycling

At each step, the load was decreased to zero in order to observe the specimen ex situ in a SEM. The SEM pictures give some information about the surface evolution.
The pictures of Figure 3 show the roughness evolution after 100, 1000, 2000, and 3000 cycles. The roughness gradually increases, with a stronger effect close to grain boundaries. Grains encircled in blue, for instance, are subjected to the progressive formation of a step along grain boundaries. This can induce some stress concentration or notch effect, and lead to microstrucural ratcheting, as discussed later [35]. The images also show numerous curved slip lines associated with the easy cross slip characteristic of BCC materials [36]. Such sinuous or wavy slip lines are also referred to as pencil glide [37].
Moreover, most of the grains exhibit slip bands that look like Persistent Slip Bands (PSB). They progressively intensify with increasing cycle numbers. PSBs are stopped at grain boundaries, except for the area circled in red, where PSBs spread on both sides of the grain boundary, probably because of the weak misorientation between the two grains. This has been observed in previous work [38].
The green circle on Figure 3 denotes a zone of a large grain that progressively becomes concave. This grain also presents PSB-like structures.
Thus, the surface activity is very intense. It can be characterized by local strain fields measurements provided by Digital Image Correlation (DIC) and also by lattice rotation fields given by EBSD.

2.3. Strain Field Measurements

The strain control loading is characterized by the half-amplitude Δ ε / 2 and the loading ratio R = 1 . Four successive sequences of cyclic loading are carried out: The first sequence between 0 and 100 cycles, the second until 1000 cycles, the third until 2000, and the fourth until 3000 cycles. After each loading sequence, the sample is unmounted in order to observe the specimen ex situ in a SEM equipped with an EBSD detector. SEM data are used in order to build the displacement field of an area between two loading sequences using Vic-2D digital image correlation (DIC) software in the sequential mode (the first picture is used as a reference in any case). The spatial resolution of the acquired SEM images about 100 nm per pixel.
The ZNSSD method proposed by the Vic-2D 5 software (Zero-mean Normalized Sum of Squared Differences) has been used to handle the images because it accounts for both the lightening scale factor and the gray level offset [39]. This method is especially suitable for SEM pictures with significant gray level variations.
The measurement uncertainty associated with the strain field calculation from SEM pictures is due to three main factors: the magnification, the scanning, and the drift of the beam. In any case, the maximum cumulated error is about 1 pixel [40,41,42,43]. Moreover, the out-of-plane displacements and the system alignment compared to the surface can induce significant errors that are not taken into account. A quantification and a correction procedure have been proposed by Sutton [44]. However, the correction levels are smaller than our resolution and are thus not taken into account here.
The grid of nano-markers is built in six successive steps, as described in previous works [45,46]. The markers are made of nickel in order to have a sufficient contrast with tantalum. Several grids of 400 × 400 μ m 2 have been spread along the sample gauge length. The markers have a 500 nm diameter and a 5 μ m periodic pitch. The Electron Beam Lithography method is quite time consuming for large scale patterns, and thus a compromise between insolation time and covered surface versus spatial resolution has been chosen. The grids are not directly used for the DIC, but they are useful to mark the area of interest. Instead, the DIC is based on the gray level variations of the surface (including the variations due to the presence of the grids). DIC from natural contrast associated with varying gray levels due to surface roughness for example in SEM images has been used extensively in the past during in situ testing, see, for instance, the work in [47].
Experimental strain fields ε 11 , ε 12 and ε 22 for several sequences are presented in Figure 4, where the loading direction is 2. They have been computed using Vic-2D from back-scattered electrons pictures, with a correlation window 100 × 100 pixels and a 50 pixel grid spacing. When applied to a strain value of 5%, this gives a displacement of 2.5 pixel. Correlation errors in our measurements range from 0.1 pixel to 1 pixel maximum, which leads to errors from 0.1% to 1% in absolute strain values.
Strongly heterogeneous strain fields are observed with local strain values reaching a few percents in spite of 0.2% macroscopic prescribed half-amplitude. This strain heterogenity increases with the cycle number culminating at the final observed stage of 3000 cycles. Strain discontinuities are visible at some grain boundaries resulting from strain incompatibilities from grain to grain due to different crystallographic orientations. The red circle points out a zone of strong strain discontinuities on both sides of several grain boundaries. Zones of rather homogeneous strain are observed that encompass several grains. Their size corresponds to grain clusters of 150–200 μ m.
The green circle indicates an area of strong intragranular strain in a zone of two large grains with low misorientation, as is indicated on the EBSD maps of the top pictures of Figure 4. The EBSD maps show the evolution of lattice orientation during cycling. Lattice curvature clearly develops inside the grain as a result of heterogeneous plastic strain [48]. The building-up of rotation gradient inside the grains is particularly visible in the green circled region. The evolution of lattice orientation changes inside the grains is illustrated in Figure 5. The grain orientation spread (GOS) is computed in each grain at each cycle number, as the averaged misorientation range inside each grain. Orientation spreading clearly increases with cycle numbers reaching values of a few degrees. After 3000 cycles, lattice spreading exceeds 5 in some regions circled in the black and white zones. As a rule of thumb, crystal plasticity teaches us that one degree of lattice rotation is associated with a plastic strain of typically 0.01. These suggested local strain levels are confirmed by the strain field measurements. On the other hand, a misorientation of typically 5 over 100 micron can be associated to a GND density in the range 10 12 13 m 2 which is expected in annealed tantalum. Note, however, that statistically stored dislocations (SSD) also contribute to the overall dislocation density and cannot be derived solely from EBSD maps.
Histograms are provided for each strain components at 4 cycle numbers in Figure 6. The strain distributions correspond to the zone observed in Figure 4. A spreading of the strain distribution is observed for increasing cycle numbers. This illustrates quantitatively the strain heterogeneities discussed in the previous paragraphs. A significant part of the distribution is located at high values of surface strains, in spite of the low applied global amplitude. This corresponds to the visible roughening of the surface, a well-known effect in fatigue [49,50]. Significant errors in the measured strain values are expected due to the out of plane displacement component which limits the validity of the 2D correlation. This is especially the case after 3000 cycles where surface roughening is very pronounced. A remarkable feature of the ε 22 and ε 11 histograms is the shift toward larger mean values after 2000 and 3000 cycles. This indicates that considered region made of about 60 grains behaves as a whole differently from macroscopic straining conditions. This means that the representative volume element size for fatigue loading conditions must be larger than this observed zone. Maximal values for the ε 11 and ε 12 components are greater than 5% up to 11% after 3000 cycles. After 3000 cycles, the computed ε 11 and ε 22 strain values are strongly affected by errors induced by surface roughing. These high values are in agreement with the literature, where similar strains are calculated from experimental data [51] in stainless steels. Similar maximal local strains have been calculated in the literature for different loading conditions from the present case [45,52,53] in Nickel-based superalloys.
For the ε 22 component after 3000 cycles, the distribution becomes highly scattered around a mean strain close to 3%. The zones of maximum strain correspond to areas including sliding grain boundaries (see the red circles in Figure 4 and blue circles in Figure 3). Clear evidence of grain boundary sliding (GBS) can be seen in Figure 3 after 1000 and 2000 cycles in the form of an inclined white line in the lower right part of the pictures indicating out of plane sliding of one grain boundary.

2.4. Fatigue Crack Initiation

Crack initiation is observed mainly at grain boundaries, thus indicating an intergranular cracking mechanism. Intergranular crack branching is observed at triple junctions in Figure 7. Transgranular cracking is also observed as a competing mechanism, see the red circle in Figure 7. Severe extrusion–intrusion zones are visible in the blue circle of the same figure. They are associated with numerous intense slip lines visible in some grains. Crack branching from a grain boundary to some PSB is found to take place in a grain circled in red in Figure 7. As the fatigue test has been interrupted after 5000 cycles, it is not known whether the final fracture is due to inter- or trans-granular cracks. In previous studies at CEA (unpublished), a combined intergranular–transgranular fracture has been reported [38,54]. After 5000 cycles, the minimum crack size observed is about ≈10 μ m and the maximal one is ≈120 μ m.
The presented cyclic test was carried out until the appearance of the first stage I crack at the surface, as defined by Forsyth [55]. In that case, the cracks have a length similar to the grain size and can be both intergranular or transgranular. This corresponds to micro-crack initiation for which a criterion will be proposed in the following.

3. Finite Element Simulation

The Finite Element simulation described in the following has been introduced in the reference [17]. The computational method and the constitutive model are only briefly recalled. The remainder of this section concentrates on results not presented in [17] that can be compared to the experimental data explored in the previous section.

3.1. Description of Semi-Periodic Polycrystalline Aggregates

The simulation is based on a synthetic polycrystalline aggregate because a one-to-one mapping to the experimentally observed zone was not possible due to the ignorance of the sub-surface grain morphology. The polycrystalline aggregates considered in this work is characterized by two parallel flat surfaces perpendicular to the space direction 3, and four lateral surface displaying periodicity of grain morphology along the directions 1 and 2, as shown in Figure 8. The through-thickness view on Figure 8 shows that the grain morphology of the parallel flat surfaces are not periodic. The aggregate on Figure 8 contains 250 grains with 4 to 5 grains through the thickness in average. The construction of such semi-periodic polycrystalline aggregates starting from a classical Voronoi tesselation follows the strategy proposed by J. Guilhem in [56]. By construction, grain boundaries are flat surfaces ensuring continuity of displacement and reaction forces in finite element simulations. This is a simplification compared to the real curved grain boundaries visible in Figure 1.
The three-dimensional finite element mesh is made of quadratic tetrahedral elements with full integration. The mesh of Figure 8 contains 55,089 nodes and 37,595 quadratic elements. The authors of [27,28] address the question of suitable mesh size for proper representation of surface field. We have used these recommendations in the current work, even though the computational cost lead us to use rather coarse elements.
The number of grains in the polycrystalline volume and the mesh refinement have been chosen as a compromise between computational cost for cycling testing and sufficient representativity of the polycrystalline response according to previous studies of Representative Volume Element size for f.c.c. crystals [57,58,59]. In particular, the thickness was chosen following the works in [27,28] that show that the strain field at a free surface of a cubic polycrystal is affected mainly by the three layers of grains below the surface. A discussion on the Representative Volume Element size for polycrystals under cyclic loading conditions can be found in [17] based on the few works in this field [58,60] where polycrystalline agregates made of 100 grains were considered. Finally, it must be noted that only one Finite Element simulation was carried out in this work due to the fact that more than 1000 cycles were simulated leading to computation times not compatible with a statistical analysis for several realizations of the microstructures.
The detailed boundary conditions are described in [17]. They amount to prescribing the mean strain in the tension–compression direction 2 with vanishing mean stress components (except < σ 22 > ). The two flat surfaces of the polycrystalline aggregate of Figure 8 are called z = 0 and z = H . The surface z = 0 is subjected to the Dirichlet boundary condition u 3 = 0 where u 3 is the displacement component along the direction 3, see the coordinate frame in Figure 8. The remaining boundary conditions for this surface z = 0 are vanishing traction components along 1 and 2. The surface z = H is traction-free in all 3 directions, corresponding to a free surface, as in the experiment. The strain fields on this free surface will be analyzed and compared, in a statistical sense, with the experimental results.
Periodicity conditions are prescribed for the remaining four lateral surfaces. Such conditions are known to limit boundary layer effects in the simulation of material volume elements in contrast to homogeneous Dirichlet or Neumann conditions, see the works in [58,61,62,63].
The average stress and strain components over the whole polycrystalline volume element V are computed as
Σ i j = < σ i j > = 1 V V σ i j d V , E i j = < ε i j > = 1 V V ε i j d V
The macroscopic strain component E 22 = ± 0.2 % is imposed. The loading conditions therefore correspond to a simple tension–compression test with one free surface, four periodic surfaces, and one flat surface.
The results presented in this work correspond to the simulation of more than 1000 cycles on the previously described polycrystalline aggregate. They represent 11 months of computation time on a 12 core Intel Xeon 3 GHz processor with 25 GB RAM. 1250 time steps were saved for 70 variables (stress, strain, and plastic strain tensor components; slip amounts; accumulated slip amounts; kinematic hardening variables; accumulated plastic strain...) at each integration point, which amounts to 250 GB disk space.

3.2. Crystal Plasticity Model and Identification of Material Parameters

The constitutive equations of the crystal plasticity model used for tantalum are now given. The Cailletaud crystal plasticity model [64] is extended here to include static strain aging effects as displayed by tantalum crystals [15]. The strain tensor is the sum of the elastic and plastic contributions:
ε i j = ε i j e + ε i j p
The local elastic behavior is cubic, with an elasticity tensor defined by the three independent elastic moduli: C 11 = 267 MPa, C 12 = 159 MPa, and C 44 = 83 MPa, after the work in [65].
The plastic strain tensor results from plastic slip processes with respect to all slip systems. In the present work, 12 slip systems are considered on {110} slip planes with slip directions <111> corresponding to the b.c.c. structure. This choice represents a simplification as more slip planes are known to be available in b.c.c. crystals [66]. An alternative approach would be to introduce the pencil glide mechanism as done in [37]. Motivations for the present choice can be found in [67] where the selection of {110} vs. {112} slip planes is discussed. The viscoplastic strain rate tensor is written as
ε ˙ i j p = s γ ˙ s m i j s , with m i j s = 1 2 ( i s n j s + n i s j s )
where n i s are the components of the normal vector to the slip plane and j s that of the slip direction vector, for the slip system s. The slip rate for each slip system is evaluated using the following model equation:
γ ˙ s = v ˙ 0 sinh < | τ s x s | r s r a > σ 0 sign ( τ s x s ) , v ˙ s = | γ ˙ s |
where τ s = σ i j m i j s is the resolved shear stress for slip system s and v s is the cumulative slip variable. The parameters v ˙ 0 and σ characterize the viscosity effects. The Macaulay brackets < > = Max ( , 0 ) were used. The isotropic hardening law describing the evolution of the critical resolved shear stress (CRSS) follows a nonlinear evolution law:
r s = r 0 + Q r h s r ( 1 exp ( b v r ) )
where r 0 is the initial CRSS. Q and b are material parameters; h s r is the interaction matrix which characterizes both self-hardening and cross(latent)-hardening between the different slip systems.
The kinematic hardening term is the main ingredient for the description of internal stresses building up inside the grains, for instance due to dislocation pile–ups and dislocation structure formation. It is decomposed into two contributions:
x s = x 1 s + x 2 s
The evolution equation of each component is
x ˙ i s = c i γ ˙ s d i x i s v ˙ s , i { 1 , 2 }
where c i and d i are kinematic hardening material parameters. The reason for introducing two components x 1 s and x 2 s is a better description of the hysteresis loops at various strain amplitudes.
The previous crystal plasticity model was enhanced in [17] by the addition of a resistance term associated with static strain aging, namely, the component r a in Equation (4). This strain aging effect is not discussed here as it concerns mainly the first hysteresis loops, whereas the focus of the present work is crack initiation at larger cycle numbers.
The values of the model parameters were identified from tensile and cyclic tests carried out on tantalum single crystals. The identification procedure was detailed in [17]. Table 1 provides the list of parameter values found in the latter reference and used for the present simulation.
The single crystal model has been implemented in the implicit finite element code Zset [68], following the procedure presented in [69]. Global equilibrium is solved using a Newton–Raphson algorithm and the constitutive equations are integrated using a second order Runge–Kutta method with adaptive time stepping.

3.3. Simulation of the Mechanical Fields at the Free Surface

The overall stress–strain loops, i.e., the < σ 22 > < ε 22 > curves, of the studied cyclic test on the considered polycrystalline aggregate are given in Figure 9 for various cycle numbers from the CPFEM simulation. The stress and strain amplitudes are clearly visible. The loops at 66, 466, and 1066 are almost identical showing that no macroscopic ratcheting takes place for the considered loading. The first loop is strongly different due to the initial peak stress associated with static strain aging discussed in [15,17]. Comparison between experimental initial and stabilized loops can be found in the latter reference. It is not reported here since the present work concentrates on cycle numbers from 100 to 5000.
The evolution of several mechanical variables on the free surface of the polycrystal is now discussed with respect to the number of cycles. All surface fields are provided for a vanishing value of the mean axial stress Σ 22 = σ 22 = 0 MPa in accordance with the experimental observation conditions.

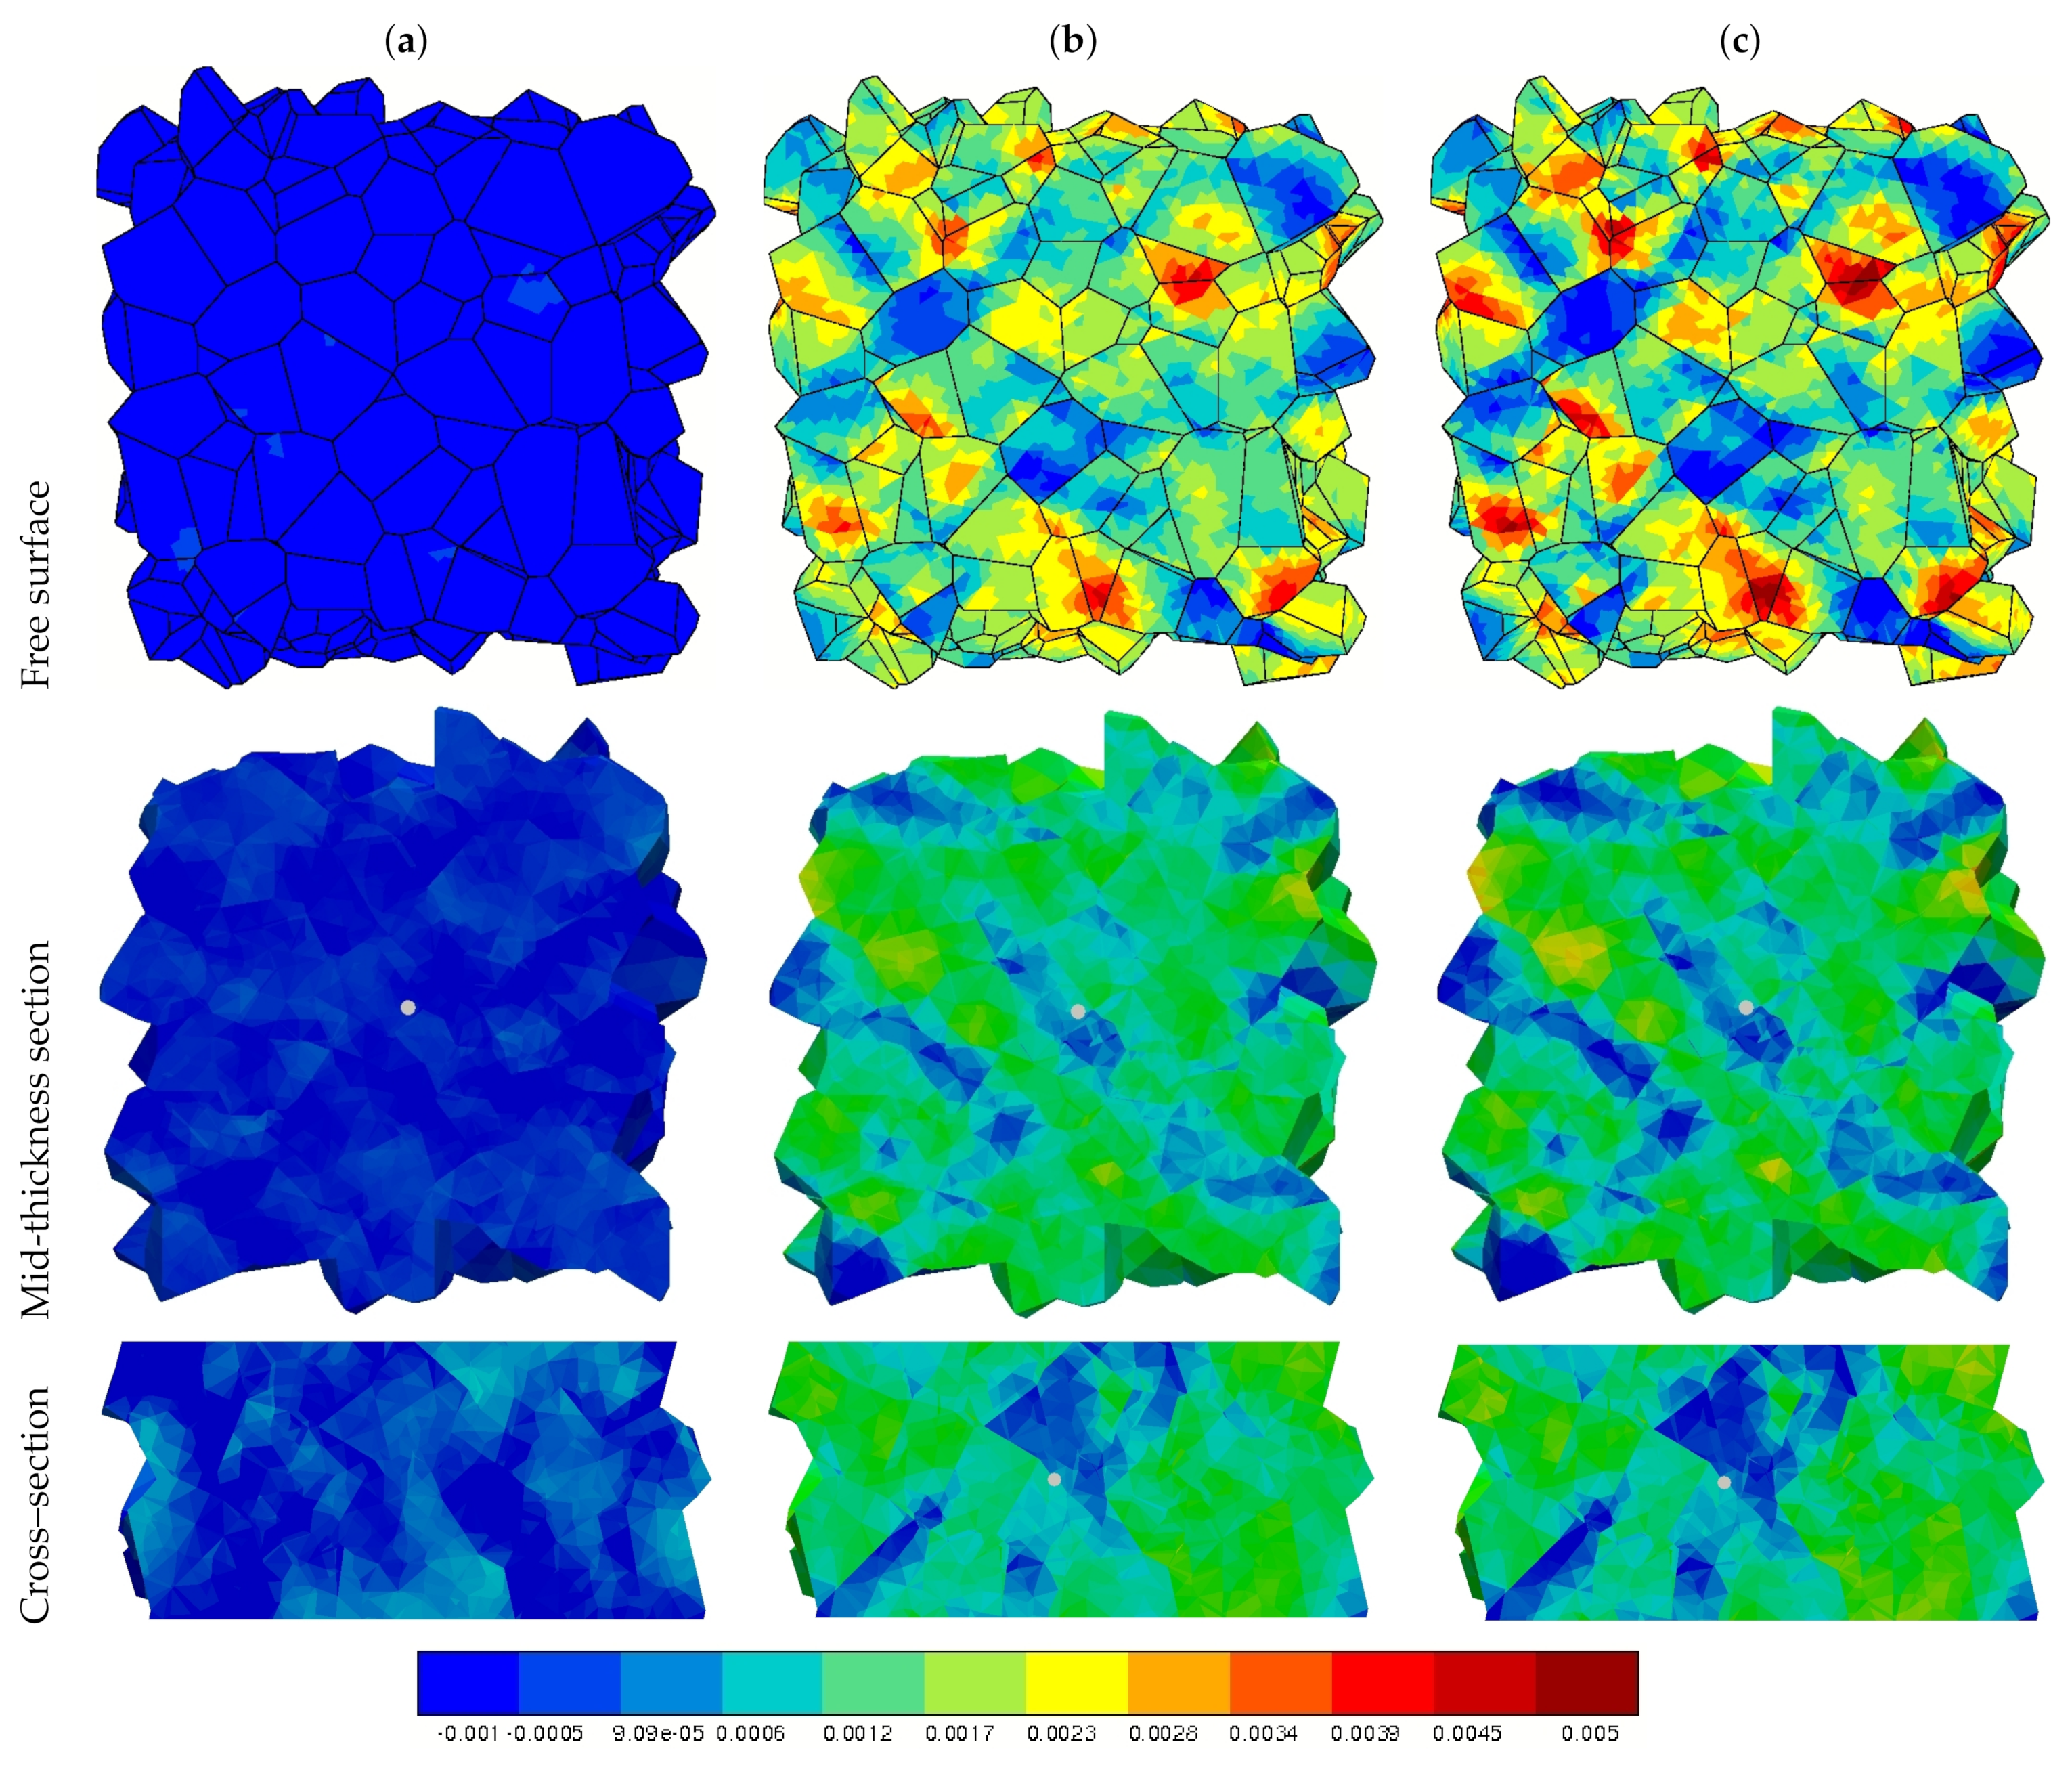
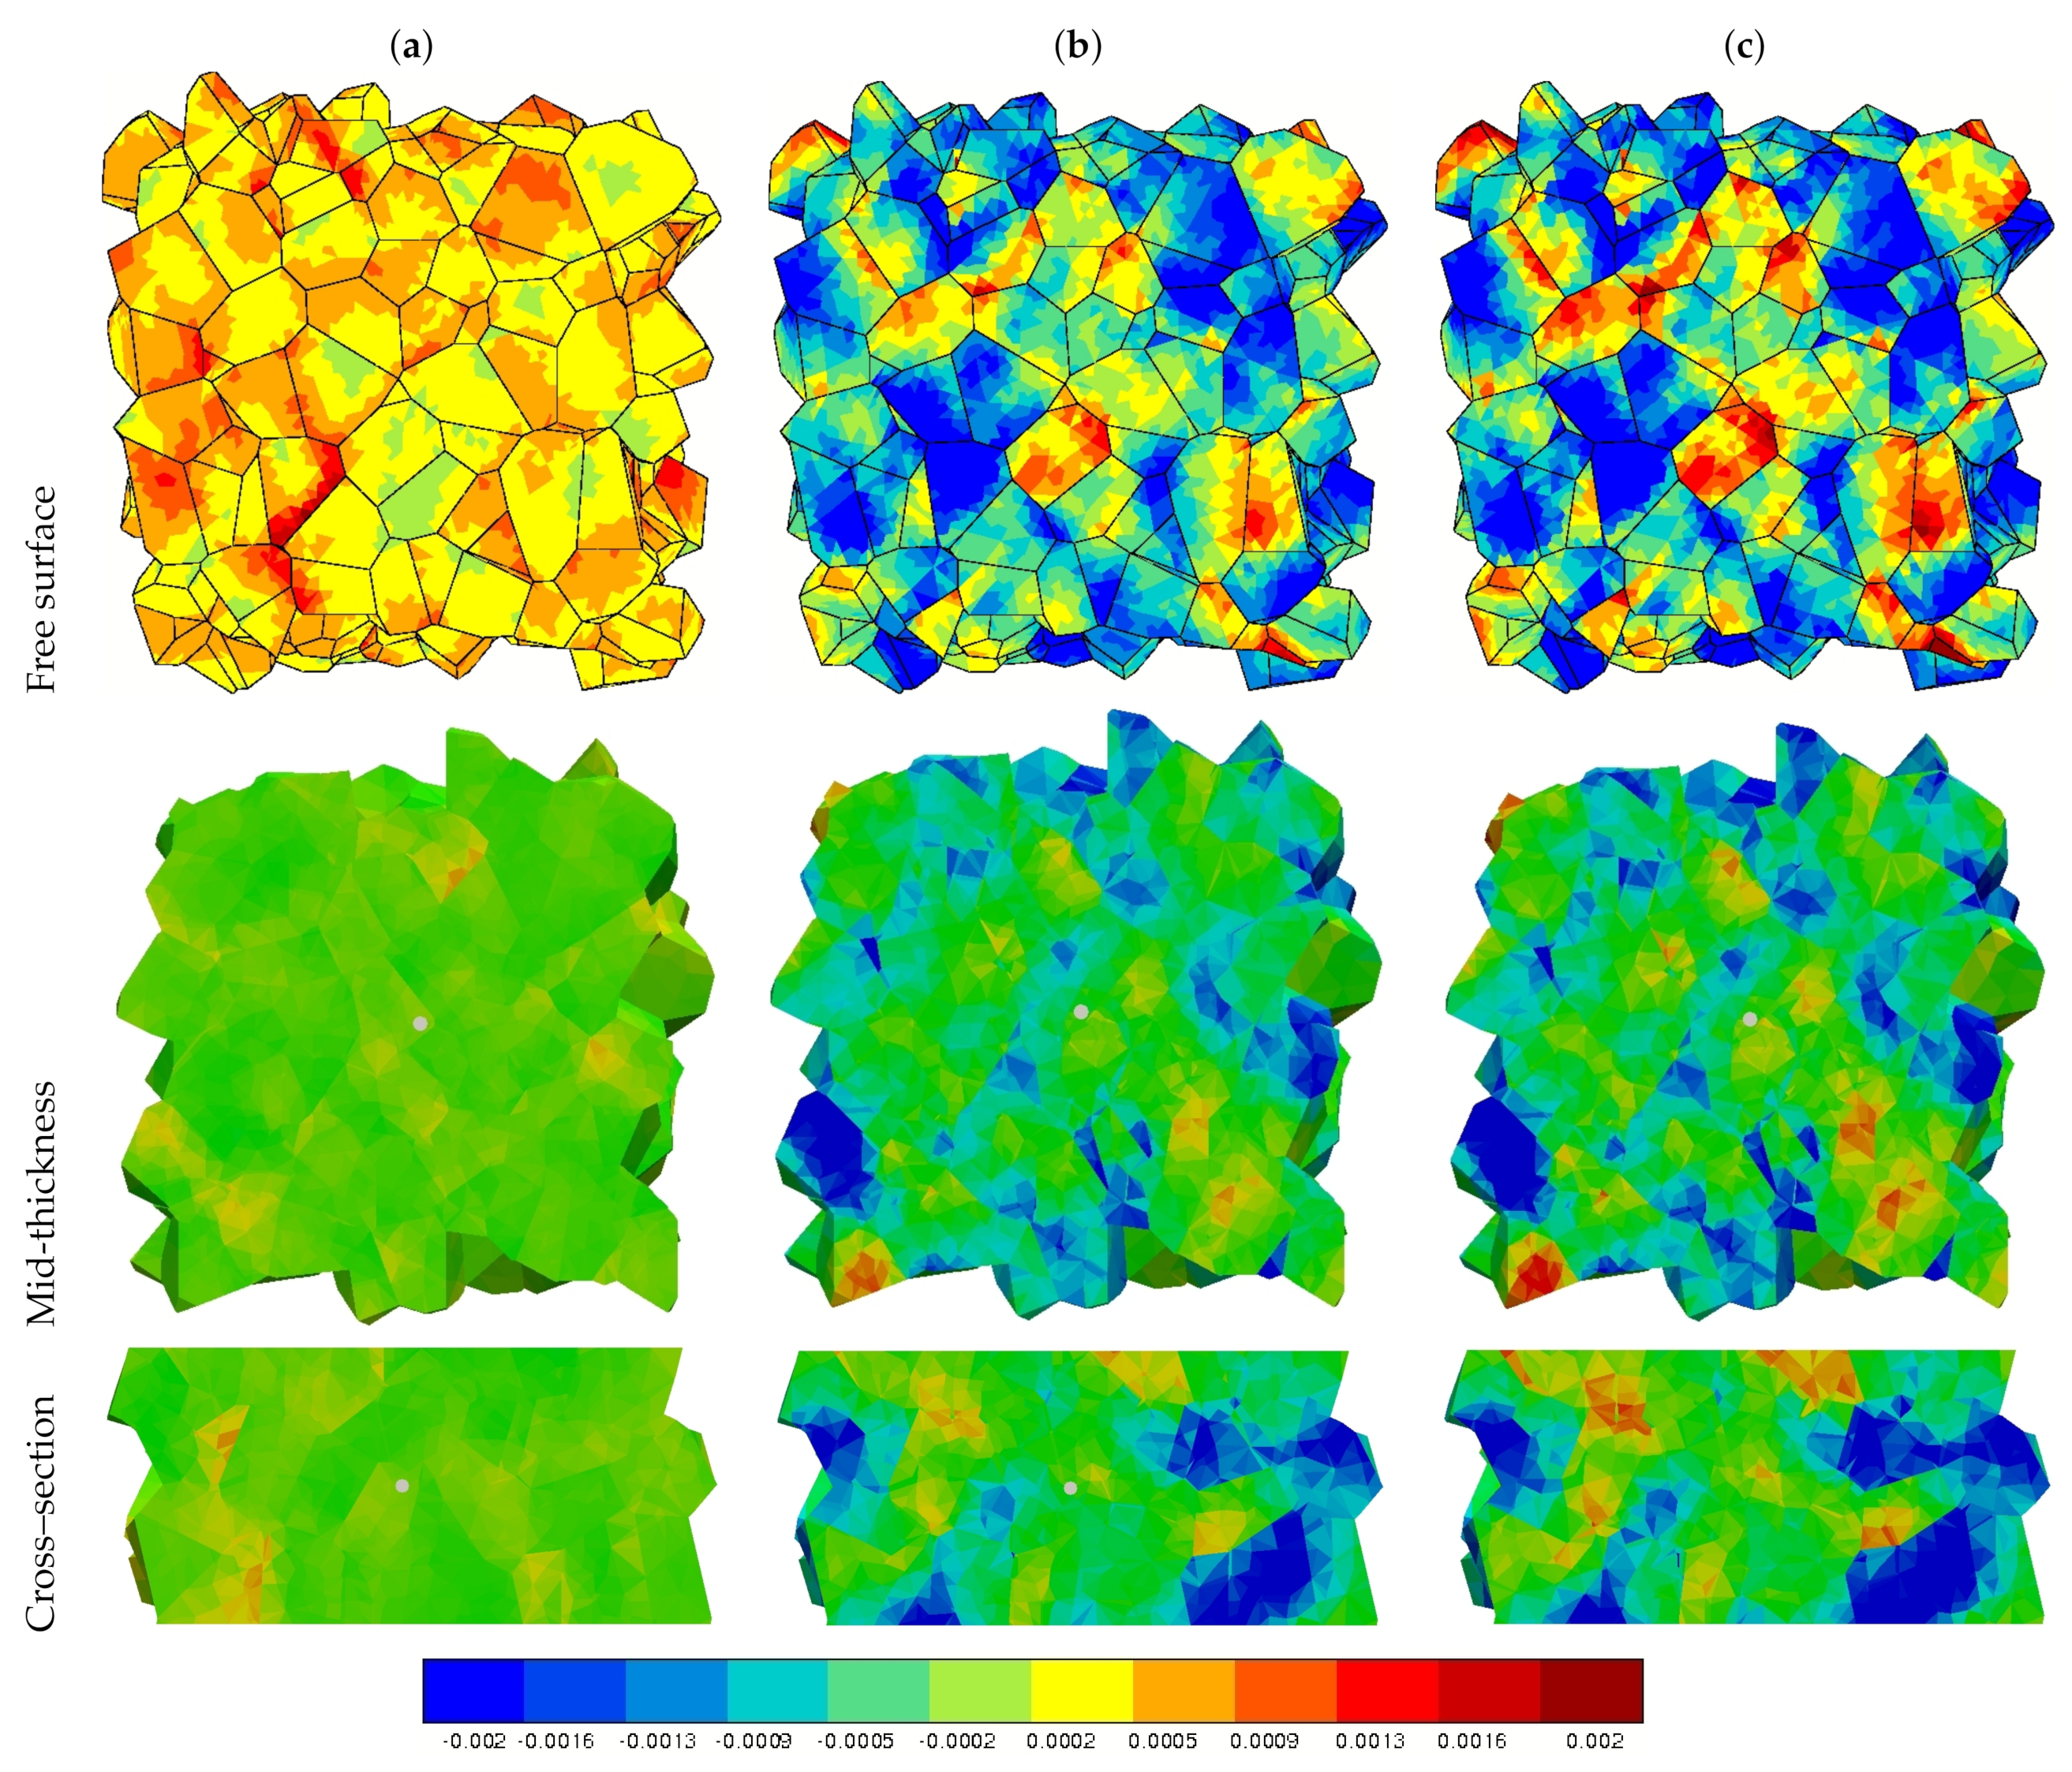
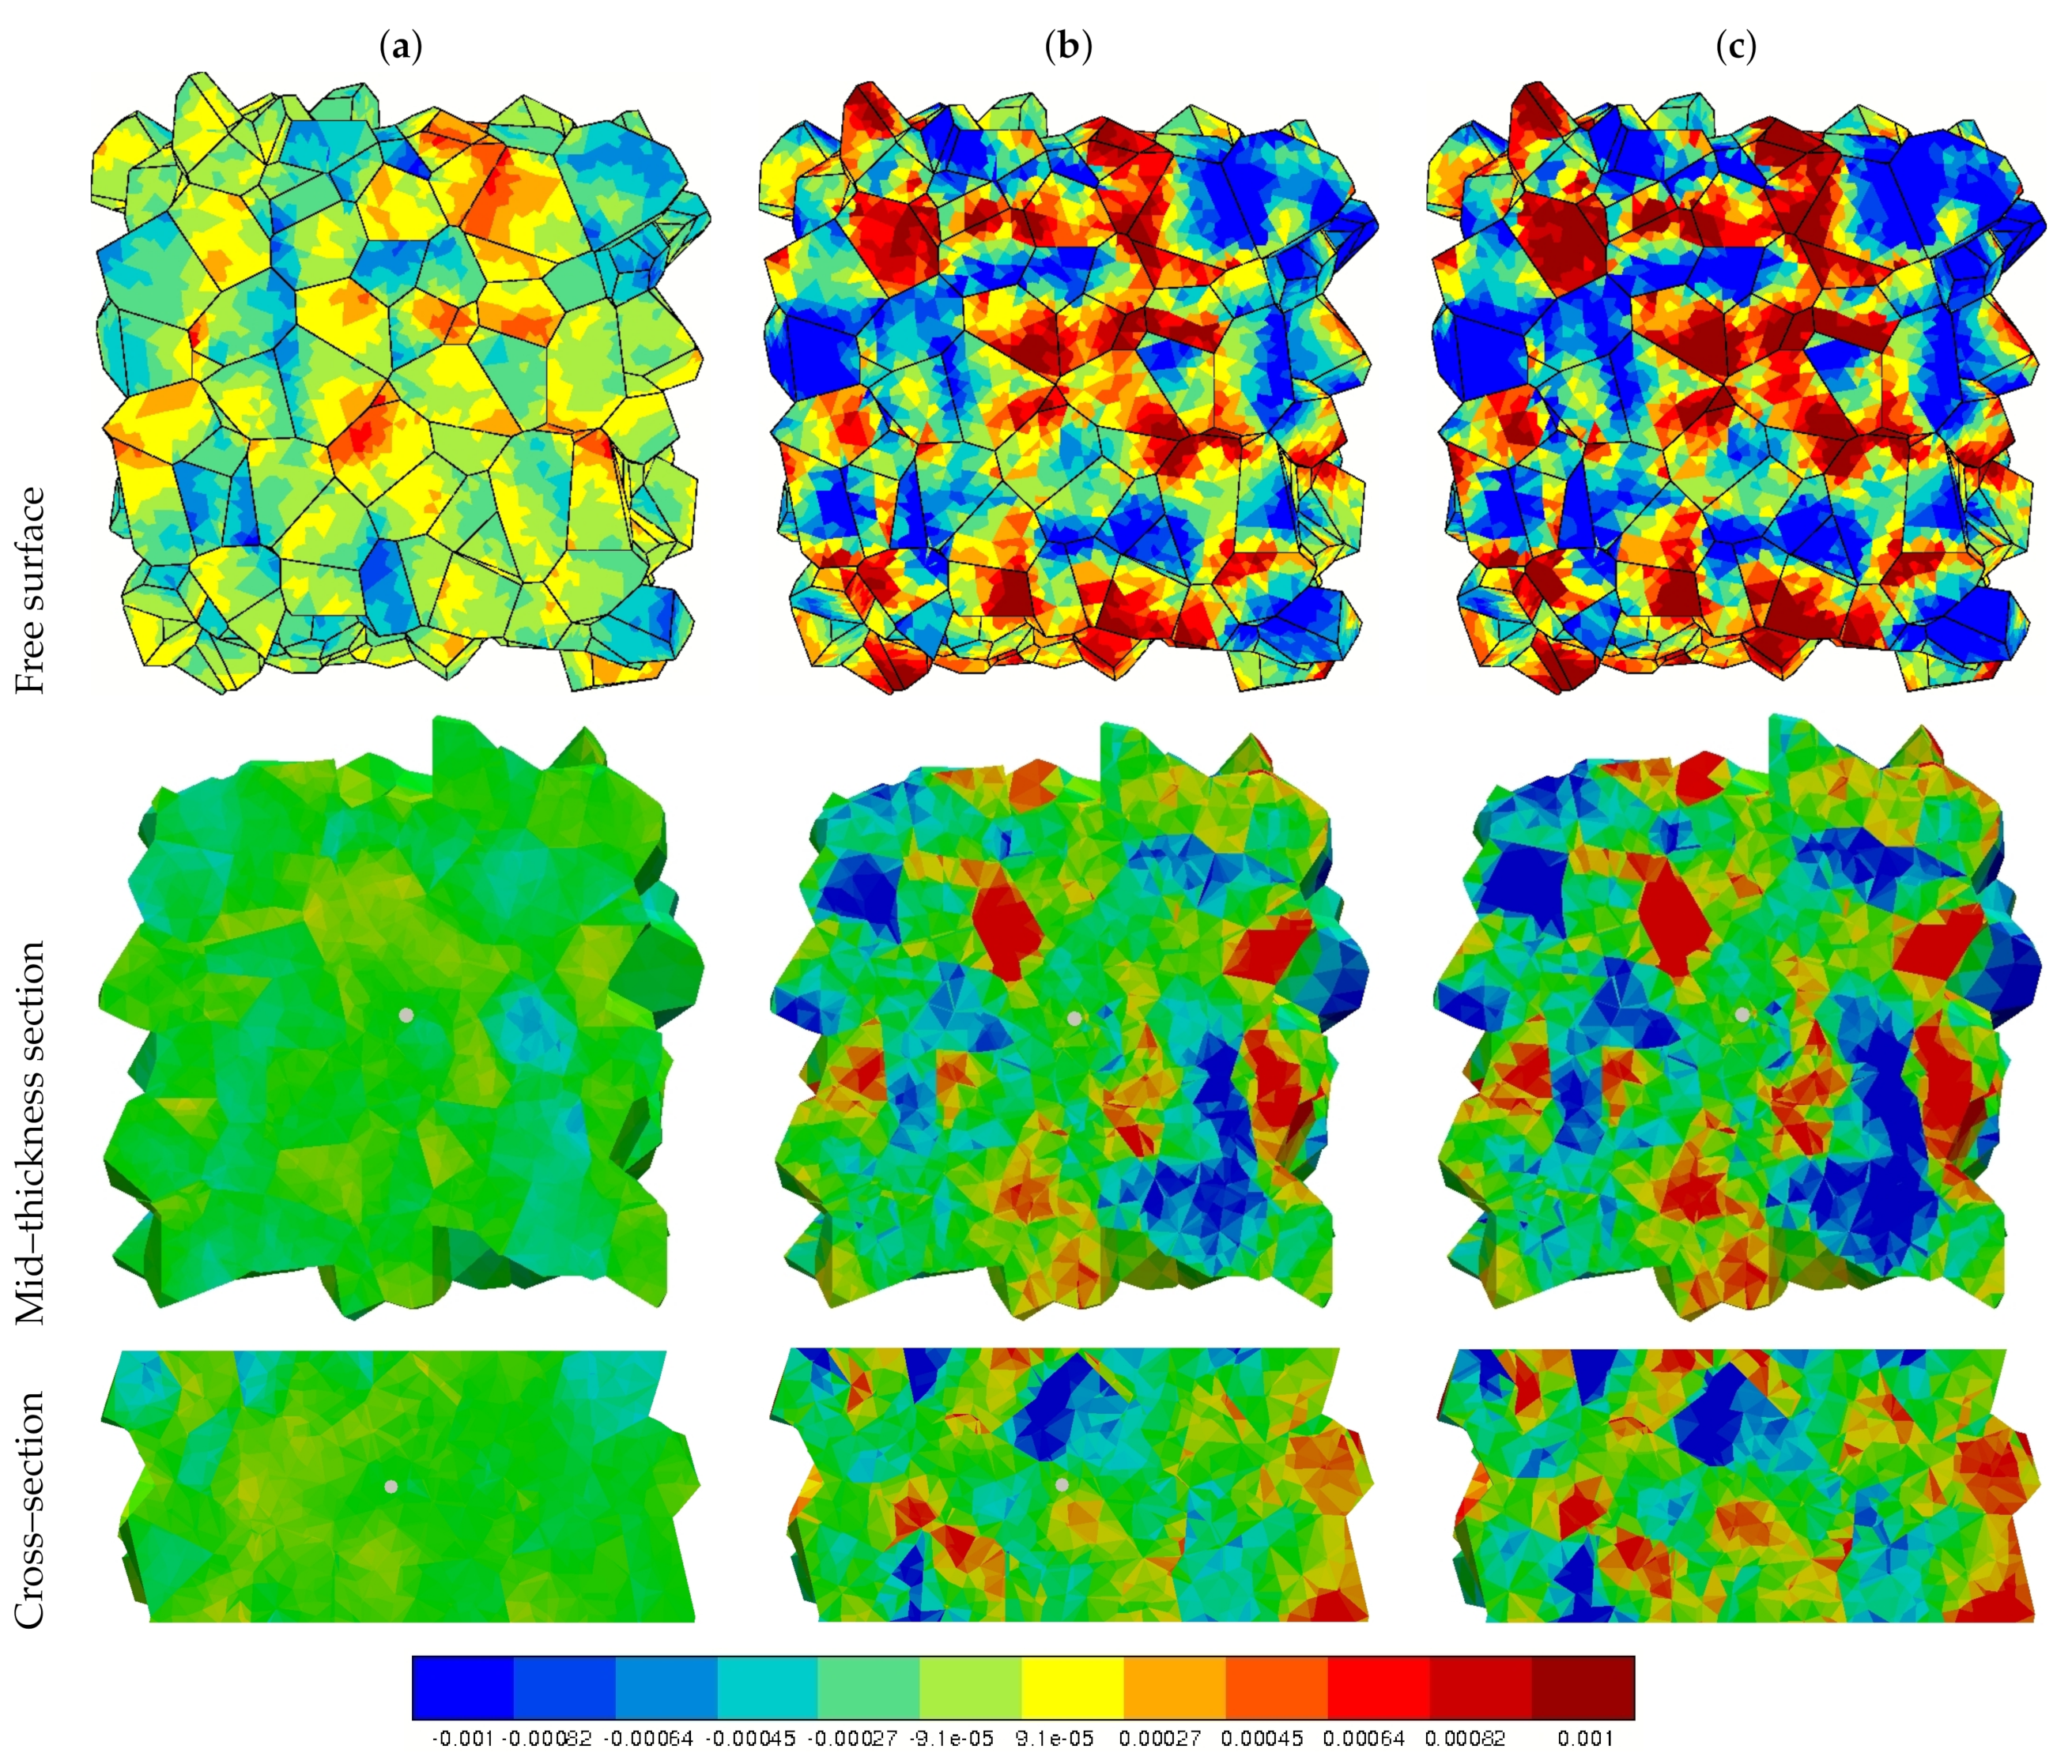
3.3.1. Surface Strain Field

The fields of the strain components ε 11 , ε 22 , and ε 12 at the free surface of the polycrystalline aggregate are shown in Figure 10, Figure 11 and Figure 12, respectively. Three snapshots are presented at the cycle numbers 66, 666, and 1066 for each component. The residual strain field is strongly heterogeneous with values from −0.003 to more than 0.003, to be compared to the loading amplitude ± 0.002 . The deformation structures extend over several grains as observed under monotonic conditions [57,59]. This heterogeneity is found to increase significantly between N c y c l e = 66 and N c y c l e = 666, with certain grains localizing more deformation, especially at some grain boundaries. The localization remains the same after 400 additional cycles but the contrast intensifies between tensile and compressive zones. The heterogeneity culminates for the shear component. Moreover, some areas close to grain boundaries and triple junctions display discontinuous strain values due to change in crystallographic orientation. This strain localization close to grain boundaries is shown to increase with the number of cycles. The dramatic development of strain heterogeneities under cyclic loading is in qualitative agreement with the experimental results. However, the local strain values predicted after 1000 cycles significantly underestimate the corresponding strain field measurements of Figure 4b. There are several reasons to explain such a discrepancy, which will be discussed later in this work.
Figure 10, Figure 11 and Figure 12 show the strain components predicted at the free surface but also at the mid-section parallel to the flat surfaces and also in a cross-section perpendicular to the loading axis. They show a significant free surface effect as strain values are considerably more heterogeneous at the free surface than in the bulk. Note that strain values shown at the free surface correspond to values computed at the integration (Gauss) points close of the surface whereas values at mid-sections are interpolated which may lead to some smoothing effect due to the relatively coarse mesh. This surface effect has dramatic consequences on ratcheting phenomena discussed in [15].
Significant roughening of the surface is predicted in qualitative agreement with the observations of Figure 3, and with previous cyclic behavior simulations of copper in [70]. This is illustrated by Figure 13 showing the out of plane displacement field at the free surface for 6 cycle numbers. After 466 cycles, specific zones of raising or sinking-in material points are observed. Their location, mainly at triple junctions and grain boundaries but also in the interior of some grains, does not change until 1000 cycles. Increasing the cycle numbers leads to further raising or sinking of the material points, as observed experimentally. The existence, general location, characteristic size and wave length roughness development at the free surface are in qualitative agreement with experimental observations of Figure 3. However statistical analysis of the results would require several simulations and experiments, which are not available due to the high cost of both computation and experiment. Compared with the experimental observations, the predicted absolute values of the roughness induced by heterogeneous straining of the free surface are significantly lower. The reasons are the same as for the underestimation of strain values predicted by the FE simulation compared to DIC results. They will be discussed later in this work. The presented experimental and computational results presented in this work are the first of this kind for low cycle fatigue in tantalum. Future work is needed to consolidate them and add measurements like roughness and out of plane displacement.

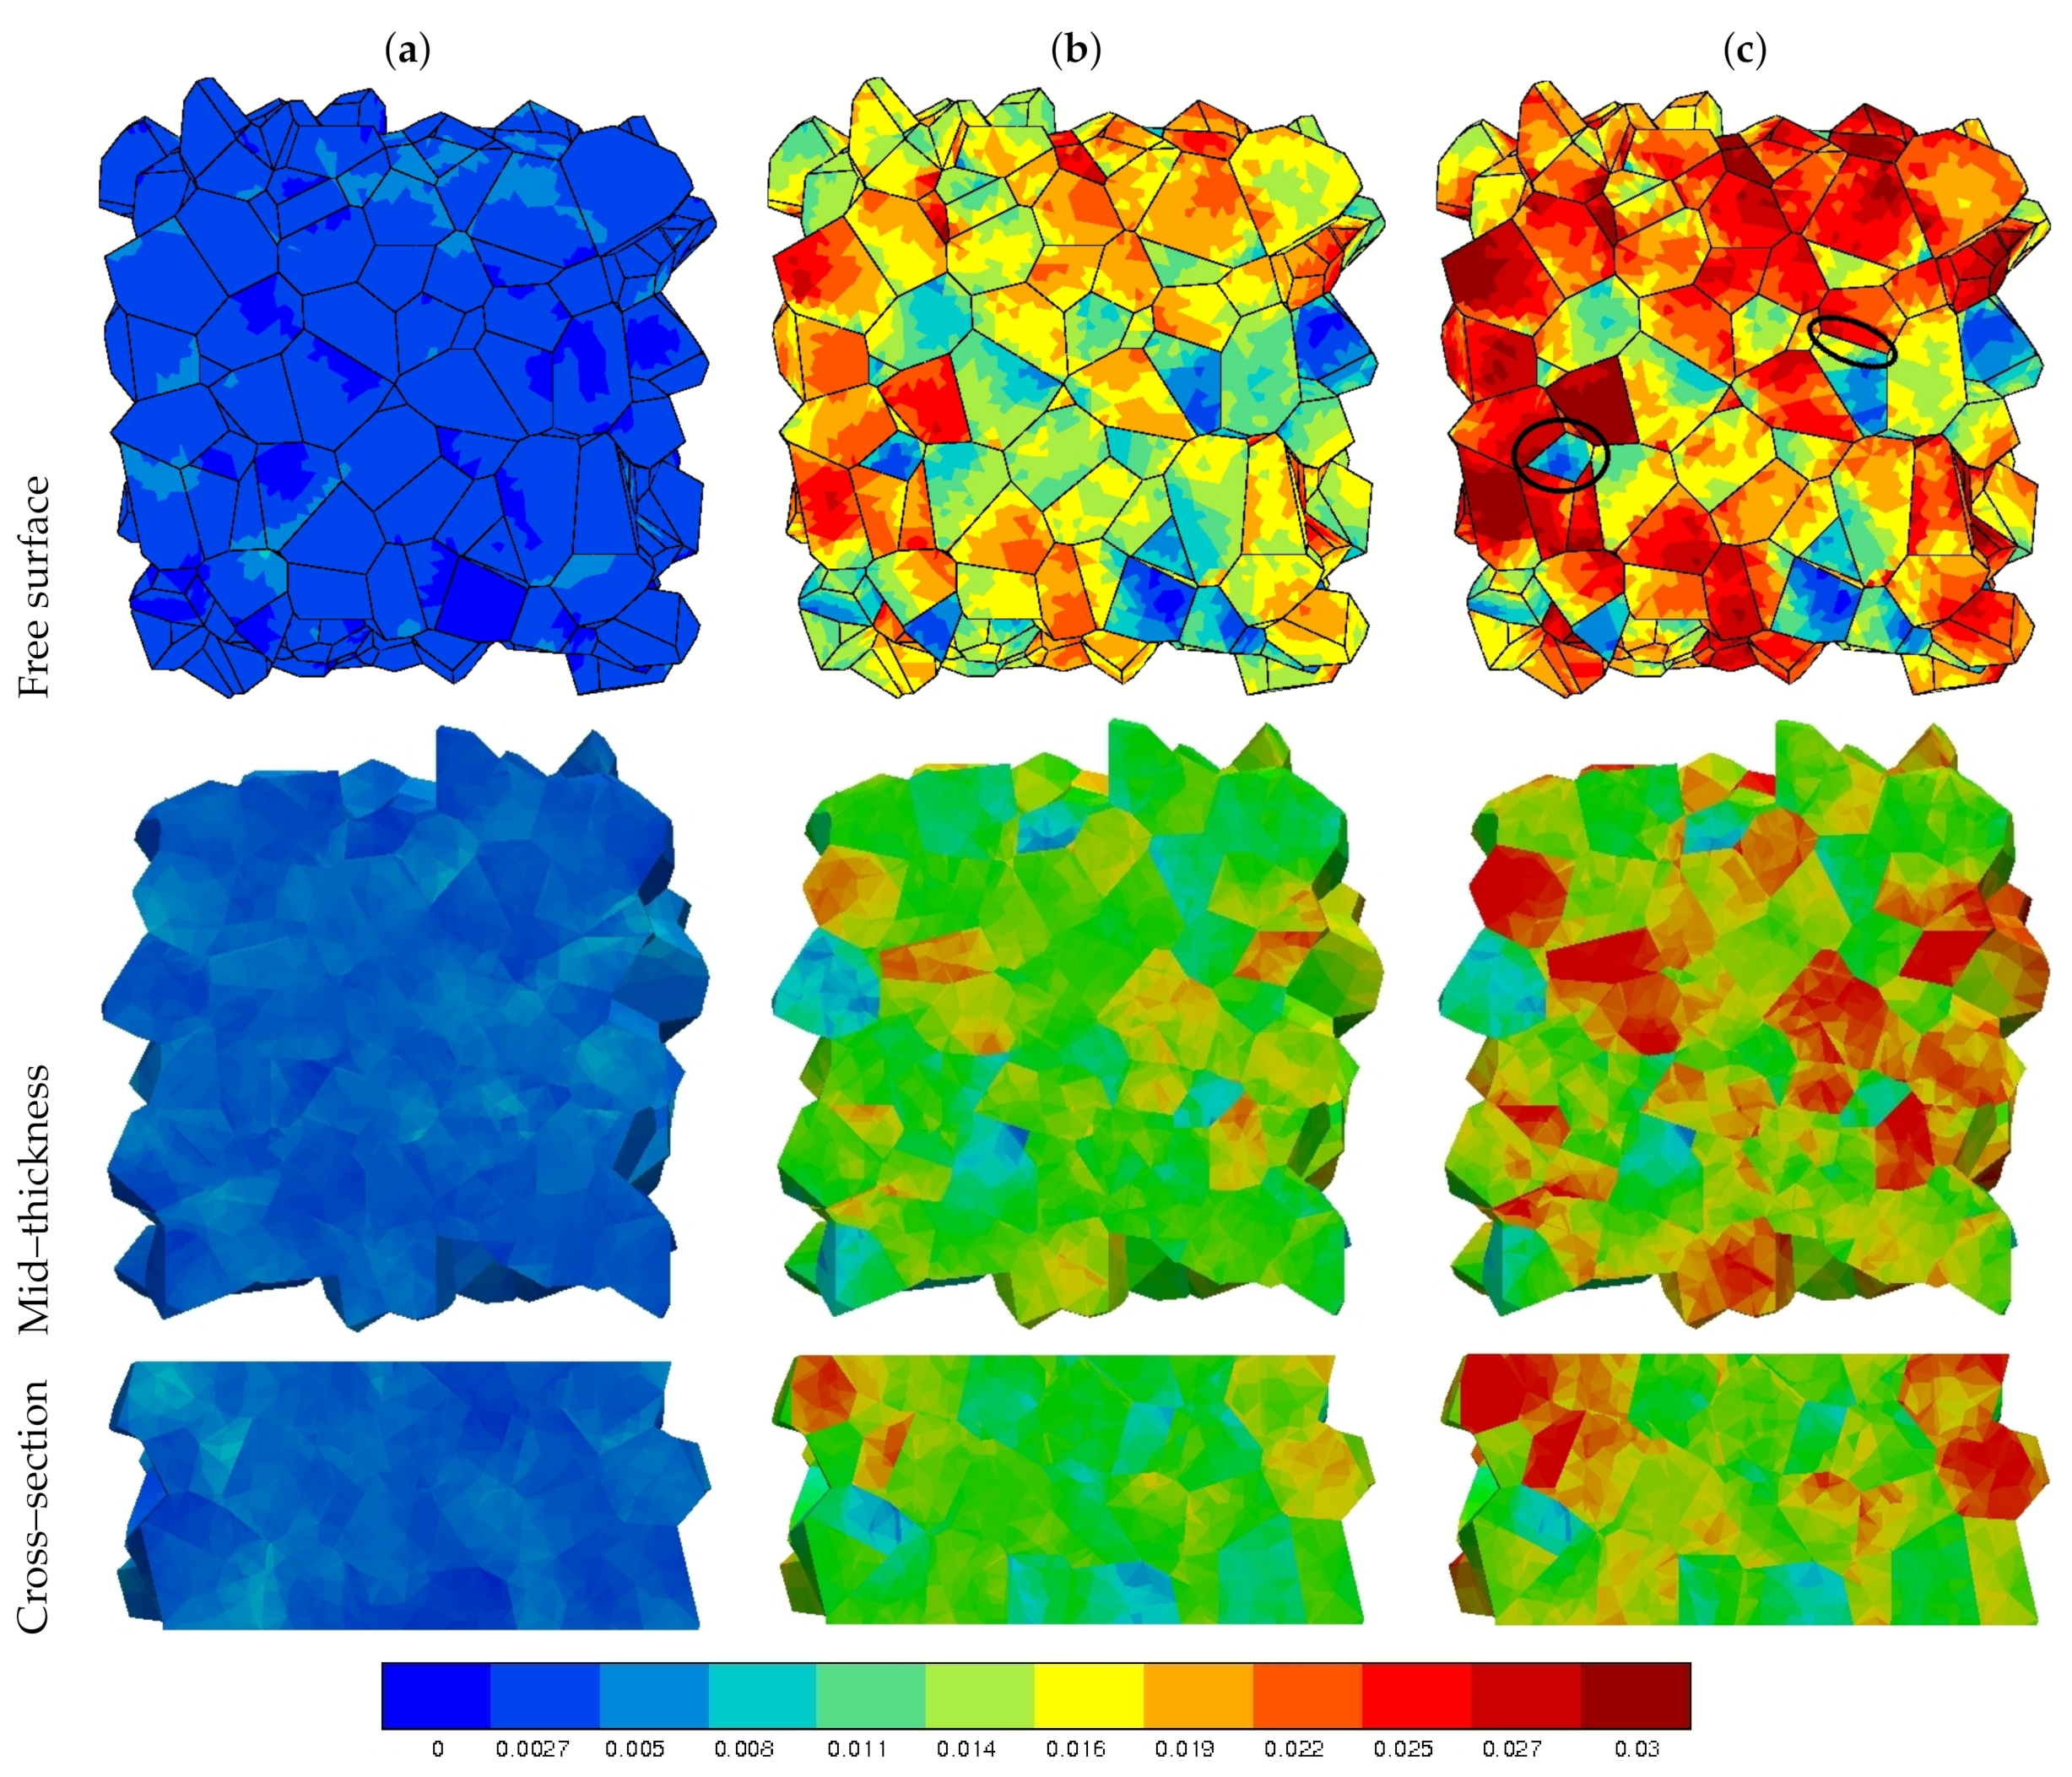
3.3.2. Plastic Slip Evolution

The sum of plastic slip contributions, s | γ s | , is a variable characterizing the intensity of plastic slip activity inside the grains. The corresponding field is shown in Figure 14 at three different cycle numbers. According to the proposed model, the slip variables γ s can take positive or negative values depending on the sign of the effective stress τ s x s . This variable must be distinguished from cumulative slip v s which always increases. Blue zones indicate some unfavorably oriented grains where no (or low) plastic slip activity is observed after 1000 cycles. In contrast, red zones point out regions where plastic slip reaches high values, sometimes more than 0.03. Strong heterogeneities from grain to grain are circled by black lines in the top right of Figure 14. They are in qualitative agreement with the experimentally observed zones of strong plastic slip gradients in Figure 3. The slip activity is found to increase drastically over the more than thousand cycles. Significant evolution in plastic slip activity is observed between the cycles 666 and 1066. This is in qualitative agreement with the experimental observations of Figure 3, for instance between 1000 and 2000 cycles. The effect is stronger than for the strain fields of Figure 11 and Figure 12. When the number of cycles increases, the slip increments decrease but remain positive and strongly heterogeneous. These features of plastic slip accumulation are discussed in the next section.

4. Discussion

The salient features of the computational results are now discussed, namely, comparison between experimental and simulation results, local ratcheting phenomena at the free surface, and the development of a fatigue crack initiation criterion.

4.1. The FE Model Underestimates Strain Heterogeneities and Roughness in Fatigue

Experiment and simulation agree in showing strong strain heterogeneities developing at the free surface of a tantalum polycrystaline aggregate after a few thousands of cycles, even for a moderate cyclic total strain amplitude of 0.2%. Strain localization and roughness evolution are observed at grain boundaries, triple junctions but can also cross several grains. In particular the FE model predicts highly contrasted fields of plastic activity in some grains where high values of plastic slip are found, more than ten times the prescribed strain. However, FE simulations quantitatively underpredicts the strain levels at the free surface. Several reasons can be put forward. First, the proposed model assumes continuity of the displacement components at grain boundaries where strain and roughness effects tend to localize as shown in the experiment and simulations. The experiment shows that significant grain boundary sliding (GBS) takes place in some grains as noticed in several observations of polycrystalline plasticity [71]. GBS is an important deformation and damage mechanism which has been observed in the present work but not sufficiently documented. Instead, we provide more evidence of grain boundary cracking after 5000 cycles, see Figure 7. Second, sharp slip lines and intense intrusion and extrusion bands are observed in the experiments that cannot be accounted for by the proposed continuum mechanics approach. These discontinuities are characteristic of crystal plasticity physical mechanisms and can lead to strong local strain levels. Alternative modeling approaches are needed to capture these mechanisms like discrete dislocation dynamics simulations [72]. Third, the local strain levels also depend on the mesh resolution, which is definitely too coarse in the presented simulations in order to spare computational time and make the simulation possible over a large number of cycles. Finally, the experiment reveals that some cluster of 50 to 100 grains can undergo average strain levels that significantly exceed the prescribed overall strain level. In contrast, the overall mean strain is prescribed to the simulated volume of 250 grains, which strongly limits the development of strain heterogeneities from grain to grain. This pleads for the consideration of larger Volume Element sizes than the one considered in this work, which represents a challenging task for fatigue simulations. Strain heterogeneities and roughness development are closely related to ratcheting phenomena occurring close to and at the free surfaces, as evidenced and discussed in [17]. Only 1000 cycles were simulated here but extrapolations are possible to 3000 cycles based on local established ratcheting rates.

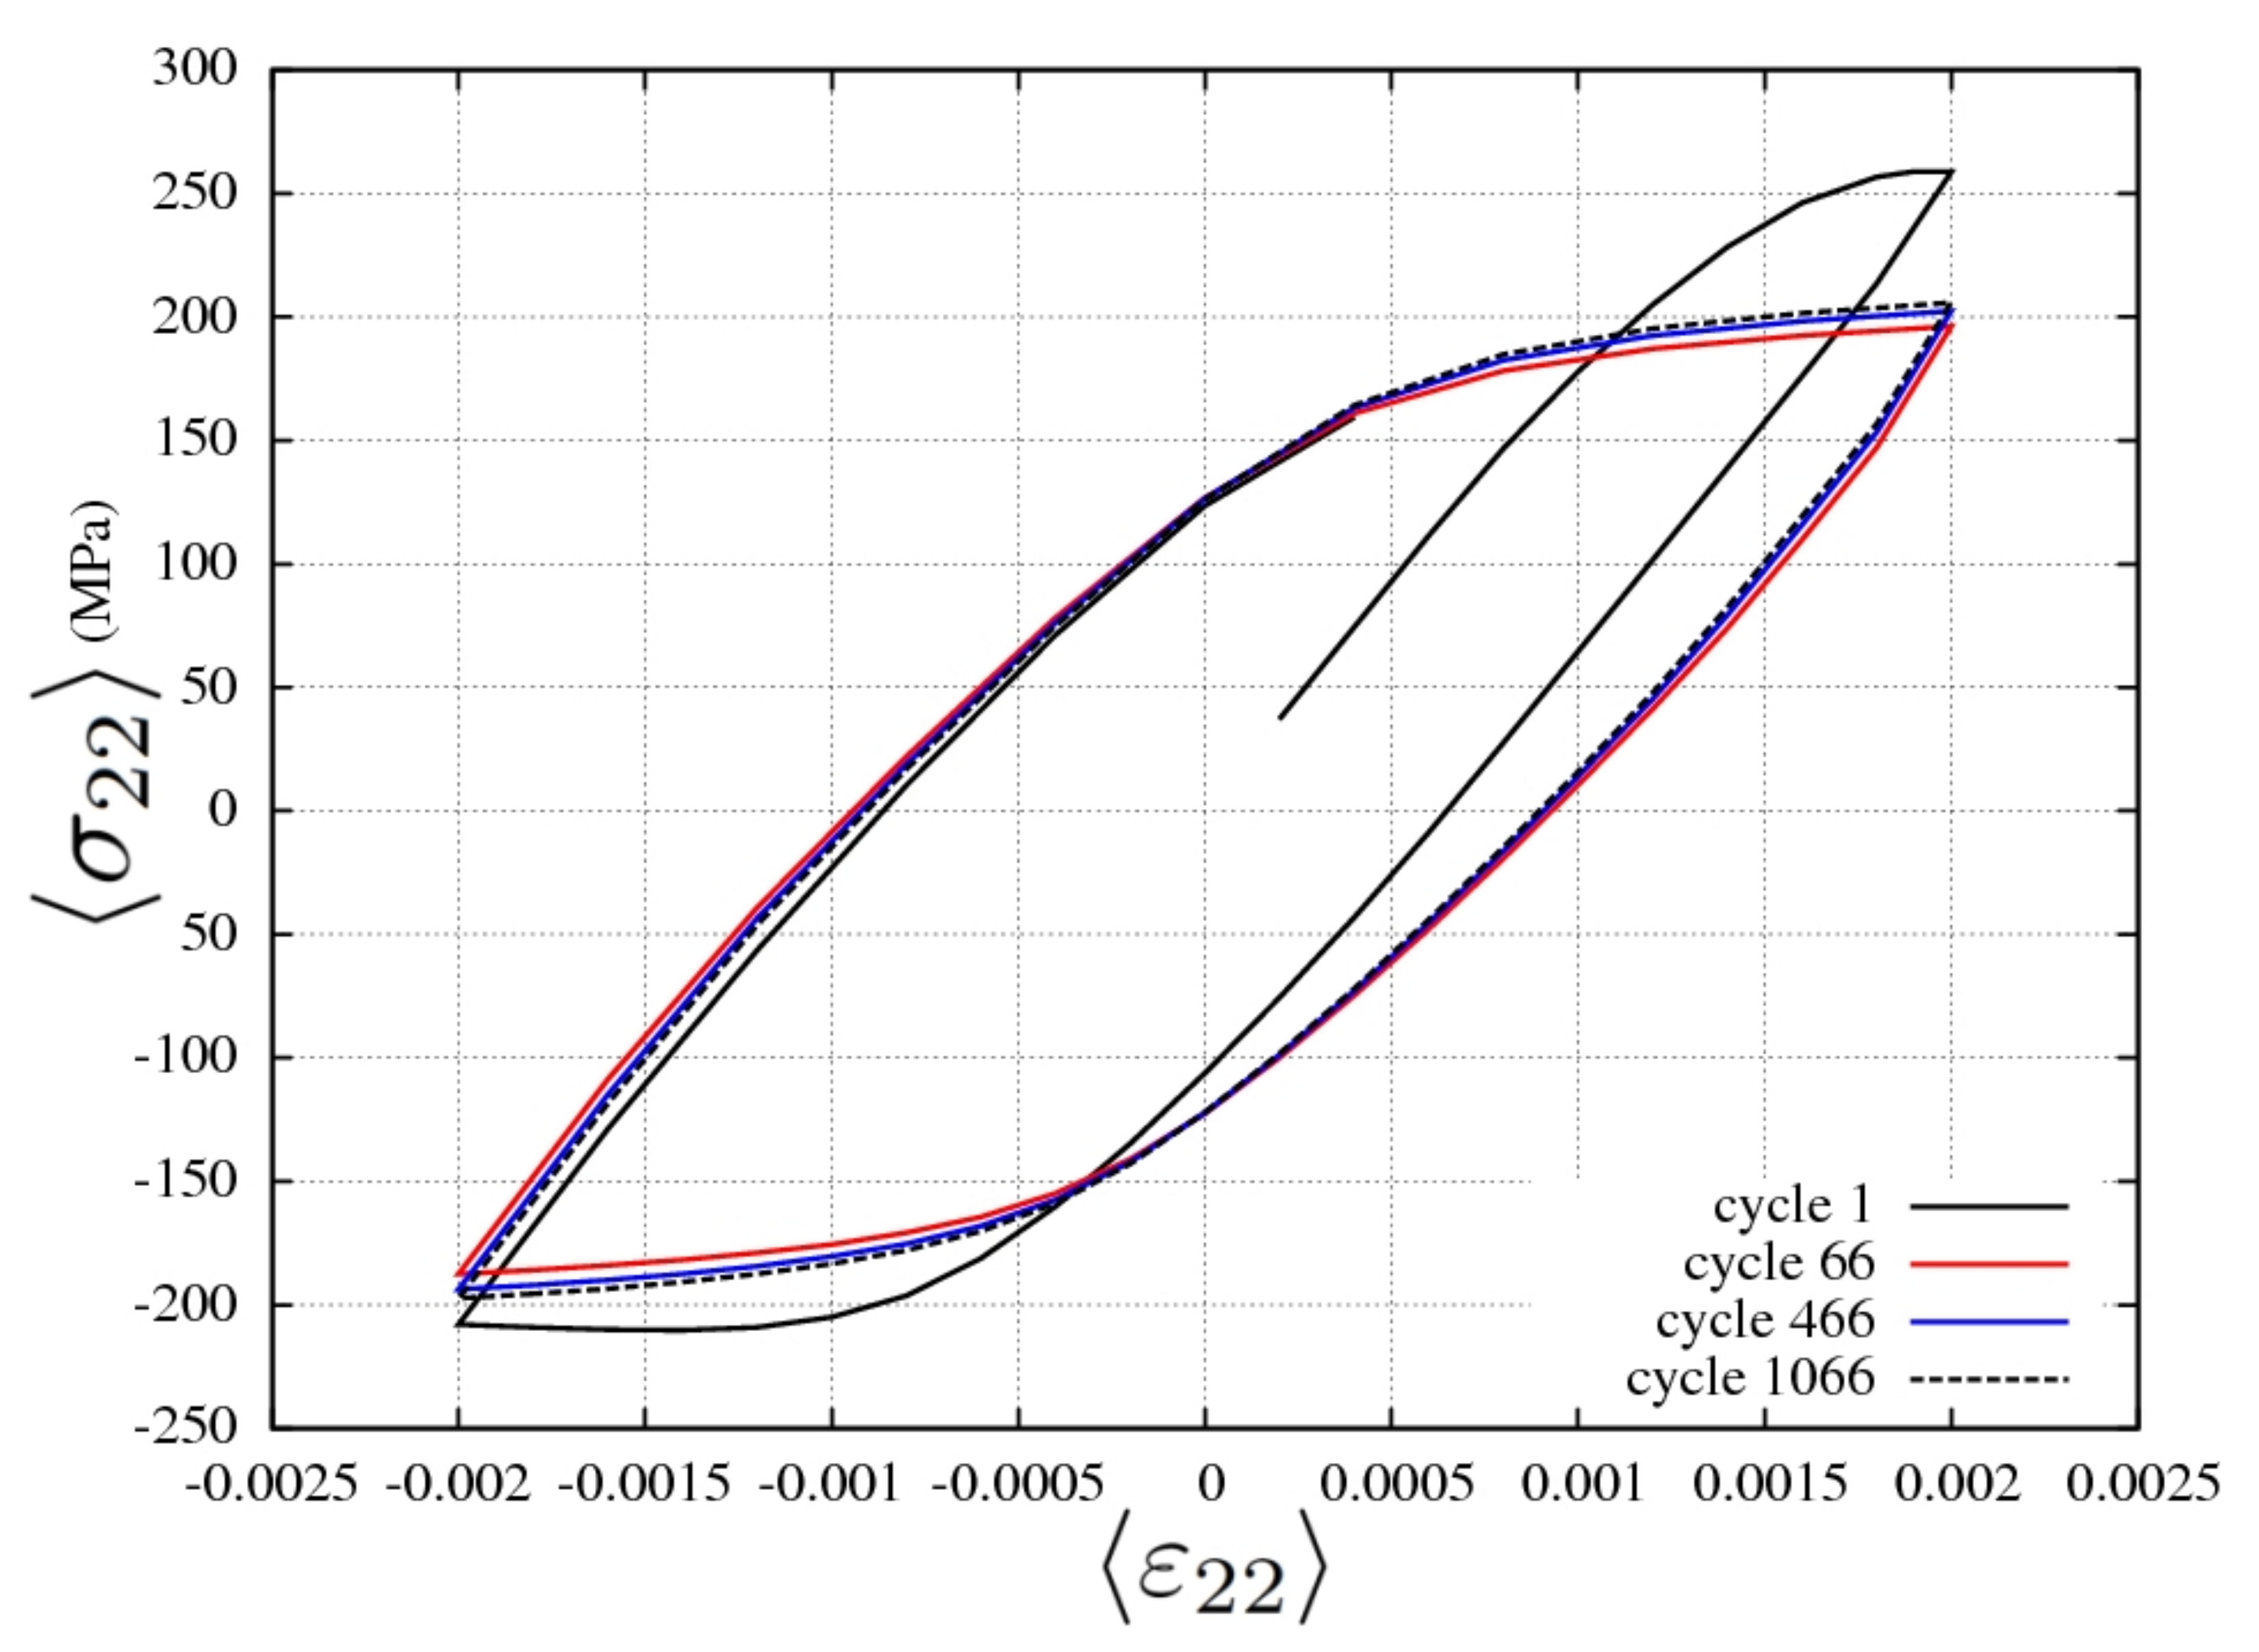
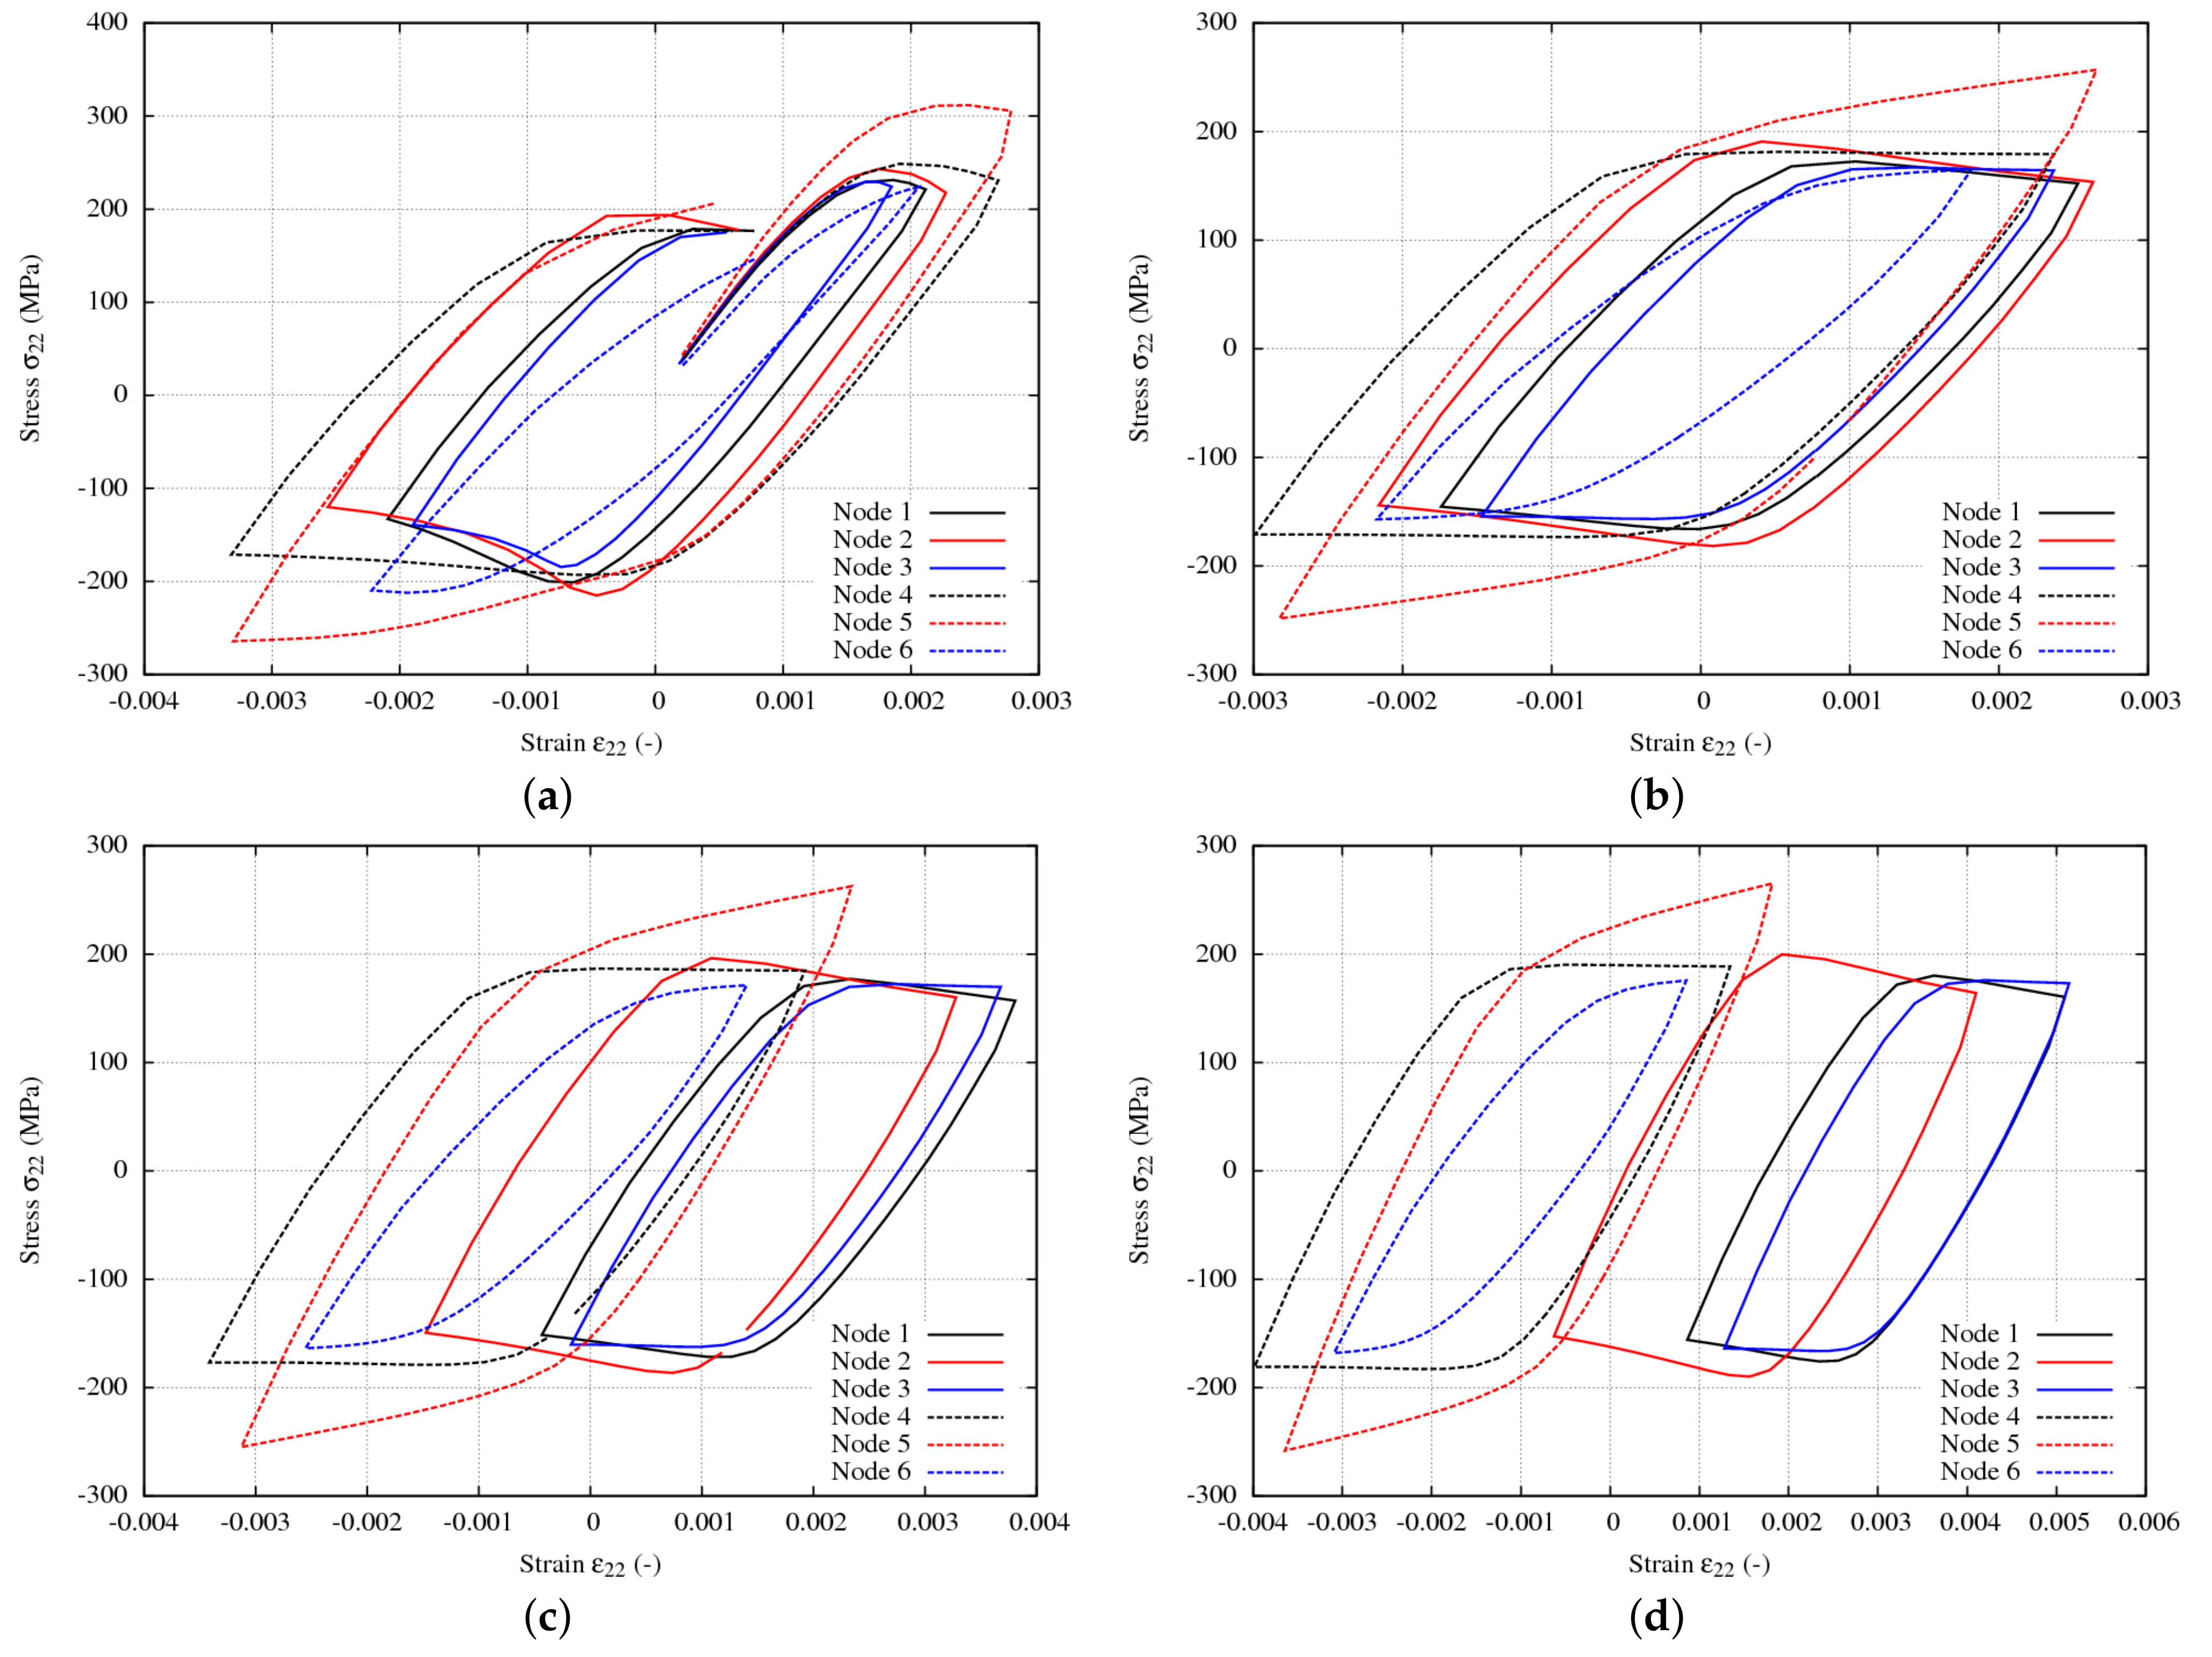
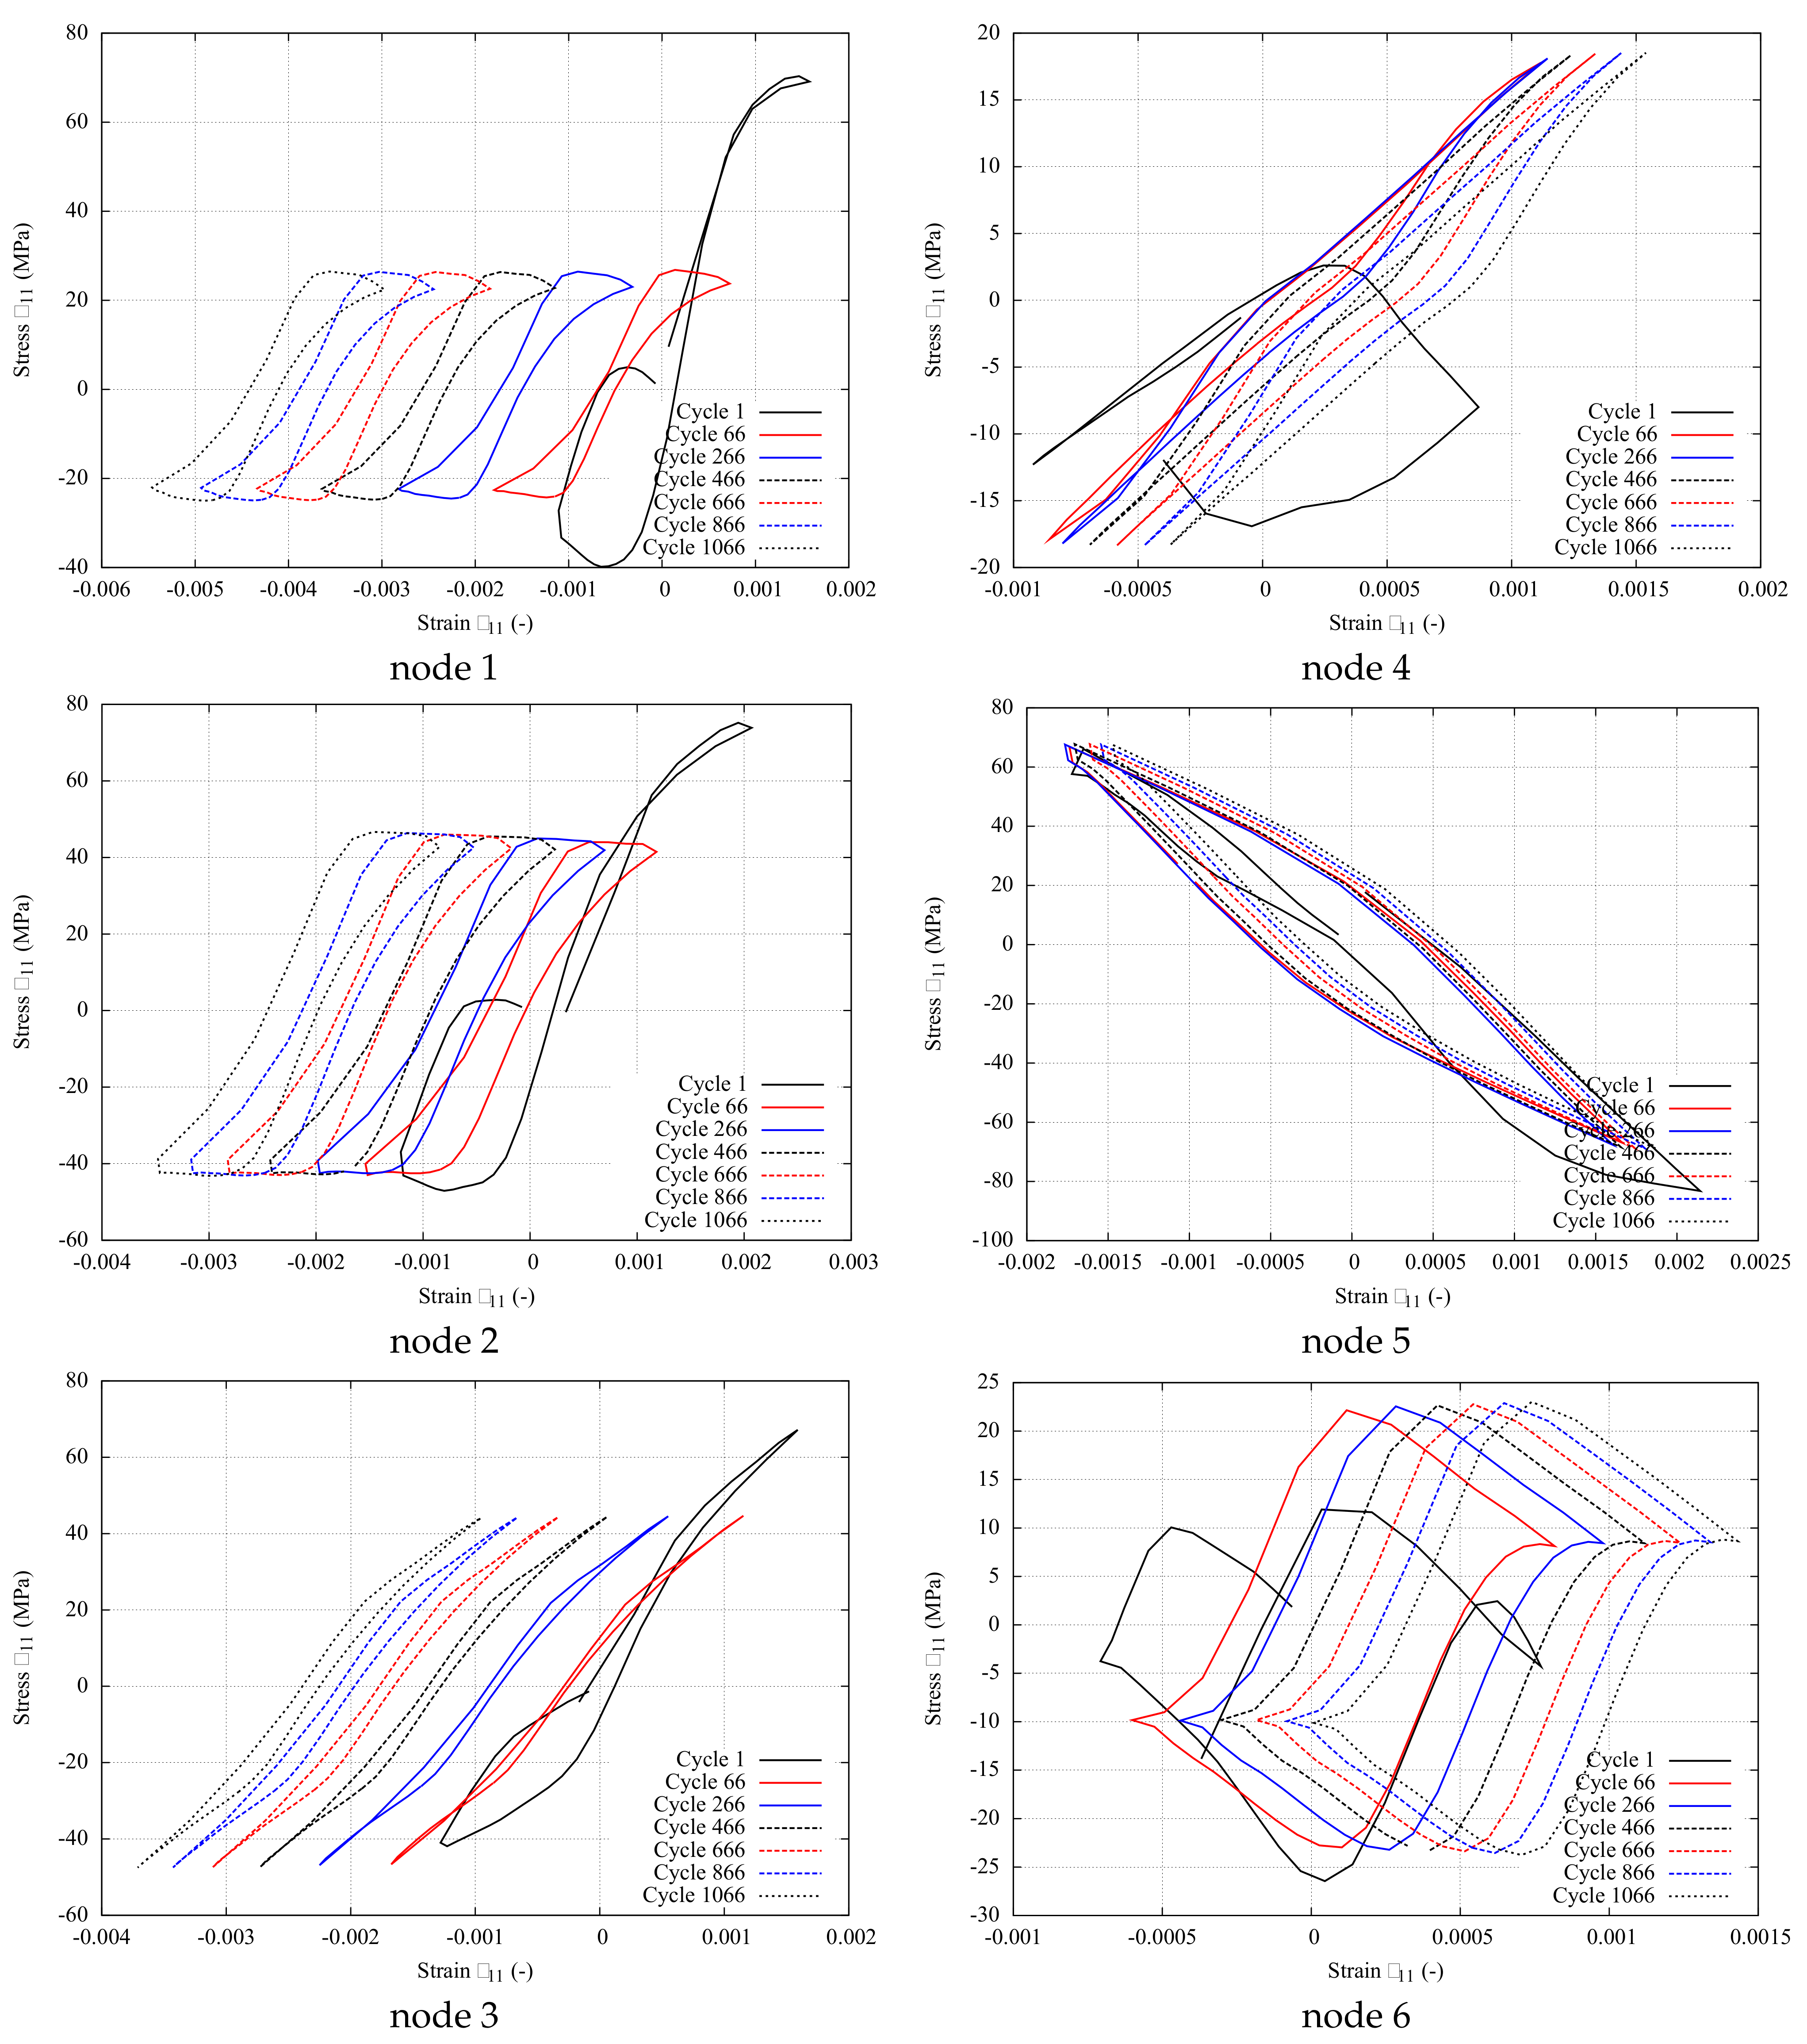
4.2. Local Ratcheting Behavior

The accumulation of plastic slip at some specific locations of the aggregate plays a major role in crack initiation. This accumulation is enhanced by local ratcheting phenomena, i.e., the existence of a strain component increment of given sign and magnitude after each cycle [73]. The evidence of such ratcheting effects has been demonstrated using the present simulation results in [17]. A major result of this analysis was that ratcheting values are significantly higher at the free surface than in the bulk, which is an essential feature of fatigue crack initiation correctly reproduced by the analysis. Some further results are presented here that serve for the definition of a fatigue criterion in the next subsection.
From the previous observation of the free surface, 6 nodes have been selected in order to document the local cyclic response of material points, see Figure 15. Among the 6 nodes, 3 are located in plastically active zones (nodes 1–3), whereas the three others are situated in less active areas (nodes 4–6). This can be inferred from the cyclic stress–strain σ 22 ε 22 loops of Figure 16. All nodes display largely open cyclic loops revealing significant plastic deformation. The first loop is characterized in each case by the peak stress associated with static strain aging typical of this material [15]. Then, the loops become symmetric with respect to the stress, due to relaxation of the mean stress. In contrast, the minimal and maximal strain levels are not symmetric. The loops are not saturated after 1000 cycles and strain accumulates either in tension or compression, which corresponds to local ratcheting phenomena. Significant tensile ratcheting is found for the nodes 1–3, meaning that the mean strain is positive and increases monotonically, whereas more limited compressive ratcheting is observed for the nodes 4–6. The local stress–strain loops strongly differ from the macroscopic loop of Figure 9 which is fully symmetric. Local stress levels σ 22 depend on the crystallographic orientation of each grain and of its neighbors. They are generally lower than the macroscopic stress (150 vs. 200 MPa), except for node 5 (300 MPa).
The ratcheting phenomenon (also called cyclic creep) occurs when the plastic strain increment is not fully reversed for a cyclic loading [74]. One-dimensional ratcheting occurs for instance for non-vanishing mean stress loadings: a positive (resp. negative) ratcheting occurs for a positive (resp. negative) mean stress [75,76,77]. However, the mean stress is found here to relax to zero in all the plotted loops after less than 100 cycles. The origin of the continuing ratcheting is the multiaxial loading experienced by the material points. The σ 11 ε 11 loops in Figure 17 show that the transverse stress component is significant for the six selected nodes. Transverse strain ratcheting is observed for nodes 1–3. Similar observation was made for the shear component so that it can be concluded that the material points experience multiaxial ratcheting, responsible for plastic strain accumulation and ultimately crack initiation. The multiaxial stress–strain state is induced by the complex plastic strain incompatibilities from grain to grain.
The previous results are used to define a

Ratcheting Indicator

The progressive accumulation of plastic strain at the surface during strain-controlled cycling is regarded in this work as the relevant physical mechanism for fatigue crack initiation in the grains of a polycrystal. It has been reported that it can lead to crack nucleation and finally to the global failure of a structure (see the works in [35,73,74,77]), and is in accordance with the experimental observations of the present work. A measure of local ratcheting has been proposed in the reference [77] for the analysis of plasticity induced by fretting contact. For that purpose, the local plastic strain increment ( Δ ε i j p ) r a t c h is defined at each material point for each component of the plastic strain tensor as
( Δ ε i j p ) r a t c h = ε i j p | e n d o f t h e c y c l e ε i j p | s t a r t o f t h e c y c l e
The effective plastic strain increment is then computed as
Δ ε r a t c h , e f f p = 2 3 ( Δ ε i j p ) r a t c h ( Δ ε i j p ) r a t c h
where repeated indices are summed up. It is computed for each individual cycle at each material point. It is regarded as an indicator of local ratcheting as departure of Δ ε r a t c h , e f f p from zero is a signature of accumulation of plastic staining. Fields of this variable were provided at various cycle numbers in [15] to demonstrate the significance of ratcheting at the free surface of the polycrystal. The highest ratcheting values are reached mainly close to grain boundaries and at triple junctions.

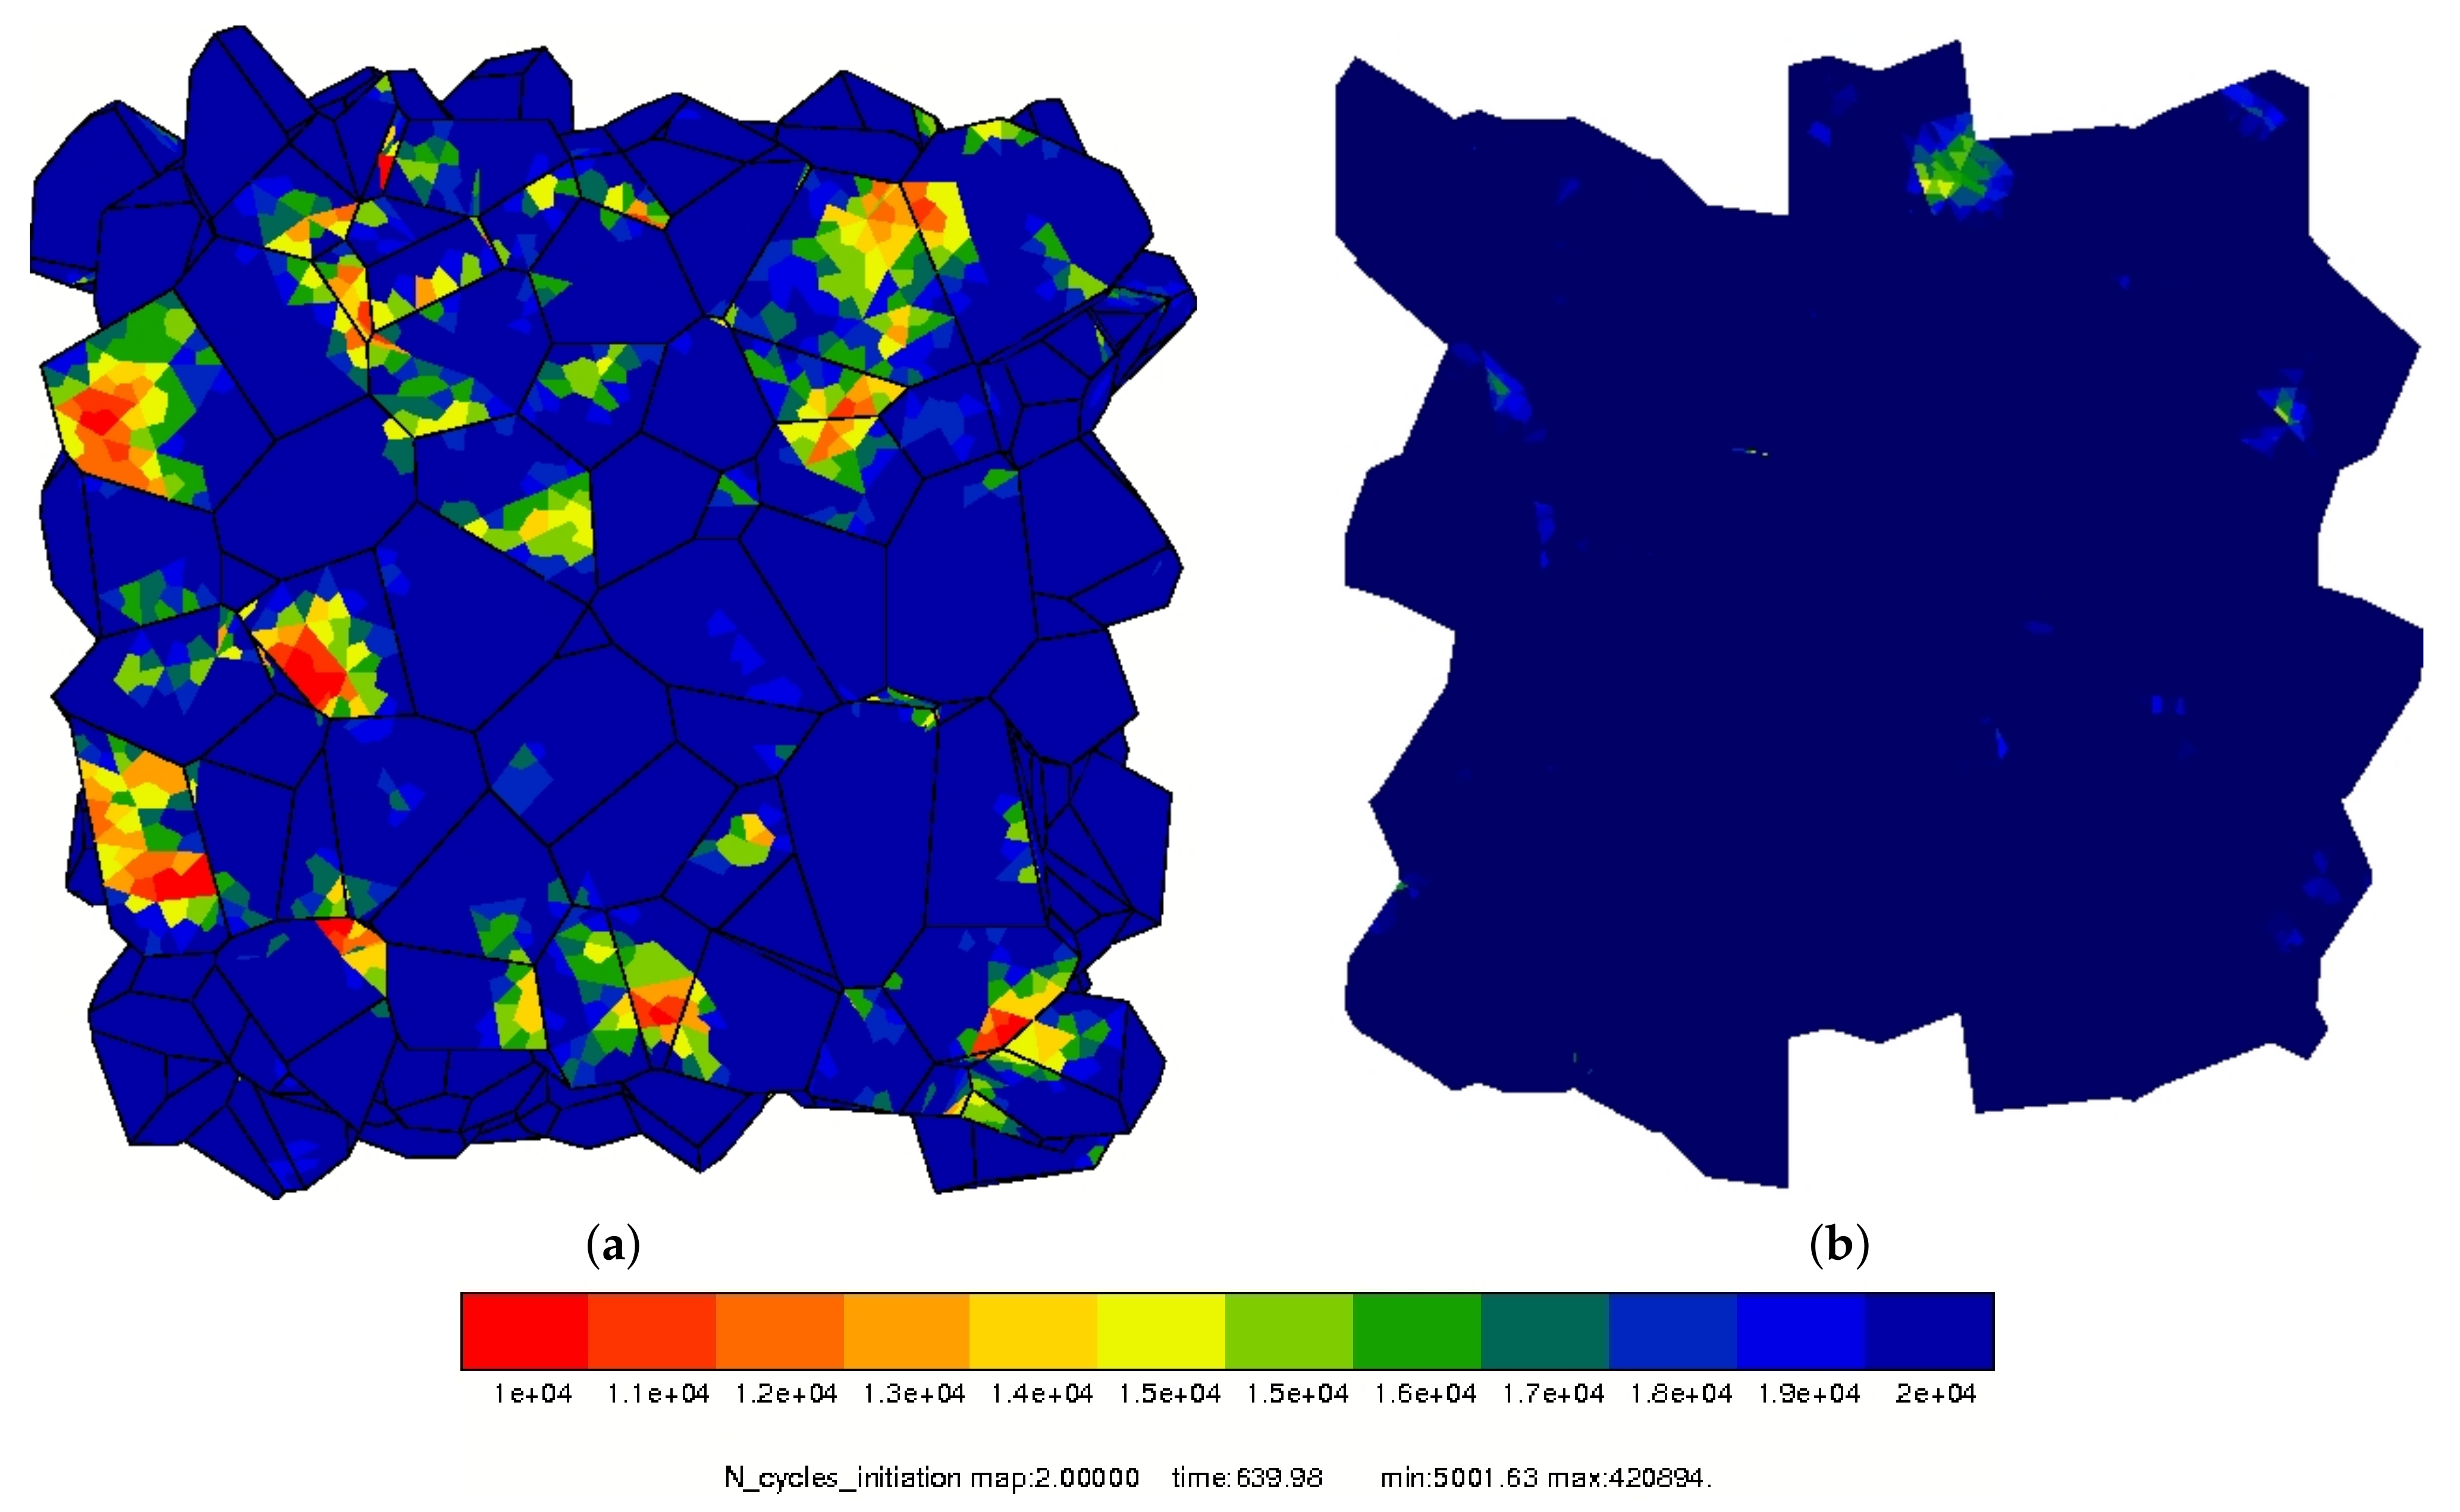
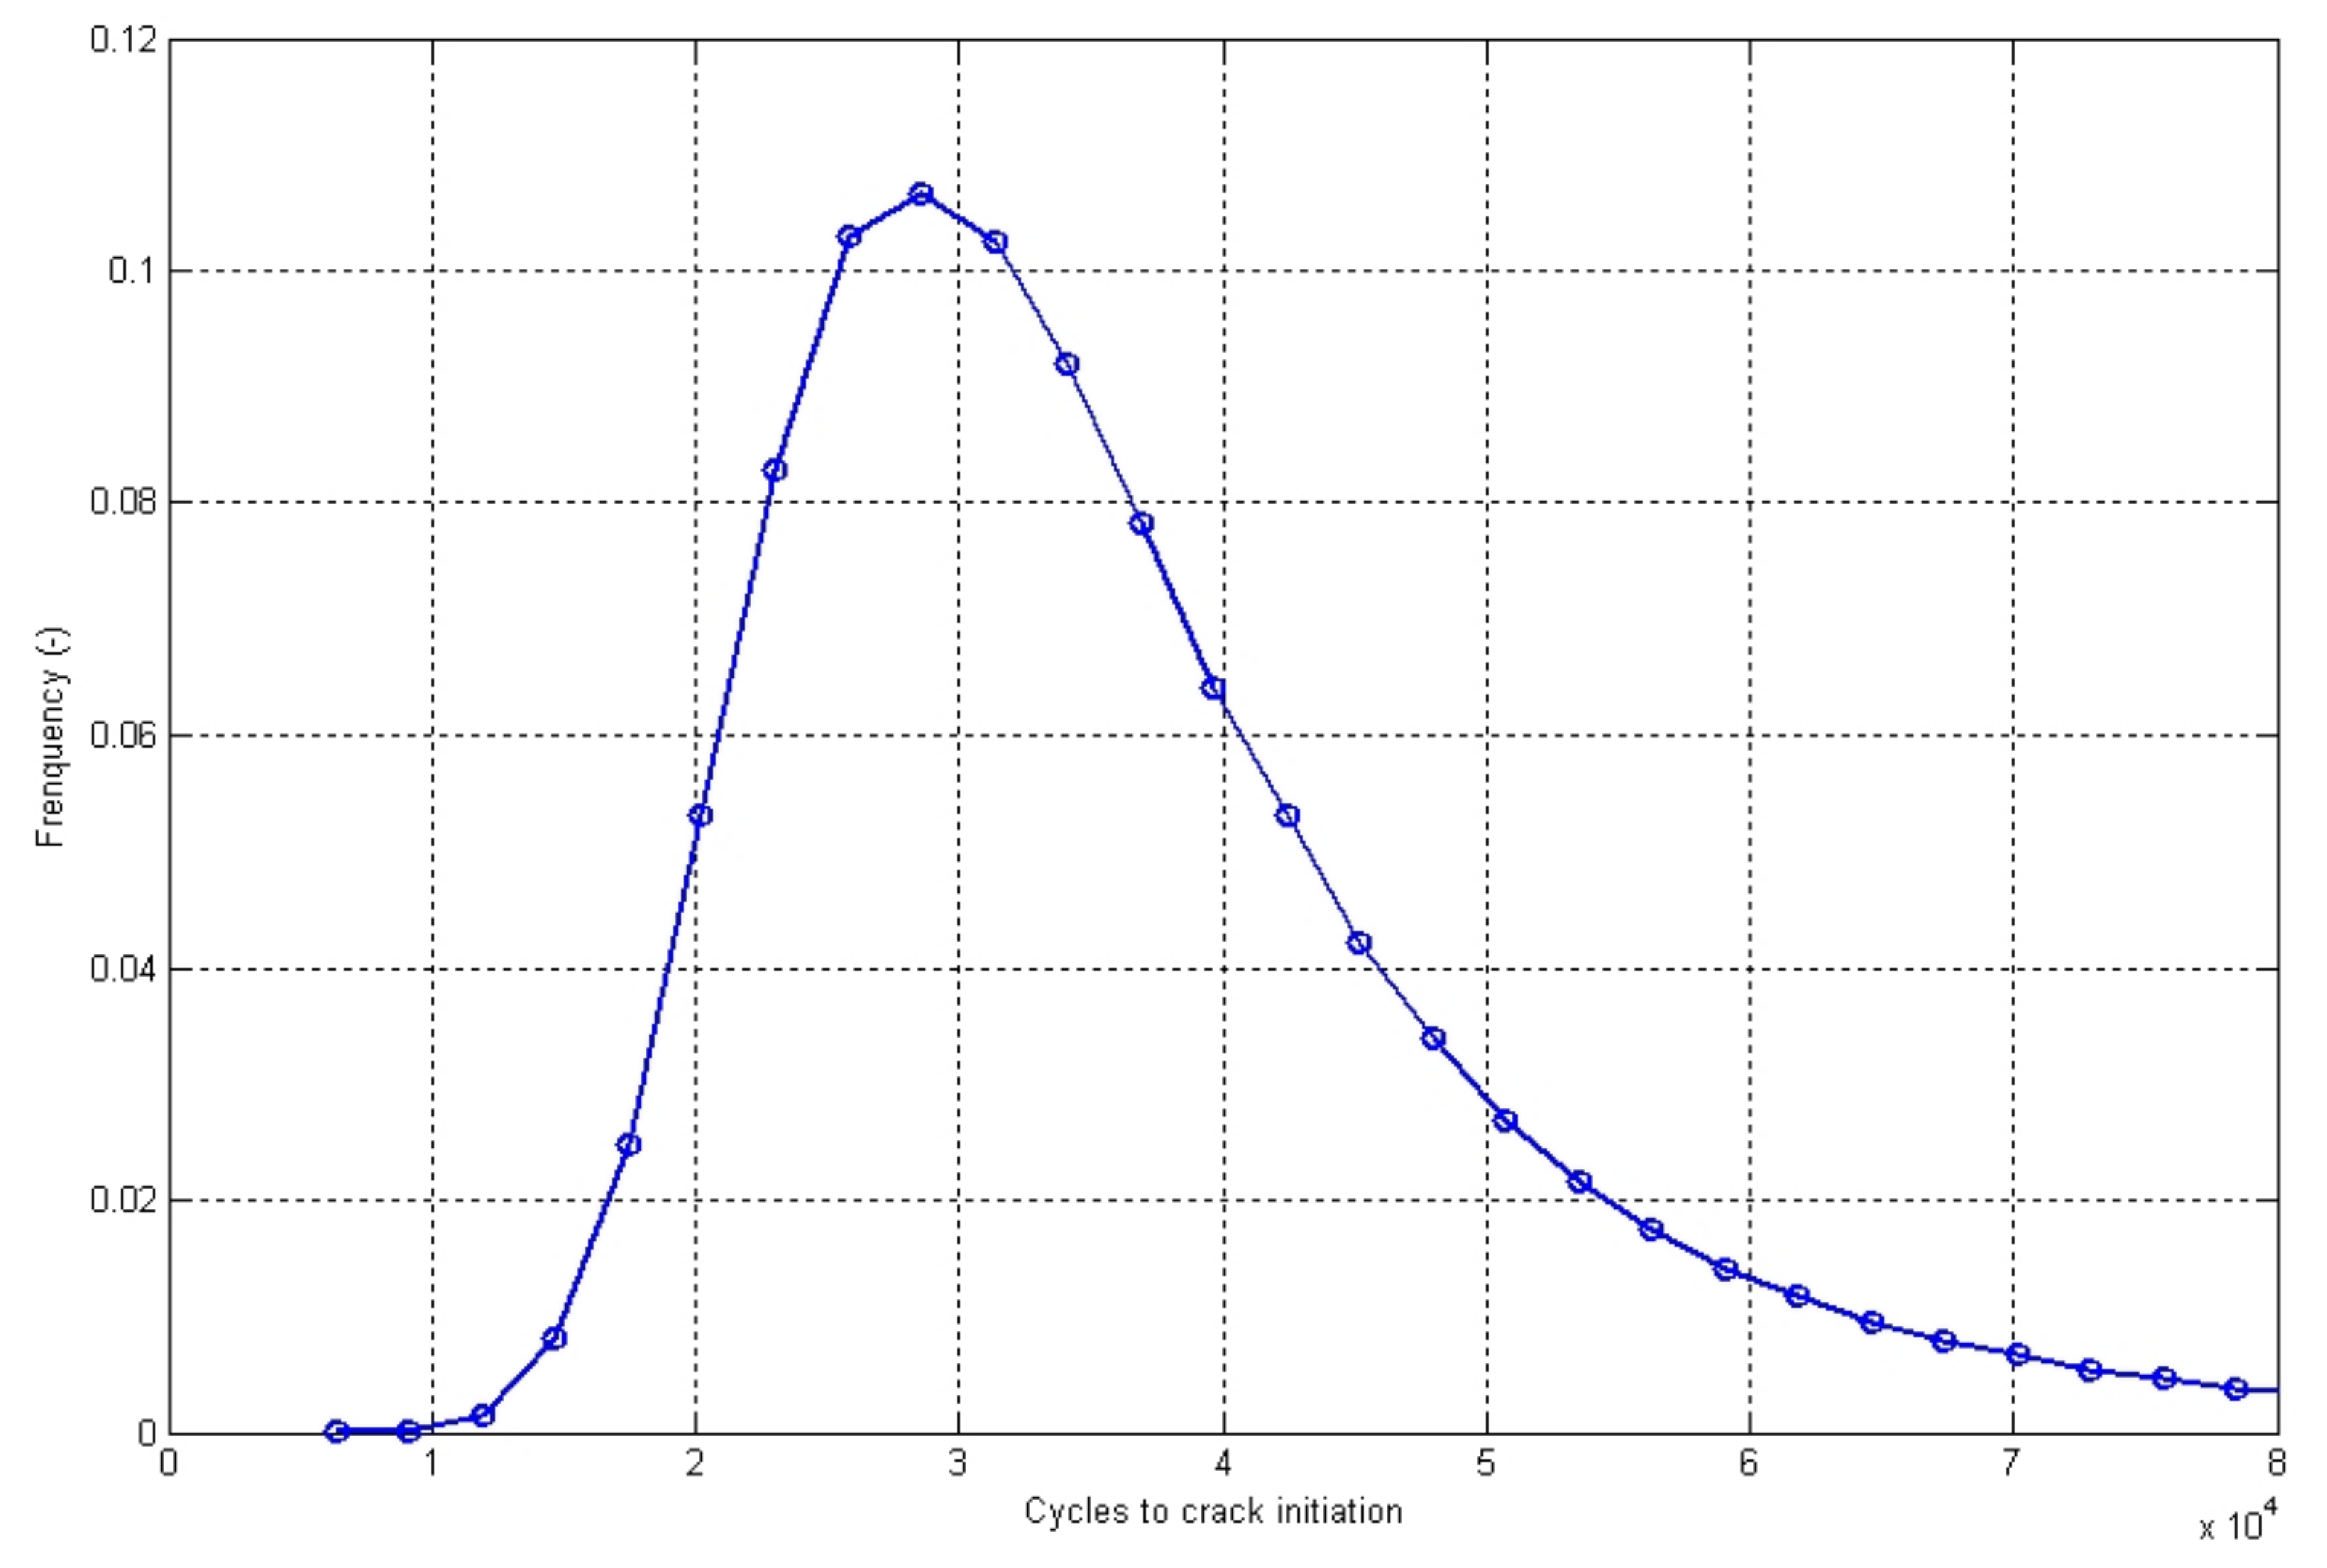
4.3. Fatigue Criterion

According to the micrographs of Figure 7, about 5000 cycles are required for the nucleation of the first cracks under the considered loading conditions. These cracks are found to be mainly intergranular. The experimental observations of Section 2.2 also show the strong local strain heterogeneity, with intense surface roughening occurring at some grain boundaries with corresponding peaks and sinks. The previous finite element simulations have shown that strain gradients and crystal misorientations develop on both sides of some grain boundaries and that they are leading to local ratcheting at several places. These experimental and numerical observations are in accordance with grain boundary behavior in BCC metals reported in [35].
Local fatigue criteria at the grain scale have been proposed and discussed in [19,21] and in the references quoted therein. They take into account the crystallographic deformation processes, the accumulation and the amplitude of plastic slip, mean resolved shear and normal stresses. The Dang–Van criterion applied to slip systems is based on the hydrostatic stress and the resolved shear stress, and thus predicts crack initiation in the bulk and not at the surface [78]. However, in the present case, it has been shown that crack initiation occurs at the surface, see Figure 7. Thus, such criteria are inappropriate for our application.
The accumulated slip at the local level in polycrystals was used by [23,79,80] to predict microcrack propagation, including the evaluation of the crack length increment and its direction. In the present work, it is proposed to use the previously defined ratcheting indicator as the main ingredient of the fatigue crack initiation criterion. Using the local plastic strain increment Δ ε r a t c h , e f f p ( x i , t ) at material point x i at time t allows to determine the most active plastic zones. In addition, based on the local data, the local equivalent plastic strain is defined at each material point located at x i at time t as
ε e q p ( x i , t ) = 2 3 ε i j p ( x i , t ) ε i j p ( x i , t )
A critical strain threshold ε c p is defined, as proposed in the literature on tantalum as a first indicator [81].
The plastic strain increment Δ ε r a t c h , e f f ( x i , t ) at every material point x i is assumed to have reached a constant value after 1000 cycles, but the local heterogeneity in the aggregate is preserved.
A crack is then assumed to initiate at the material point x i at cycle number N as soon as
ε e q p ( x i , N ) = ε c p
where ε e q p ( x i , N ) must be extrapolated from the value at the 1000th cycle. Considering that the plastic strain increment is constant at that time, i.e., Δ ε r a t c h , e f f ( x i , N > 1000 ) Δ ε r a t c h , e f f ( x i , 1000 ) , the local equivalent plastic strain value is estimated as
ε e q p ( x i , N ) = ε e q p ( x i , 1000 ) + Δ ε r a t c h , e f f p ( x i , 1000 ) ( N 1000 )
It follows that the number of cycles for crack initiation at the material point x i is
N i n i t i a t i o n ( x i ) = 1000 + ε c p ε e q p ( x i , 1000 ) Δ ε r a t c h , e f f p ( x i , 1000 )
A postprocessing of the FE results has been applied in order to calculate an average value of the fatigue criterion around each integration point in a set of elements. This volume average value is then assigned to each integration point. A value of 10% of the grain size is chosen as the radius of the spherical averaging domain, as proposed in the literature for crack initiation, for instance, in [82]. Half a sphere is used for points lying at the free surface. This local averaging procedure is used to avoid artifacts associated with local extremal values that may be due to poor element shape or size. This also allows for the consideration of process zone size depending on the fatigue crack initiation mechanisms.
In [83] it is proposed to consider that the critical local strain in fatigue ε c p at a material point in the aggregate is chosen identical to the overall ultimate strain for a monotonic tensile stress. Thus, the local strain needed for the nucleation of a crack is the same as the macroscopic ductility. This is a rough estimation that needs to be refined if sufficient experimental data is available. According to a recent study by Nadal [81] on tantalum, the macroscopic critical strain has been assessed for several strain amplitudes as ε f = ε c p = 0.07 . This critical value has been selected for the evaluation of the present fatigue crack initiation criterion.
Figure 18 presents the prediction of the number of cycles required for crack initiation as defined by Equation (13) using ε c p = 0.07 . Crack initiation occurs in areas studied earlier for nodes 1–3, especially for node 3 where the ratcheting was very intense. This figure can be compared to the maps of effective plastic strain increments at the free surface and mid-section in Figure 6 from the work in [17]. The lowest values of cycle numbers are listed in red in Figure 18 indicates the locations where fatigue cracking is expected to start. They correspond to the locations of maximal ratcheting. Some areas present a strong strain discontinuity on both sides of grain boundaries and are preferential crack initiation sites. The predominant crack initiation close to grain boundaries predicted by the simulation is in agreement with the previous experimental observations. Moreover, the comparison of Figure 18a,b demonstrates that crack initiate earlier at the free surface than in the bulk, which is a well-known feature of fatigue in pure metals. This is related to the fact that ratcheting phenomena were also found to be dominant at the free surface [17].
Figure 19 shows the histogram of the number of cycles to crack initiation for each node of the aggregate. The smallest values are reached at the surface close to node 3 identified on Figure 15. The analysis of this histogram shows that the lowest value is about 5000 cycles, and that the maximal value is 4.2 × 10 5 cycles. The mean value is 3.7 × 10 4 cycles and the standard deviation is 1.65 × 10 4 cycles. The found lowest value is in good agreement with the experimental observations of first cracks in Figure 7 already observed after 5000 cycles for stage I fatigue crack initiation. More accurate determination of crack initiation cycle numbers requires the choice of two additional quantities: a threshold for the statistical definition of crack initiation in the histogram of Figure 19 and the definition of a crack length for macro-initiation cracking, for instance, 300 μ m, which are not reached after 5000 cycles in our experiment.

5. Conclusions

The main findings of the present work are the following:
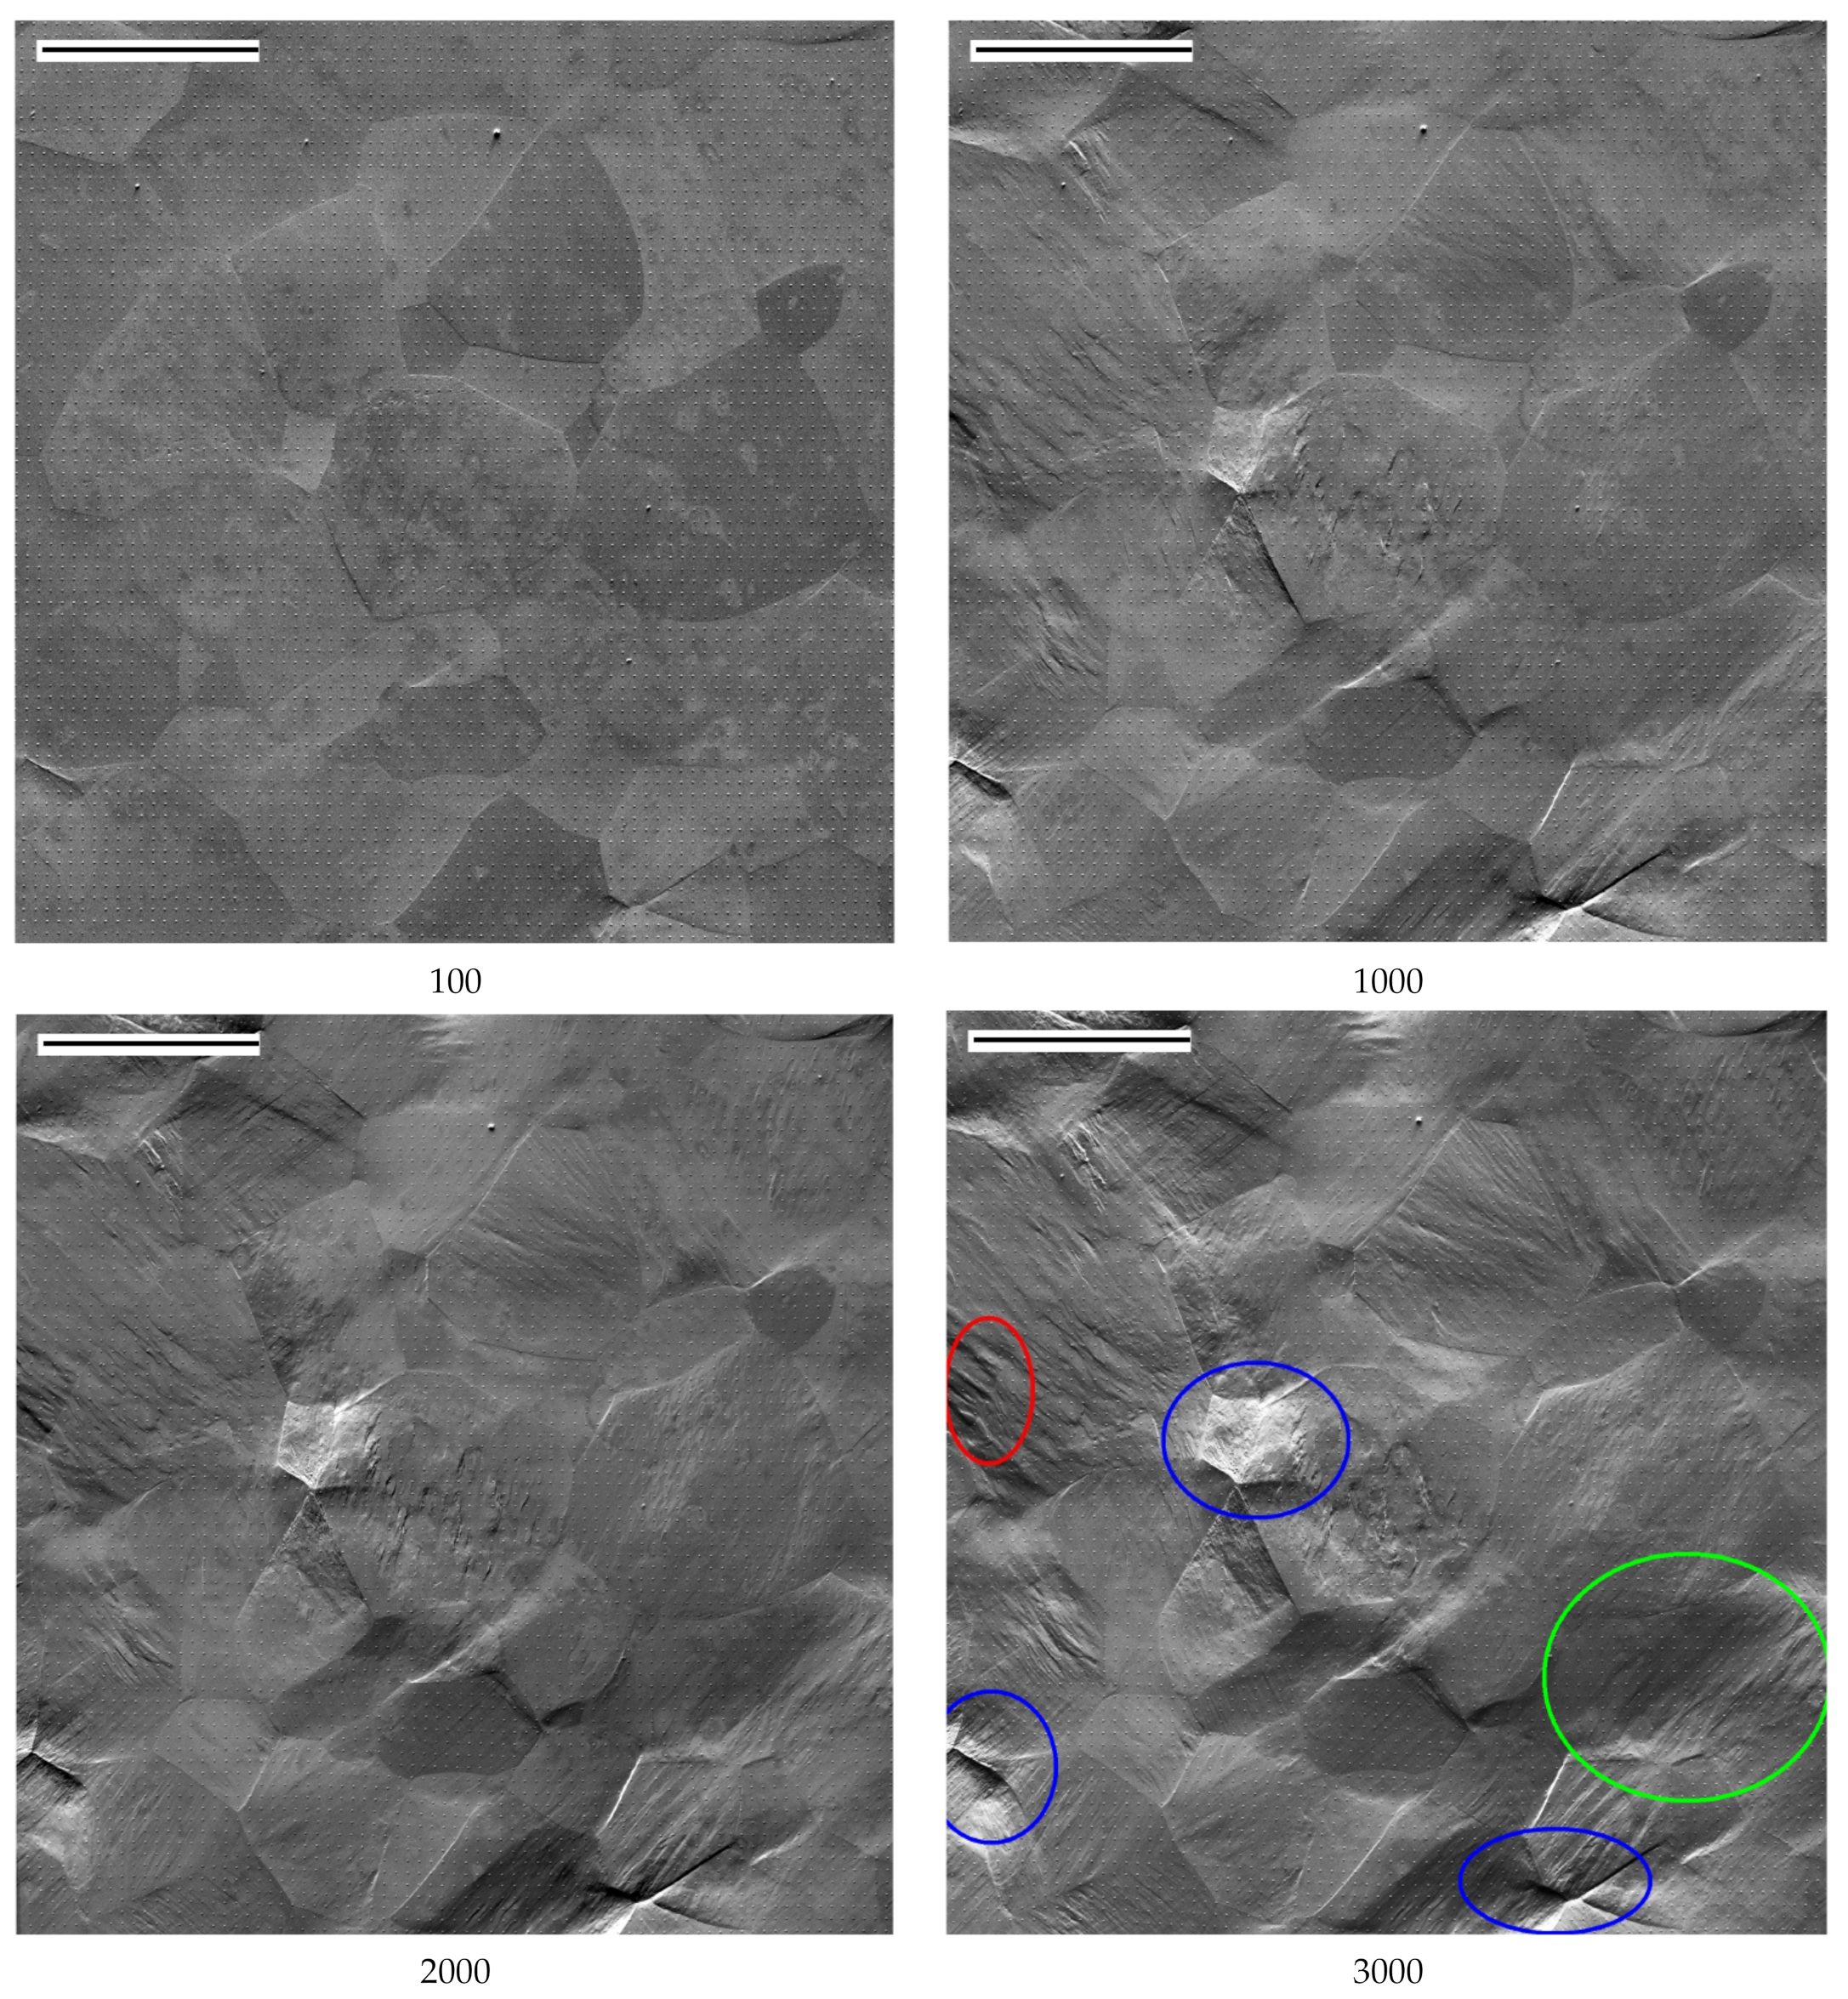
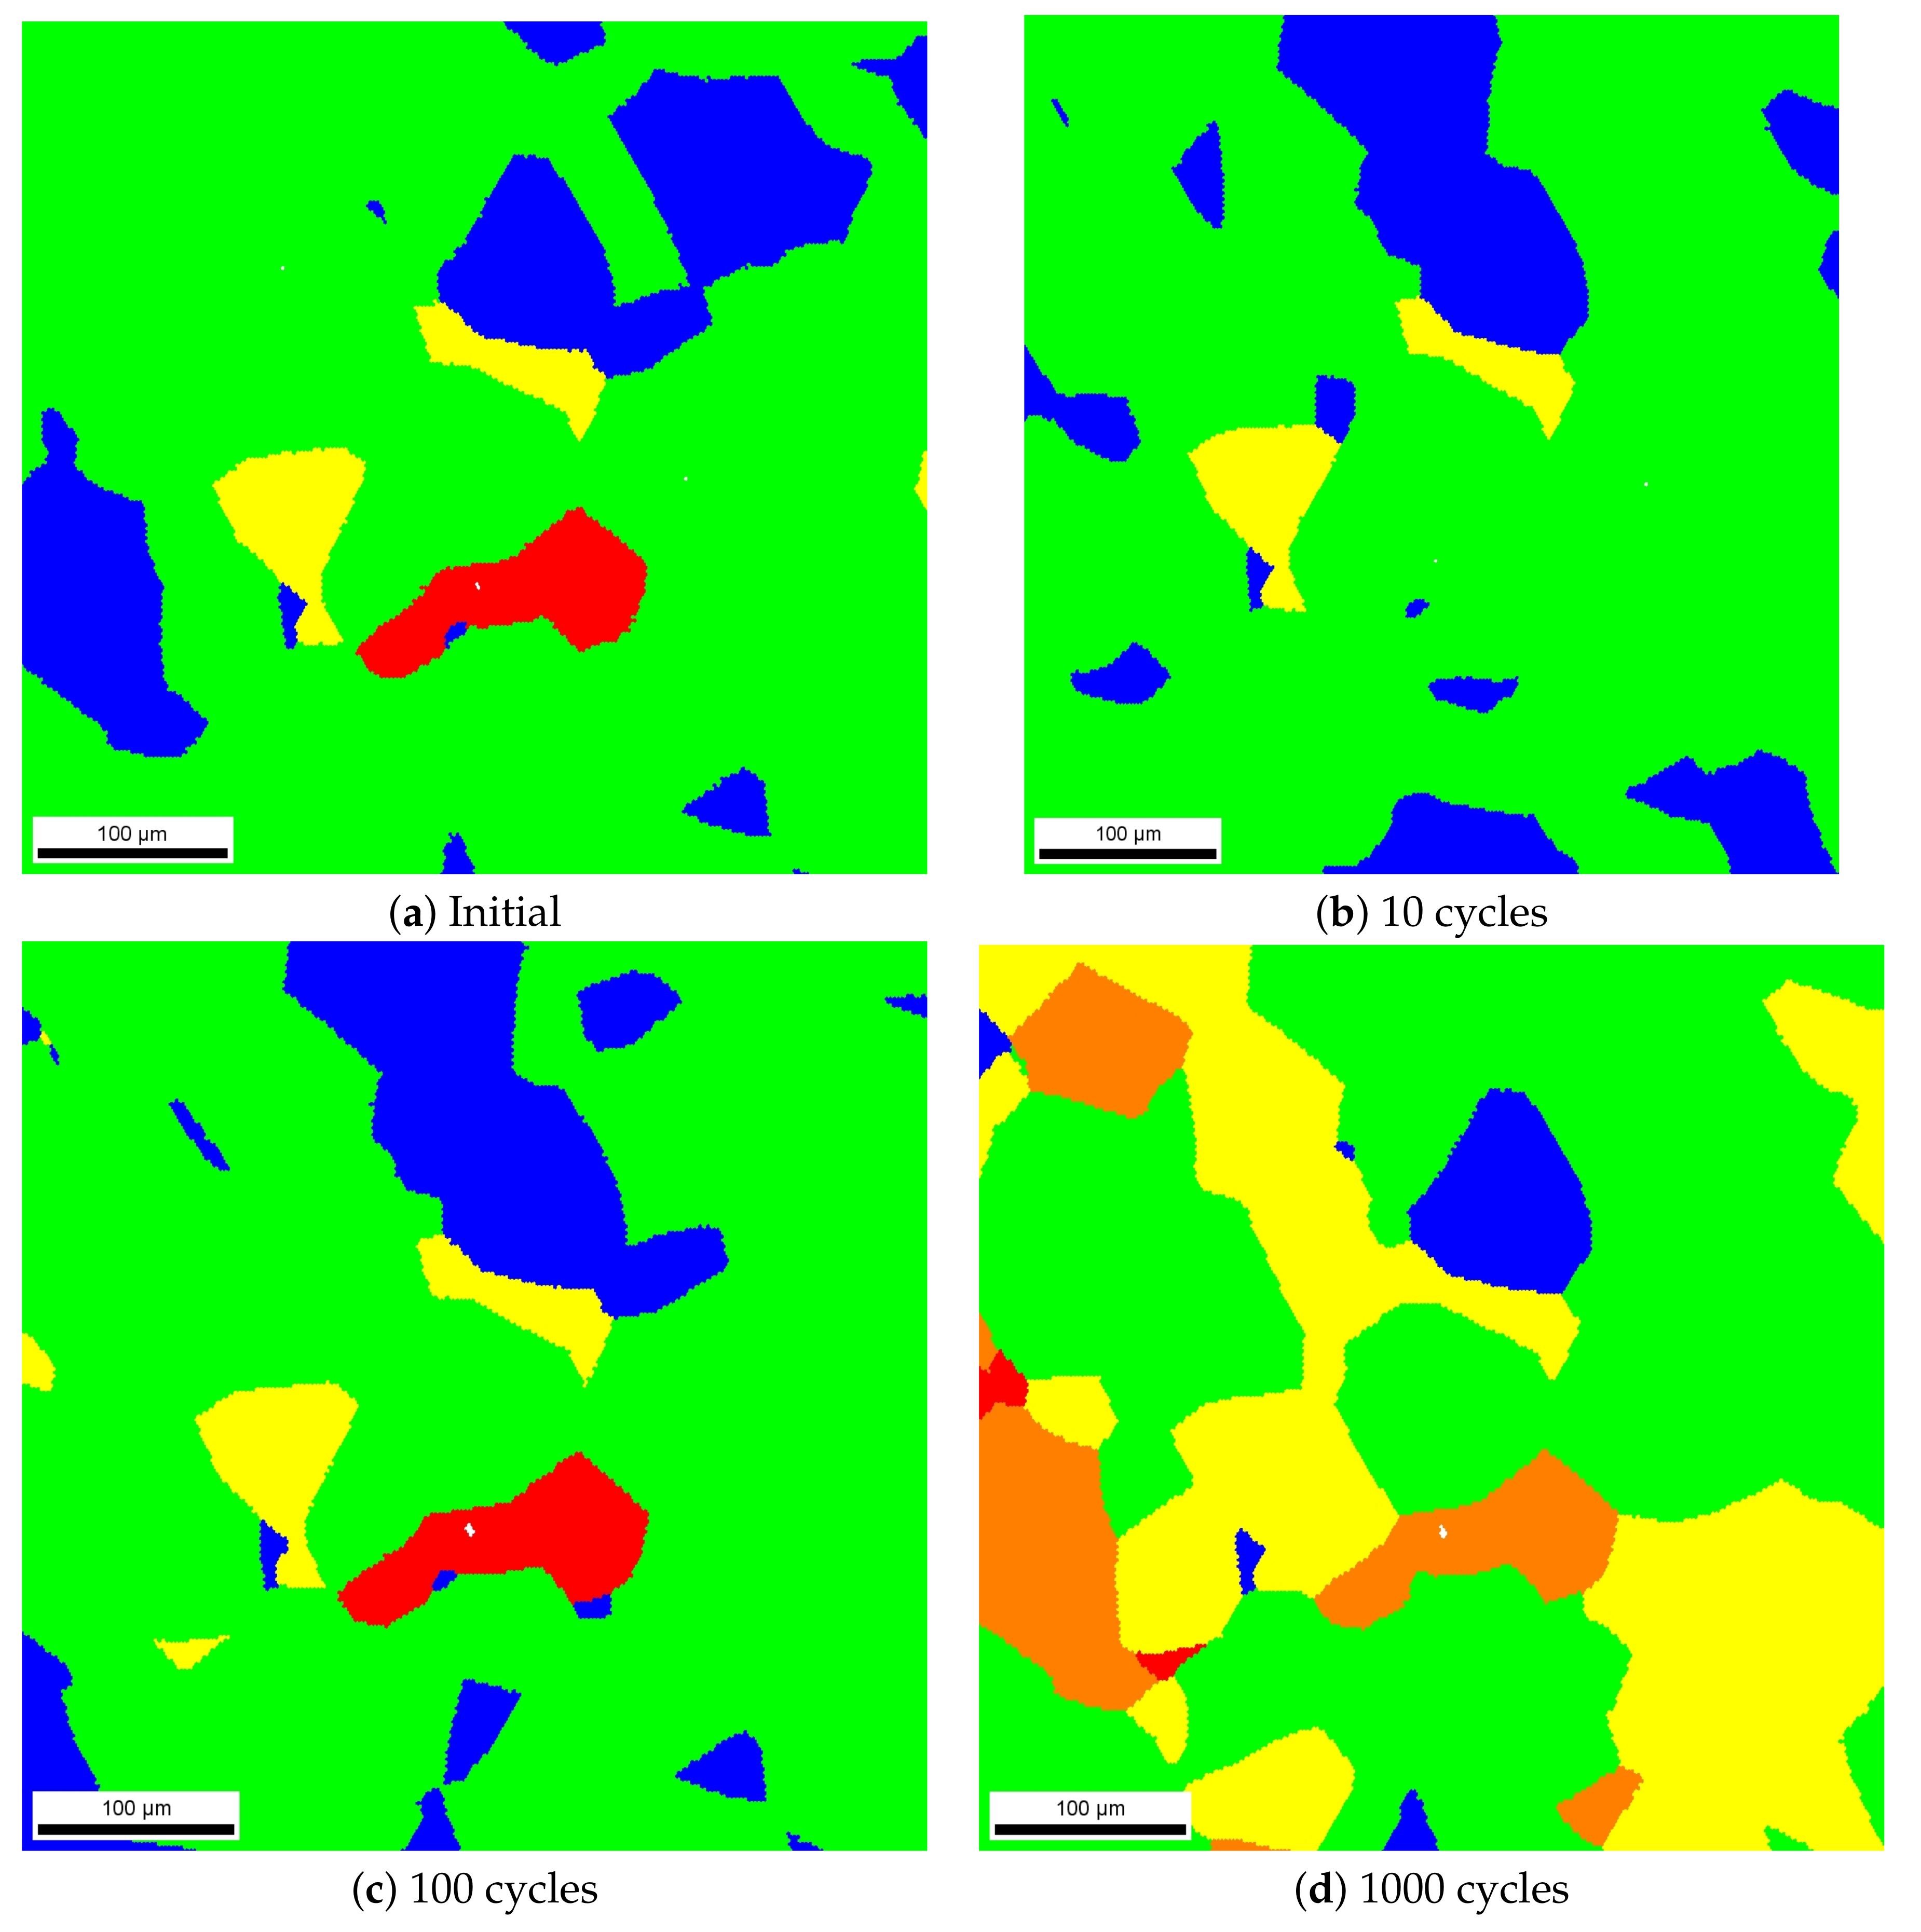
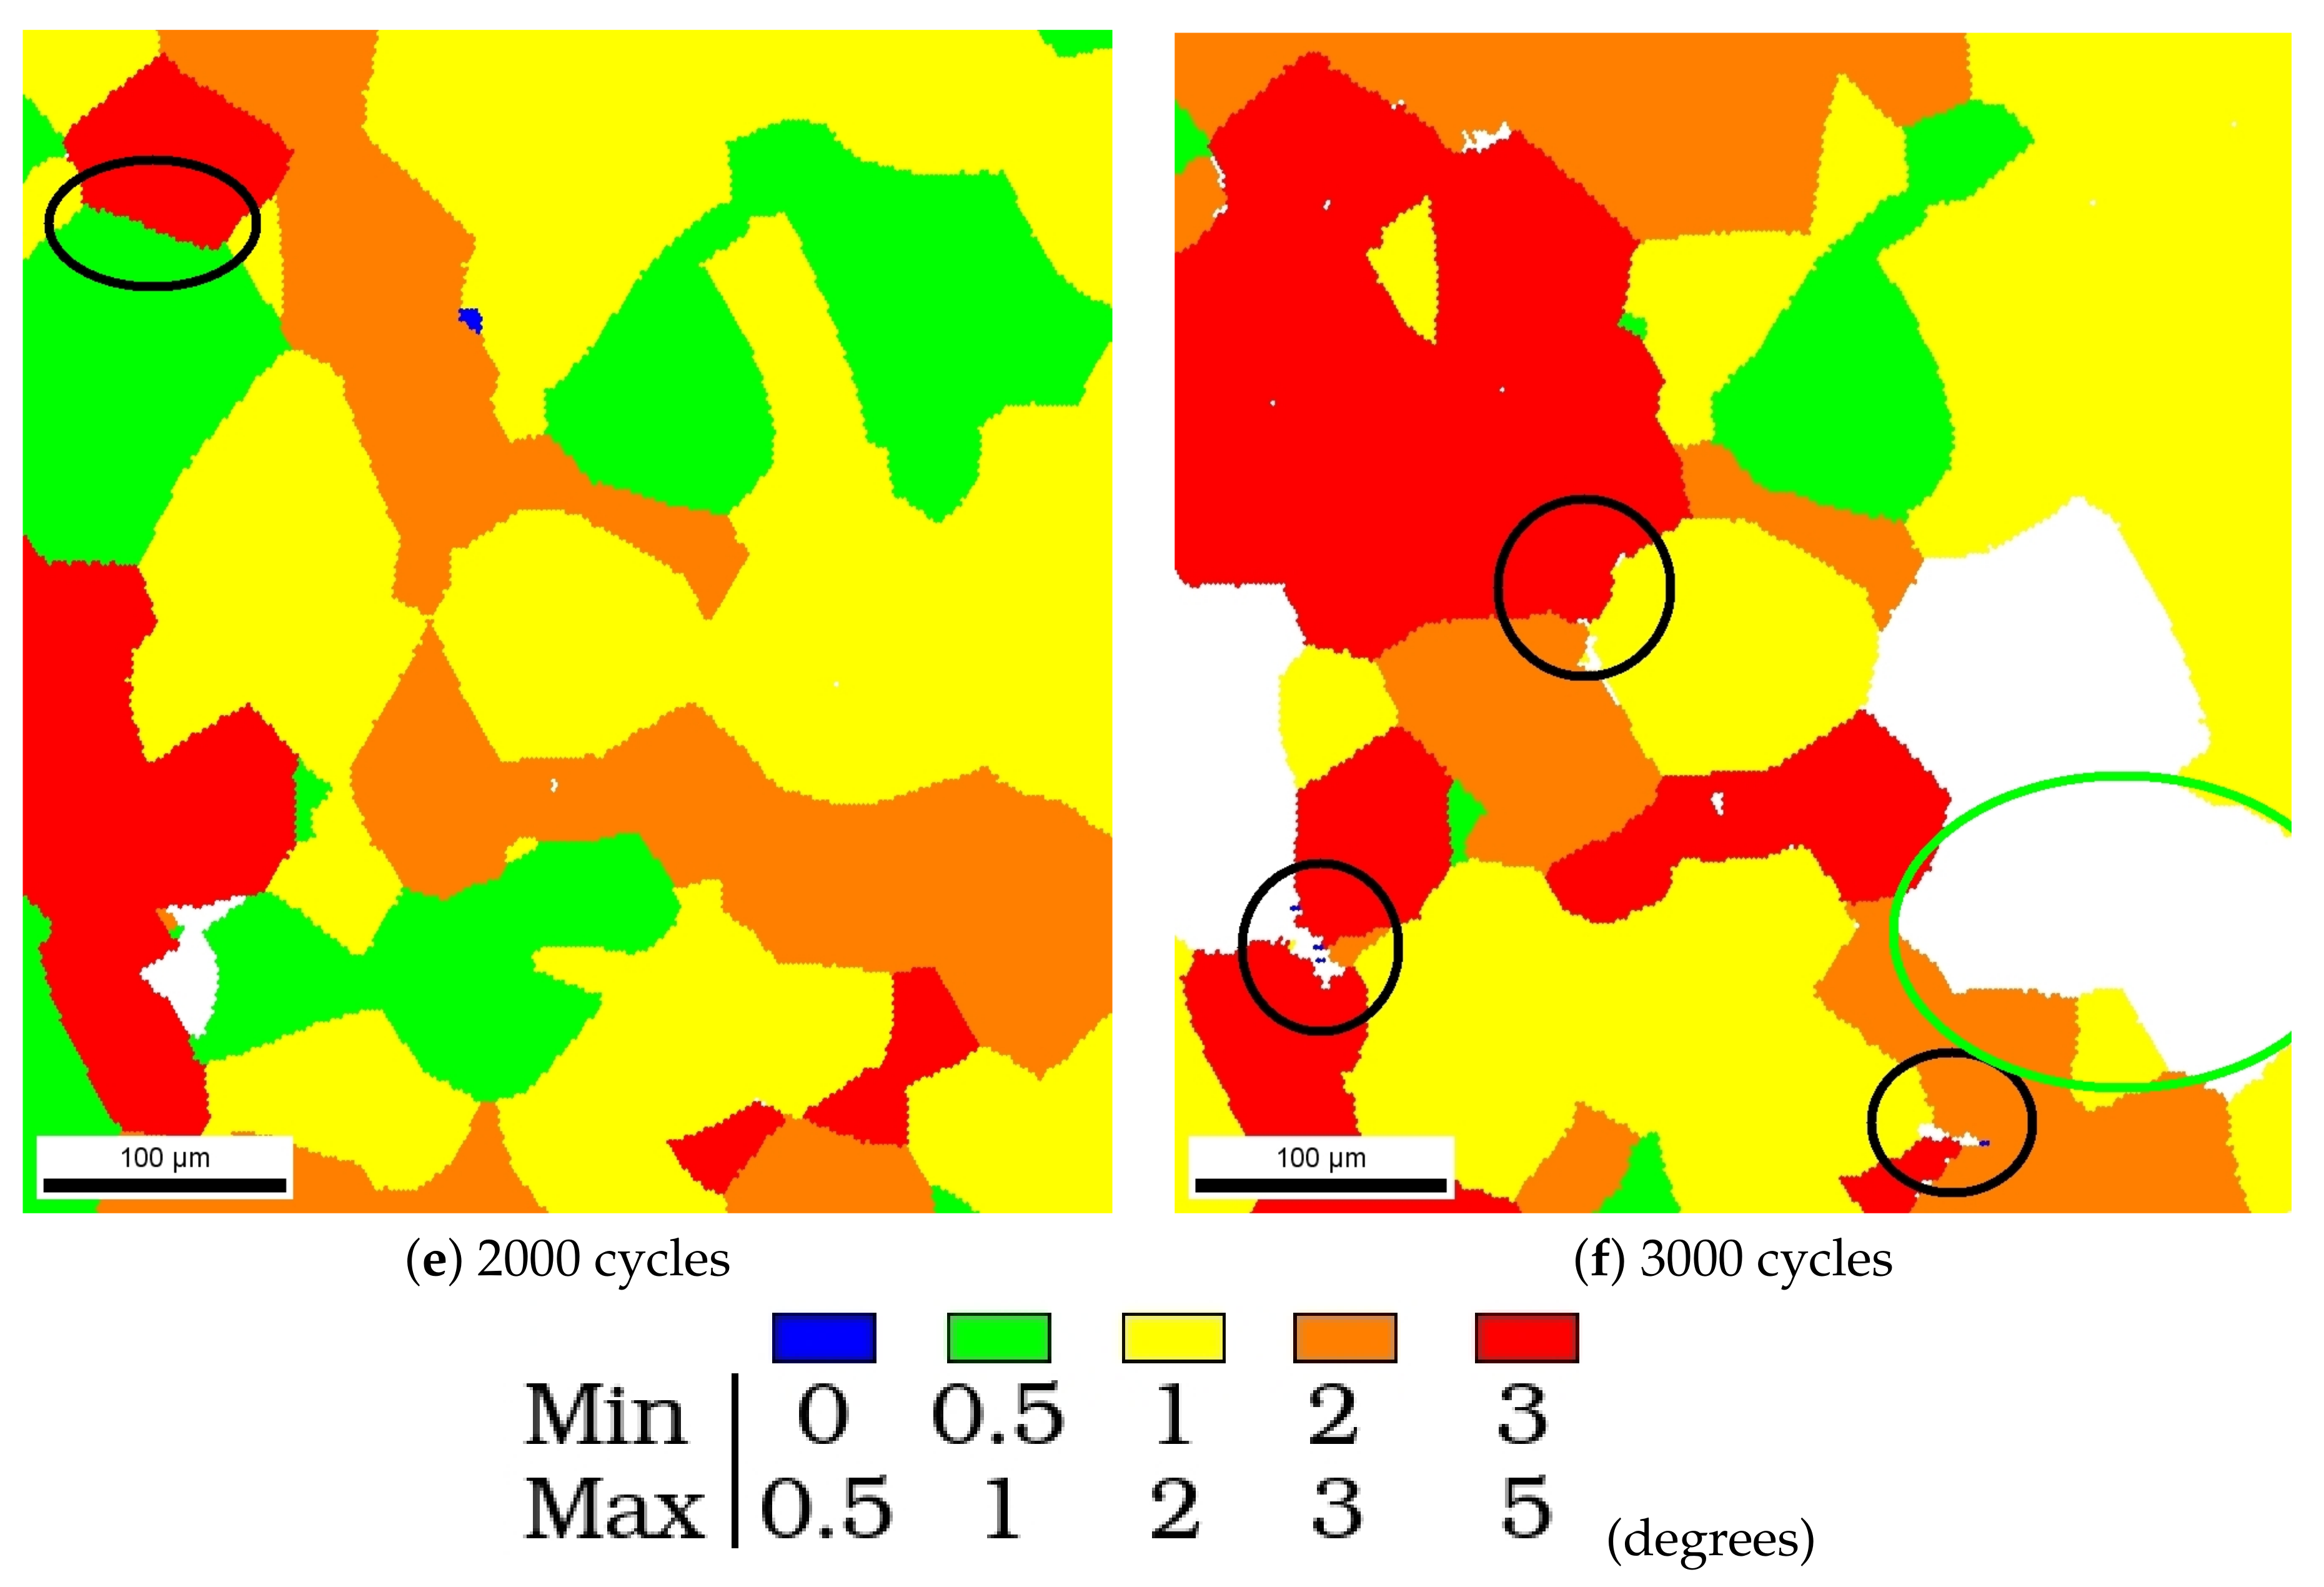
  • Unique experimental results from an interrupted cyclic tension–compression test have been provided. They show the development of plastic activity in the form of sinuous slip lines and intense slip bands. The development of lattice curvature resulting from inhomogeneous plastic slip inside the grains was illustrated after 100, 1000, 2000, and 3000 cycles.
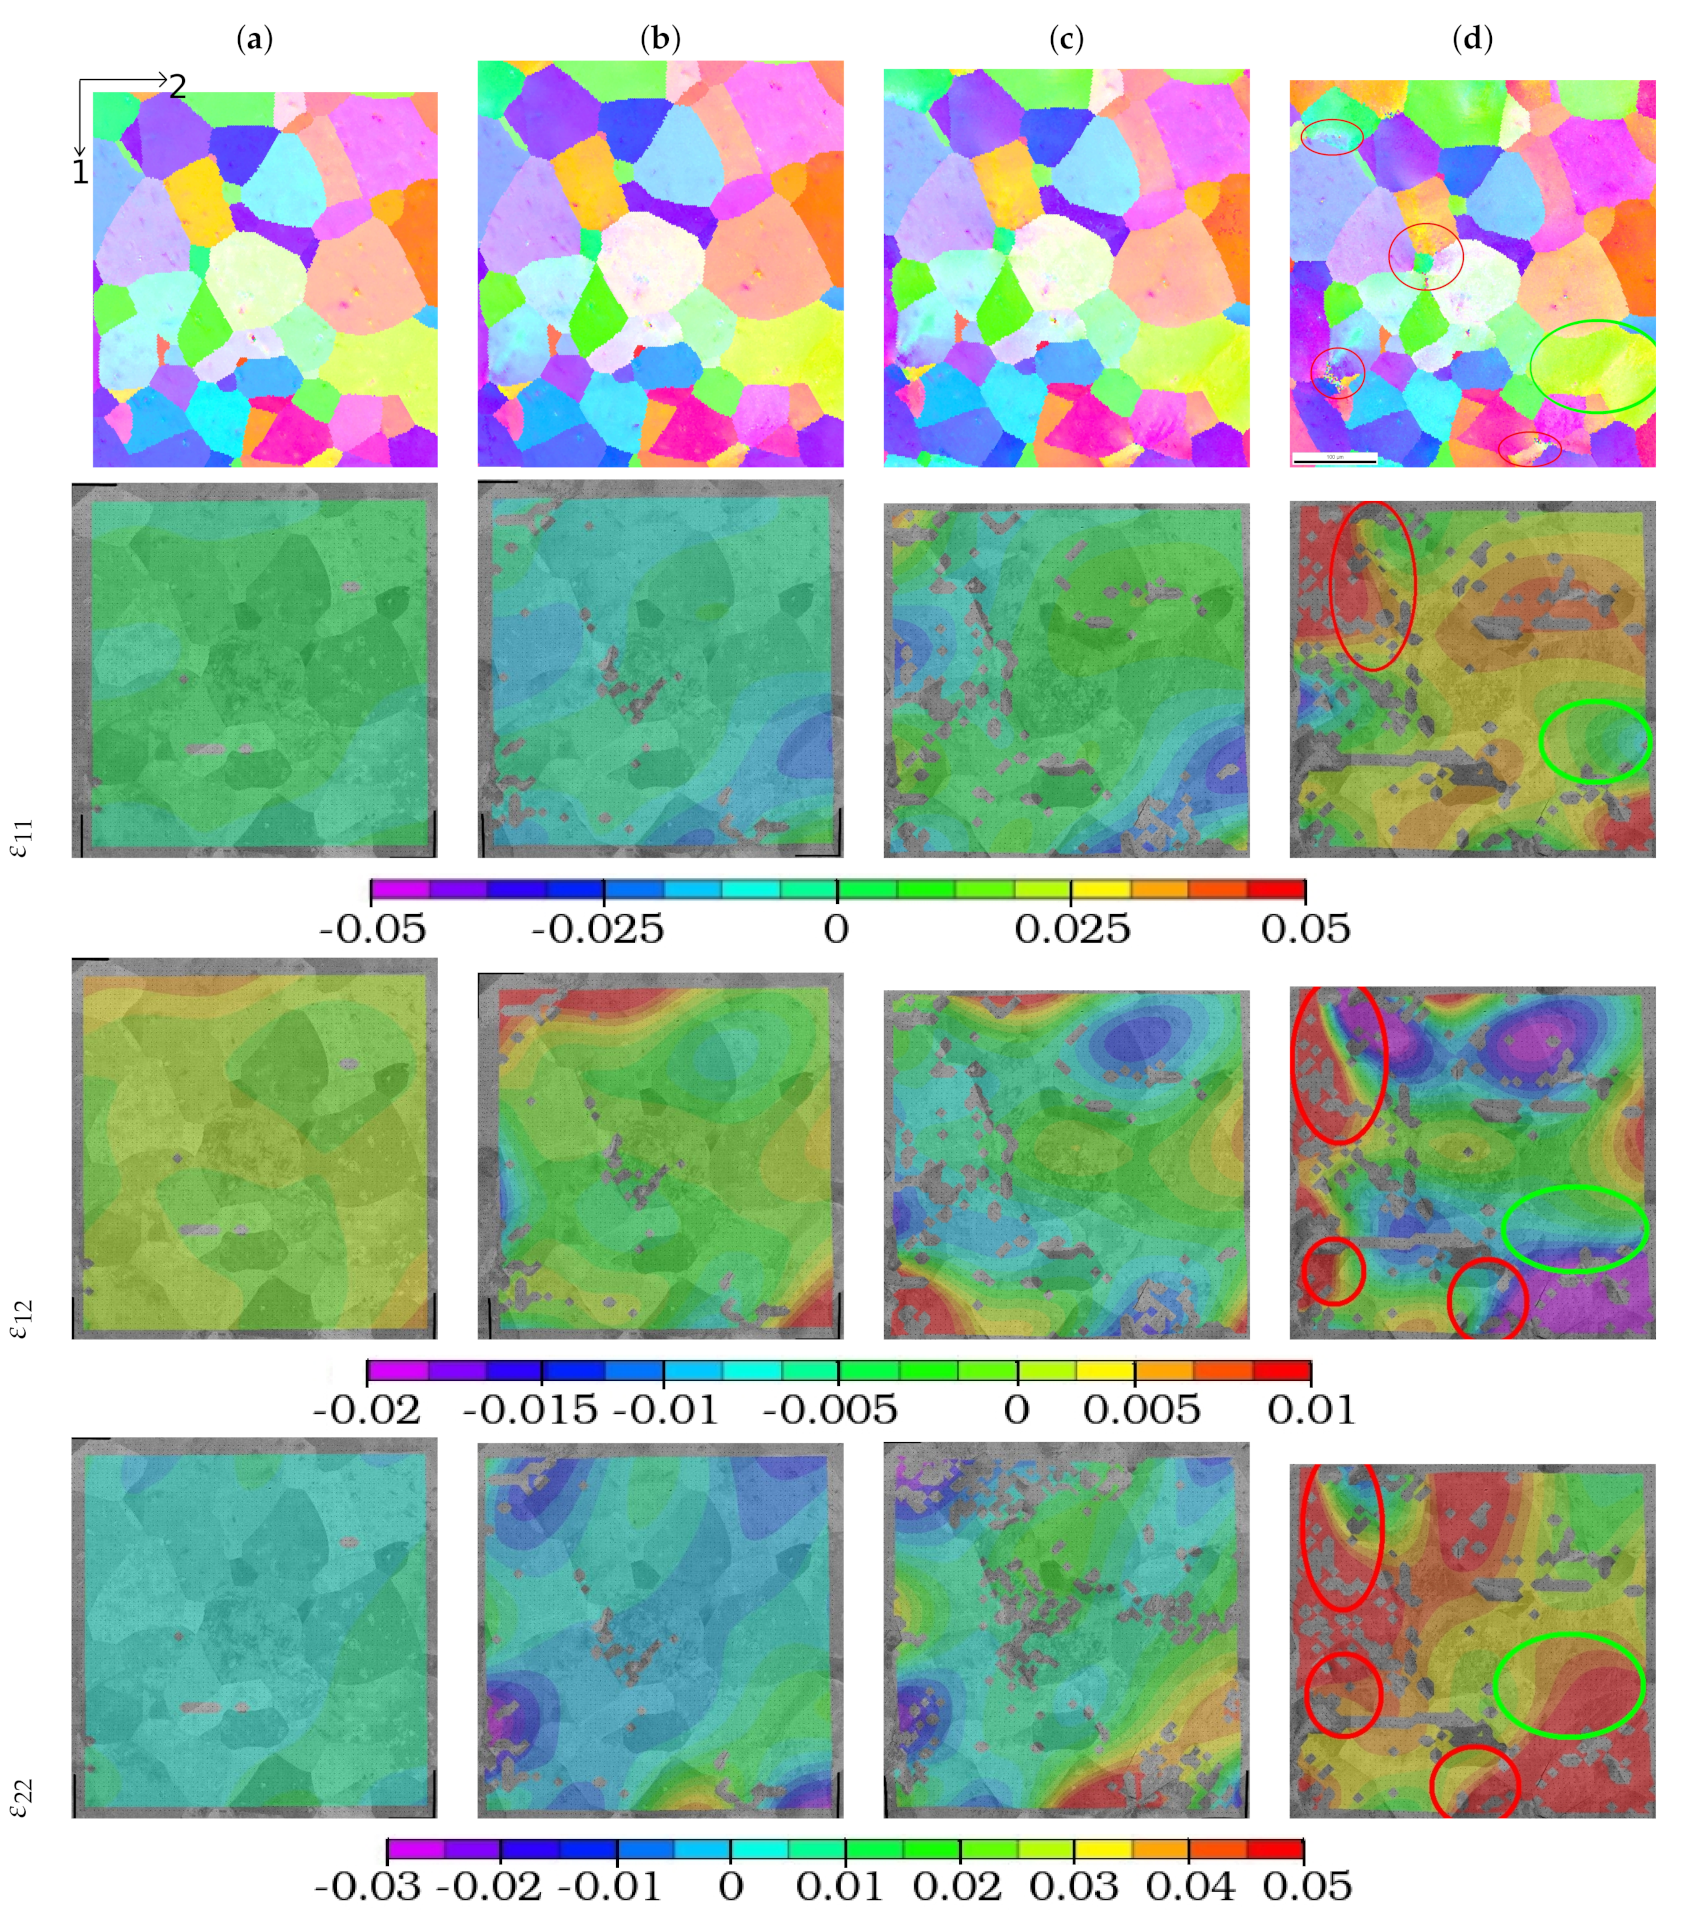
  • Strain field measurements reveal local strain values of a few percents even though the overall loading was ±0.2%. These values are compatible with observed local amounts of lattice rotation. This results in significant roughening of the free surface during cycling.
  • Fatigue cracks were shown to initiate between 3000 and 5000 cycles mainly in the form of intergranular cracks.
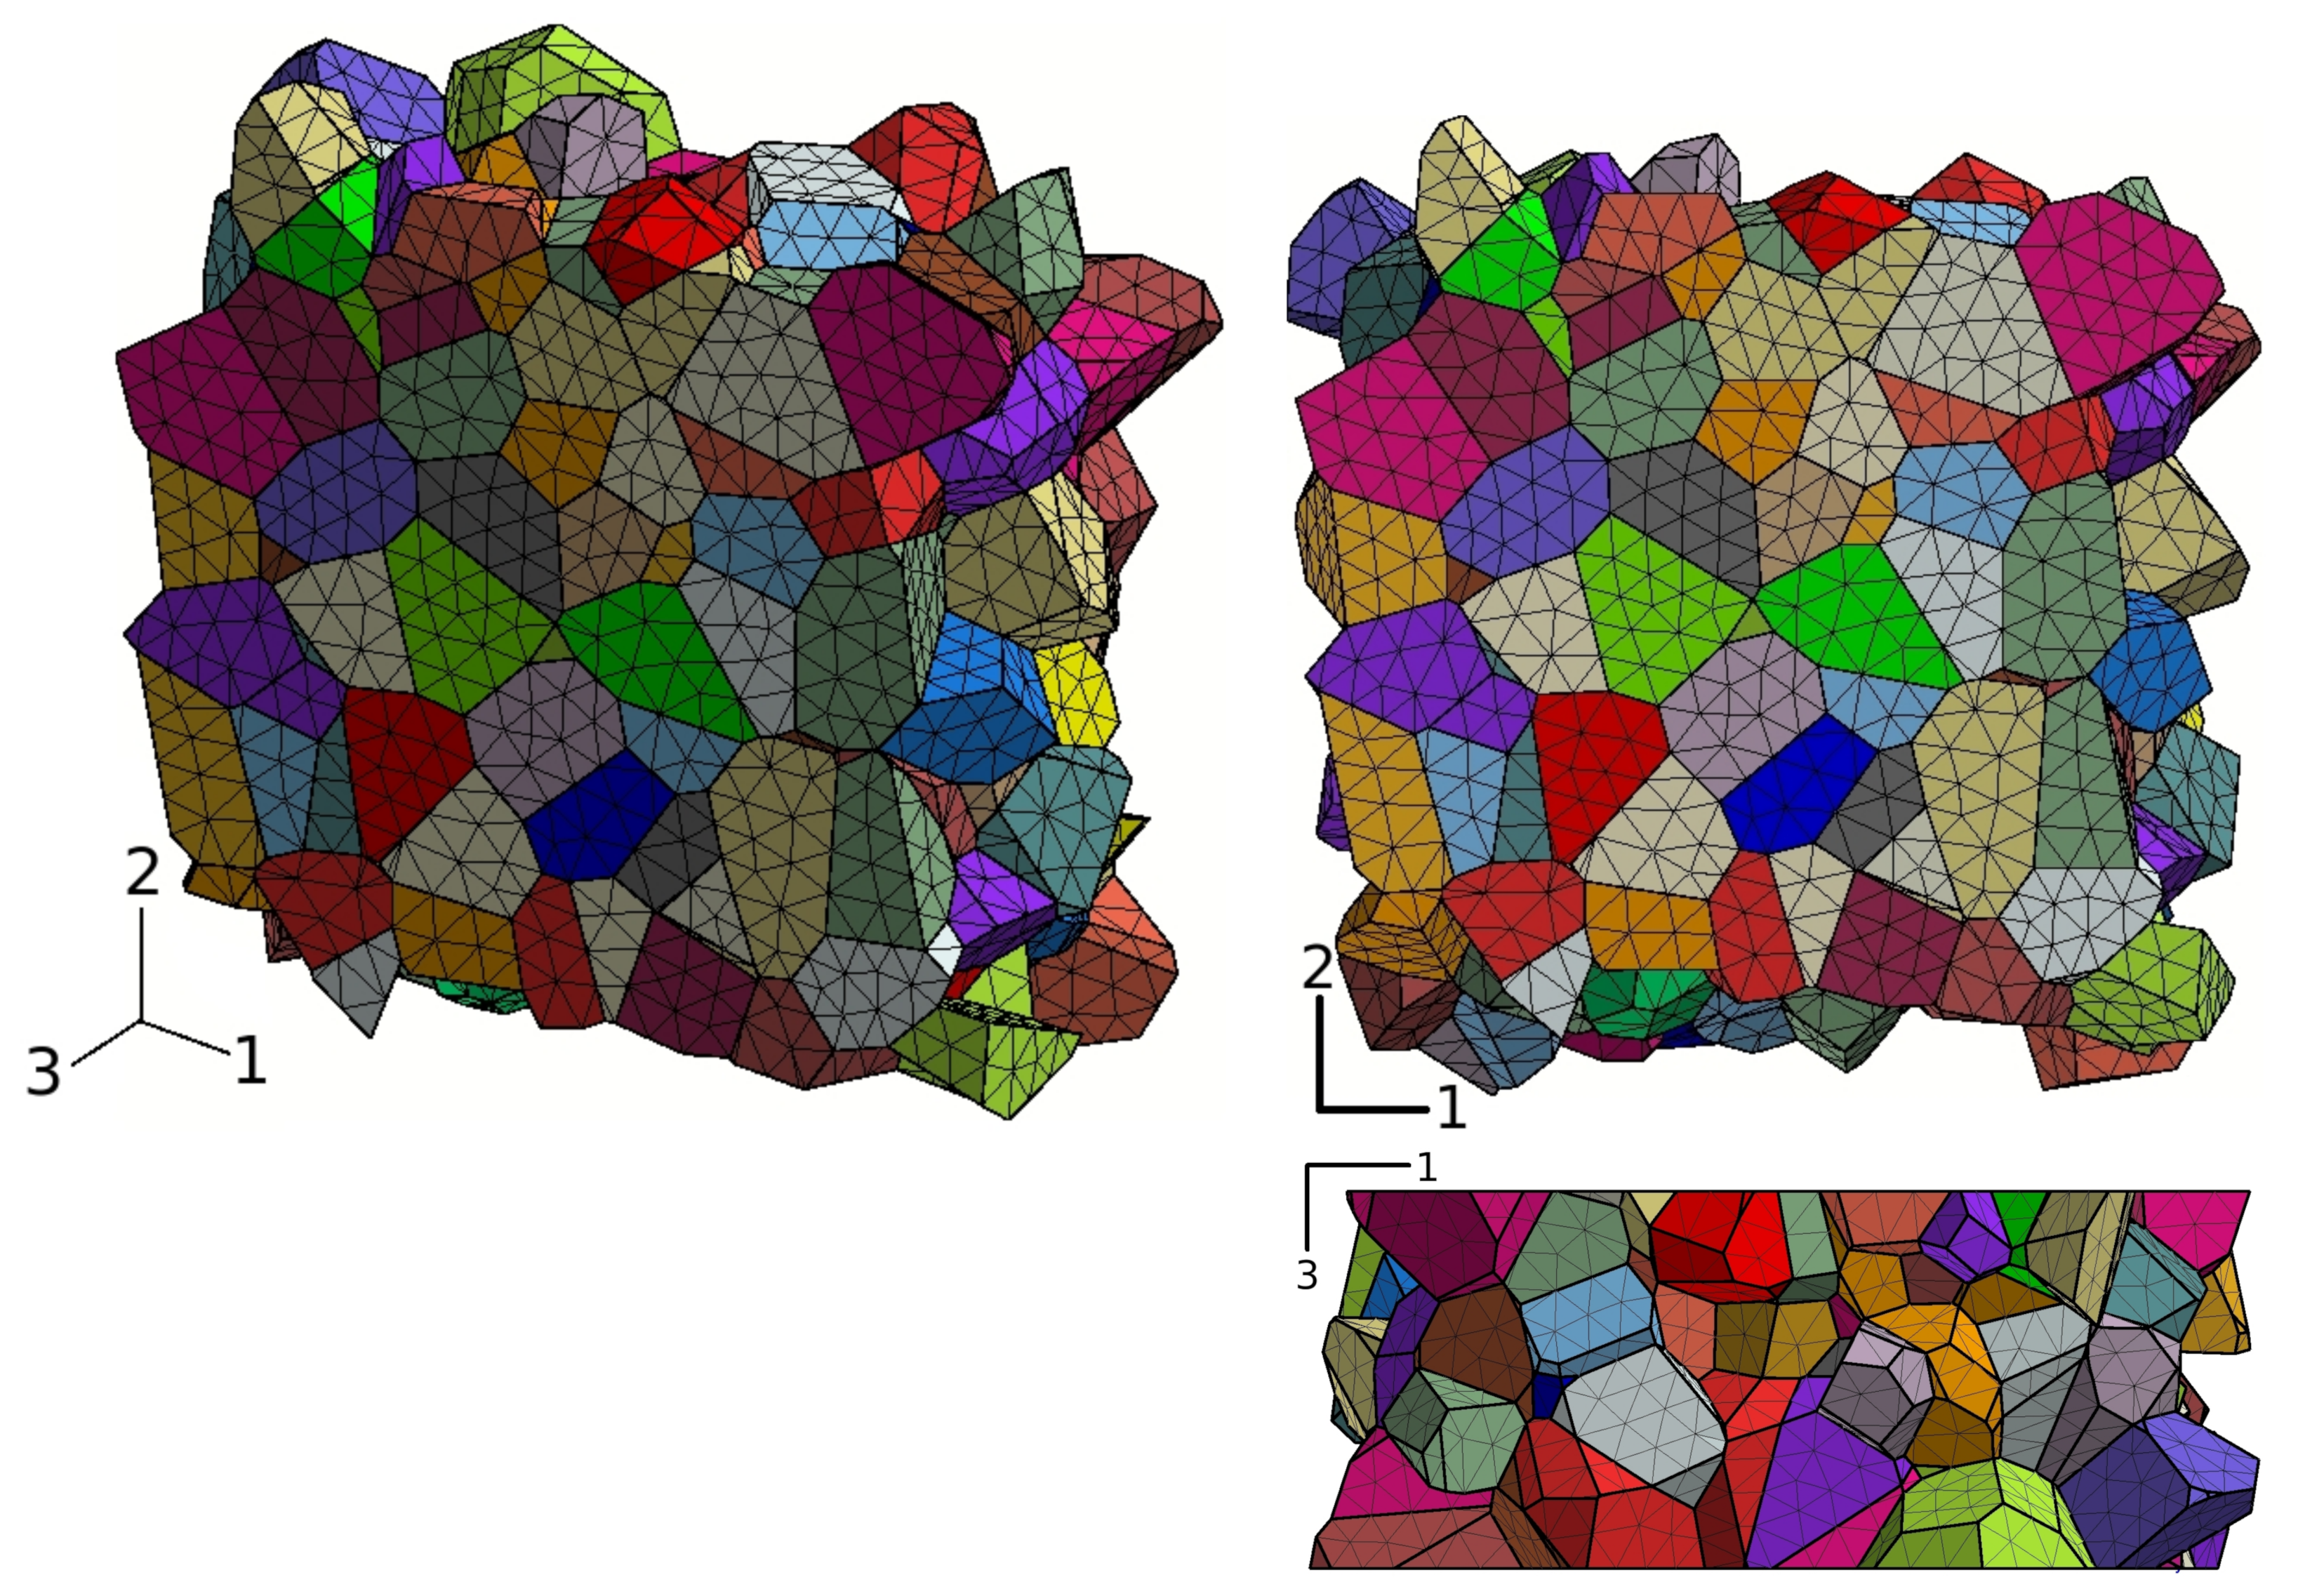
  • Unique FE simulation results of crystal plasticity in a semi-periodic polycrystalline aggregate were provided for more than 1000 cycles. They confirm but underestimate the strain heterogeneity that develops at the free surface.
  • An original fatigue criterion was proposed for stage I crack initiation at the grain level. It is based on the local determination of a multiaxial ratcheting indicator to be compared with a critical plastic equivalent strain value. The criterion indirectly incorporates the effects of resolved shear stresses and mean stress through the induced multiaxial plastic slip.
In this contribution, the hypothesis that local ratcheting phenomena in the surface grains of a tantalum polycrystal are responsible for fatigue crack initiation has been tested quantitavely. This is a well-known phenomenon contributing to the formation of extrusion/intrusion bands at the surface of many cyclically loaded metals and alloys. The ratcheting values deduced from the full-field simulations were used to make lifetime assessments in terms of number of cycle to initiation of fatigue cracks of given length. The experimentally observed surface roughness induced by cyclic loading, especially at some grain boundaries, corroborates the ratcheting phenomenon as a plausible fatigue crack initiation mechanism. More detailed microscopic analyses remain however to be performed to investigate the dislocation structures in such zones of accumulated plastic strain.
In this first step, it was not possible to have a one to one mapping between the experimentally investigated zone and the polycrystalline aggregate used in the FE simulation. Such a correspondence requires a precise knowledge of the 3D grain structure that can be obtained using Focused Ion Beam techniques. This remains to be done in the future for a more detailed analysis of the plastic behavior of tantalum. Guidelines to perform such one to one mapping can be found in [84]. Note that only one sample was experimentally tested and only one polycrystalline aggregate was simulated, so that a more complete statistical analysis of the results should be the objective of future work in this field. In particular, a larger number of cracks should be considered to confirm the predominance of intergranular fatigue cracking. Such additional analysis is necessary to draw definitive conclusions on the cracking mechanisms and on the validity of the proposed fatigue crack initiation model.
Improvements of the used crystal plasticity model are possible to include more sophisticated dislocation evolution equations for cyclic plasticity [85]. It must be acknowledged that the used modeling framework cannot account for grain boundary sliding (or cracking) or PSB formation. Validation of the presented fatigue crack initiation model is necessary for other loading conditions including non-vanishing mean stress loading and various loading ratios. The proposed fatigue crack initiation criterion could be combined with a more specific intergranular cracking model based on the alternating traction vector acting locally at grain boundaries. It is not sure that the consideration of a competition between transgranular and intergragranular crack initiation will give a better description of the experimental results as the proposed model predicts, in any case, crack initiation close to grain boundaries and triple junctions. More importantly, coupled fatigue damage–plasticity models could then be used to describe the local propagation of such initiated cracks. In that case, intergranular and transgranular cracks can be distinguished. Such a coupled crystal plasticity and damage model was proposed and applied to crack initiation and propagation in single crystal superalloys in [86]. This includes a gradient damage term which is necessary to obtain mesh-independent crack simulation results. Such a regularization was used in [87,88].

Author Contributions

D.C. performed the experiments and the finite element analysis. He also prepared the figures and the first draft of the paper; E.F. supervised the experimental work; S.F. (Sylvain Flouriot) and T.P. supervised the experimental and computational work and did the project administration; M.M. and S.F. (Samuel Forest) supervised the modeling and simulation part. All authors have read and agreed to the published version of the manuscript.

Funding

This research received no external funding.

Data Availability Statement

Not applicable.

Conflicts of Interest

The authors declare no conflict of interest.

References

  1. Nemat-Nasser, S.; Isaacs, J.; Liu, M. Microstructure of high-strain, high-strain-rate deformed tantalum. Acta Mater. 1998, 46, 1307–1325. [Google Scholar] [CrossRef]
  2. Nemat-Nasser, S.; Okinaka, T.; Ni, L. A physically-based constitutive model for BCC crystals with application to polycrystalline tantalum. J. Mech. Phys. Solids 1998, 46, 1009–1038. [Google Scholar] [CrossRef]
  3. Chen, Y.; Meyers, M.; Nesterenko, V. Spontaneous and forced shear localization in high-strain-rate deformation of tantalum. Mater. Sci. Eng. A 1999, 268, 70–82. [Google Scholar] [CrossRef]
  4. Diehl, M.; Niehuesbernd, J.; Bruder, E. On the PLC Effect in a Particle Reinforced AA2017 Alloy. Metals 2019, 9, 1252. [Google Scholar] [CrossRef] [Green Version]
  5. Bornert, M.; Brémand, F.; Doumalin, P.; Dupré, J.C.; Fazzini, M.; Grédiac, M.; Hild, F.; Mistou, S.; Molimard, J.; Orteu, J.J.; et al. Assessment of Digital Image Correlation Measurement Errors: Methodology and Results. Exp. Mech. 2009, 49, 353–370. [Google Scholar] [CrossRef] [Green Version]
  6. Cho, H.; Bronkhorst, C.A.; Mourad, H.M.; Mayeur, J.R.; Luscher, D.J. Anomalous plasticity of body-centered-cubic crystals with non-Schmid effect. Int. J. Solids Struct. 2018, 139–140, 138–149. [Google Scholar] [CrossRef] [Green Version]
  7. Alleman, C.; Ghosh, S.; Luscher, D.J.; Bronkhorst, C.A. Evaluating the effects of loading parameters on single-crystal slip in tantalum using molecular mechanics. Philos. Mag. 2014, 94, 92–116. [Google Scholar] [CrossRef]
  8. Lim, H.; Carroll, J.D.; Battaile, C.C.; Boyce, B.L.; Weinberger, C.R. Quantitative comparison between experimental measurements and CP-FEM predictions of plastic deformation in a tantalum oligocrystal. Int. J. Mech. Sci. 2015, 92, 98–108. [Google Scholar] [CrossRef] [Green Version]
  9. Moussa, C.; Bernacki, M.; Besnard, R.; Bozzolo, N. Statistical analysis of dislocations and dislocation boundaries from EBSD data. Ultramicroscopy 2017, 179, 63–72. [Google Scholar] [CrossRef] [Green Version]
  10. Lim, H.; Carroll, J.D.; Michael, J.R.; Battaile, C.C.; Chen, S.R.; Lane, J.M.D. Investigating active slip planes in tantalum under compressive load: Crystal plasticity and slip trace analyses of single crystals. Acta Mater. 2020, 185, 1–12. [Google Scholar] [CrossRef]
  11. Hansen, L.T.; Fullwood, D.T.; Homer, E.R.; Wagoner, R.H.; Lim, H.; Carroll, J.D.; Zhou, G.; Bong, H.J. An investigation of geometrically necessary dislocations and back stress in large grained tantalum via EBSD and CPFEM. Mater. Sci. Eng. A 2020, 772, 138704. [Google Scholar] [CrossRef]
  12. Chen, J.; Hahn, E.N.; Dongare, A.M.; Fensin, S.J. Understanding and predicting damage and failure at grain boundaries in BCC Ta. J. Appl. Phys. 2019, 126, 165902. [Google Scholar] [CrossRef]
  13. Wauthle, R.; van der Stok, J.; Yavari, S.A.; Van Humbeeck, J.; Kruth, J.P.; Zadpoor, A.A.; Weinans, H.; Mulier, M.; Schrooten, J. Additively manufactured porous tantalum implants. Acta Biomater. 2015, 14, 217–225. [Google Scholar] [CrossRef] [PubMed]
  14. Marechal, D.; Saintier, N.; Palin-Luc, T.; Nadal, F. High-Cycle Fatigue Behaviour of Pure Tantalum under Multiaxial and Variable Amplitude Loadings. Adv. Mater. Res. 2014, 891–892, 1341–1346. [Google Scholar] [CrossRef] [Green Version]
  15. Colas, D.; Finot, E.; Forest, S.; Flouriot, S.; Mazière, M.; Paris, T. Investigation and modelling of the anomalous yield point phenomenon in pure Tantalum. Mater. Sci. Eng. 2014, A615, 283–295. [Google Scholar] [CrossRef]
  16. Taleb, L.; Keller, C. Experimental contribution for better understanding of ratcheting in 304LSS. Int. J. Mech. Sci. 2018, 105, 527–535. [Google Scholar] [CrossRef]
  17. Colas, D.; Finot, E.; Flouriot, S.; Forest, S.; Mazière, M.; Paris, T. Local Ratcheting Phenomena in the Cyclic Behavior of Polycrystalline Tantalum. JOM J. Miner. Met. Mater. Soc. 2019, 71, 2586–2599. [Google Scholar] [CrossRef] [Green Version]
  18. Zhou, G.; Jeong, W.; Homer, E.R.; Fullwood, D.T.; Lee, M.G.; Kim, J.H.; Lim, H.; Zbib, H.; Wagoner, R.H. A predictive strain-gradient model with no undetermined constants or length scales. J. Mech. Phys. Solids 2020, 145, 104178. [Google Scholar] [CrossRef]
  19. McDowell, D. Simulation-based strategies for microstructure-sensitive fatigue modeling. Mater. Sci. Eng. 2007, A468, 4–14. [Google Scholar] [CrossRef]
  20. Li, Y.; Aubin, V.; Rey, C.; Bompard, P. Polycrystalline numerical simulation of variable amplitude loading effects on cyclic plasticity and microcrack initiation in austenitic steel 304L. Int. J. Fatigue 2012, 42, 71–81. [Google Scholar] [CrossRef]
  21. Dunne, F. Fatigue crack nucleation: Mechanistic modelling across the length scales. Curr. Opin. Solid State Mater. Sci. 2014, 18, 170–179. [Google Scholar] [CrossRef] [Green Version]
  22. Lu, J.; Sun, W.; Becker, A. Material characterisation and finite element modelling of cyclic plasticity behaviour for 304 stainless steel using a crystal plasticity model. Int. J. Mech. Sci. 2016, 105, 315–329. [Google Scholar] [CrossRef]
  23. Proudhon, H.; Li, J.; Ludwig, W.; Roos, A.; Forest, S. Simulation of short fatigue crack propagation in a 3D experimental microstructure. Adv. Eng. Mater. 2017. [Google Scholar] [CrossRef]
  24. Hor, A.; Saintier, N.; Robert, C.; Palin-Luc, T.; Morel, F. Statistical assessment of multiaxial HCF criteria at the grain scale. Int. J. Fatigue 2014, 67, 151–158. [Google Scholar] [CrossRef] [Green Version]
  25. Le, V.; Morel, F.; Bellett, D.; Saintier, N.; Osmond, P. Multiaxial high cycle fatigue damage mechanisms associated with the different microstructural heterogeneities of cast aluminium alloys. Mater. Sci. Eng. A 2016, 649, 426–440. [Google Scholar] [CrossRef] [Green Version]
  26. Ghosh, S.; Chakraborty, P. Microstructure and load sensitive fatigue crack nucleation in Ti-6242 using accelerated crystal plastificty FEM simulations. Int. J. Fatigue 2013, 48, 231–246. [Google Scholar] [CrossRef]
  27. Zeghadi, A.; Nguyen, F.; Forest, S.; Gourgues, A.F.; Bouaziz, O. Ensemble averaging stress–strain fields in polycrystalline aggregates with a constrained surface microstructure—Part 1: Anisotropic elastic behaviour. Philos. Mag. 2007, 87, 1401–1424. [Google Scholar] [CrossRef]
  28. Zeghadi, A.; Forest, S.; Gourgues, A.F.; Bouaziz, O. Ensemble averaging stress–strain fields in polycrystalline aggregates with a constrained surface microstructure—Part 2: Crystal plasticity. Philos. Mag. 2007, 87, 1425–1446. [Google Scholar] [CrossRef]
  29. Wasserbach, W. Work-Hardening and Dislocation Behaviour of Tantalum and Tantalum Alloys; The Minerals, Metals and Materials Society: Pittsburgh, PA, USA, 1996. [Google Scholar]
  30. Hosseini, E.; Kazeminezhad, M. Dislocation structure and strength evolution of heavily deformed tantalum. Int. J. Refract. Met. Hard Mater. 2009, 27, 605–610. [Google Scholar] [CrossRef]
  31. Frenois, S.; Munier, E.; Feaugas, X.; Pilvin, P. A polycrystalline model for stress-strain behaviour of tantalum at 300cK. J. De Phys. IV 2001, 11, 301–308. [Google Scholar]
  32. Norlain, M. Comportement Mécanique du Tantale, Texture et Recristallisation. Ph.D. Thesis, Mines ParisTech, Paris, France, 1999. [Google Scholar]
  33. Kerisit, C.; Logé, R.E.; Jacomet, S.; Llorca, V.; Bozzolo, N. EBSD coupled to SEM in situ annealing for assessing recrystallization and grain growth mechanisms in pure tantalum. J. Microsc. 2013, 250, 189–199. [Google Scholar] [CrossRef] [PubMed]
  34. Moussa, C.; Bernacki, M.; Besnard, R.; Bozzolo, N. About quantitative EBSD analysis of deformation and recovery substructures in pure Tantalum. IOP Conf. Ser. Mater. Sci. Eng. 2015, 89, 012038. [Google Scholar] [CrossRef]
  35. Priester, L. Grain Boundaries: From Theory to Engineering, 1st ed.; Springer Series in Materials Science 172; Springer: Dordrecht, The Netherlands, 2013. [Google Scholar]
  36. Magnin, T.; Driver, J.; Lepinoux, J.; Kubin, L. Aspects microstructuraux de la deformation cyclique dans les metaux et alliages C.C. et C.F.C. - I. Consolidation cyclique. Rev. Phys. Appl. 1984, 19, 467–482. [Google Scholar] [CrossRef] [Green Version]
  37. Le, L.T.; Ammar, K.; Forest, S. Efficient simulation of single and poly–crystal plasticity based on the pencil glide mechanism. C. R. Méc. 2020. [Google Scholar] [CrossRef]
  38. Guillaumain, J. Etude du Comportement du Tantale en Fatigue à Grand Nombre de Cycles, Document Interne CEA. 2009.
  39. VIC-3D. Correlated Solutions. 2010. Available online: www.correlatedsolutions.com (accessed on 3 March 2021).
  40. Allais, L.; Bornert, M.; Bretheau, T.; Caldemaison, D. Experimental characterization of the local strain field in a heterogeneous elastoplastic material. Acta Metall. Mater. 1994, 42, 3865–3880. [Google Scholar] [CrossRef]
  41. Doumalin, P. Microextensométrie Locale par Corrélation d’Images Numériques: Application Aux études Micromécaniques par Microscopie Électronique à Balayage. Ph.D. Thesis, Ecole Polytechnique, Palaiseau, France, 2000. [Google Scholar]
  42. Racine, A.; Bornert, M.; Sainte Catherine, C.; Caldemaison, D. Étude expérimentale des micro-mécanismes d’endommagement et de rupture des zircaloy hydrurés. J. Phys. IV Fr. 2003, 106, 109–118. [Google Scholar] [CrossRef]
  43. Bodelot, L.; Charkaluk, E.; Sabatier, L.; Dufrénoy, P. Experimental study of heterogeneities in strain and temperature fields at the microstructural level of polycrytalline metals through fully-coupled full-field measurements by Digital Image Correlation and Infrared Thermography. Mech. Mater. 2011, 43, 654–670. [Google Scholar] [CrossRef]
  44. Sutton, M.; Yan, J.; Tiwari, V.; Schreier, H.; Orteu, J. The effect of out-of-plane motion on 2D and 3D digital image correlation measurements. Opt. Lasers Eng. 2008, 46, 746–757. [Google Scholar] [CrossRef] [Green Version]
  45. Clair, A. Caractérisation Expérimentale des Propriétés Micromécaniques et Micromorphologiques des Alliages Base Nickel Contraints par la Croissance d’une Couche d’oxydes formée Dans le Milieu Primaire d’une Centrale Nucléaire. Ph.D. Thesis, Université de Bourgogne, Dijon, France, 2011. [Google Scholar]
  46. Vignal, V.; Finot, E.; Oltra, R.; Lacroute, Y.; Bourillot, E.; Dereux, A. Mappring the 3D-surface strain field of patterned tensile stainless steels using atomic force microscopy. Ultramicroscopy 2005, 103, 183–189. [Google Scholar] [CrossRef]
  47. Shi, Q.; Roux, S.; Latourte, F.; Hild, F.; Loisnard, D.; Brynaert, N. On the use of SEM correlative tools for in situ mechanical tests. Ultramicroscopy 2018, 184, 71–87. [Google Scholar] [CrossRef] [PubMed] [Green Version]
  48. Proudhon, H.; Guéninchault, N.; Forest, S.; Ludwig, W. Incipient Bulk Polycrystal Plasticity Observed by Synchrotron In-Situ Topotomography. Materials 2018, 11, 2018. [Google Scholar] [CrossRef] [Green Version]
  49. Pineau, A.; McDowell, D.L.; Busso, E.P.; Antolovich, S.D. Failure of metals II: Fatigue. Acta Mater. 2016, 107, 484–507. [Google Scholar] [CrossRef]
  50. François, F.; Pineau, A.; Zaoui, A. Mechanical Behaviour of Materials. Volume 2: Fracture Mechanics and Damage; Solid Mechanics and its Applications; Springer: Berlin/Heidelberg, Germany, 2013; Volume 191. [Google Scholar]
  51. El Bartali, A.; Aubin, V.; Degallaix, S. Surface observation and measurement techniques to study the fatigue damage micromechanisms in a duplex stainless steel. Int. J. Fatigue 2009, 31, 2049–2055. [Google Scholar] [CrossRef]
  52. Kuo, J.C.; Chen, D.; Tung, S.H.; Shih, M.H. Prediction of the orientation spread in an aluminum bicrystal during plane strain compression using a DIC-based Taylor model. Comput. Mater. Sci. 2008, 42, 564–569. [Google Scholar] [CrossRef]
  53. Clair, A.; Foucault, M.; Calonne, O. Strain mapping near a triple junction in strained Ni-based alloy using EBSD and biaxial nanogauges. Acta Mater. 2011, 59, 3116–3123. [Google Scholar] [CrossRef]
  54. Helstroffer, A. Etude en Fatigue du Tantale. Rapport de Stage Document Interne CEA. 2010. [Google Scholar]
  55. Forsyth, P. Fatigue Behaviour and Its Dependence on Microstructure; Colloque de Métallurgie de Saclay: Saclay, France, 1972. [Google Scholar]
  56. Guilhem, Y.; Basseville, S.; Curtit, F.; Stephan, J.; Cailletaud, G. Numerical investigations of the free surface effect in three-dimensional polycrystalline aggregates. Comput. Mater. Sci. 2013, 70, 150–162. [Google Scholar] [CrossRef] [Green Version]
  57. Barbe, F.; Quey, R.; Musienko, A.; Cailletaud, G. Three-dimensional characterization of strain localization bands in high-resolution elastoplastic polycrystals. Mech. Res. Commun. 2009, 36, 762–768. [Google Scholar] [CrossRef]
  58. Bouchedjra, M.; Kanit, T.; Boulemia, C.; Amrouche, A.; Belouchrani, M.E.A. Determination of the RVE size for polycrystal metals to predict monotonic and cyclic elastoplastic behavior: Statistical and numerical approach with new criteria. Eur. J. Mech. A Solids 2018, 72, 1–15. [Google Scholar] [CrossRef]
  59. Barbe, F.; Forest, S.; Cailletaud, G. Intergranular and intragranular behavior of polycrystalline aggregates. Part 2: Results. Int. J. Plast. 2001, 17, 537–563. [Google Scholar] [CrossRef]
  60. Zhang, K.S.; Ju, J.W.; Bai, Y.L.; Brocks, W. Micromechanics based fatigue life prediction of a polycrystalline metal applying crystal plasticity. Mech. Mater. 2015, 85, 16–37. [Google Scholar] [CrossRef] [Green Version]
  61. Kanit, T.; Forest, S.; Galliet, I.; Mounoury, V.; Jeulin, D. Determination of the size of the Representative Volume Element for random composites: Statistical and numerical approach. Int. J. Solids Struct. 2003, 40, 3647–3679. [Google Scholar] [CrossRef]
  62. Gérard, C.; Bacroix, B.; Bornert, M.; Cailletaud, G.; Crépin, J.; Leclercq, S. Hardening description for FCC materials under complex loading paths. Comput. Mater. Sci. 2009, 45, 751–755. [Google Scholar] [CrossRef] [Green Version]
  63. Guilhem, Y.; Basseville, S.; Curtit, F.; Stephan, J.; Cailletaud, G. Investigations of the effect of grain clusters on fatigue crack initiation in plycrystals. Int. J. Fatigue 2010, 32, 1748–1763. [Google Scholar] [CrossRef] [Green Version]
  64. Méric, L.; Cailletaud, G. Single crystal modeling for structural calculations. Part. 2: Finite element implementation. J. Eng. Mater. Technol. 1991, 113, 171–182. [Google Scholar] [CrossRef]
  65. Eyraud, V.; Nadal, M.H.; Gondard, C. Texture measurement of shaped material by impulse acoustic microscopy. Ultrasonics 2000, 38, 438–442. [Google Scholar] [CrossRef]
  66. Hoc, T.; Crépin, J.; Gélébart, L.; Zaoui, A. A procedure for identifying the plastic behavior of single crystals from the local response of polycrystals. Acta Mater. 2003, 51, 5477–5488. [Google Scholar] [CrossRef] [Green Version]
  67. Lim, H.; Carroll, J.D.; Battaile, C.C.; Buchheit, T.E.; Boyce, B.L.; Weinberger, C.R. Grain-scale experimental validation of crystal plasticity finite element simulations of tantalum oligocrystals. Int. J. Plast. 2015, 60, 1–18. [Google Scholar] [CrossRef]
  68. Z–Set Package. Non-Linear Material & Structure Analysis Suite. 2013. Available online: www.zset-software.com (accessed on 3 March 2021).
  69. Besson, J.; Cailletaud, G.; Chaboche, J.L.; Forest, S.; Blétry, M. Non–Linear Mechanics of Materials; Solid Mechanics and Its Applications 167; Springer-Verlag: Berlin/Heidelberg, Germany, 2009. [Google Scholar]
  70. Šiška, F.; Forest, S.; Gumbsch, P.; Weygand, D. Finite element simulations of the cyclic elastoplastic behavior of copper thin films. Model. Simul. Mater. Sci. Eng. 2007, 15, S217–S238. [Google Scholar] [CrossRef]
  71. Linne, M.A.; Venkataraman, A.; Sangid, M.D.; Daly, S. Grain Boundary Sliding and Slip Transmission in High Purity Aluminum. Exp. Mech. 2019, 59, 643–658. [Google Scholar] [CrossRef]
  72. Déprés, C.; Robertson, C.F.; Fivel, M.C. Low-strain fatigue in AISI 316L steel surface grains: A three-dimensional discrete dislocation dynamics modelling of the early cycles I. Dislocation microstructures and mechanical behaviour. Philos. Mag. 2004, 84, 2257–2275. [Google Scholar] [CrossRef]
  73. Lemaitre, J.; Chaboche, J.L. Mechanics of Solid Materials; University Press: Cambridge, UK, 1994. [Google Scholar]
  74. Suresh, S. Fatigue of Materials; Cambridge University Press: Cambridge, UK, 1998. [Google Scholar]
  75. Bower, A.; Johnson, K. The influence of strain hardening on cumulative plastic deformation in rolling and sliding contact. J. Mech. Phys. Solids 1989, 37, 471–493. [Google Scholar] [CrossRef]
  76. McDowell, D. Stress state dependence of cyclic ratchetting behavior of two rail steels. Int. J. Plast. 1995, 11, 397–421. [Google Scholar] [CrossRef]
  77. Zhang, M.; Neu, R.; McDowell, D. Microstructure-sensitive modelling: Application to fretting contacts. Int. J. Fatigue 2009, 31, 1397–1406. [Google Scholar] [CrossRef]
  78. Agbessi, K. Approches Expérimentales et Multi-Échelles des Processus d’amorçage des Fissures de Fatigue sous Chargements Complexes. Ph.D. Thesis, Ecole Nationale Supérieure d’Arts et Métiers, Bordeaux, France, 2013. [Google Scholar]
  79. Li, J.; Proudhon, H.; Roos, A.; Chiaruttini, V.; Forest, S. Crystal plasticity finite element simulation of crack growth in single crystals. Comput. Mater. Sci. 2014, 90, 191–197. [Google Scholar] [CrossRef]
  80. Proudhon, H.; Li, J.; Wang, F.; Roos, A.; Chiaruttini, V.; Forest, S. 3D simulation of short fatigue crack propagation by finite element crystal plasticity and remeshing. Int. J. Fatigue 2016, 82, 238–246. [Google Scholar] [CrossRef]
  81. Nadal, F. Résistance en Fatigue du Tantale. Document Interne CEA. 2011. [Google Scholar]
  82. Fleury, E.; Rémy, L. Low cycle fatigue damage in nickel-base superalloy single crystals at elevated temperature. Mater. Sci. Eng. A 1993, 167, 23–30. [Google Scholar] [CrossRef]
  83. Bathias, C.; Pineau, A. La Fatigue des Matériaux et des Structures, 1st ed.; Hermès Science: Paris, France, 2008. [Google Scholar]
  84. Lebensohn, R.A.; Brenner, R.; Castelnau, O.; Rollett, A.D. Orientation image-based micromechanical modelling of subgrain texture evolution in polycrystalline copper. Acta Mater. 2008, 56, 3914–3926. [Google Scholar] [CrossRef]
  85. Ren, X.; Yang, S.; Wen, G.; Zhao, W. A Crystal-Plasticity Cyclic Constitutive Model for the Ratchetting of Polycrystalline Material Considering Dislocation Substructures. Acta Mech. Sin. 2020, 33, 268–280. [Google Scholar] [CrossRef]
  86. Aslan, O.; Quilici, S.; Forest, S. Numerical modeling of fatigue crack growth in single crystals based on microdamage theory. Int. J. Damage Mech. 2011, 20, 681–705. [Google Scholar] [CrossRef]
  87. Lindroos, M.; Laukkanen, A.; Andersson, T.; Vaara, J.; Mäntylä, A.; Frondelius, T. Micromechanical modeling of short crack nucleation and growth in high cycle fatigue of martensitic microstructures. Comput. Mater. Sci. 2019, 170, 109185. [Google Scholar] [CrossRef]
  88. Mareau, C. A non-local damage model for the fatigue behaviour of metallic polycrystals. Philos. Mag. 2020, 100, 955–981. [Google Scholar] [CrossRef]
Figure 1. EBSD map of tantalum polycrystal over a large area in the center of a sample.
Metals 11 00416 g001
Figure 2. (a) Direct <100> pole figure and (b) inverse pole figure of tantalum over a large zone in the center of a sample.
Metals 11 00416 g002
Figure 3. Roughening of a 400 × 400 μ m 2 zone at the surface for several cycles during a fatigue test at ± 0.2 % and ε ˙ = 10 3 s 1 . Loading direction is horizontal. The small dots of the deposited grid are visible on the SEM pictures. The upper left bar is 100 μ m long.
Metals 11 00416 g003
Figure 4. Local residual strain evolution during a fatigue test at ± 0.2 % and ε ˙ = 10 3 s 1 : (a) After 100 cycles, (b) 1000 cycles, (c) 2000 cycles, and (d) 3000 cycles. Loading direction is horizontal (direction 2). The picture size is 400 × 400 μ m 2 .
Metals 11 00416 g004
Figure 5. Evolution of the lattice orientation spreading (GOS) per grain with increasing cycle numbers. The loading direction is horizontal.
Metals 11 00416 g005aMetals 11 00416 g005b
Figure 6. Strain histograms for a fatigue test at ± 0.2 % . (a) ε 11 , (b) ε 12 , and (c) ε 22 at the surface. The histograms are given after 10, 1000, 2000, and 3000 cycles.
Metals 11 00416 g006
Figure 7. Pictures of the surface after 5000 cycles at ± 0.2 % and ε ˙ = 10 3 s 1 . They illustrate the occurrence of grain boundary sliding (top left), intragranular cracks (top), and intergranular cracks (bottom).
Metals 11 00416 g007
Figure 8. Synthetic semi-periodic aggregate made of 250 grains: general view (top left), free surface (top right), and view through the thickness (bottom), after the work in [17].
Metals 11 00416 g008
Figure 9. Macroscopic stress-strain loops of the cyclic test on the studied polycrystalline aggregate, as predicted by the CPFEM simulation.
Metals 11 00416 g009
Figure 10. Simulation of a cyclic test at ± 0.2 % . Evolution of the strain component ε 22 at (a) cycle 66, (b) cycle 666, and (c) cycle 1066 at the free surface (top) and at two mid-sections perpendicular to directions 3 (middle) and 2 (bottom). The loading direction 2 is vertical for the top and middle pictures.
Metals 11 00416 g010
Figure 11. Simulation of a cyclic test at ± 0.2 % . Evolution of the strain component ε 11 at (a) cycle 66, (b) cycle 666, and (c) cycle 1066 at the free surface (top) and at two mid-sections perpendicular to directions 3 (middle) and 2 (bottom). The loading direction 2 is vertical for the top and middle pictures.
Metals 11 00416 g011
Figure 12. Simulation of a cyclic test at ± 0.2 % . Evolution of the strain component ε 12 at (a) cycle 66, (b) cycle 666, and (c) cycle 1066 at the free surface (top) and at two mid-sections perpendicular to directions 3 (middle) and 2 (bottom). The loading direction 2 is vertical for the top and middle pictures.
Metals 11 00416 g012
Figure 13. Fields of the displacement component in the direction 3 at the free surface showing the evolution of surface rougness with cycle numbers. Displacement in mm, to be compared to the specimen thickness used in the FE simulation, namely, 0.5 mm.
Metals 11 00416 g013
Figure 14. Total slip evolution s | γ s | for several cycles during a fatigue test simulation at ± 0.2 % .
Metals 11 00416 g014
Figure 15. Selected nodes for the local study, after the work in [17].
Metals 11 00416 g015
Figure 16. Strain loops σ 22 ε 22 for the six nodes defined in Figure 15 at several cycle numbers: (a) cycle 1, (b) cycle 66, (c) cycle 466, and (d) cycle 1066.
Metals 11 00416 g016
Figure 17. Local curves σ 11 ε 11 for several cycles at 6 different finite element nodes, after the work in [17].
Metals 11 00416 g017
Figure 18. Prediction of cycle numbers to crack initiation per element for the fatigue test simulation at ±0.2%: (a) surface prediction and (b) half thickness prediction.
Metals 11 00416 g018
Figure 19. Histogram of cycle numbers for crack initiation for the whole aggregate at ±0.2%.
Metals 11 00416 g019
Table 1. Parameter values of the single crystal model identified for tantalum at room temperature, after the work in [17].
v ˙ 0 5 × 10 5  s 1 c 1 360 × 10 3  MPa
σ 0 5 MPa D 1 8000
r 0 0 MPa C 2 250 MPa
Q1 MPa D 2 1.5
b 1.5 h r s 1
Publisher’s Note: MDPI stays neutral with regard to jurisdictional claims in published maps and institutional affiliations.

