Article

Stretch Forming Behavior and Constitutive Equation of a Modified 5083 Alloy with High Mg Content at Elevated Temperatures

1
Advanced Materials and Process R&D Department, Korea Institute of Industrial Technology, Incheon 21999, Korea
2
Department of Advanced Materials Science and Engineering, Sungkyunkwan University, Suwon 16419, Korea
*
Authors to whom correspondence should be addressed.
Metals 2021, 11(3), 410; https://doi.org/10.3390/met11030410
Submission received: 8 February 2021 / Revised: 24 February 2021 / Accepted: 24 February 2021 / Published: 3 March 2021

Abstract

:
For the purpose of applying a modified 5083 alloy (New 5083M alloy) with high Mg content in various automotive sheet parts, the stretch forming behavior of the 5083M alloy was studied in tensile mode at a wide range of processing conditions. The tensile tests were conducted by using a tensile test machine under the temperature ranges of 100–400 °C and the strain rate ranges of 0.001–1 s−1. The test results showed that the 5083M alloy has superior mechanical properties to that of the commercial 5083 alloy at elevated temperatures. The microstructure before and after the stretch forming was analyzed using optical microscope (OM) equipped with a polarizing filter and electron backscattered diffraction (EBSD) unit. Deformed microstructure was observed under low temperature conditions and dynamic recrystallized microstructure under high temperature conditions. However, regardless of microstructure evolution, developed deformation textures were distributed in orientation distribution functions (ODF) images. In addition, at high temperature and low strain rate condition, complex shaped cavities which were detrimental to mechanical properties appeared at the grain boundary and grain triple junction. Based on the test results data, a constitutive equation predicting the deformation behavior of the 5083M alloy was derived. The calculated curves by the constitutive equation were compared with the measured curves by experiment and agreed well.

1. Introduction

In recent years, due to the stringent regulations in weight reduction of automotive and the rapid growth of the electric vehicle market, the demand for aluminum alloy sheet is drastically increasing. Aluminum alloys used as structural sheet parts in automotive are mainly 5xxx and 6xxx series alloys. Among them, 5xxx series alloy (Al-Mg alloy) has good mechanical properties, formability, corrosion resistance, and weldability. Therefore, this alloy has usually been used as body-in-white and door-inner panel requiring complex shape [1,2].
One of the main strengthening mechanisms of 5xxx series alloy is solid solution hardening with Mg element [2]. Therefore, if Mg content increases, mechanical properties are improved. Unfortunately, because of the severe oxidation tendency of Mg, which reduces the quality of molten metal during casting, Mg content has been limited to 4.9% or less in commercial 5xxx series alloys. According to a recent study, however, the use of Mg + Al2Ca master alloy in the casting process is effective in reducing oxidation of Mg [3,4,5]. Thanks to this, research on Al-xMg (x > 4.9%) alloys having superior mechanical properties has been actively conducted.
Among the major alloying elements, addition of Mg lowers the stacking fault energy (SFE) of aluminum [6]. Therefore, 5xxx series alloys have lower SFE than pure aluminum. It is generally known that in order to increase strength, a decrease in ductility is inevitable. However, if the SFE is lowered, the deformation mechanism changes from cross-slip to operation of the slip system by dislocation pile-up as the distance between partial dislocations increases [7,8]. Therefore, strength and ductility, which have negative correlation with each other, tend to increase simultaneously. This phenomenon also contributes to better mechanical properties of Al-xMg (x > 4.9%) alloys than that of commercial 5xxx series alloys. In addition, change of SFE has an effect on the recrystallization behavior [9]. In the case of alloys with high SFE, mainly dynamic recovery occurs as dynamic restoration mechanism, but when SFE is lowered, dynamic recrystallization is more dominant. As a result, the addition of more Mg affects not only the mechanical properties but also the microstructure evolution.
One of the important characteristics for using 5xxx series alloys as automotive sheet parts is formability. In general, cold forming of 5xxx series alloys is known to be more difficult than that of steel alloys because of poor plasticity and severe springback at room temperature. To overcome this, research has been focused on forming processes at elevated temperatures. In this forming environment, 5xxx series alloys exhibit improved formability and reduced springback [10,11,12,13].
Until now, there has been a lot of research on forming 5xxx series alloys at elevated temperatures, but most of them have studied the deformation behavior in compression mode. However, since sheet forming and deformation in the tensile mode show similar behavior, tensile tests are often used to predict the sheet formability [14,15,16]. Additionally, the factors (e.g., strain hardening index and strain rate sensitivity exponent), which are known as having a substantial effect on sheet formability, can be obtained from tensile test results. Unfortunately, although there are several studies conducted in the tensile mode, those focused on the superplasticity of 5xxx series alloys with fine grain structure. Consequently, studies on the stretch forming behavior of 5xxx series alloys in tensile mode for commercial grade sheet are needed.
In this article, the stretch forming behavior of Al-xMg (x > 4.9%) alloys was studied in tensile mode for application to various parts of automotive production. This alloy was named as the modified 5083 alloy (5083M alloy) from the 5083 alloy which has the highest Mg content among 5xxx series alloys. Tensile tests are conducted under temperature conditions of 100–400 °C and strain rate conditions of 0.001–1 s−1. In order to confirm the superior mechanical properties of the 5083M alloy, tensile test results were compared with those previously reported for the commercial 5083 alloy. Additionally, microstructure evolution under a wide range of forming conditions was analyzed through optical microscope (OM) and electron backscattered diffraction (EBSD) machine. Finally, for the purpose of applying it to a variety of simulations, a constitutive equation that can predict the deformation behavior of the 5083M alloy was derived from tensile test results data [17].

2. Materials and Methods

Table 1 showed the chemical compositions of the 5083M alloy with the commercial 5083 alloy. The slab of 5083M alloy was cast using high-purity aluminum ingot, Mg master alloy including Al2Ca, which was used for inhibiting Mg oxidation for the quality of molten metal, and Al-Ti mother alloy with induction furnace in the laboratory [18,19]. The slab was homogenized at 430 °C for 24 h to eliminate segregation. Hot rolling was performed from 20 to 8 mm (reduction ratio = 60%) at 430 °C, followed by cold rolling from 8 to 2.8 mm in thickness (reduction ratio = 65%). The roll diameter of the rolling machine was 162 mm and roll speed was 1.7 mpm.
Tensile test specimens with a gauge length of 8 mm, 3 mm in width, and 2.8 mm in thickness were machined along the rolling direction of the 5083M alloy sheet. The gauge length was chosen to be 8 mm to prevent the specimen from going out of the heating zone of the chamber due to high elongation under high temperature conditions. Figure 1 displays the geometry of the tensile test specimen. Tensile tests were carried out by a Shimadzu universal testing machine (AGS-X Series, Shimadzu co., Japan) equipped with an environmental chamber. Test temperatures were selected as 100, 200, 300, and 400 °C. The strain rate conditions were chosen as 0.001, 0.01, 0.1, and 1 s−1 considering quick-plastic forming (0.001–0.1 s−1) and hot stamping (0.1 s−1 or more) process among the sheet forming processes of aluminum alloy [1]. Each condition was tested three times. After the chamber reached the test temperature, the specimen was held isothermally for 20 min in the chamber before the test. The original raw engineering stress–strain data was processed to true stress–strain data for calculating the constitutive equation.
The tested specimen was cut near the gauge section and TD plane was mechanically ground by SiC paper. For observing grain shape and size distribution, the polished specimen was electrolytic etched with Barker’s reagent (5 mL HBF4, 200 mL distilled water) at 25 V for 90 s and observed using OM (MA200, Nikon, Japan) equipped with a polarizing filter. For analyzing inverse pole figure (IPF) map and texture, the polished specimen was electro-polished in solution (2% perchloric acid, 98% ethanol) at −15 °C and 25 V for 15 s using Lectropol-5 electro-polishing machine (Struers, Copenhagen, Denmark). In addition, the polished specimen was etched with Keller etchant (95 mL H2O, 2.5 mL HNO3, 1.5 mL HCl, 0.5 mL HF) for 60 s to observe the shape and distribution of the cavities that appeared during the tests. Furthermore, the etched specimen was observed through QUANTA 200F FE-SEM (FEI, Hillsboro, OR, USA) with EDAX Hikari EBSD detector. Obtained EBSD data was analyzed using EDAX OIM Analysis software.

3. Results and Discussion

3.1. Mechanical Properties

3.1.1. Stress–Strain Curves of the 5083M Alloy in Tension Mode

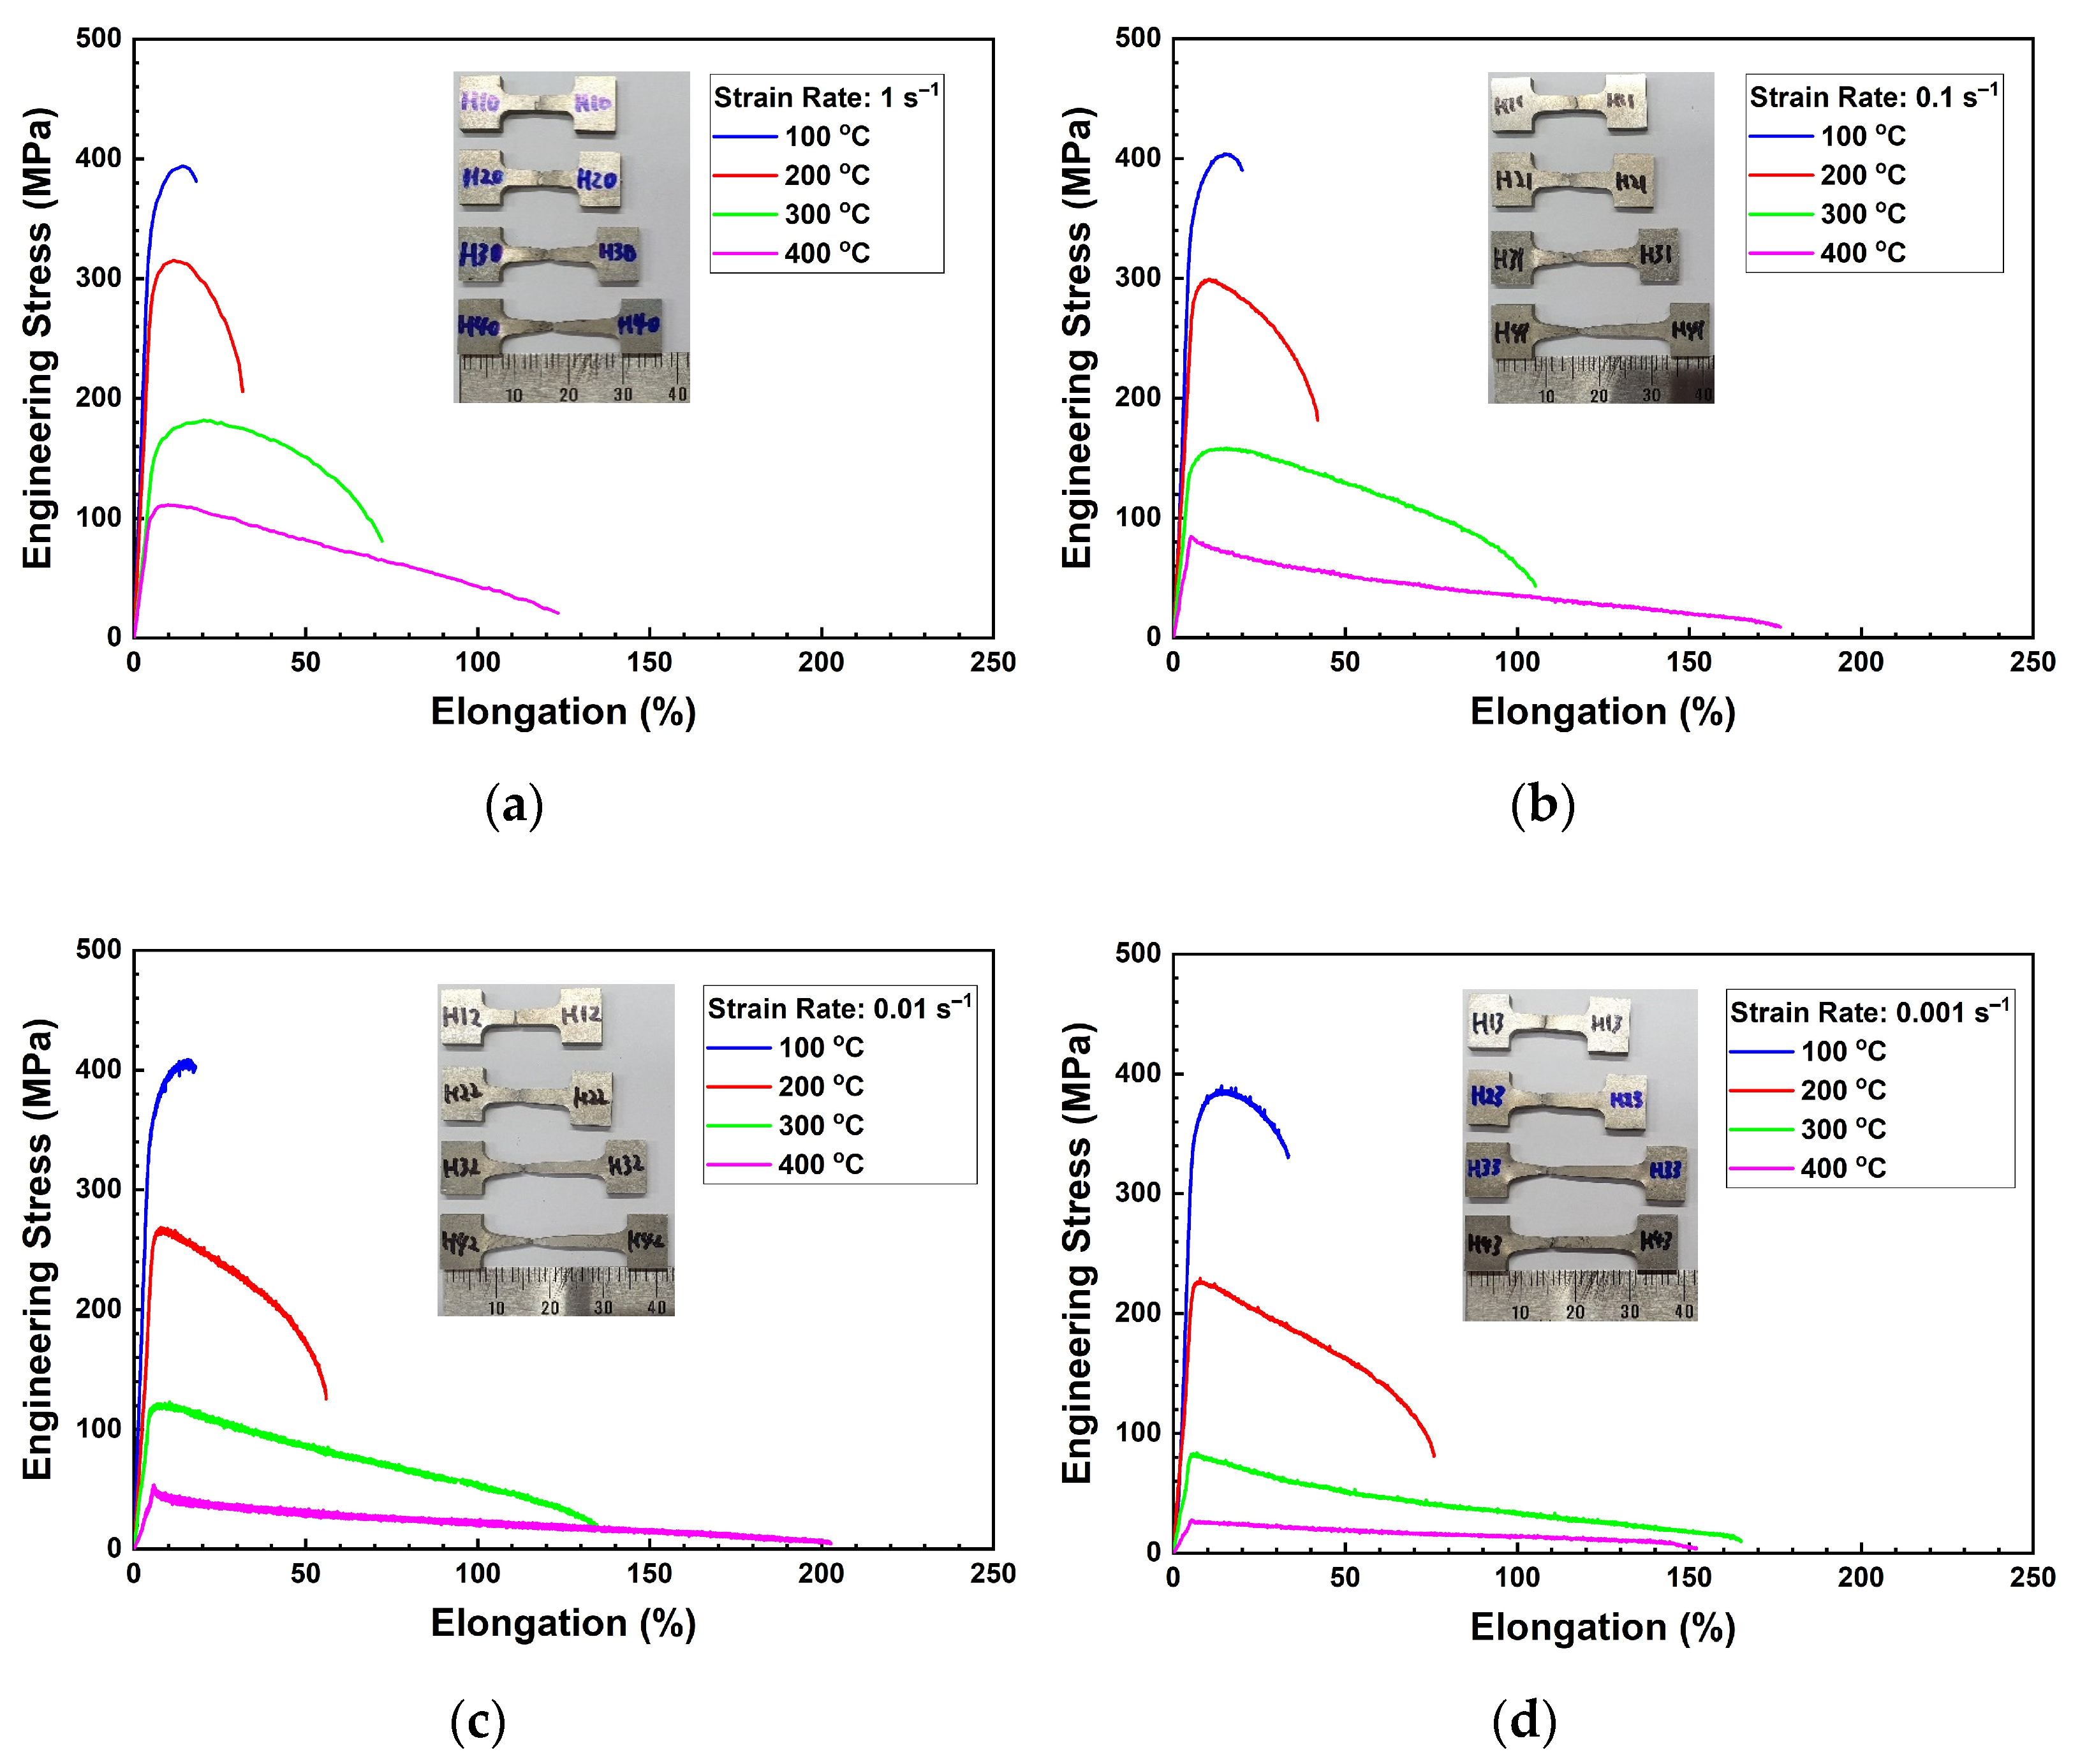
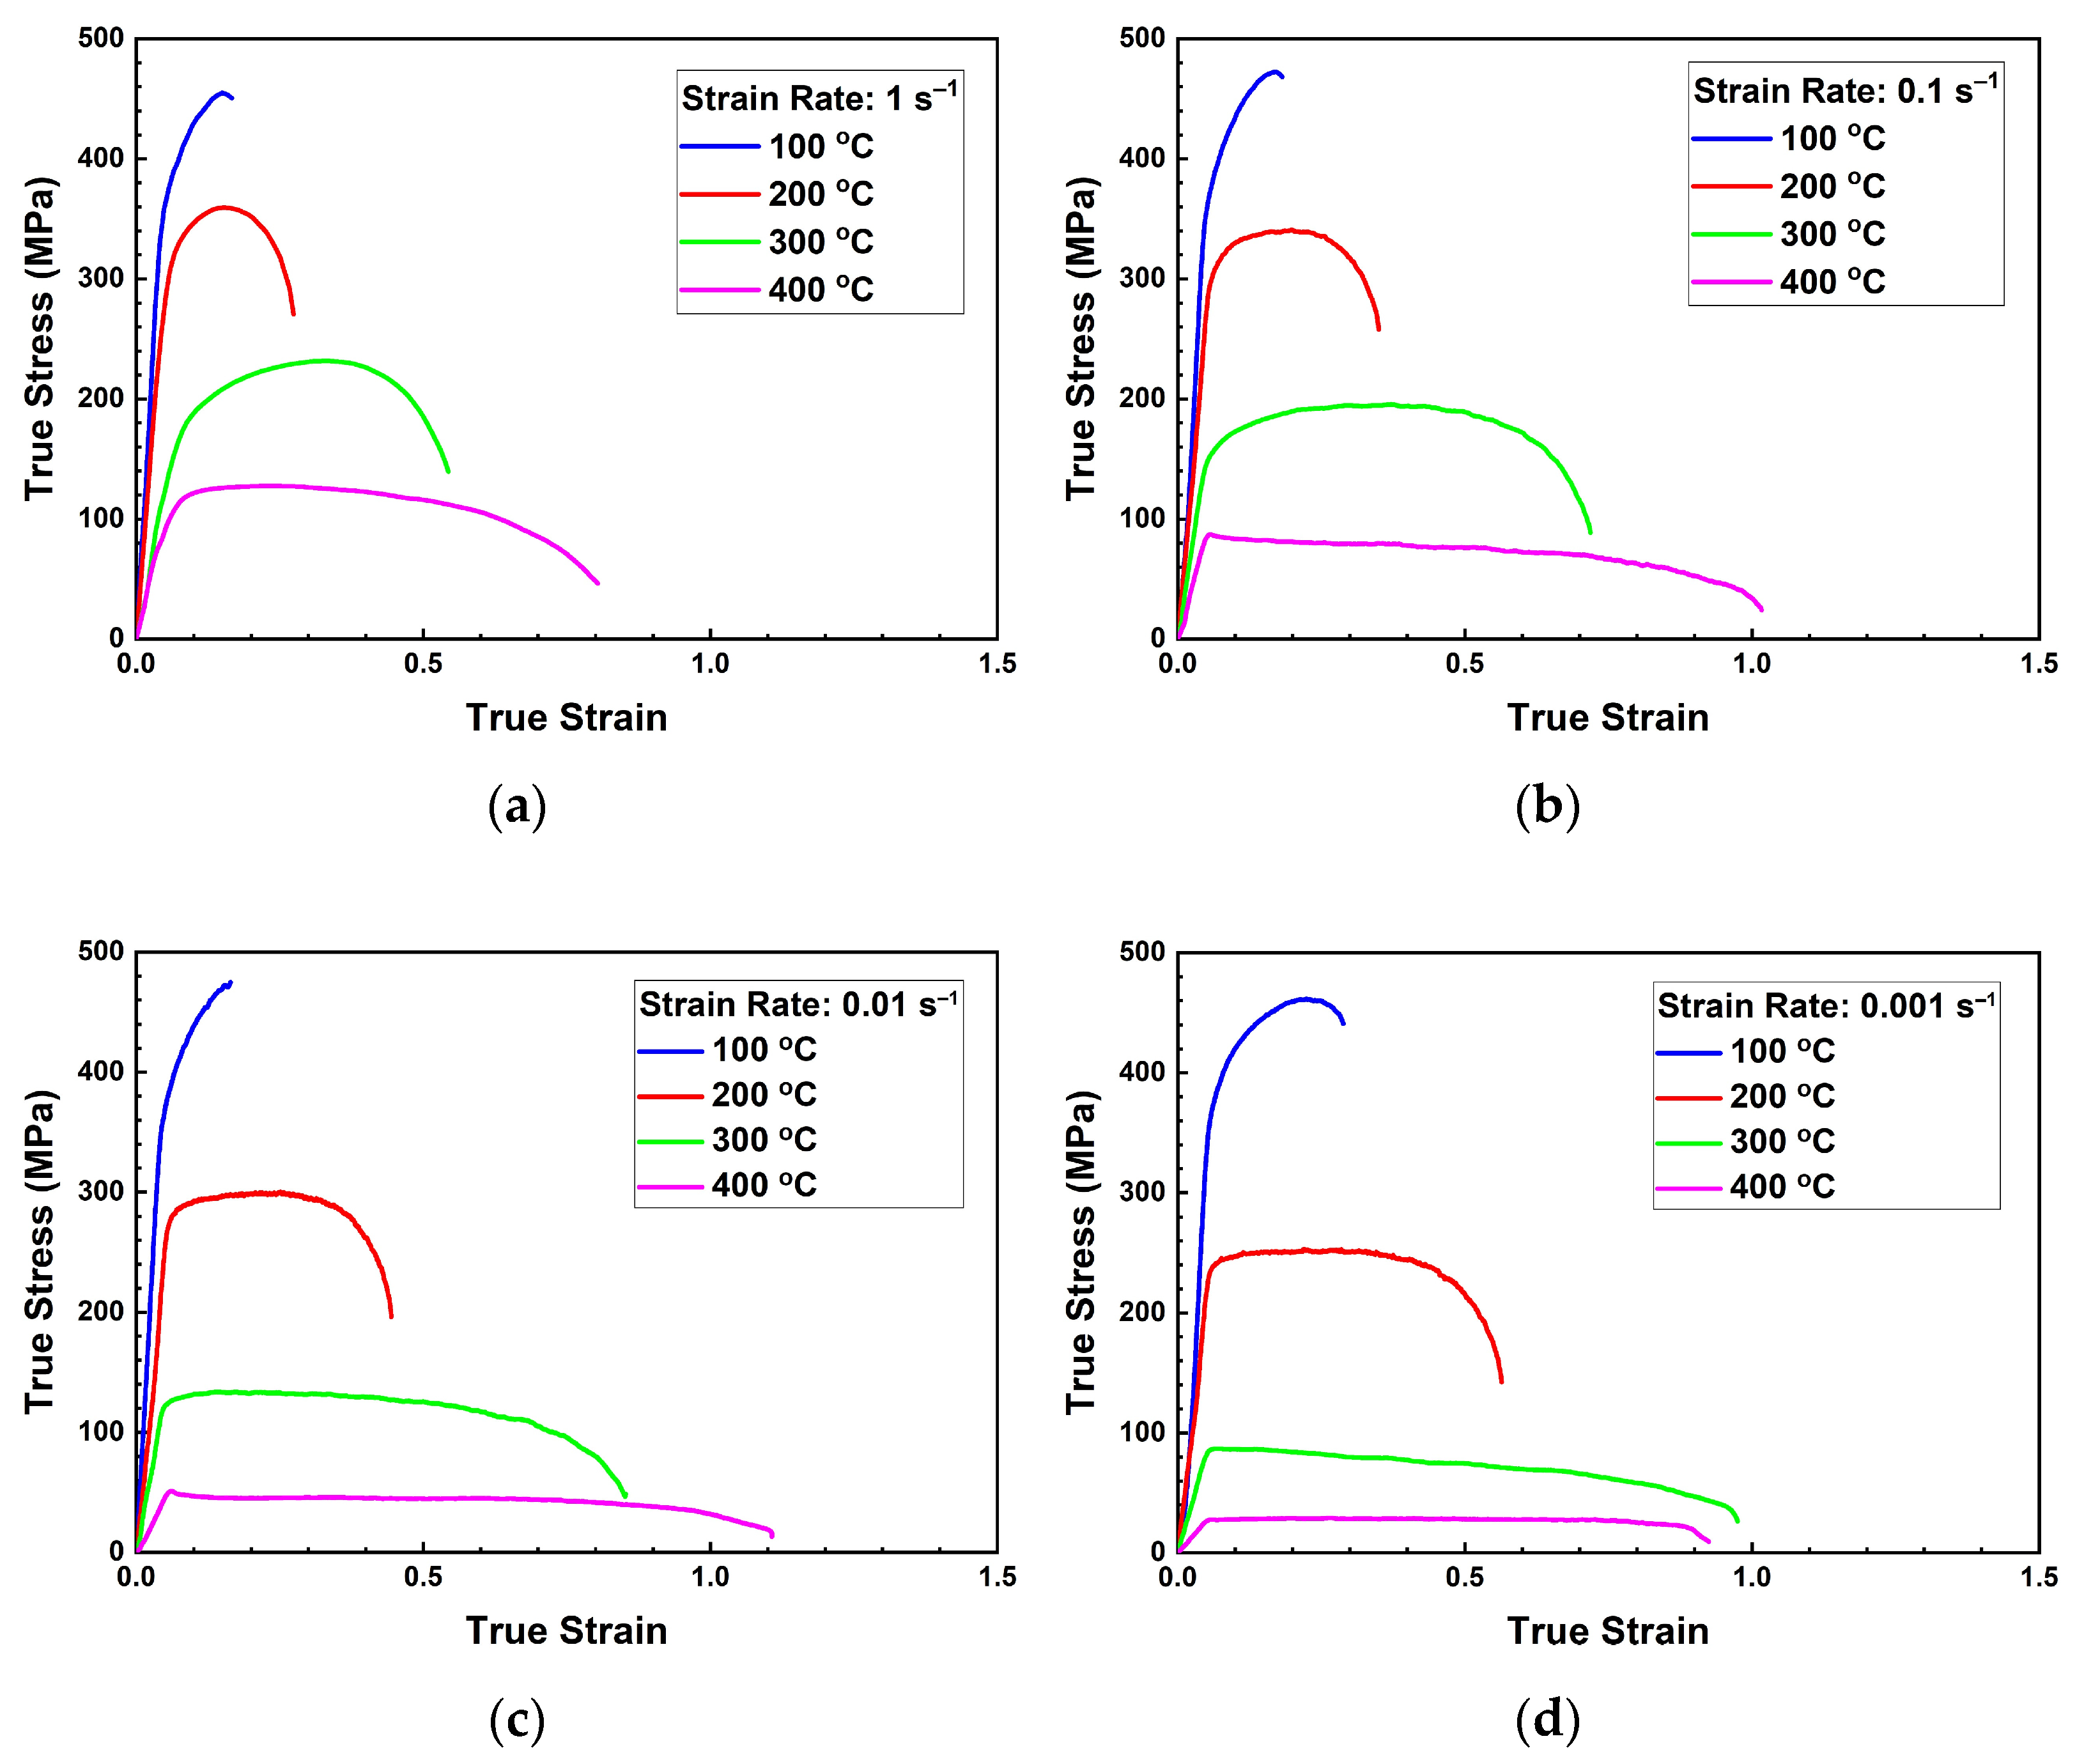
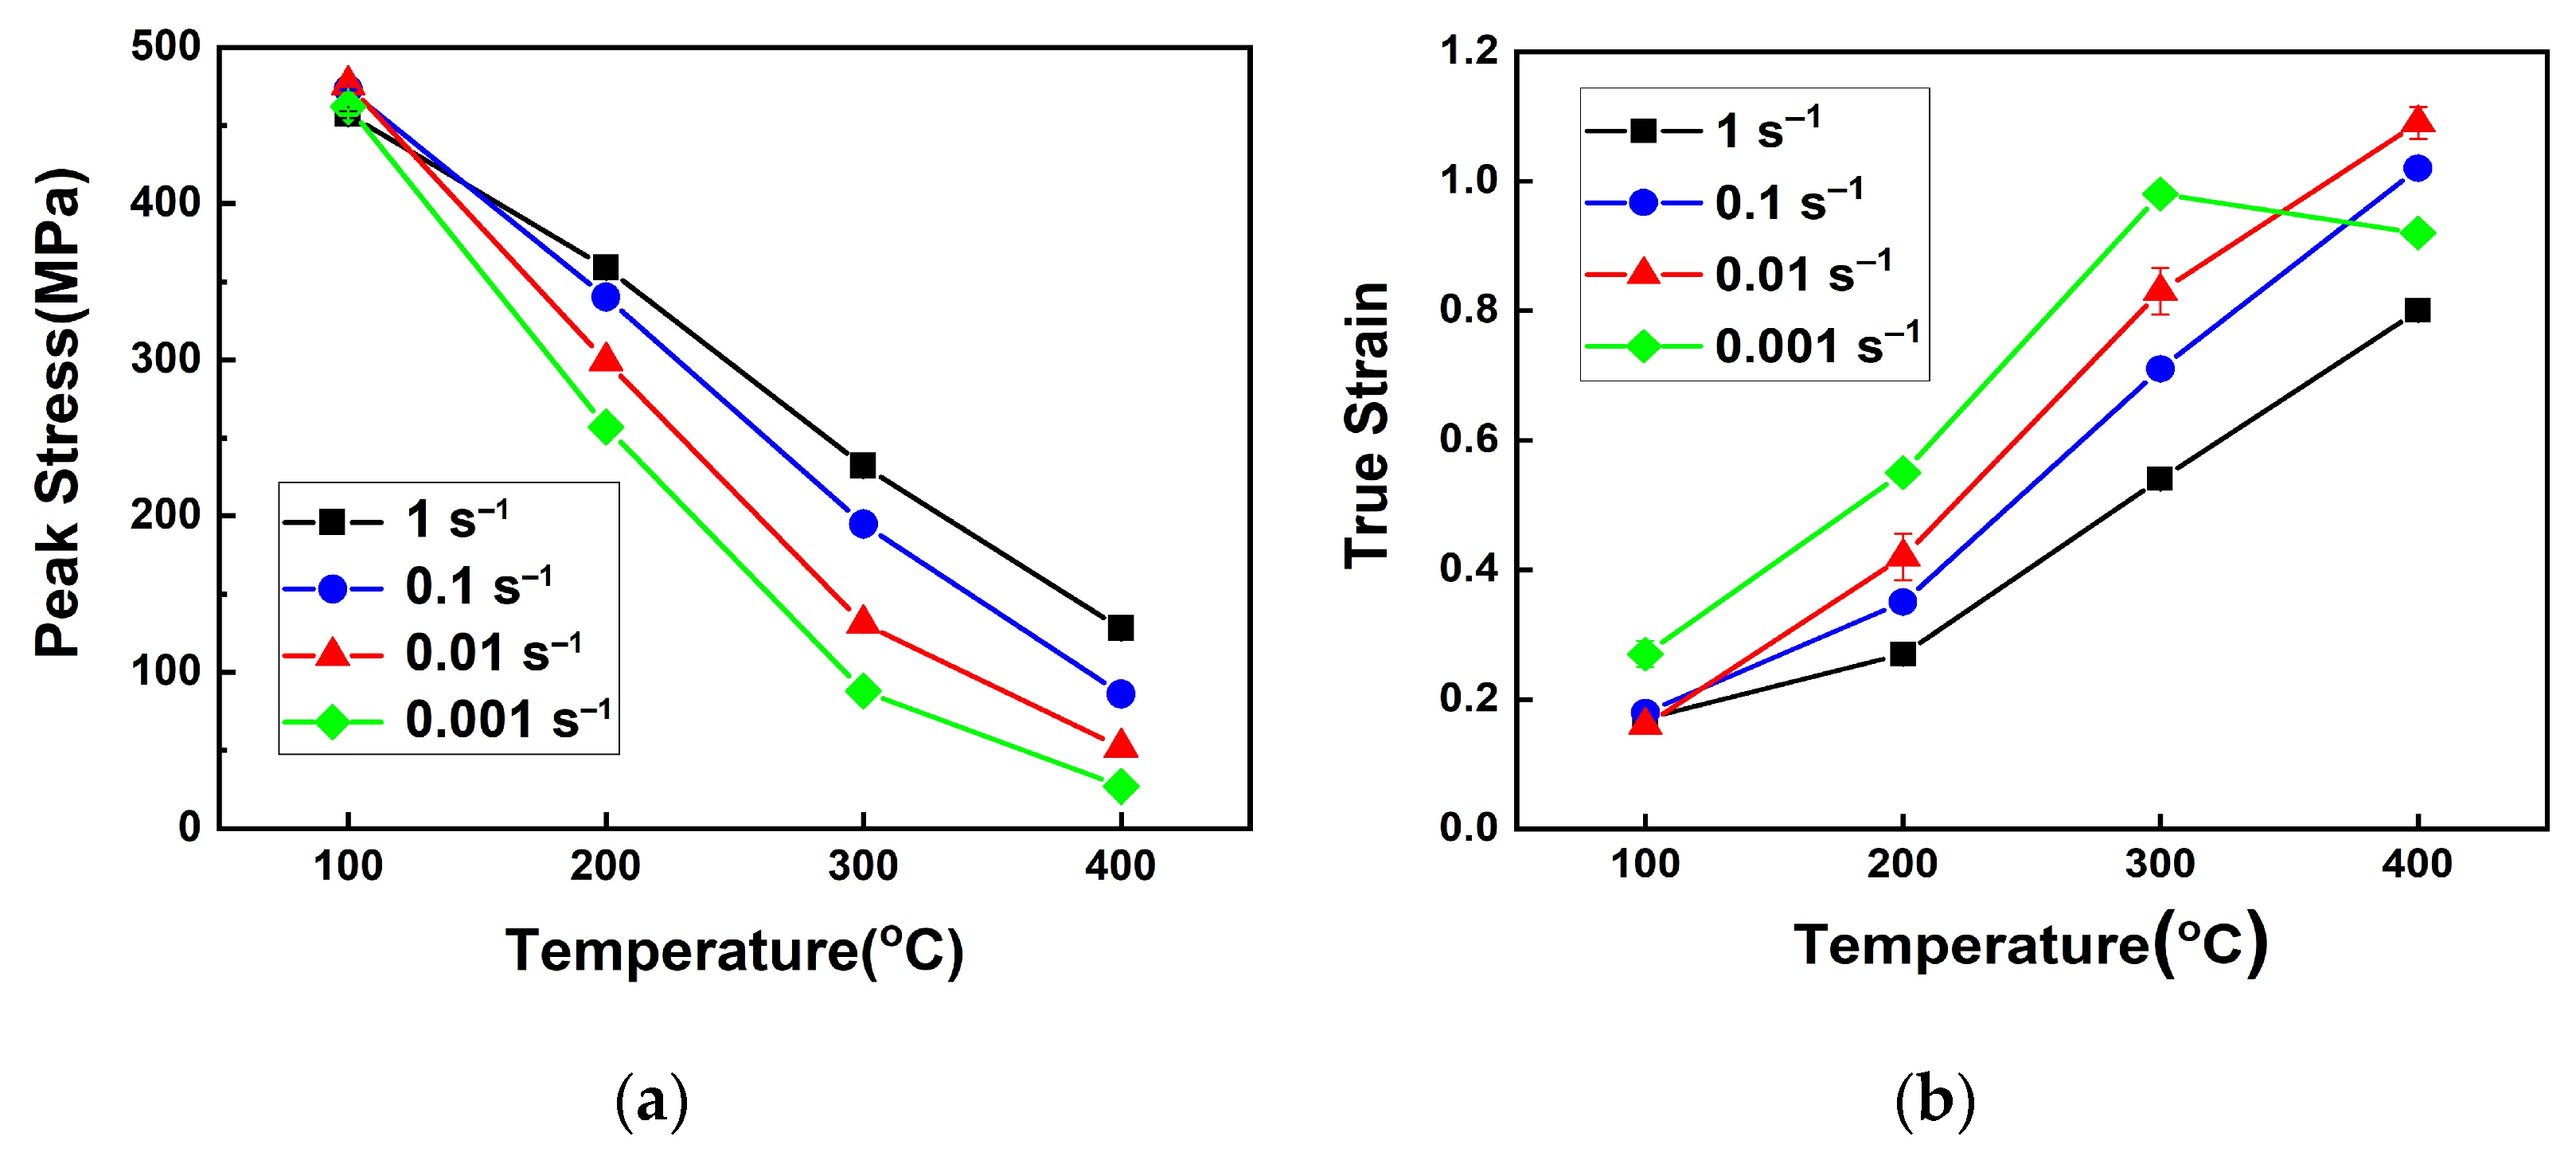
Figure 2 shows the engineering stress–strain curves of the 5083M alloy for the tensile tests at the range of temperature of 100–400 °C and strain rate of 0.001–1 s−1. The true stress–strain curves given in Figure 3 were calculated from the engineering stress–strain data. From Figure 3, it can be seen that the deformation behavior of the 5083M alloy is sensitive to temperature and strain rate conditions. The deformation behavior at elevated temperature is complicated because the strain hardening effect due to the increase in dislocation density and the softening effect due to the dynamic restoration act in combination. At low temperature and high strain rate conditions, where the strain hardening effect is dominant, dislocation multiplication is faster than dislocation annihilation. Therefore, the strain hardening region was observed before the peak stress point. At intermediate temperature and strain rate conditions where the strain hardening effect and the softening effect are balanced, dislocation multiplication and dislocation annihilation occur at the same rate [20]. Therefore, the steady-state region where the stress is constant as the true strain increases appeared in the true stress–strain curves. At high temperature and low strain rate conditions where the softening effect is dominant, the softening region appeared immediately after the elastic deformation region. This is because not only is dislocation annihilation faster than dislocation multiplication, but dynamic recrystallization where the microstructure changes to remove accumulated energy also occurs. Figure 4 exhibits the effect of temperature and strain rate on peak stress and true strain more simply. From this, it can be seen that the increase in temperature decreases the peak stress and increases the true strain. This is because an increase in temperature increases the mobility of the dislocations, vacancies, and grain boundaries [17]. Additionally, the driving force of dynamic recrystallization increases with increasing temperature. On the other hand, increasing the strain rate increases the peak stress and decreases the true strain. This is because, under high strain rate conditions, the time for the material to deform is short and there is not enough time for the dynamic restoration to occur. Unlike the overall trend, however, it was noted that true strain only decreased under 400 °C and 0.001 s−1 condition. As detailed in Section 3.2.2, this is because defects caused under high temperature and low strain rate conditions appeared at grain boundary and grain triple junction during deformation.

3.1.2. Comparison with the Commercial 5083 Alloy

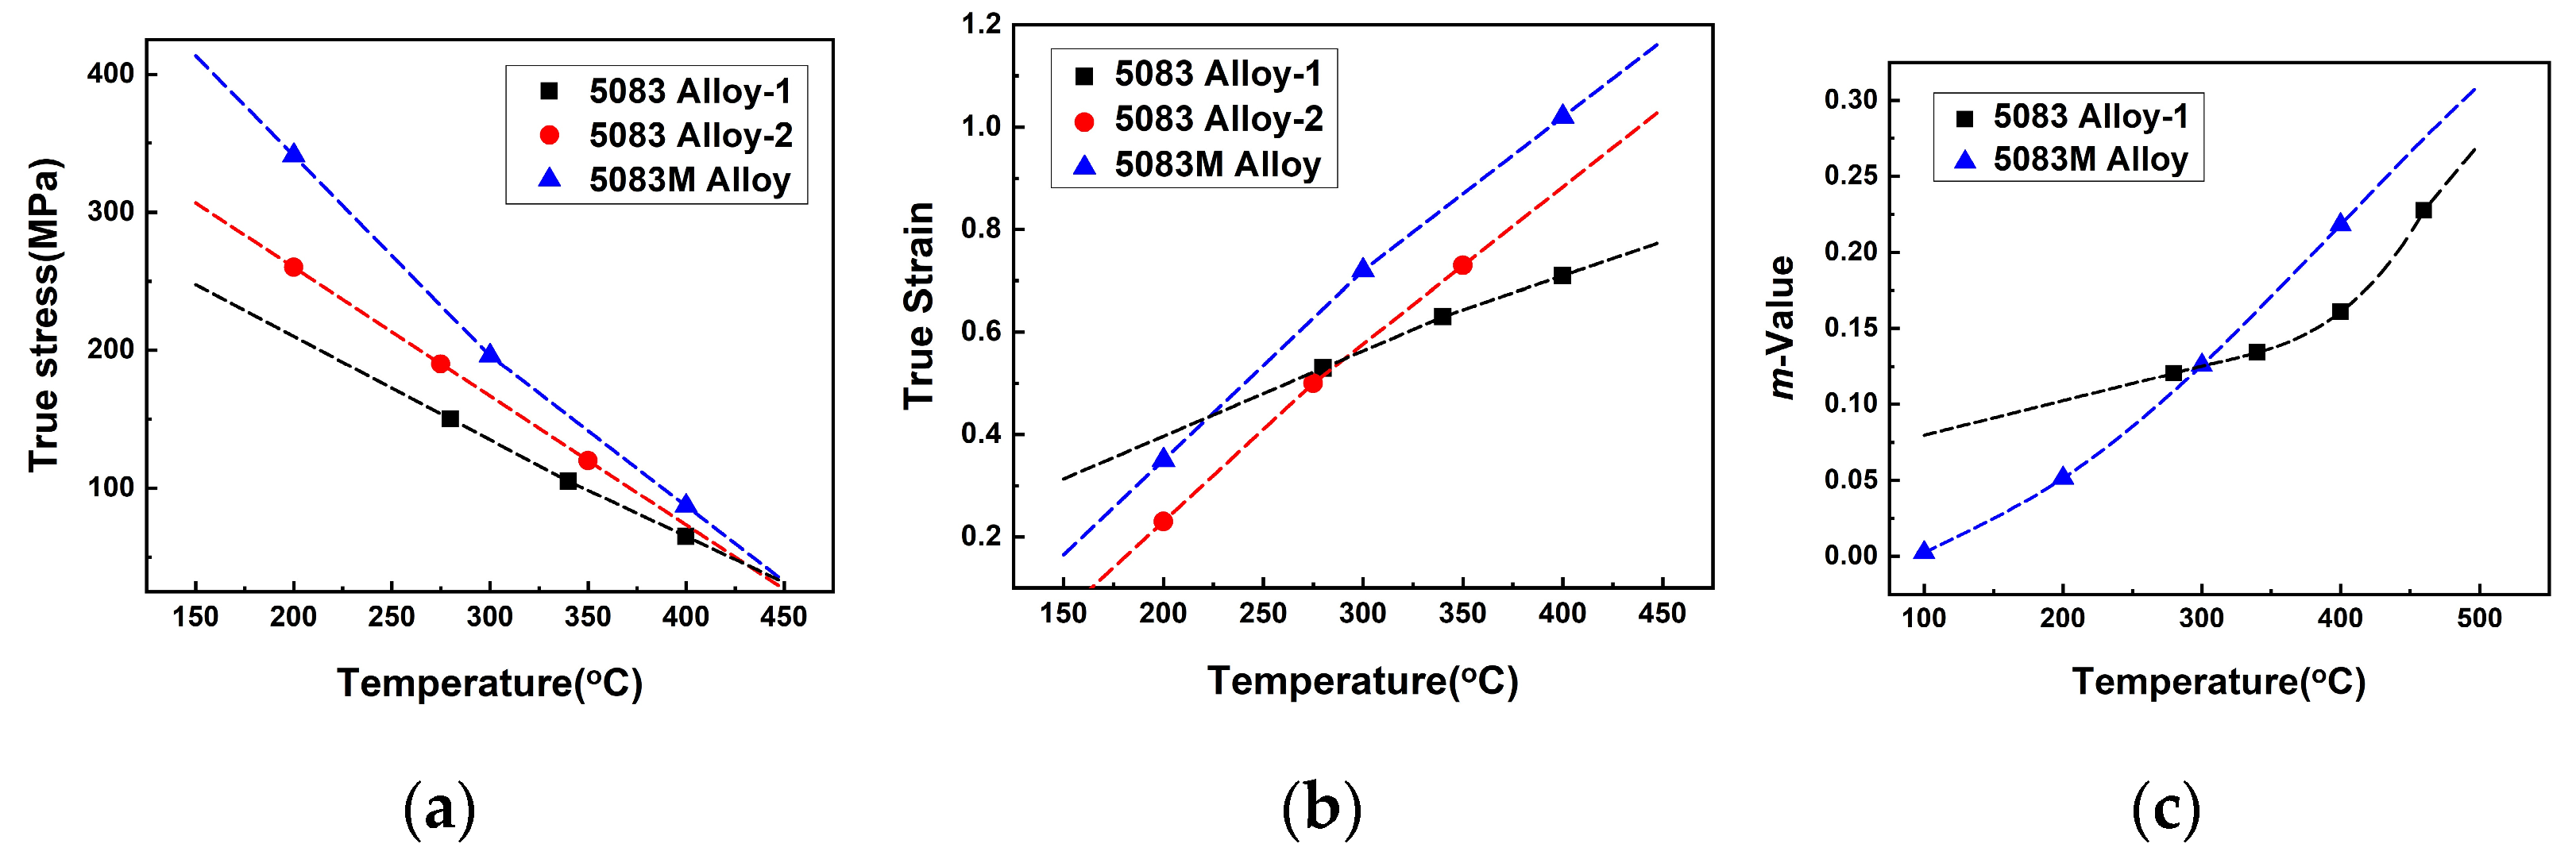
Figure 5 shows true stress, true strain, and strain rate sensitivity exponents of the 5083M alloy and the commercial 5083 alloys cited in the literature [21,22]. The compared commercial 5083 alloys were selected from commercially available sheets produced in the mass production process. In order to show the mechanical properties level of the 5083M alloy at elevated temperature, it was compared with that of the commercial 5083 alloys. The 5083 alloy is one of the representative 5xxx series alloys and has good mechanical properties among 5xxx series alloys because its Mg content is as high as about 4.9%. Through Figure 5a,b, it can be seen that at elevated temperature, the 5083M alloy shows better mechanical properties than the commercial 5083 alloys in both true stress and true strain. As mentioned in the introduction, it is due to the effect of the stacking fault energy (SFE) as well as the solid-solution hardening. As more and more magnesium is added to aluminum, the SFE of aluminum alloy becomes lower and lower. As the SFE is lowered, the distance between the partial dislocations decomposed from the perfect dislocation increases. This phenomenon makes it difficult for cross slip to occur. Therefore, plastic deformation occurs not by cross slip, but by the operation of the slip system caused by dislocation pile-up. For this reason, when the SFE of the alloy is lowered, not only the strength increases, but also the ductility increases due to the improved potential of uniform deformation [8]. Strain rate sensitivity component (m) of two alloys under the various temperature conditions is compared in Figure 5c (The process of determining the m value of the 5083M alloy will be discussed later in Section 3.3.2). m is an index showing how much a material can resist necking, so it is one of the important material parameters that enables prediction of the formability of a material [23,24]. The graphs showed that the 5083M alloy had a higher m-value at temperatures above 300 °C. This means that the 5083M alloy may have better formability than the commercial 5083 alloy under high temperature conditions. In the case of conditions below 300 °C, however, there are no m-values for the commercial 5083 alloy measured around 100 and 200 °C. Therefore, additional data is required for accurate comparison.

3.2. Metallurgical Evolution

3.2.1. Microstructure of the 5083M Alloy

Figure 6 displays the microstructure of as-cold rolled 5083M alloy before the stretch forming. The optical image shows typical deformed grain structure of as-cold rolled sheet. Elliptical grains were elongated in the rolling direction and subgrain structure like deformation band was observed inside many grains. In addition, there were shear bands which were inclined in the rolling direction and passing through some grains, indicating that the 5083M alloy was severely plastic deformed.
The microstructure photographs taken near the gauge section of tested specimens under the strain rate of 0.001 s−1 and the temperature range of temperature of 100–400 °C are given in Figure 7a–d. Under 100 °C and 200 °C conditions (Figure 7a,b), elliptical grains appeared as in Figure 6, indicating that deformed grain structure remained. The microstructure of 100 °C condition was similar to that of as-cold rolled 5083M alloy in terms of grain size and shape. Under the 200 °C condition, grains were more elongated in the rolling direction. Under 300 °C and 400 °C conditions (Figure 7c,d), however, equiaxed grains were observed instead of elliptical grains. Under 300 °C condition, the microstructure consisted of fine equiaxed grains (~10 μm), which means that dynamic recrystallization occurred during stretch forming. Additionally, it is shown that the vestiges of elliptical grains partially remained as a string of equiaxed grains of similar color. Likewise, equiaxed grains were observed under the 400 °C condition, but the grain size was much larger than that of the 300 °C condition. Through these microstructure photographs, it can be seen that dynamic recrystallization of the 5083M alloy started around the 300 °C condition and grain growth after dynamic recrystallization occurred around the 400 °C condition.
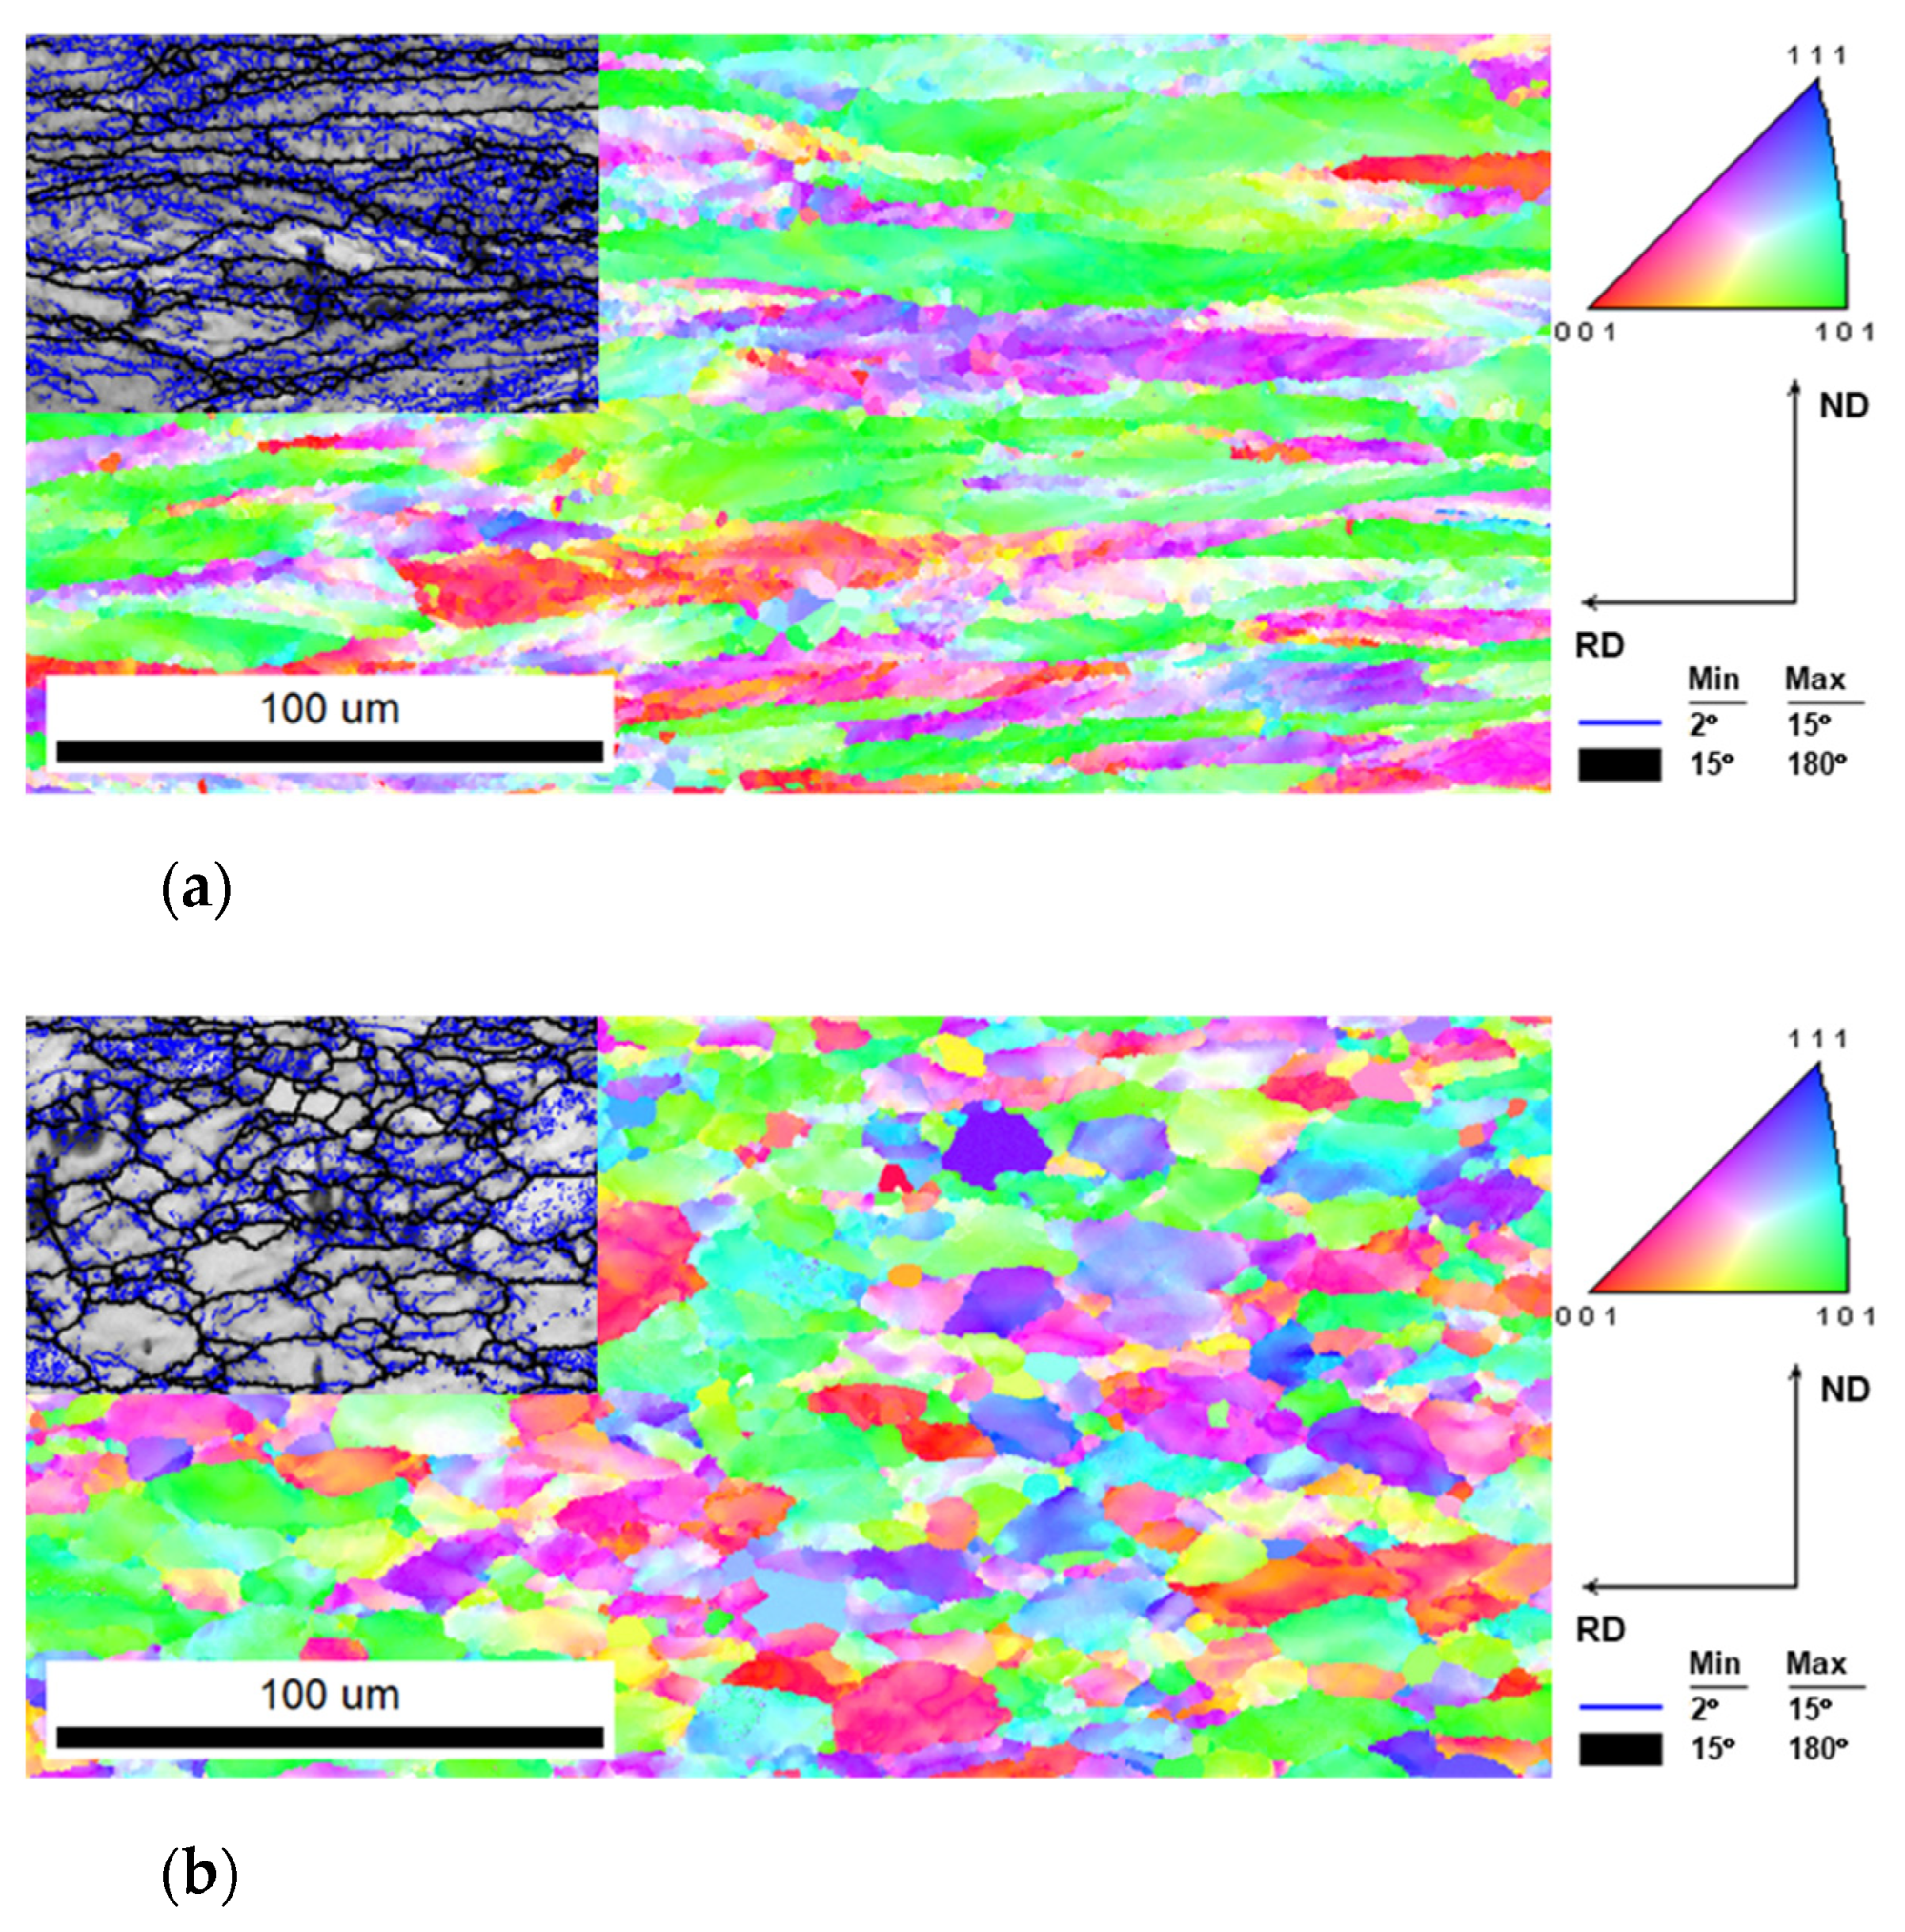
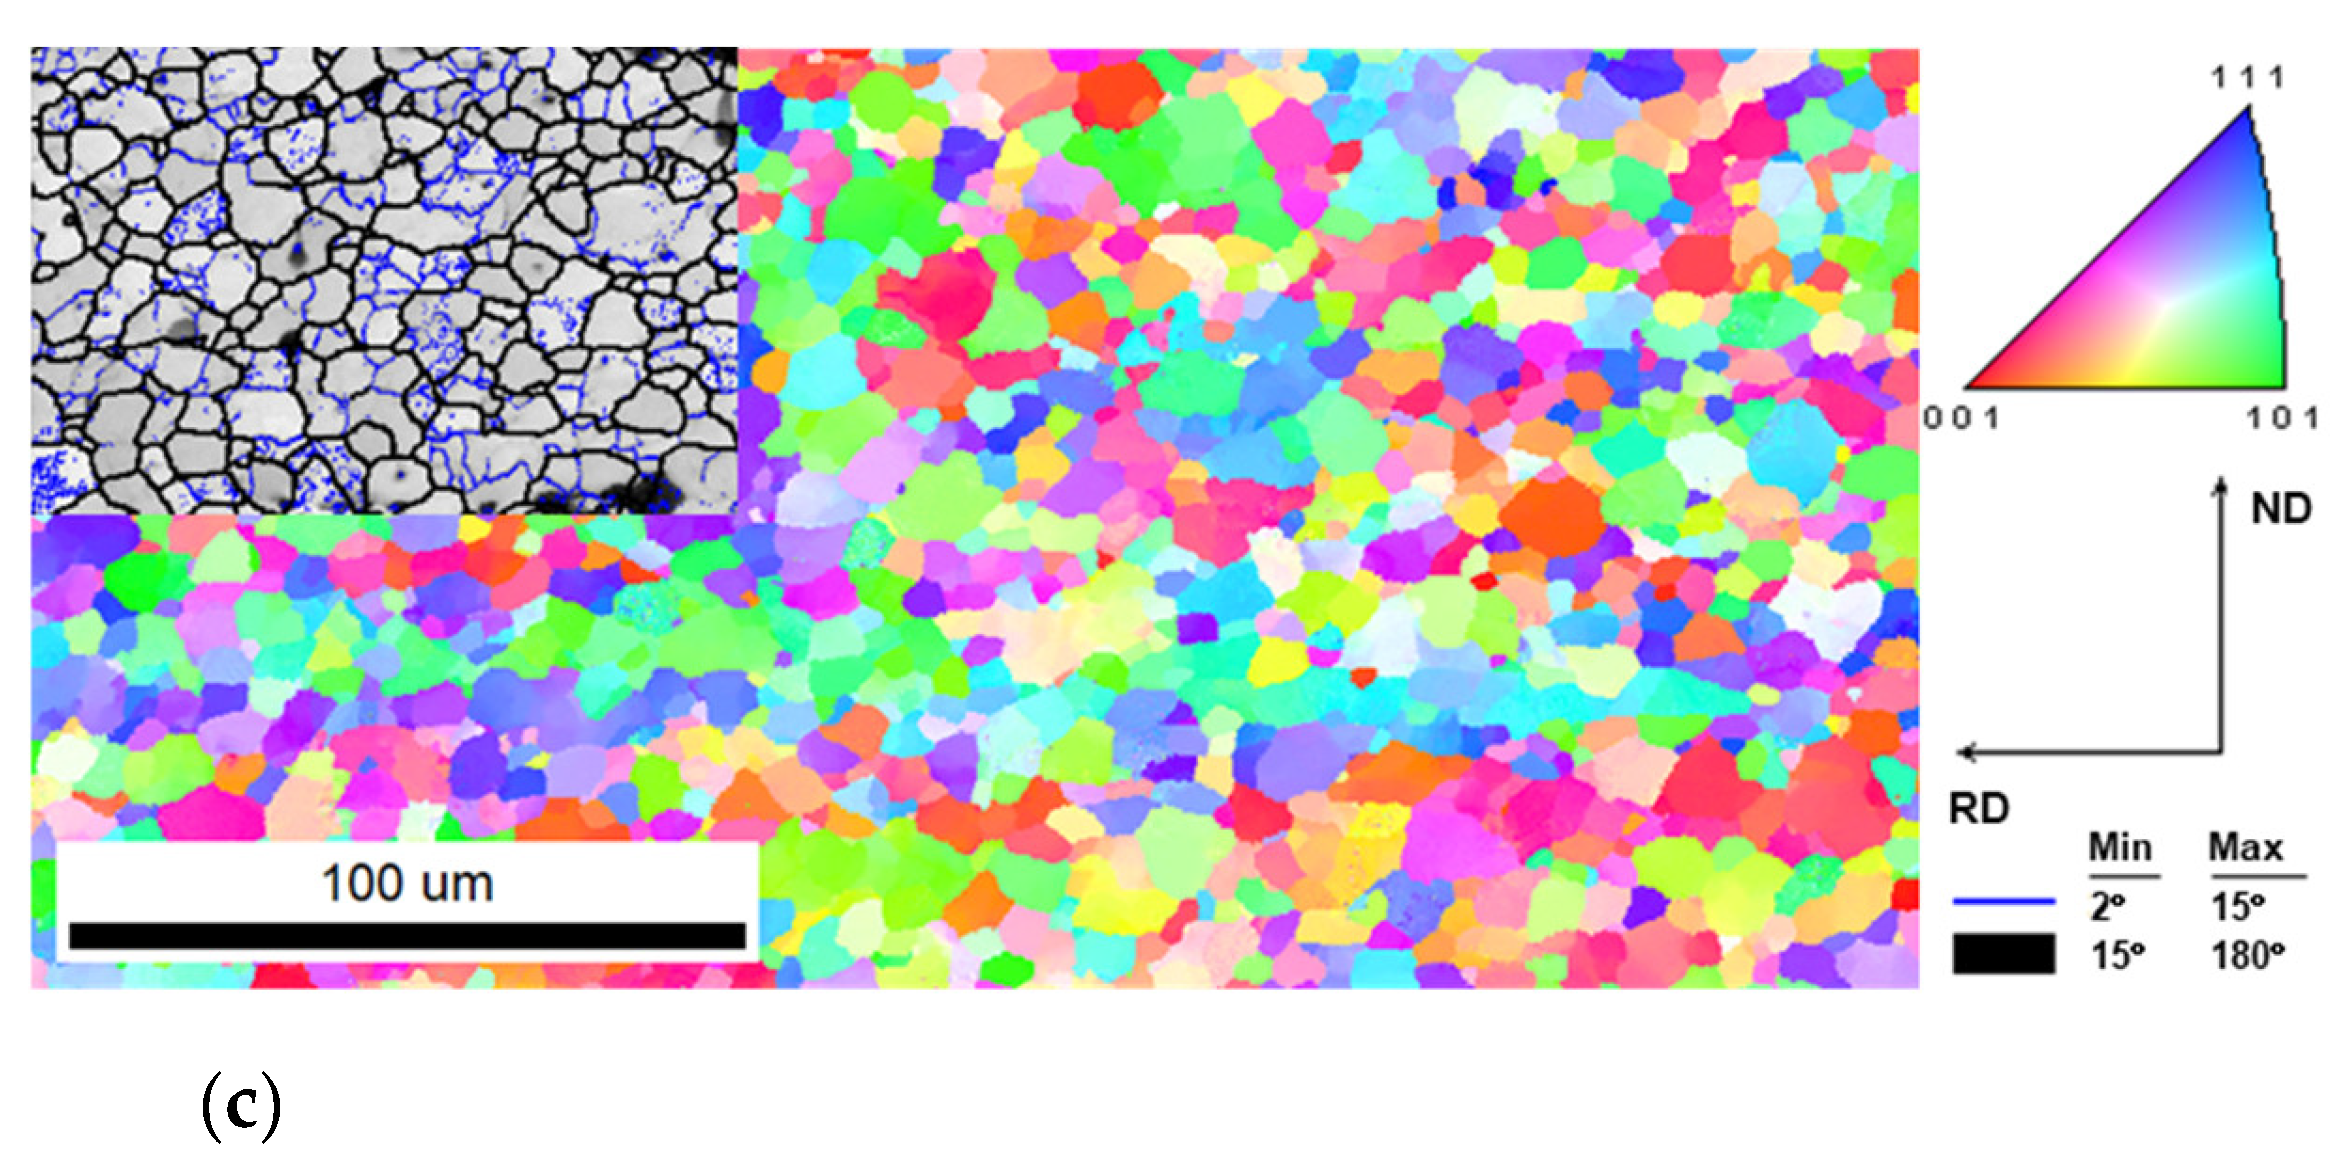
Figure 8 shows EBSD inverse pole figure (IPF) map and image quality (IQ) map images of specimens tested under several stretch forming conditions. For observing the effect of temperature on the dynamic restoration mechanism, the 300 °C condition where dynamic recrystallization of the 5083M alloy starts and the 200 °C condition for comparison were selected. Additionally, for checking the effect of strain rate, the highest strain rate condition of 1 s−1 and the lowest strain rate condition of 0.001 s−1 under 300 °C condition were chosen. As shown in Figure 8b, the microstructure of 200 °C and 0.001 s−1 condition was composed of elongated elliptical grains in Figure 8a. In addition, It was observed that subgrain structure strongly developed in the most grains and deformation bands appeared in some grains. These developed subgrain structure and deformation band indicate that the deformed microstructure generated during cold rolling still remained after stretch forming. The microstructure of 300 °C and 1 s−1 condition in Figure 8b shows different microstructure evolution from that of 200 °C and 0.001 s−1 condition. The shape of grains was close to the equiaxed shape and the size of grains was smaller than that of 200 °C and 0.001 s−1 condition. In the case of 300 °C and 0.001 s−1 condition, the microstructure was composed of very small equiaxed grains, and little subgrain structure was observed inside the grains. Furthermore, the streaks of similar oriented (similar colored) grains appeared in some area. Although dynamic recrystallization was observed in both 300 °C and 1 s−1 condition and 300 °C and 0.001 s−1 condition, the grain size of two conditions was different. This is because the lower the strain rate, the greater the degree to which recrystallization occurs under the same temperature condition. For this reason, the microstructure deformed at a lower strain rate condition has a finer grain structure [25,26].
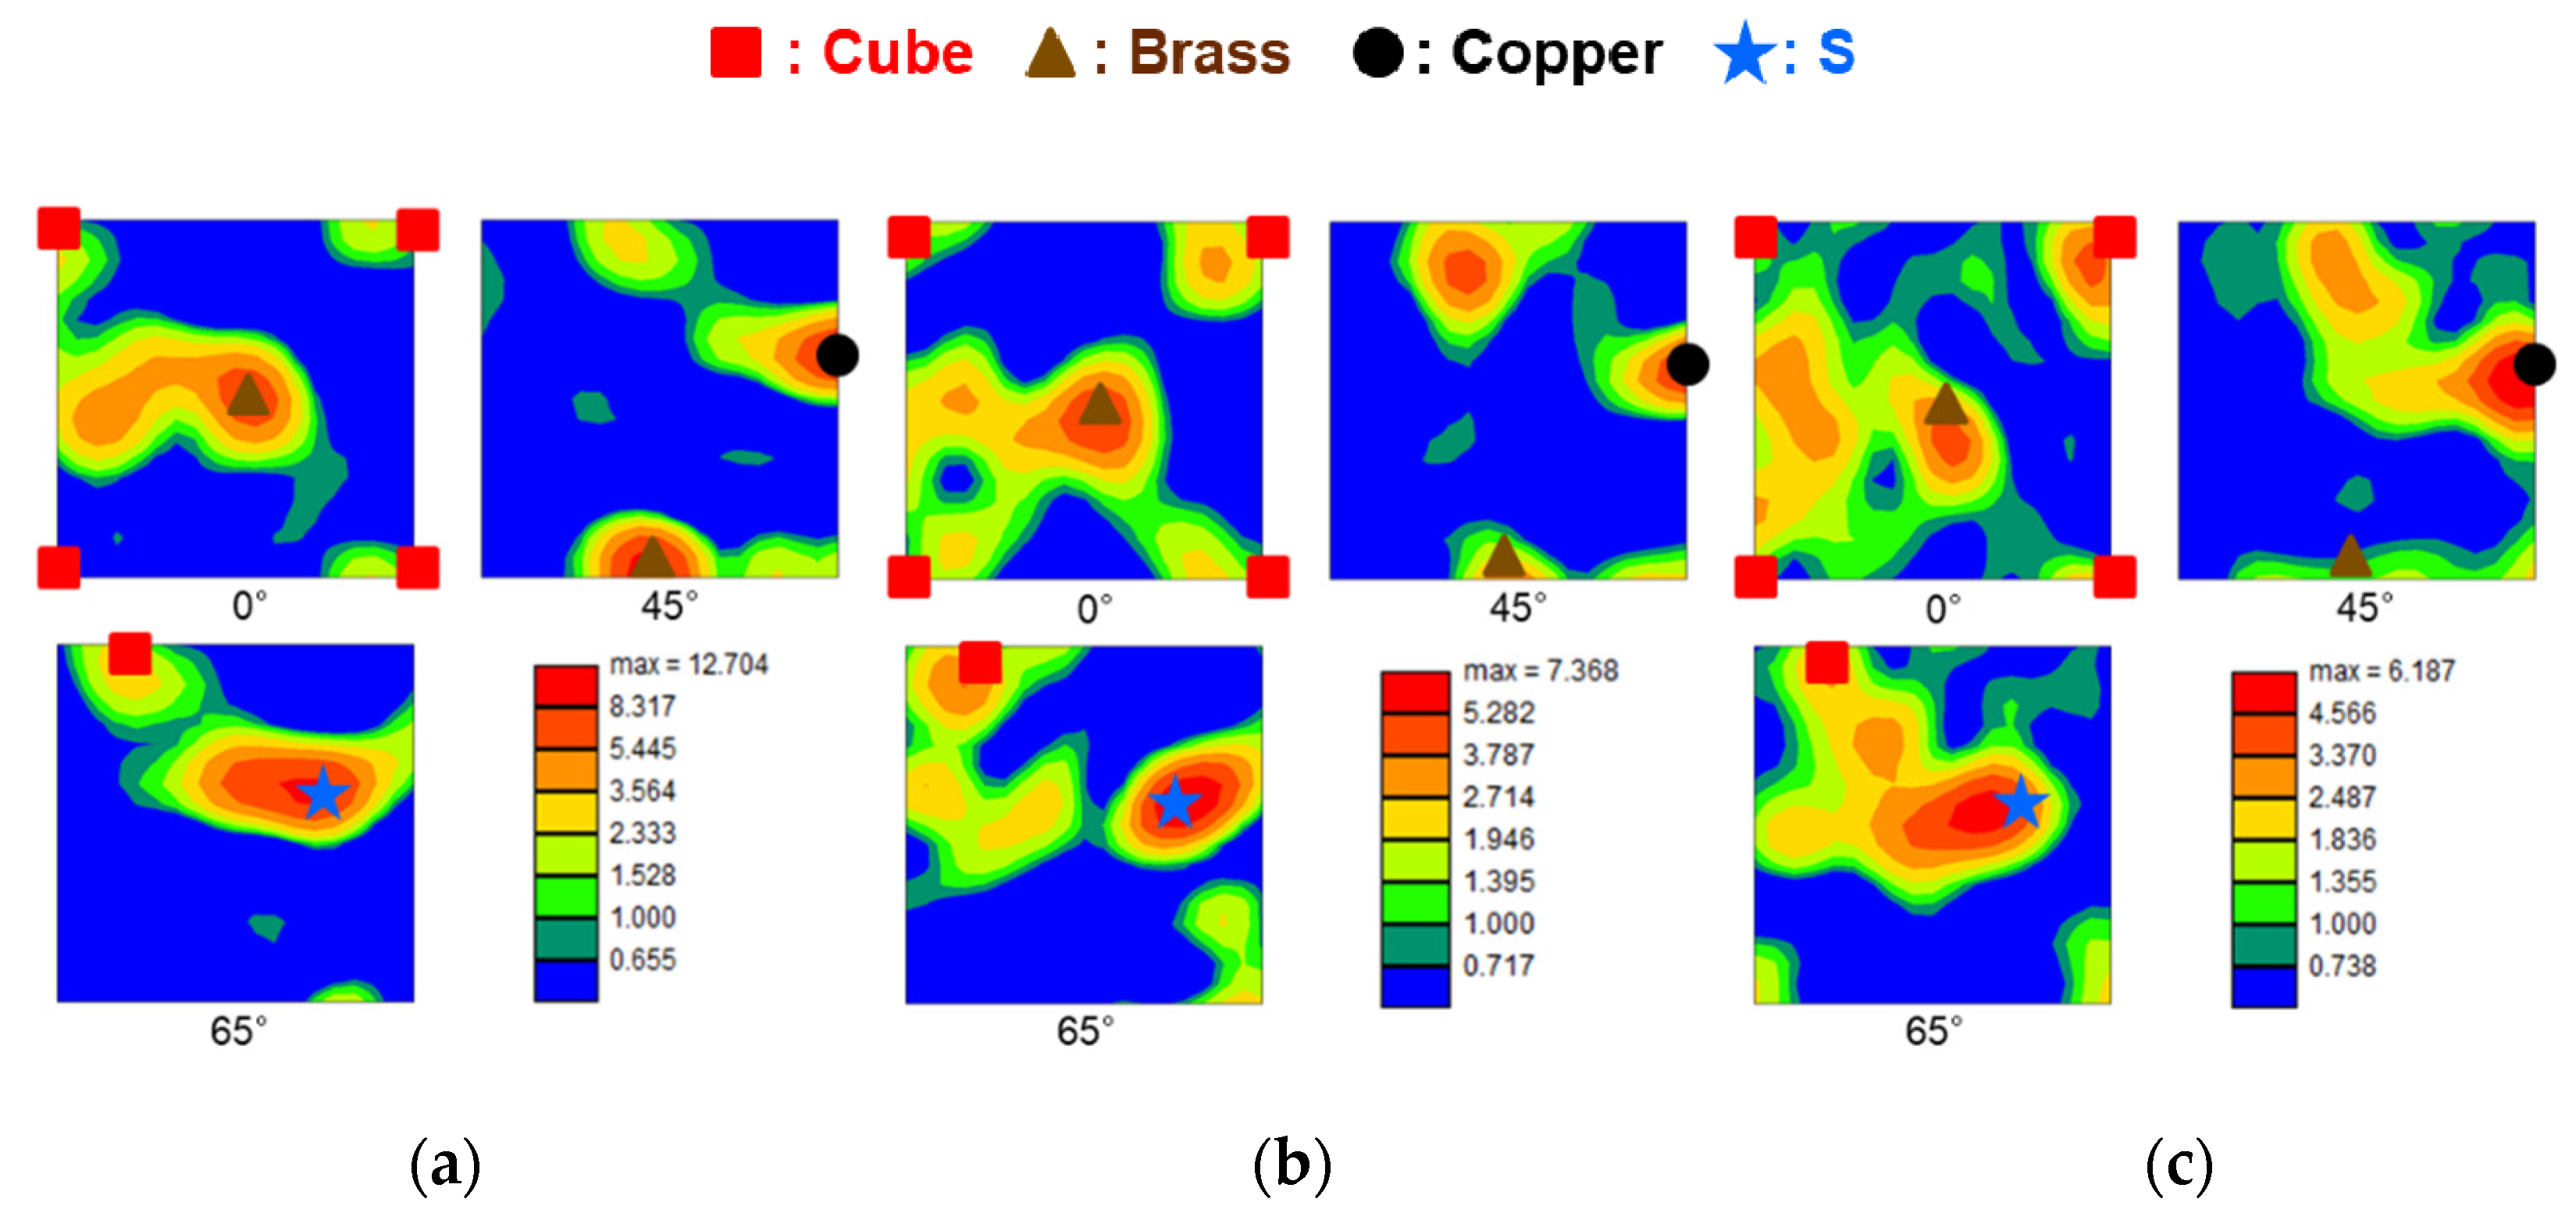
Figure 9 shows orientation distribution functions (ODF) sections images at φ2 = 0°, 45°, and 65° where typical deformation and recrystallization textures distribution of aluminum alloys is observed. Through the ODF images, it was found that the texture distribution of three conditions was similar to each other although texture intensity was different. The 200 °C and 0.001 s−1 condition (Figure 9a), which had a typical deformed microstructure in Figure 8a, showed developed β-fiber textures (S, copper, and brass texture), which are representative deformation textures of aluminum alloys [27,28]. However, the 300 °C and 1 s−1 condition (Figure 9b) and 300 °C and 0.001 s−1 condition (Figure 9c) that exhibited the recrystallized microstructure in Figure 8b,c also showed developed deformation textures similar to the 200 °C and 0.001 s−1 condition. The texture intensity of the two conditions was weakened compared to the 200 °C and 0.001 s−1 condition and the recrystallization texture partially appeared. The phenomenon that deformation texture remains even after dynamic recrystallization and the phenomenon that the vestiges of elliptical deformed grains are found in the recrystallized microstructure mainly occur in alloys whose dynamic recrystallization mechanism is geometric dynamic recrystallization (GDRX). Unlike discontinuous dynamic recrystallization (DDRX), which is caused by a nucleation stage and a grain growth stage, GDRX is generated by the movement of grain boundaries. Therefore, deformation texture is maintained even after recrystallization and streaks composed of similar oriented fine grains were observed in recrystallized microstructure [9,20].

3.2.2. Cavities

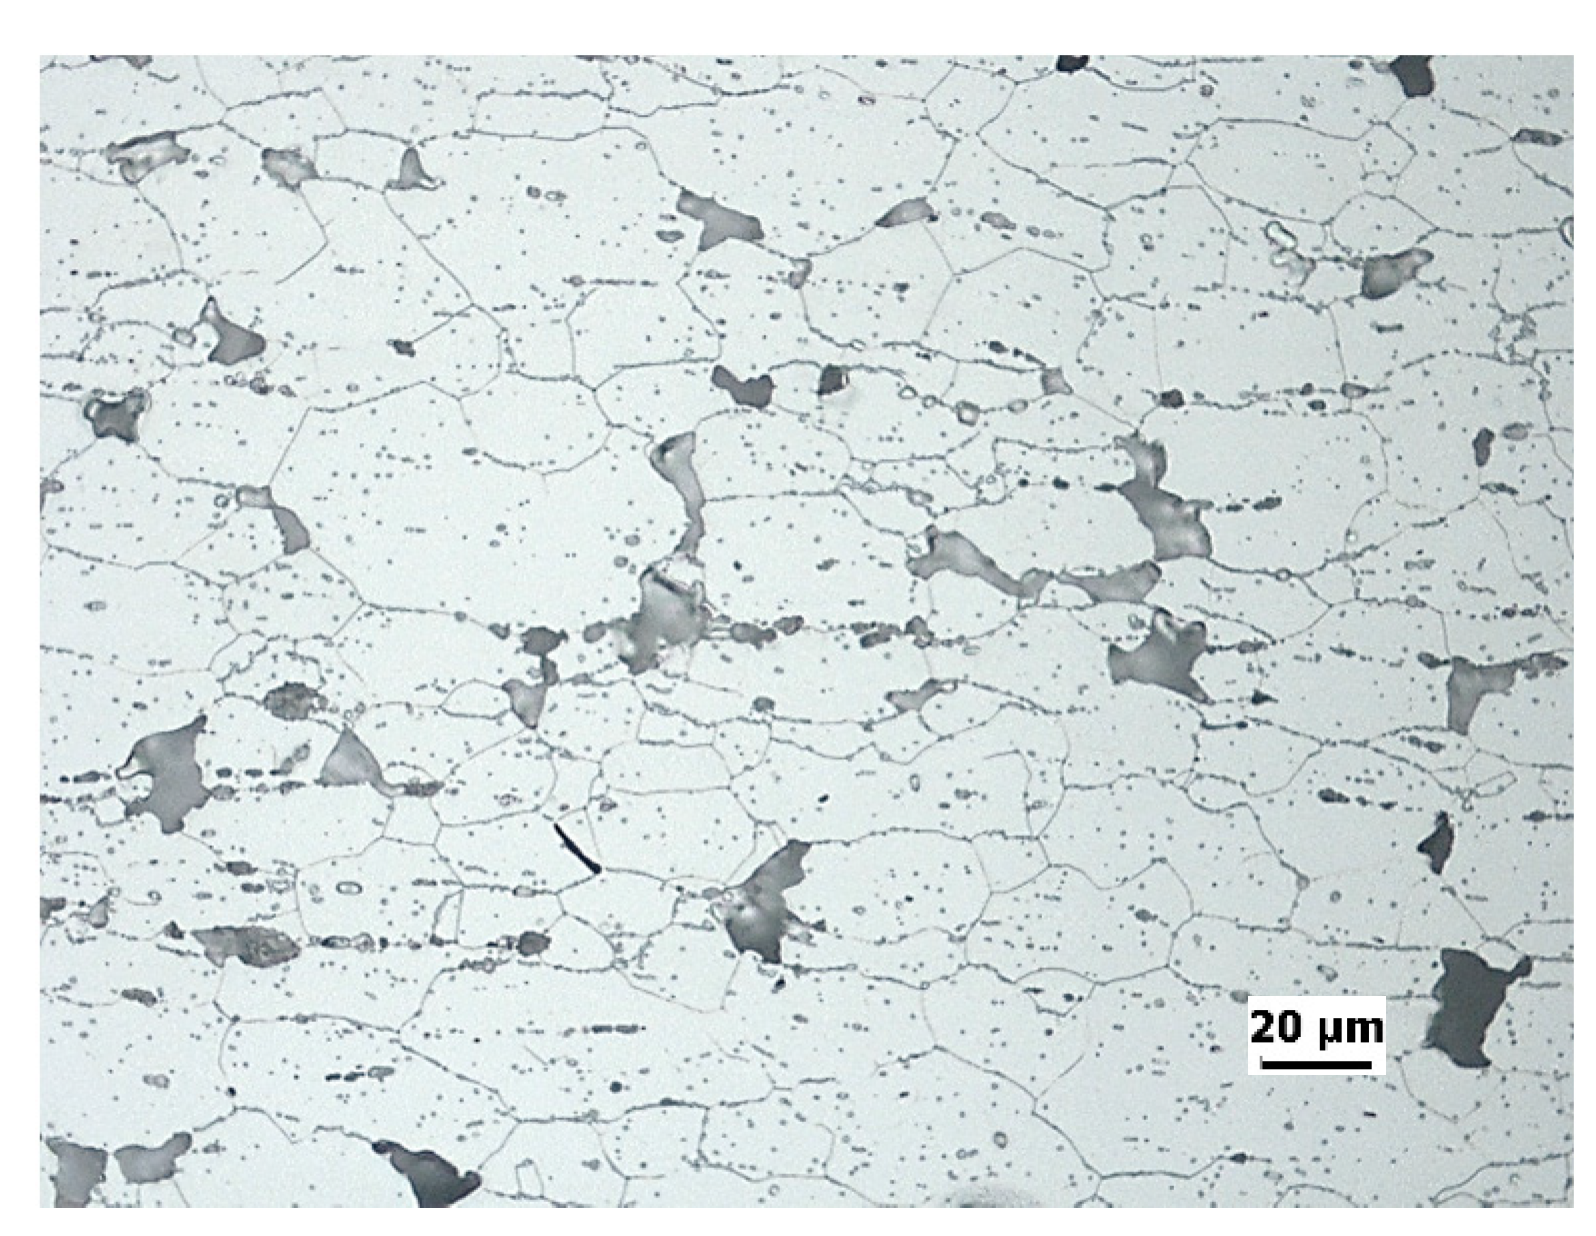
Figure 10 displays the cavities which appeared during stretch forming under high temperature and low strain rate conditions. It is noted that in the microstructure of the 300 °C and 0.001 s−1 condition (Figure 10a) and the 400 °C and 0.01 s−1 condition (Figure 10b), the cavities were arranged in a line along the rolling direction. In the case of the 400 °C and 0.001 s−1 condition (Figure 10c), however, not only small cavities arranged in a row, but also cavities with complex shape were randomly distributed. Through the etched microstructure image of the 400 °C and 0.001 s−1 condition shown in Figure 11, it can be seen that the cavities with complex shape were distributed at the grain boundary and grain triple junction. It is known that cavities arranged in a row are caused by the concentration of stress around particles lying along the rolling direction [29,30]. On the other hand, cavities with complex shape appeared due to a different reason. It is generally known that grain boundary sliding operates as a deformation mechanism for aluminum alloys under high temperature and low strain rate conditions [1,31,32]. As the grain boundaries slide during deformation, space is created in the grain boundary and grain triple junction. These spaces appear as cavities with complex shapes as shown in Figure 11 [30,33]. For this reason, the cavities were observed at grain boundaries and grain triple junctions in the microstructure of the 400 °C and 0.001 s−1 condition. These cavities have a detrimental effect on mechanical properties. The cause of the true strain reduction under the 400 °C and 0.001 s−1 condition mentioned in Section 3.1.1 can be explained by the cavities observed in the microstructure.

3.3. Constitutive Equation

There are some methods to express the phenomenon that flow stress increases as strain increases due to the strain hardening effect with a constitutive equation. In the most commonly known equation, flow stress is described as the relationship between the true strain and the strain hardening index as follows:
σ = ε n
Based on this formula, Fields and Backofen designed a new equation to take the effect of temperature and strain rate on deformation behavior into account [17].
σ = K ε n ε ˙ m
where, K is the strength coefficient, n is the strain hardening index, and m is the strain rate sensitivity exponent. The strain hardening index and strain rate sensitivity exponent are meaningful factors, which can be gained from tensile test result, to make it possible to indirectly estimate the formability of sheets [34]. In this article, the flow stress–strain curves of the 5083M alloy were analyzed through this Fields–Backofen equation for the purpose of predicting the deformation behavior of the 5083M alloy.

3.3.1. n-Value

Linear regression of true stress–strain data was conducted to derive strain hardening index n from Equation (2) according to:
n = d log σ d log ε | ε ˙ , T
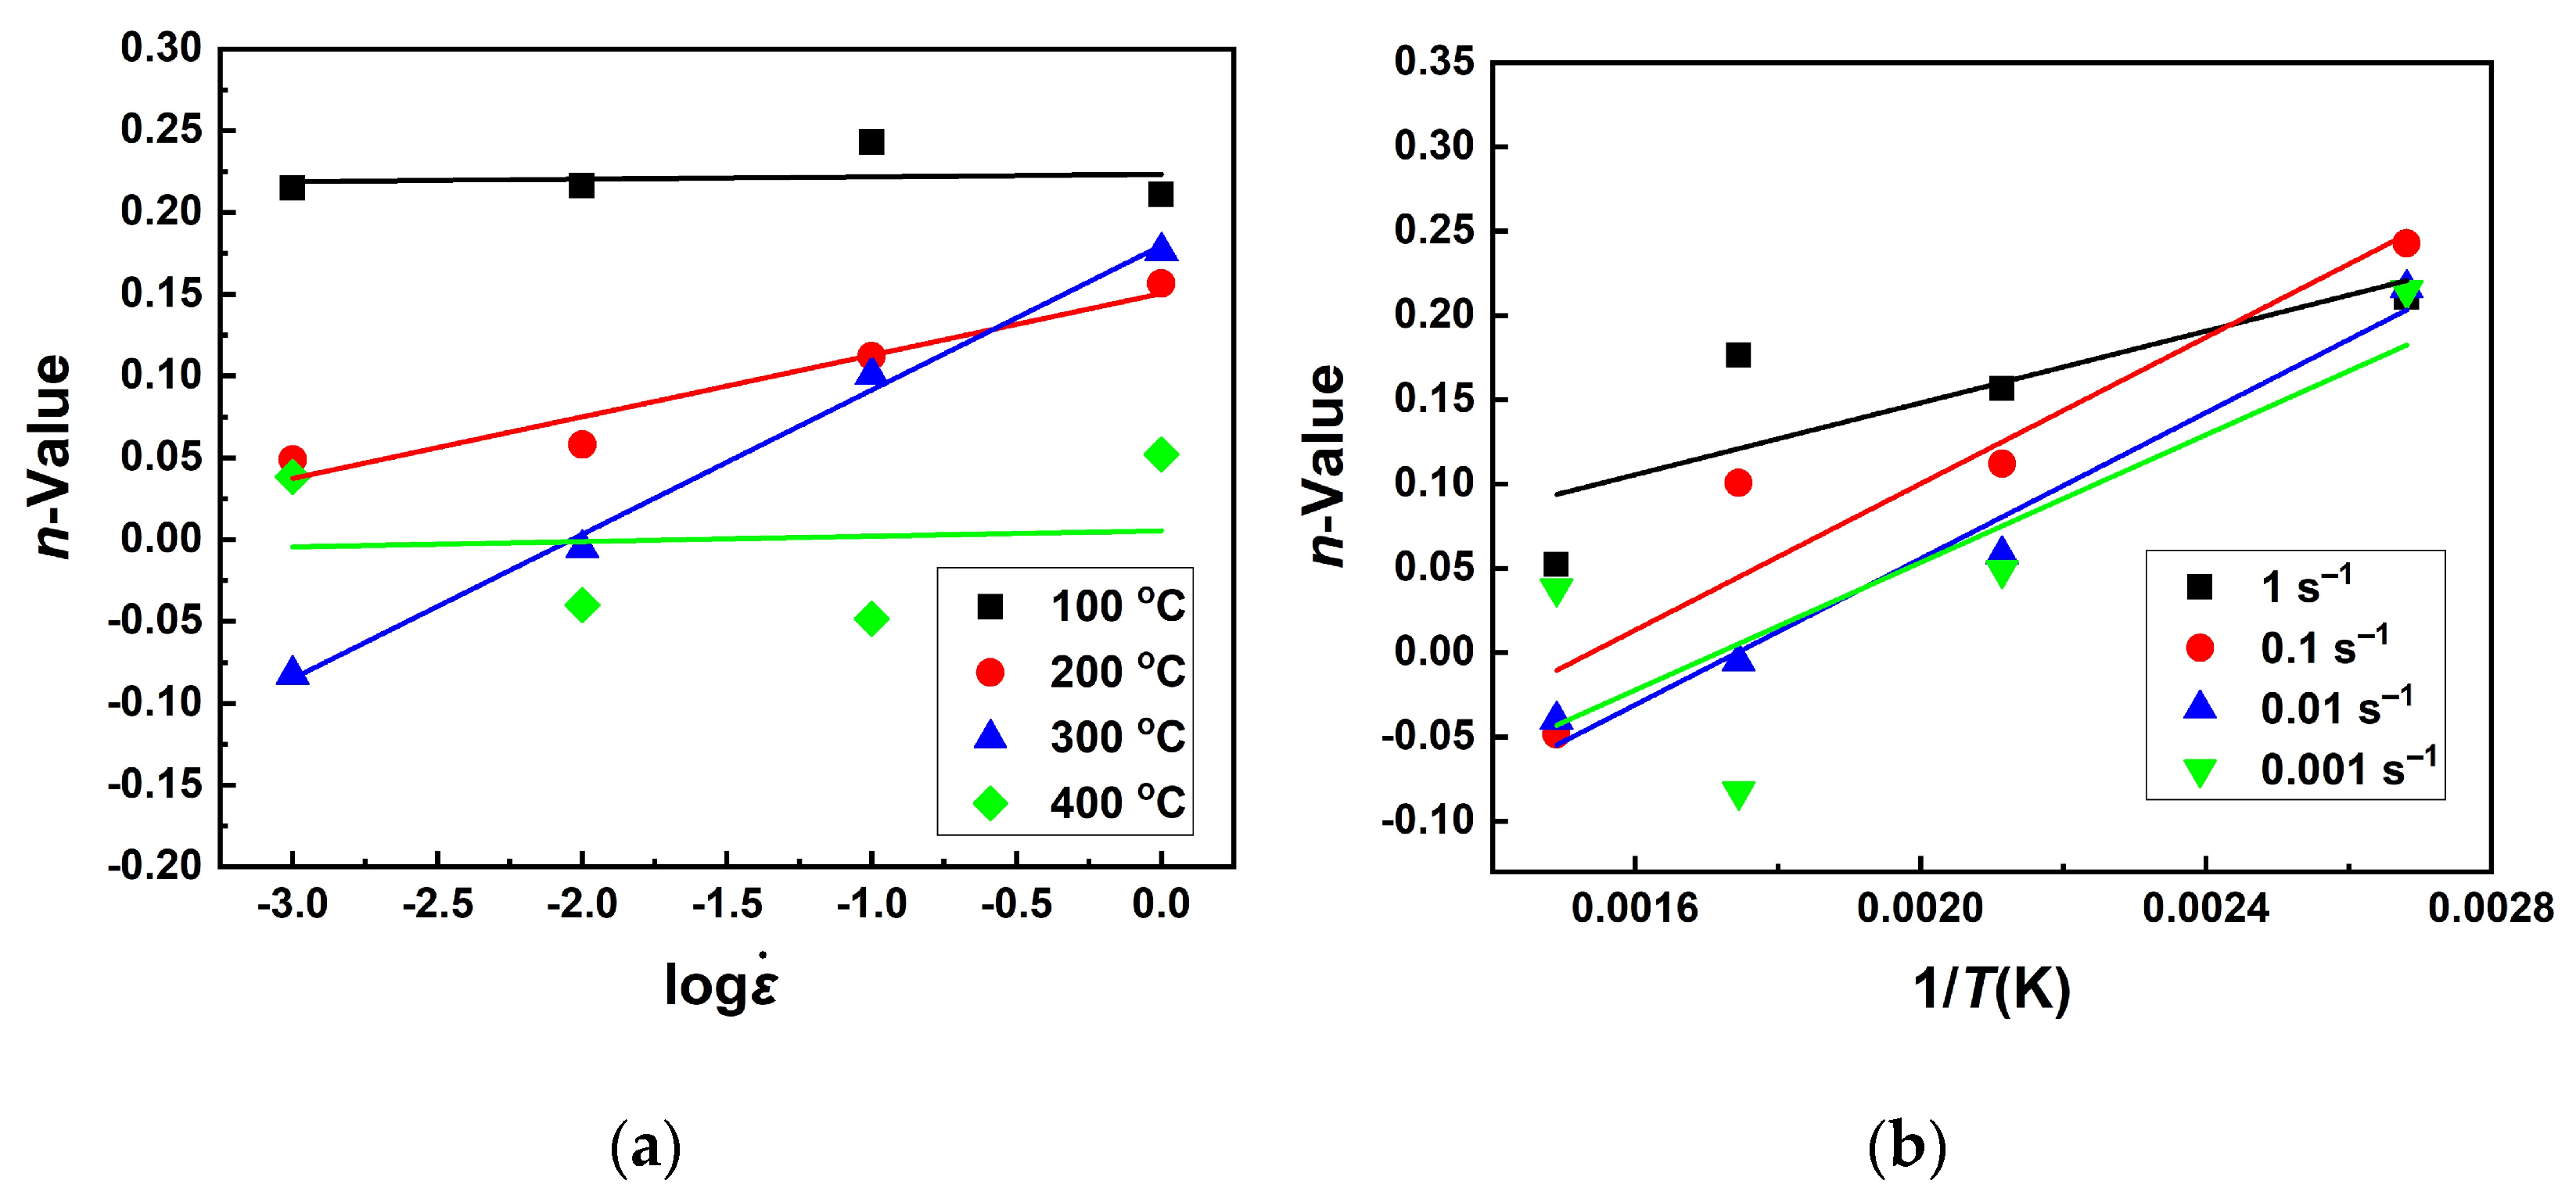
A variation of n-value as a function of various strain rates and temperature conditions is given in Figure 12. The n-value showed the linear relationship with logarithmic strain rate and the reciprocal of temperature. According to this relationship, an equation was obtained: [34,35]
n = A log ε ˙ + B / T   ( K ) + C
At a fixed temperature, the n-value can be expressed as Equation (5).
n = A log ε ˙ + D
The parameter A is the slope of lines in the n- log ε ˙ graph in Figure 12a. Table 2 shows values of A at different deformation temperatures. From Table 2, mean value of A can be obtained as 0.03265. The parameter D can be calculated as Equation (6) from Equations (4) and (5).
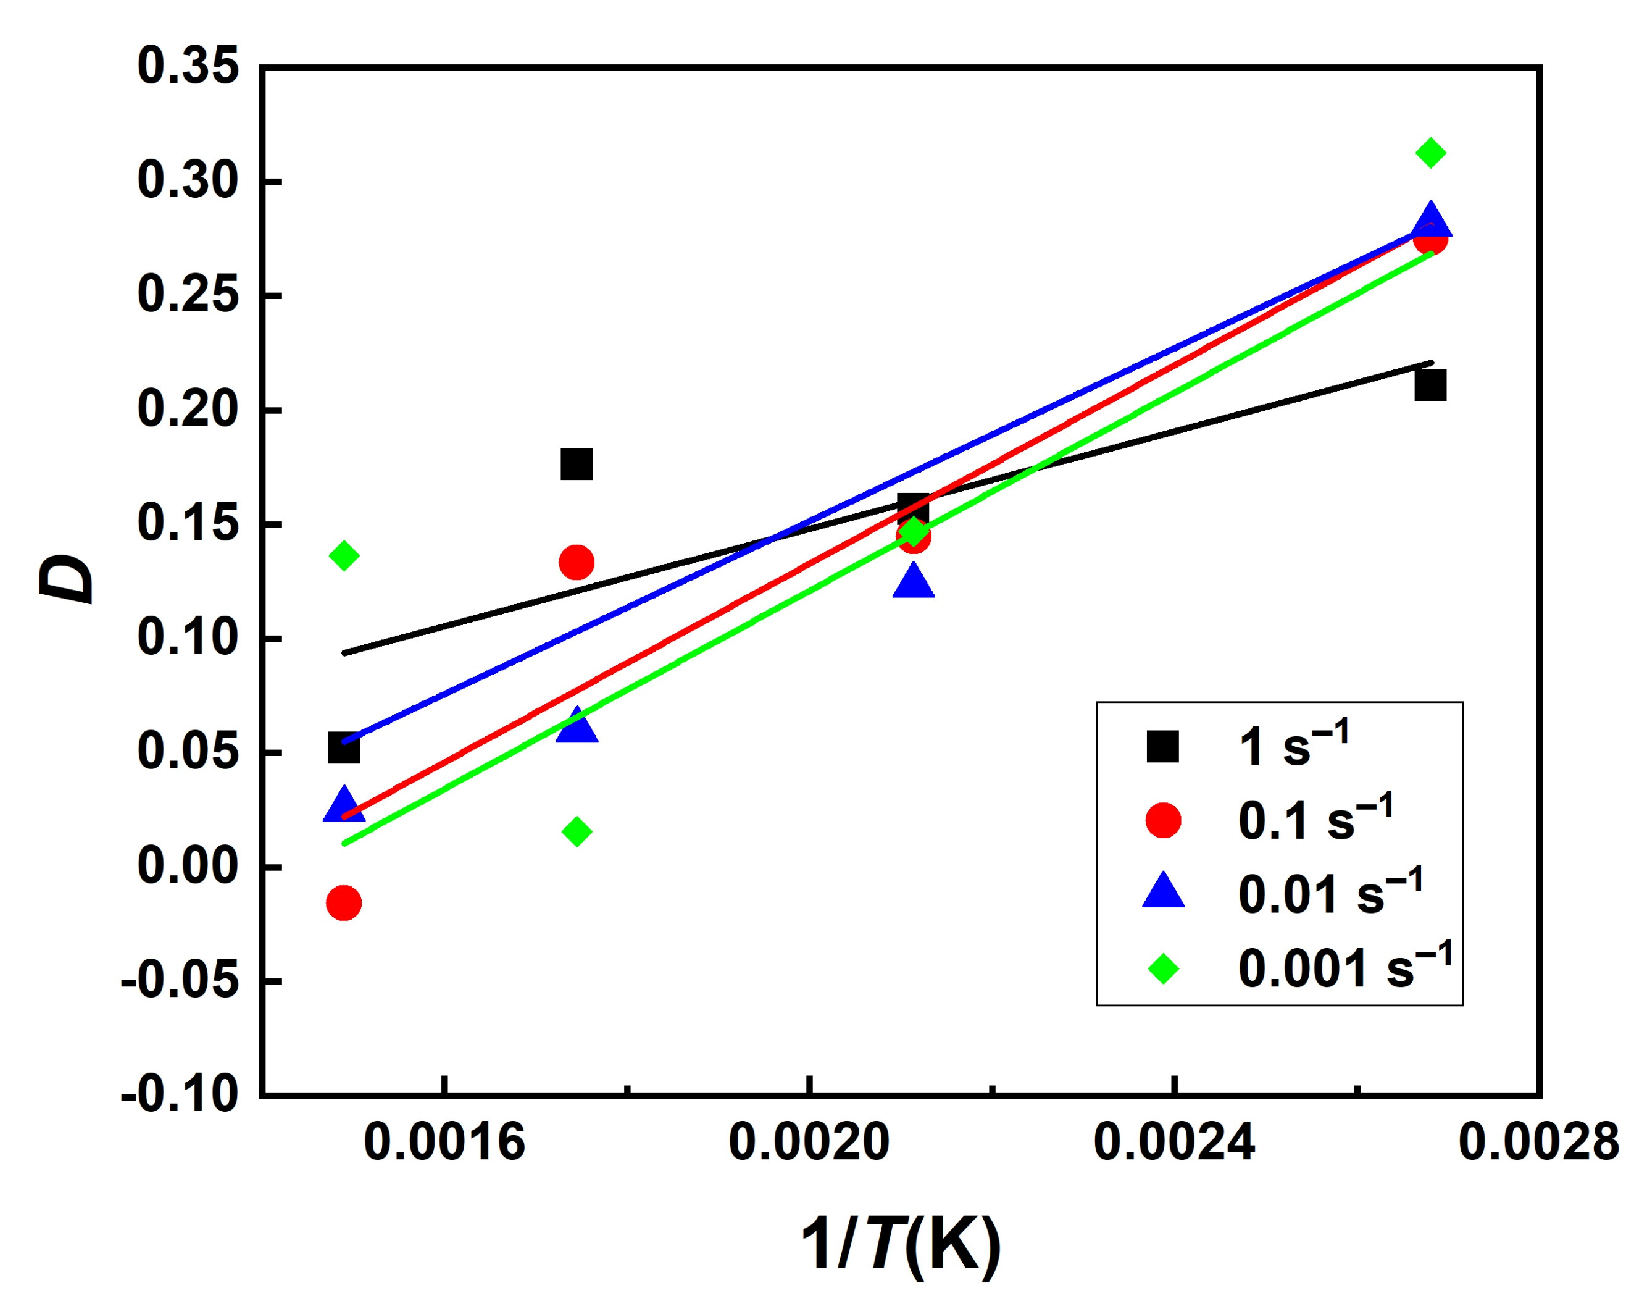
D = B / T   ( K ) + C
In Equation (6), parameter B is the slope of lines and parameter C is the y-axis intercept of the lines in the D-1/T graph. The relationship between parameter D and the reciprocal of temperature was plotted in Figure 13. The values of B and C are shown in Table 3. From Table 3, mean value of B and C can be calculated as 182.38930 and −0.22647, respectively. In conclusion, the n -value according to various temperatures and strain rates can be expressed as one equation as follows:
n = 0.22647 + 0.03265 log ε ˙ + 182.38930 / T

3.3.2. m-Value

Generally, the strain rate sensitivity exponent m is obtained through separate tests like strain change test under various temperatures and strain rates [36]. In this study, however, m-values were calculated from true stress–strain data by the formula derived from Equation (2) as follows:
m = d log σ d log ε ˙ | ε , T
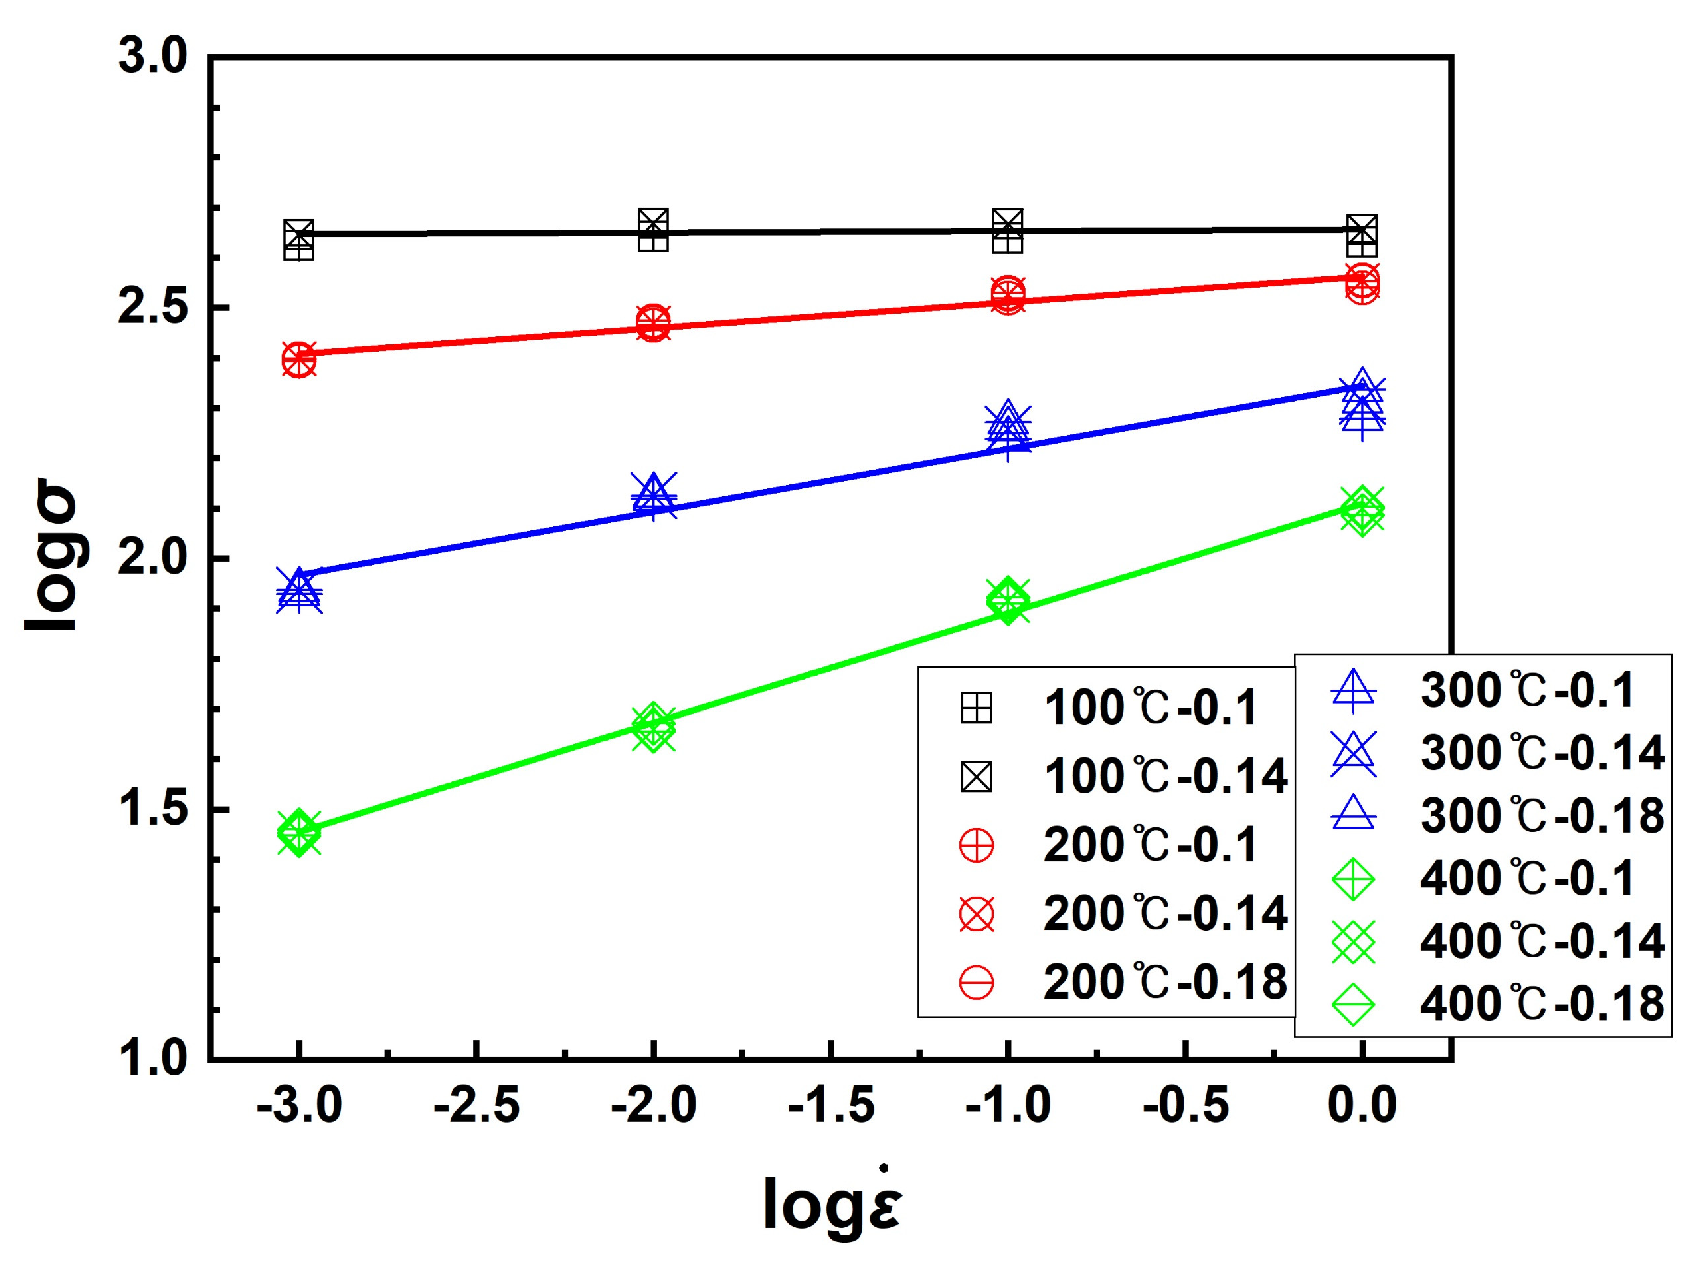
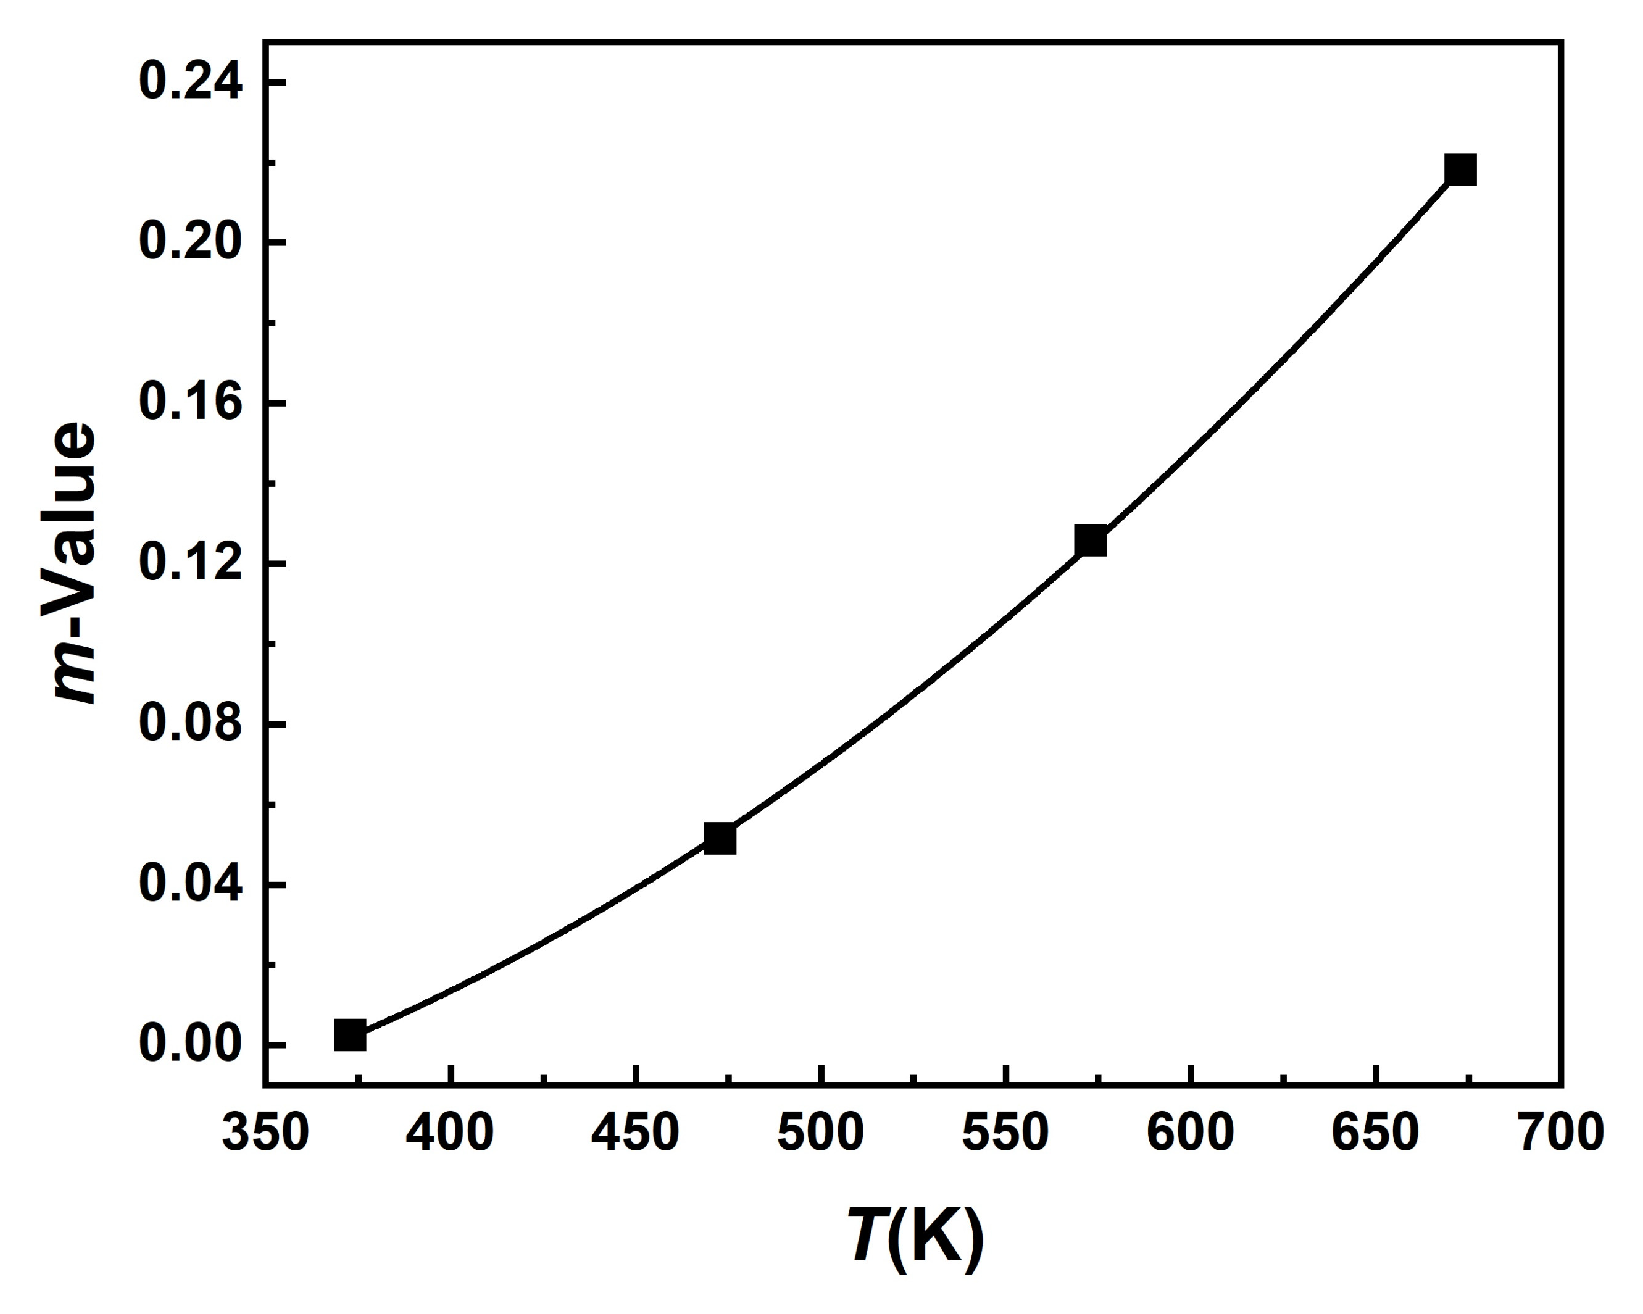
Figure 14 shows the variation of logarithmic true stress against logarithmic strain rate at different temperatures. True stress values were selected at true strain of 0.1, 0.14, and 0.18 under respective test conditions. It is noted that at same temperature, log σ log ε ˙ plots display the linear relationship. The slopes of the lines in Figure 14 represent m-values at each temperature. Table 4 shows the m-values of the 5083M alloy at 100 °C, 200 °C, 300 °C, and 400 °C. From Table 4, It is can be seen that the m-value increases with increasing temperature. The relationship between m-value and temperature was plotted by polynomial fitting in Figure 15. The equation expressing the relationship between m-value and temperature is as follows:
m = 0.00484 4.11753 10 4 T + 1.08375 10 6 T 2

3.3.3. K-Value

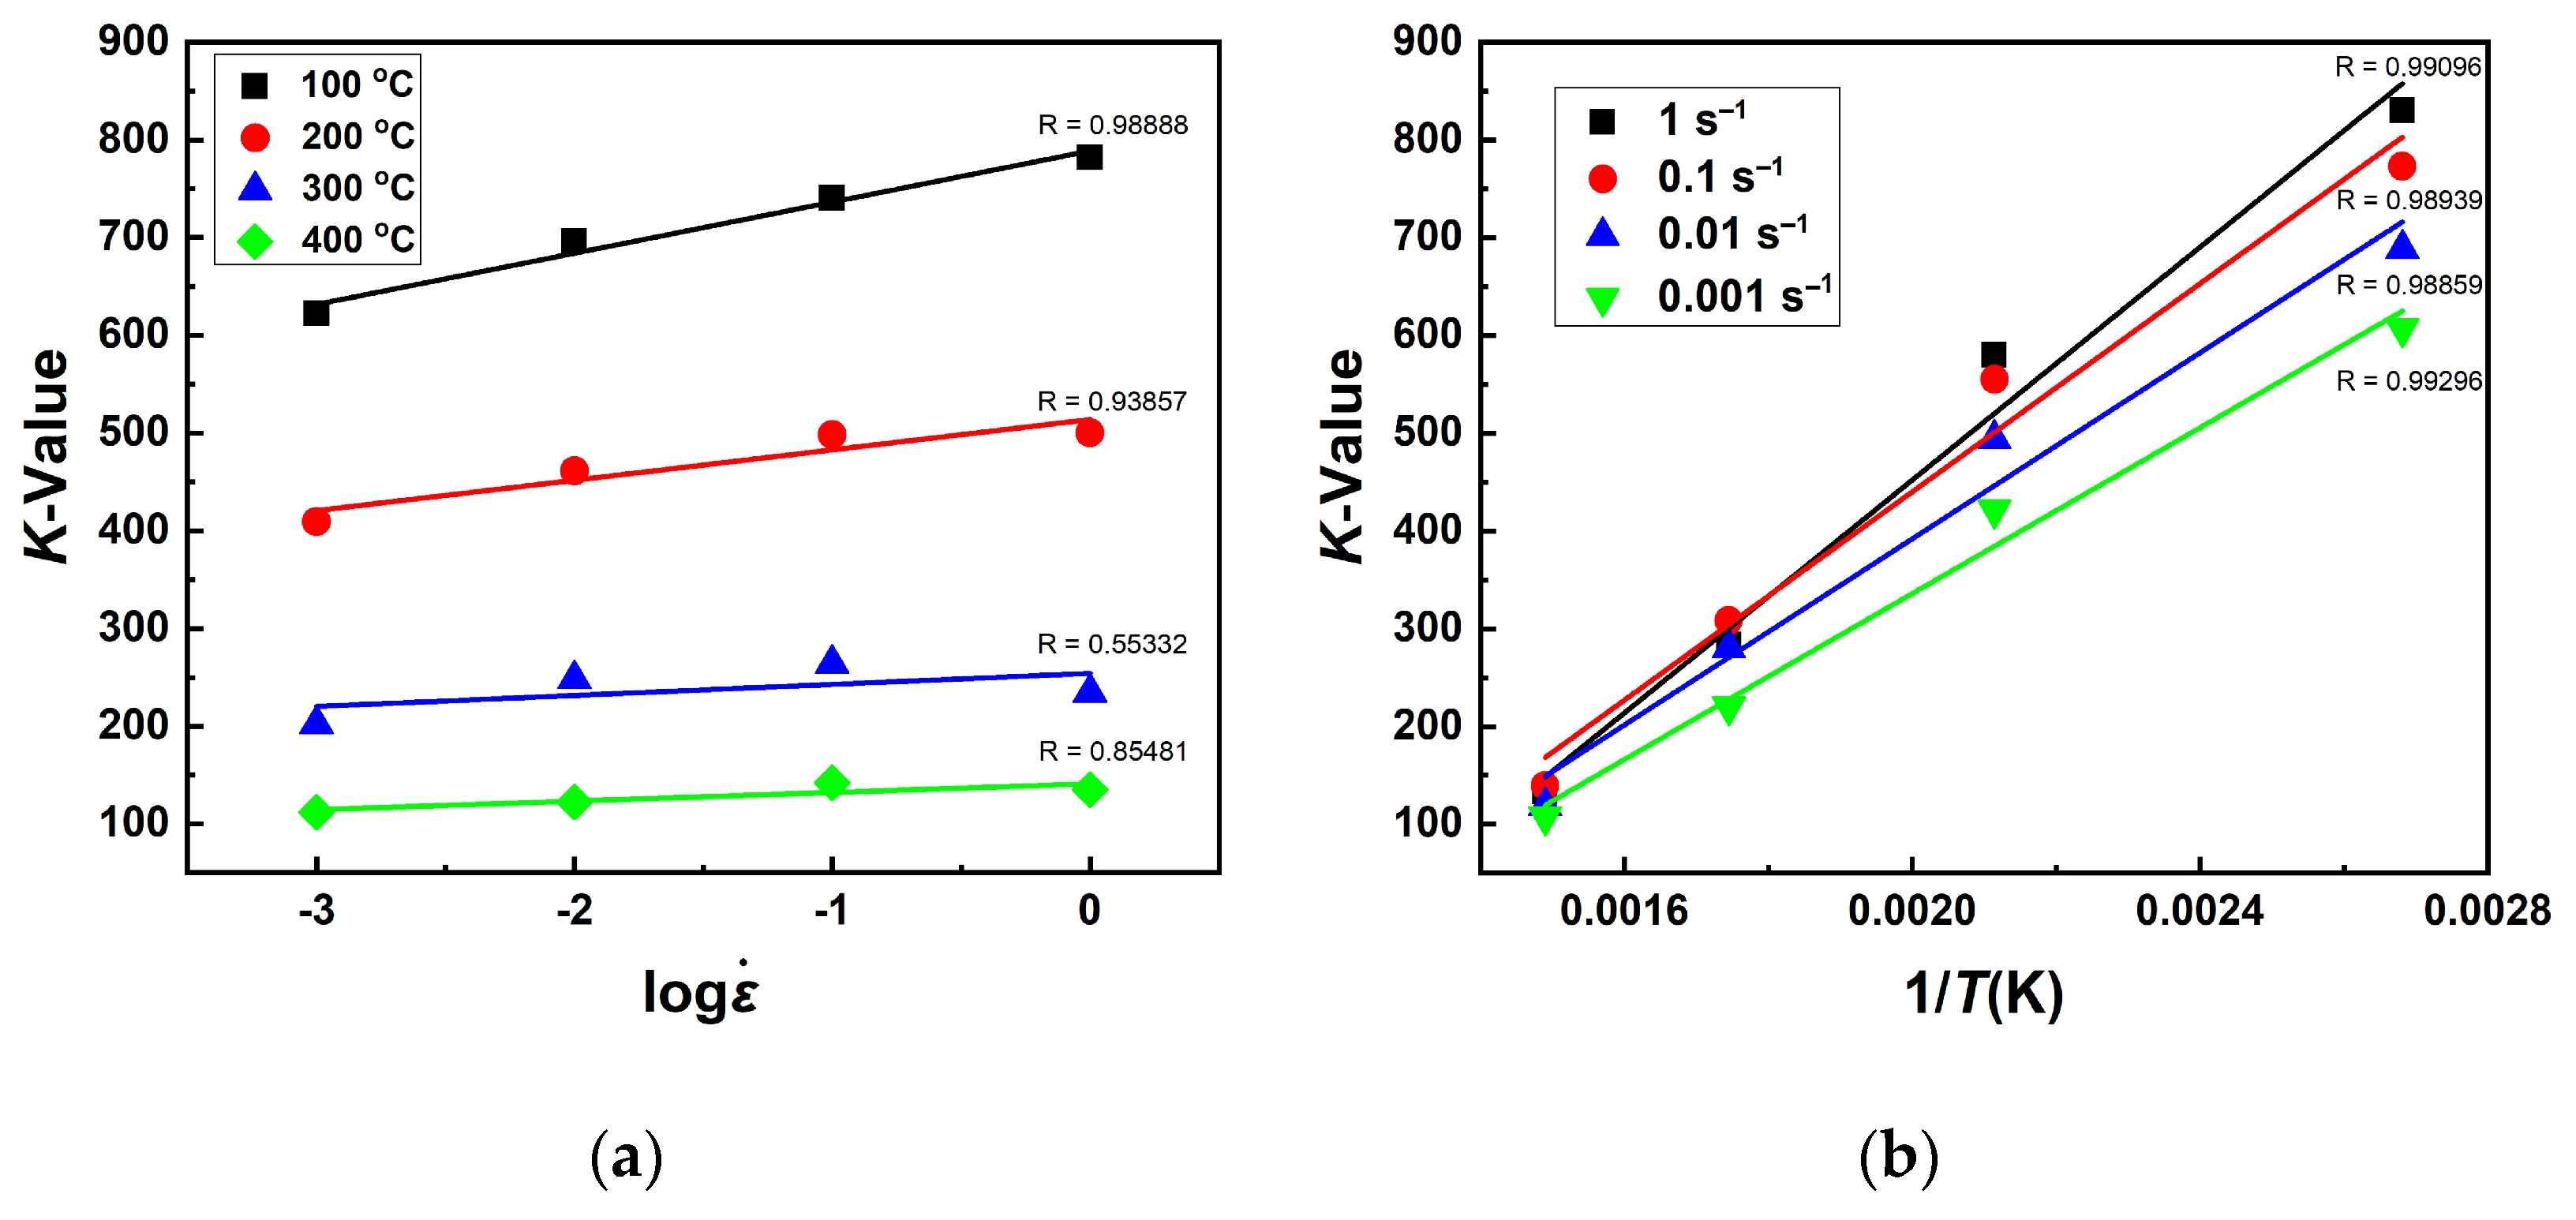
The relationship of the strength coefficient K with strain rate and temperature can be seen in Figure 16. R on the Figure 16 is correlation coefficients showing the relationship between two variables. Similar to the n-value, K-value also shows the linear relationship with logarithmic strain rate and the reciprocal of temperature. Therefore, K-value can be expressed as follows.
K = A log ε ˙ + B / T ( K ) + C
In the same procedure as n-value, the parameter A can be derived from in the K- log ε ˙ graph in Figure 16a. Table 5 exhibits values of A at respective deformation temperatures. Calculated mean A value was 25.89153. Using Equation (6), the parameters B and C can be gained from the D-1/T graph given in Figure 17. Table 6 shows values of B and C at different strain rate conditions. From Table 6, mean values of B and C were obtained as 4.98590 and −576.42960. Therefore, the equation calculated for K-value is as follows.
K = 576.42960 + 25.89153 log ε ˙ + 4.98580 / T

3.3.4. Validation of the Constitutive Equation

Through the above procedures, the equations expressing the deformation behavior of the 5083M alloy were calculated based on the Field–Backofen equation as follows.
{ σ = K ε n ε ˙ m   n = 0.22647 + 0.03265 log ε ˙ + 182.38930 / T   m = 0.00484 4.11753 10 4 T + 1.08375 10 6 T 2 K = 576.42960 + 25.89153 log ε ˙ + 4.98580 / T  
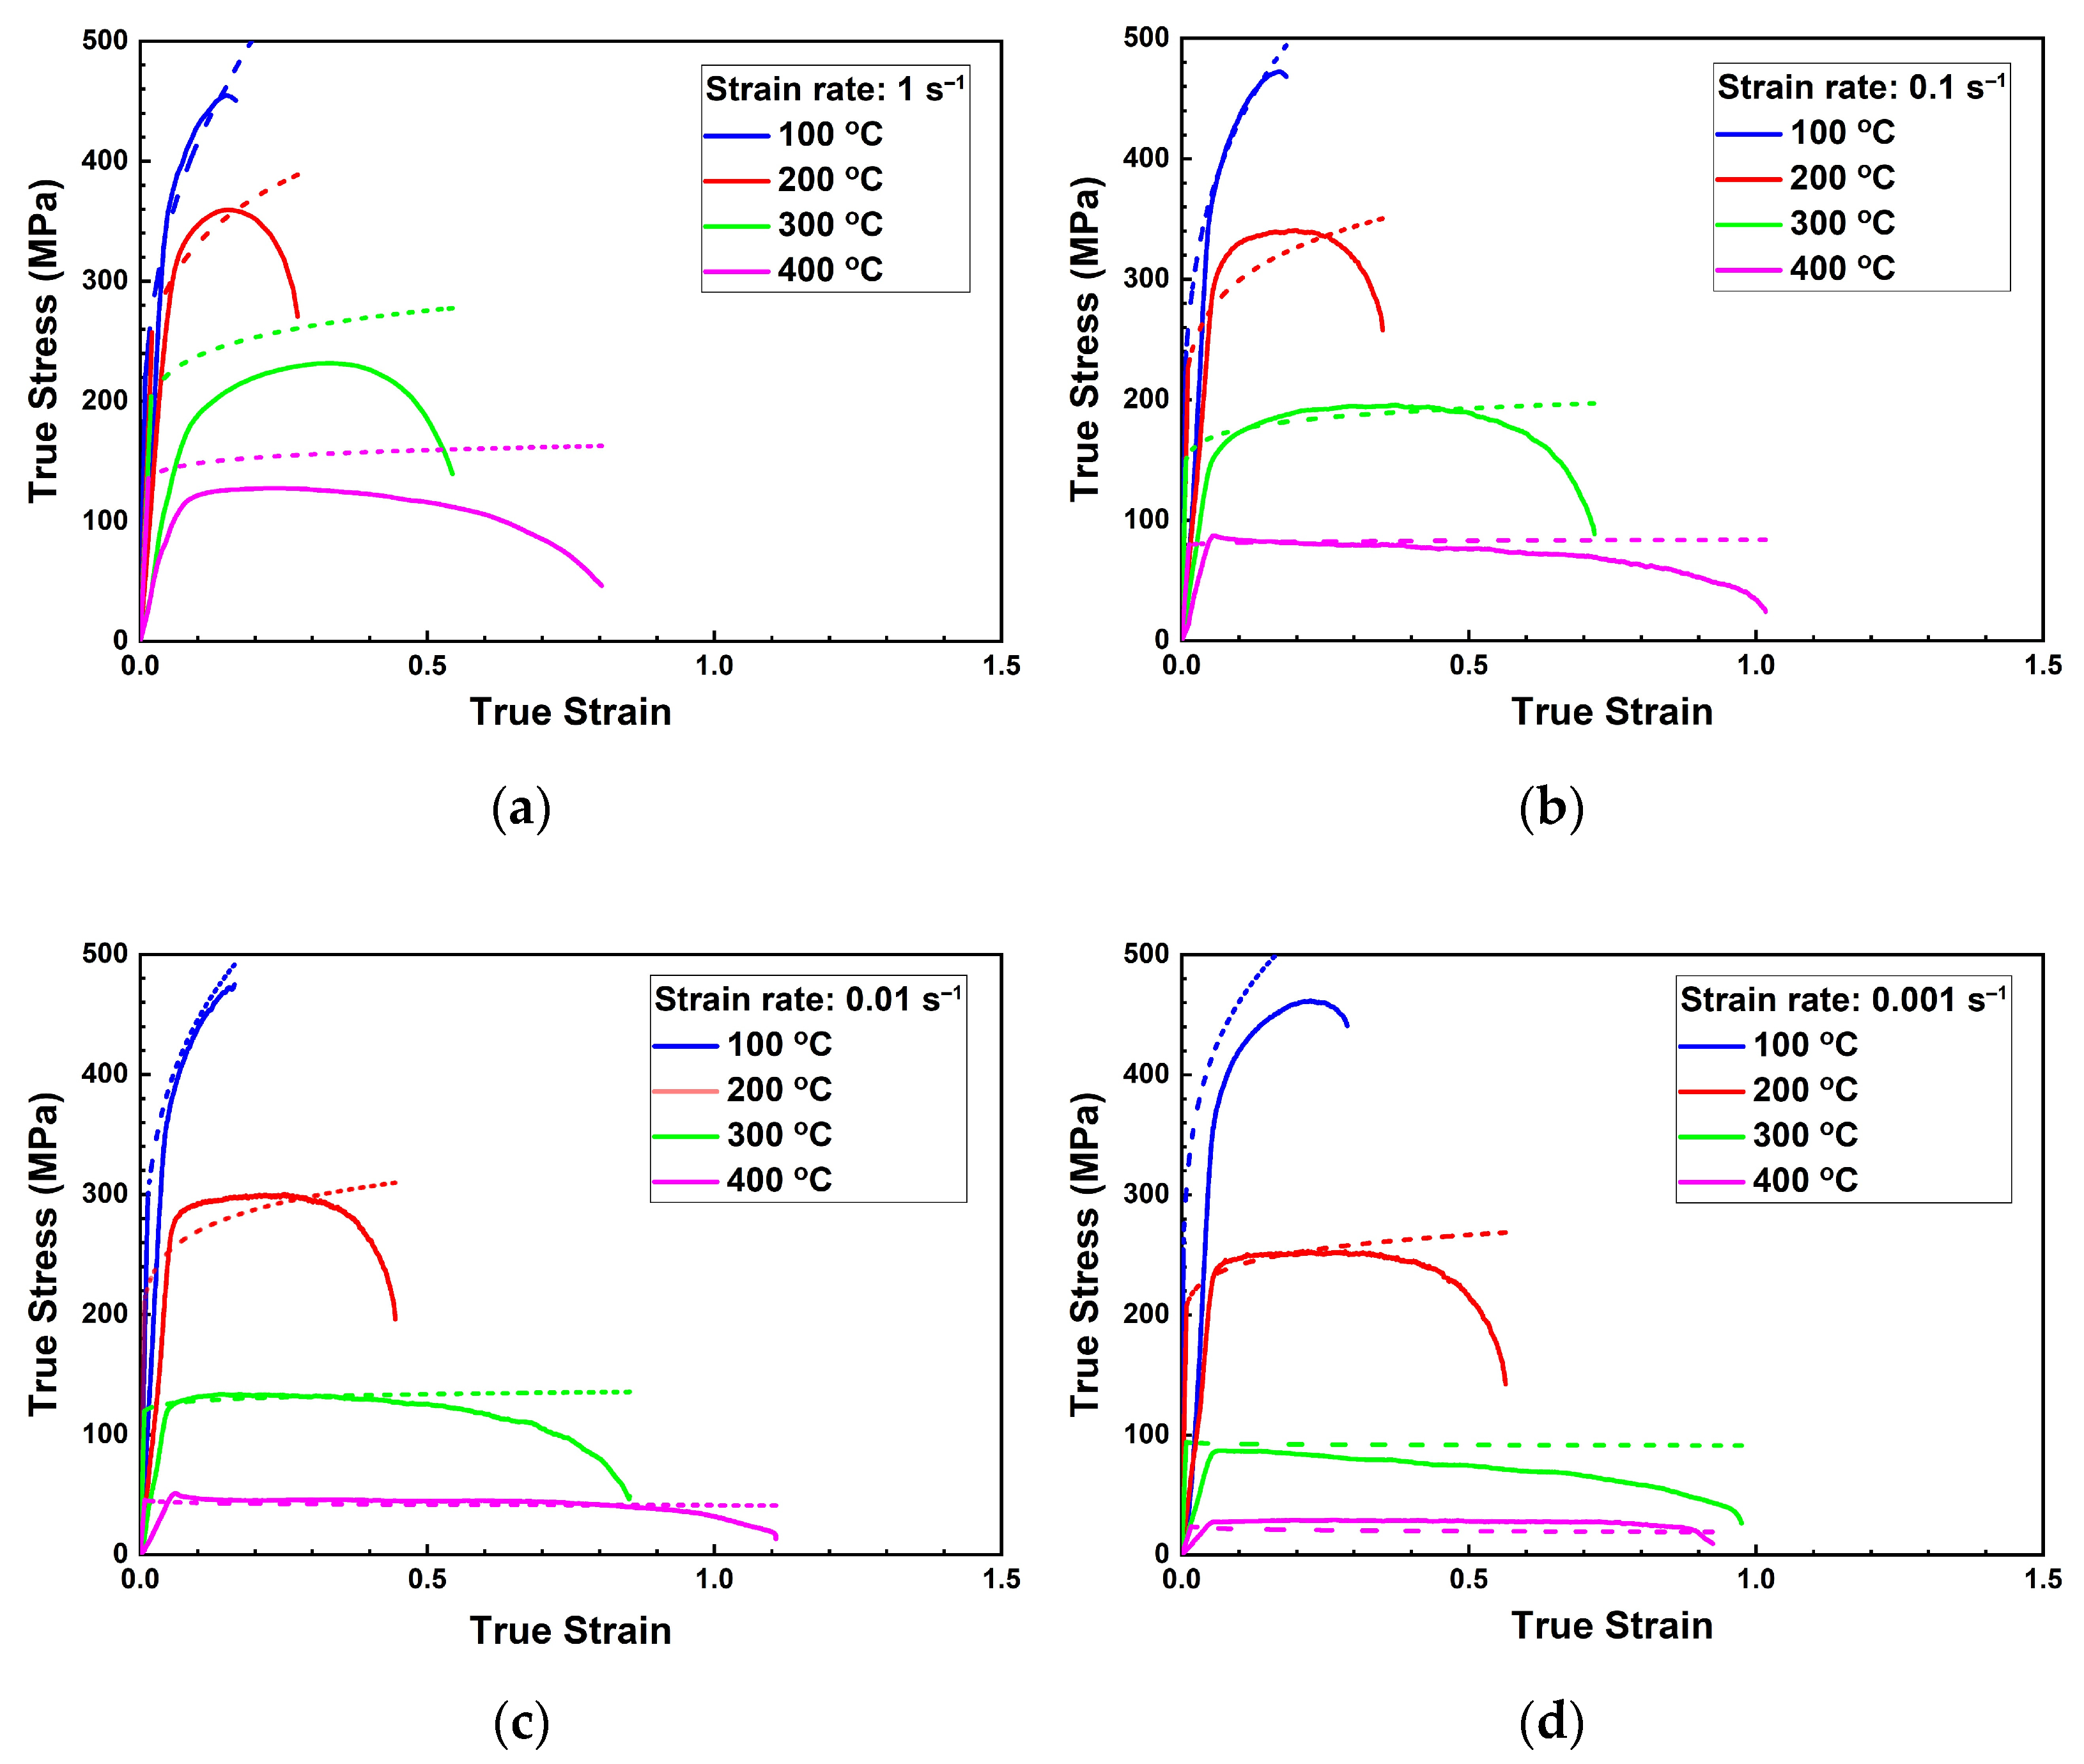
Figure 18 displays the predicted flow stress–strain curves calculated from Equation (11) with the measured flow stress–strain curves from experiments. Due to limitation of the Field–Backofen equation which is based on deformation mechanism controlled by dislocation glide, the calculated curves did not predict the softening region where deformation occurs by the mechanism controlled by dislocation climb [37]. Therefore, calculated curves mainly predicted the strain hardening region of measured curves dominated by dislocation glide well. For evaluating the constitutive equation, the coefficient of determination ( R 2 ), which is one of the statistical methods, was calculated. The R 2 -value has a value between 0 and 1. The closer the R 2 -value is to 1, the higher the accuracy of the calculated curve. The coefficient of determination is expressed by the following equation.
R 2 = ( i = 1 N ( E i E ¯ ) ( P i P ¯ ) i = 1 N ( E i E ¯ ) 2 i = 1 N ( P i P ¯ ) 2 ) 2
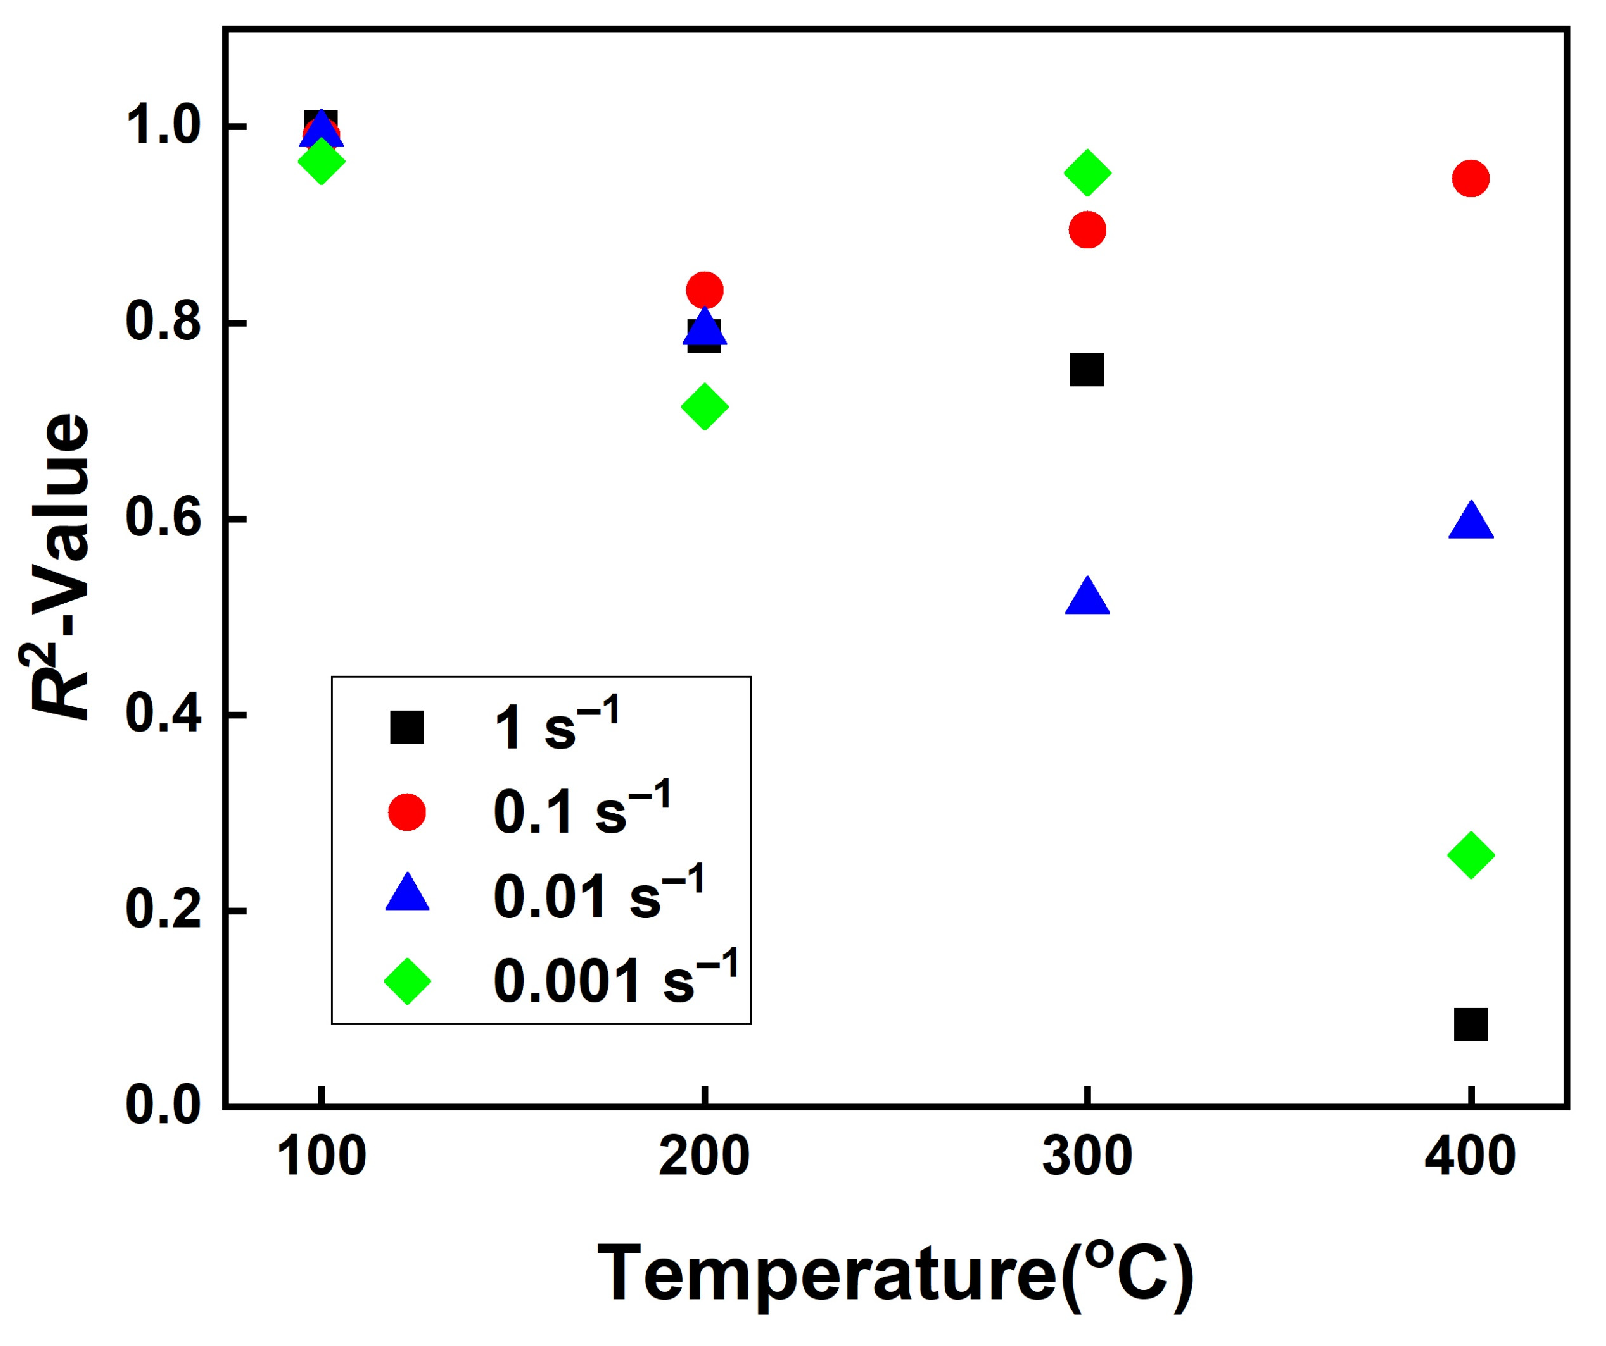
where E i is the experimental stress and P i is the calculated stress. E ¯ and P ¯ are the mean values. Figure 19 shows R 2 -values at respective deformation conditions during the uniform plastic deformation region. From Figure 19, it can be seen that the calculated curves agreed well with the measured curves in low temperature and high strain rate conditions, but not in high temperature and low strain rate conditions.

4. Conclusions

  • The 5083M alloy showed a tendency of decreasing peak stress and increasing true strain with increasing temperature and decreasing strain rate. Compared with the commercial 5083 alloy, the 5083M alloy had higher strength and ductility at elevated temperatures. The strain rate sensitivity exponent of the 5083M alloy was also higher, so it is predicted to have better formability.
  • In the 5083M alloy, dynamic recrystallization occurred under the deformation temperature condition of 300 °C or higher, and dynamic restoration occurred by dynamic recovery (DRV) at temperatures below that. At the lowest strain rate condition among the 300 °C conditions, it was observed that the fine equiaxed grains were uniformly distributed, and that the deformation texture remained regardless of the fully recrystallized microstructure.
  • After the stretch forming at 400 °C and 0.001 s−1 condition, cavities with complex shapes were observed at grain boundaries and grain triple junctions. These cavities were formed by grain boundary sliding which operates as deformation mechanism under the high temperature and low strain rate conditions. As a result, the formation of the cavities resulted in a decrease in ductility under the 400 °C and 0.001 s−1 condition.
  • From the results of stretch forming conducted under various process conditions, a constitutive equation for predicting the deformation behavior of the 5083M alloy was derived. The calculated curves were in good agreement with the measured curves in low temperature and high strain rate conditions. However, due to the limitation of the Field–Backofen equation, the strain hardening region was predicted well, but the softening region was not. Future work needs to be done for predicting the softening region using the modified Fields–Backofen equation containing softening parameters.
  • The superior mechanical properties of the 5083M alloy over the commercial 5083 alloy may provide more effective weight reduction in the automotive industry. In addition, the better ductility will make it possible to apply the 5083M alloy to more complex shaped parts such as inner panels of moving modules (e.g., door, hood, trunk lid, etc.).

Author Contributions

Conceptualization, S.-Y.Y. and B.-H.K.; methodology, S.-Y.Y.; software, S.-Y.Y. and D.-B.L.; validation, S.-Y.Y. and B.-H.K.; formal analysis, S.-Y.Y., K.-H.C., and B.-H.K.; investigation, S.-Y.Y.; resources, S.-Y.Y., Y.-O.Y., B.-H.K., and S.K.K.; data curation, S.-Y.Y. and N.-S.K.; writing—original draft preparation, S.-Y.Y.; writing—review and editing, S.-H.H., Y.-O.Y., and H.-K.L.; visualization, S.-Y.Y.; supervision, S.K.K. and Y.-J.K.; project administration, B.-H.K.; funding acquisition, S.K.K. All authors have read and agreed to the published version of the manuscript.

Funding

This research was funded by Korea Institute of Industrial Technology, Internal Budget.

Institutional Review Board Statement

Not applicable.

Informed Consent Statement

Not applicable.

Data Availability Statement

Data available in a publicly accessible repository.

Conflicts of Interest

The authors declare no conflict of interest.

References

  1. Bariani, P.F.; Bruschi, S.; Ghiotti, A.; Michieletto, F. Hot Stamping of AA5083 Aluminium Alloy Sheets. CIRP Ann. 2013, 62, 251–254. [Google Scholar] [CrossRef]
  2. Kabirian, F.; Khan, A.S.; Pandey, A. Negative to Positive Strain Rate Sensitivity in 5xxx Series Aluminum Alloys: Experiment and Constitutive Modeling. Int. J. Plast. 2014, 55, 232–246. [Google Scholar] [CrossRef]
  3. Nam, T.-H.; Kim, S.-H.; Kim, J.-G.; Kim, S.-K. Corrosion Resistance of Extruded Mg–3Al–1Zn Alloy Manufactured by Adding CaO for the Replacement of the Protective Gases. Mater. Corros. 2014, 65, 577–581. [Google Scholar] [CrossRef]
  4. Jung, I.-H.; Lee, J.K.; Kim, S.K. Mg-Ca Alloys Produced by Reduction of CaO: Understanding of ECO-Mg Alloy Production. Met. Mater. Trans. B 2017, 48, 1073–1078. [Google Scholar] [CrossRef]
  5. Lee, T.W.; Park, H.W.; Lim, H.; Kim, S.K.; Lim, S.H. Microstructural Characterization of Oxide Layers in CaO Added AZ31 Mg Alloy. J. Alloys Compd. 2017, 714, 397–408. [Google Scholar] [CrossRef]
  6. Schulthess, T.C.; Turchi, P.E.A.; Gonis, A.; Nieh, T.-G. Systematic Study of Stacking Fault Energies of Random Al-Based Alloys. Acta Mater. 1998, 46, 2215–2221. [Google Scholar] [CrossRef]
  7. Rohatgi, A.; Vecchio, K.S.; Gray, G.T. The Influence of Stacking Fault Energy on the Mechanical Behavior of Cu and Cu-Al Alloys: Deformation Twinning, Work Hardening, and Dynamic Recovery. Met. Mat. Trans. A 2001, 32, 135–145. [Google Scholar] [CrossRef]
  8. Lee, B.-H.; Kim, S.-H.; Park, J.-H.; Kim, H.-W.; Lee, J.-C. Role of Mg in Simultaneously Improving the Strength and Ductility of Al–Mg Alloys. Mater. Sci. Eng. A 2016, 657, 115–122. [Google Scholar] [CrossRef]
  9. Huang, K.; Logé, R.E. A Review of Dynamic Recrystallization Phenomena in Metallic Materials. Mater. Des. 2016. [Google Scholar] [CrossRef]
  10. Maeno, T.; Mori, K.; Yachi, R. Hot Stamping of High-Strength Aluminium Alloy Aircraft Parts Using Quick Heating. CIRP Ann. 2017, 66, 269–272. [Google Scholar] [CrossRef]
  11. Neugebauer, R.; Altan, T.; Geiger, M.; Kleiner, M.; Sterzing, A. Sheet Metal Forming at Elevated Temperatures. CIRP Ann. 2006, 55, 793–816. [Google Scholar] [CrossRef]
  12. Li, D.; Ghosh, A. Tensile Deformation Behavior of Aluminum Alloys at Warm Forming Temperatures. Mater. Sci. Eng. A 2003, 352, 279–286. [Google Scholar] [CrossRef]
  13. Toros, S.; Ozturk, F. Modeling Uniaxial, Temperature and Strain Rate Dependent Behavior of Al–Mg Alloys. Comput. Mater. Sci. 2010, 49, 333–339. [Google Scholar] [CrossRef]
  14. Hua, L.; Meng, F.; Song, Y.; Liu, J.; Qin, X.; Suo, L. A Constitutive Model of 6111-T4 Aluminum Alloy Sheet Based on the Warm Tensile Test. J. Mater. Eng. Perform. 2014, 23, 1107–1113. [Google Scholar] [CrossRef]
  15. Wang, H.; Luo, Y.; Friedman, P.; Chen, M.; Gao, L. Warm Forming Behavior of High Strength Aluminum Alloy AA7075. Trans. Nonferrous Met. Soc. China 2012, 22, 1–7. [Google Scholar] [CrossRef]
  16. Li, D.; Ghosh, A.K. Biaxial Warm Forming Behavior of Aluminum Sheet Alloys. J. Mater. Process. Technol. 2004, 145, 281–293. [Google Scholar] [CrossRef]
  17. Geng, P.; Qin, G.; Zhou, J.; Zou, Z. Hot Deformation Behavior and Constitutive Model of GH4169 Superalloy for Linear Friction Welding Process. J. Manuf. Process. 2018, 32, 469–481. [Google Scholar] [CrossRef]
  18. Ha, S.-H.; Yoon, Y.-O.; Kim, B.-H.; Lim, H.-K.; Lee, T.-W.; Lim, S.-H.; Kim, S.K. Oxide Scale Behavior and Surface Protection of Al–Mg Alloys Containing a Trace of Ca. Inter. Met. 2019, 13, 121–129. [Google Scholar] [CrossRef]
  19. Kim, B.-H.; Ha, S.-H.; Yoon, Y.-O.; Lim, H.-K.; Kim, S.K.; Kim, D.-H. Effect of Ca Addition on Selective Oxidation of Al3Mg2 Phase in Al-5 mass% Mg Alloy. Mater. Lett. 2018, 228, 108–111. [Google Scholar] [CrossRef]
  20. Humphreys, F.J.; Hatherly, M. Recrystallization and Related Annealing Phenomena, 1st ed.; Pergamon: Oxford, UK; Tarrytown, NY, USA, 1995; ISBN 978-0-08-041884-1. [Google Scholar]
  21. Dai, Q.; Deng, Y.; Jiang, H.; Tang, J.; Chen, J. Hot Tensile Deformation Behaviors and a Phenomenological AA5083 Aluminum Alloy Fracture Damage Model. Mater. Sci. Eng. A 2019, 766, 138325. [Google Scholar] [CrossRef]
  22. Darras, B.M.; Abed, F.H.; Abdul-Latif, A.; Pervaiz, S. Experimental Investigation of Deformation in 5083 Marine-Grade Aluminum Alloy at Elevated Temperatures. J. Mater. Eng. Perform. 2015, 24, 1663–1668. [Google Scholar] [CrossRef]
  23. Chan, K.C.; Tong, G.Q. Strain Rate Sensitivity of a High-Strain-Rate Superplastic Al6061r20SiC W Composite under Uniaxial and Equibiaxial Tension. Scr. Mater. 2001, 7. [Google Scholar] [CrossRef]
  24. Ozturk, F.; Pekel, H.; Halkaci, H.S. The Effect of Strain-Rate Sensitivity on Formability of AA 5754-O at Cold and Warm Temperatures. J. Mater. Eng. Perform. 2011, 20, 77–81. [Google Scholar] [CrossRef]
  25. Huang, K. Towards the Modelling of Recrystallization Phenomena in Multi-Pass Conditions: Application to 304L Steel. HAL 2012. [Google Scholar] [CrossRef]
  26. Xiao, W.; Wang, B.; Wu, Y.; Yang, X. Constitutive Modeling of Flow Behavior and Microstructure Evolution of AA7075 in Hot Tensile Deformation. Mater. Sci. Eng. A 2018, 712, 704–713. [Google Scholar] [CrossRef]
  27. Sidor, J.J.; Petrov, R.H.; Kestens, L.A.I. Modeling the Crystallographic Texture Changes in Aluminum Alloys during Recrystallization. Acta Mater. 2011, 59, 5735–5748. [Google Scholar] [CrossRef]
  28. Mishin, O.V.; Godfrey, A.; Juul Jensen, D.; Hansen, N. Recovery and Recrystallization in Commercial Purity Aluminum Cold Rolled to an Ultrahigh Strain. Acta Mater. 2013, 61, 5354–5364. [Google Scholar] [CrossRef] [Green Version]
  29. Raj, R.; Ashby, M.F. Intergranular Fracture at Elevated Temperature. Acta Metall. 1975, 23, 653–666. [Google Scholar] [CrossRef]
  30. Du, N.; Bower, A.F.; Krajewski, P.E. Numerical Simulations of Void Growth in Aluminum Alloy AA5083 during Elevated Temperature Deformation. Mater. Sci. Eng. A 2010, 527, 4837–4846. [Google Scholar] [CrossRef]
  31. Langdon, T.G. A Unified Approach to Grain Boundary Sliding in Creep and Superplasticity. Acta Metall. Mater. 1994, 42, 2437–2443. [Google Scholar] [CrossRef]
  32. McNelley, T.R.; Oh-Ishi, K.; Zhilyaev, A.P.; Swaminathan, S.; Krajewski, P.E.; Taleff, E.M. Characteristics of the Transition from Grain-Boundary Sliding to Solute Drag Creep in Superplastic AA5083. Met. Mat. Trans. A 2008, 39, 50–64. [Google Scholar] [CrossRef]
  33. Boydon, J.F. Study of Cavitation and Failure Mechanisms of a Superplastic 5083 Aluminum Alloy; Naval Postgraduate School: Monterey, CA, USA, 2003. [Google Scholar]
  34. Cheng, Y.Q.; Zhang, H.; Chen, Z.H.; Xian, K.F. Flow Stress Equation of AZ31 Magnesium Alloy Sheet during Warm Tensile Deformation. J. Mater. Process. Technol. 2008, 208, 29–34. [Google Scholar] [CrossRef]
  35. Tsao, L.C.; Wu, H.Y.; Leong, J.C.; Fang, C.J. Flow Stress Behavior of Commercial Pure Titanium Sheet during Warm Tensile Deformation. Mater. Des. 2012, 34, 179–184. [Google Scholar] [CrossRef]
  36. Ling, C.P.; McCormick, P.G. Constitutive modelling of strain rate sensitivity. In Advances in Engineering Plasticity and Its Applications; Lee, W.B., Ed.; Elsevier: Oxford, UK, 1993; pp. 217–222. ISBN 978-0-444-89991-0. [Google Scholar]
  37. Guo, Z.; Saunders, N.; Schillé, J.P.; Miodownik, A.P. Modelling high temperature flow stress curves of titanium alloys. In Proceedings of the MRS International Materials Research Conference, Chongqing, China, 9–12 June 2008. [Google Scholar]
Figure 1. (a) Geometry and (b) picture of the tensile specimen (length unit: mm) (TD = Transverse Direction, RD = Rolling Direction).
Metals 11 00410 g001
Figure 2. Engineering stress–strain curves of the 5083M alloy at temperatures of 100–400 °C and at the strain rates of (a) 1 s−1, (b) 0.1 s−1, (c) 0.01 s−1, and (d) 0.001 s−1 with the picture of tested specimens (100 °C, 200 °C, 300 °C, and 400 °C conditions from the top).
Metals 11 00410 g002
Figure 3. Flow stress–strain curves of the 5083M alloy at temperature of 100–400 °C and at the strain rate of (a) 1 s−1, (b) 0.1 s−1, (c) 0.01 s−1, and (d) 0.001 s−1.
Metals 11 00410 g003
Figure 4. Variation of (a) peak stress and (b) true strain with the deformation temperature at different strain rate conditions.
Metals 11 00410 g004
Figure 5. Comparison of mechanical properties and strain rate sensitivity exponent of the 5083M alloy with commercial 5083 alloys under the strain rate condition of 0.1 s−1. (a) True strain, (b) true stress, and (c) strain rate sensitivity exponent (m-value).
Metals 11 00410 g005
Figure 6. Polarized optical image of as-cold rolled 5083M alloy.
Metals 11 00410 g006
Figure 7. Polarized optical images of specimens tested at 0.001 s−1 and (a) 100 °C, (b) 200 °C, (c) 300 °C, and (d) 400 °C.
Metals 11 00410 g007
Figure 8. Electron backscattered diffraction (EBSD) inverse pole figure (IPF) maps and overlapped image quality (IQ) map (top left, black line–high angle grain boundaries, blue line–low angle grain boundaries) of specimens tested at (a) 200 °C and 0.001 s−1, (b) 300 °C and 1 s−1, and (c) 300 °C and 0.001 s−1. (ND = Normal Direction).
Metals 11 00410 g008aMetals 11 00410 g008b
Figure 9. Orientation distribution functions (ODF) images of specimens tested at (a) 200 °C and 0.001 s−1, (b) 300 °C and 1 s−1, and (c) 300 °C and 0.001 s−1.
Metals 11 00410 g009
Figure 10. Cavity distribution of specimens tested at (a) 300 °C and 0.001 s−1, (b) 400 °C and 0.01 s−1, and (c) 400 °C and 0.001 s−1.
Metals 11 00410 g010
Figure 11. Etched microstructure of specimen tested at 400 °C and 0.001 s−1.
Metals 11 00410 g011
Figure 12. Relationship between n-value and (a) logarithmic strain rate and (b) reciprocal of temperature.
Metals 11 00410 g012
Figure 13. Relationship between parameter D and reciprocal of temperature.
Metals 11 00410 g013
Figure 14. Relationship between logarithmic true stress and logarithmic strain rate.
Metals 11 00410 g014
Figure 15. Relationship between m-value and temperature.
Metals 11 00410 g015
Figure 16. Relationship between K-value and (a) logarithmic strain rate and (b) reciprocal of temperature.
Metals 11 00410 g016
Figure 17. Relationship between parameter D and reciprocal of temperature.
Metals 11 00410 g017
Figure 18. Comparison between calculated and experimented flow stress–strain curves at temperature of 100–400 °C and at the strain rate of (a) 1 s−1, (b) 0.1 s−1, (c) 0.01 s−1, and (d) 0.001 s−1. (the dotted lines are calculated curves).
Metals 11 00410 g018
Figure 19. R 2 -values at different deformation conditions.
Metals 11 00410 g019
Table 1. Chemical compositions of the 5083M alloy and commercial 5083 alloy.
AlloySiFeMgTiAl
5083M alloy0.10.26.00.01Bal.
Commercial 5083 alloy0.4–0.70.44.0–4.90.15Bal.
Table 2. Values of A at different deformation temperature.
Temperature (°C)A
1000.00146
2000.03768
3000.08190
4000.00328
Table 3. Values of B and C at different strain rate conditions.
Strain Rate (s–1)BC
1106.53624−0.06496
0.1217.12627−0.30150
0.01189.16917−0.22690
0.001216.72551−0.31252
Table 4. m-values of the 5083M alloy at temperatures of 100–400 °C.
Temperature (°C)m-Value
1000.00239
2000.05147
3000.12580
4000.21823
Table 5. Values of A at different deformation temperature.
Temperature (°C)A
10052.35672
20031.06404
30011.31608
4008.82928
Table 6. Values of B and C at different strain rate conditions.
Strain Rate (s–1)BC
1559,474.49203−710.28342
0.1510,270.09992−587.19311
0.01486,071.28817−541.91309
0.001438,505.99469−466.32879
Publisher’s Note: MDPI stays neutral with regard to jurisdictional claims in published maps and institutional affiliations.