Article

Innovative Methodology for the Identification of the Most Suitable Additive Technology Based on Product Characteristics

Department of Engineering for Innovation, University of Salento, Via per Arnesano, Building “O”, 73100 Lecce, Italy
*
Author to whom correspondence should be addressed.
Metals 2021, 11(3), 409; https://doi.org/10.3390/met11030409
Submission received: 14 December 2020 / Revised: 14 February 2021 / Accepted: 21 February 2021 / Published: 2 March 2021
(This article belongs to the Special Issue Additive Manufacturing Research and Applications)

Abstract

:
This paper reports the study and development case of an innovative application of the Cloud Manufacturing paradigm. Based on the definition of an appropriate web-based application, the infrastructure is able to connect the possible client requests and the relative supply chain product/process development capabilities and then attempt to find the best available solutions. In particular, the main goal of the developed system, called AMSA (Additive Manufacturing Spare parts market Application), is the definition of a common platform to supply different kinds of services that have the following common reference points in the Additive Manufacturing Technologies (DFAM, Design For Additive Manufacturing): product development, prototypes, or small series production and reverse engineering activities to obtain Computer-Aided Design (CAD) models starting from a physical object. The definition of different kinds of services allows satisfying several client needs such as innovative product definition characterized by high performance in terms of stiffness/weight ratio, the possibility of manufacturing small series, such as in the motorsport field, and the possibility of defining CAD models for the obsolete parts for which the geometrical information is missed. The AMSA platform relies on the reconfigurable supply chain that is dynamic, and it depends on the client needs. For example, when the client requires the manufacture of a small series of a component, AMSA allows the technicians to choose the best solutions in terms of delivery time, price, and logistics. Therefore, the suppliers that contribute to the definition of the dynamic supply chain have an important role. For these reasons, the AMSA platform represents an important and innovative tool that is able to link the suppliers to the customers in the best manner in order to obtain services that are characterized by a high-performance level. Therefore, a provisional model has been implemented that allows filtering the technologies according to suitable performance indexes. A specific aspect for which AMSA can be considered unique is related with the given possibility to access Design for Additive Manufacturing Services through the Web in accordance with the possible additive manufacturing technologies.

1. Introduction

Recently, the manufacturing sector has seen several changes in its own reference markets. These changes are linked to different factors such as the advent of new technologies and customer needs. For the first aspect, the advent of new technologies, it has introduced new ways to manufacture products that allow obtaining high flexibility and new possibilities to manufacture components with innovative shapes. In addition to the technologies, the customer needs have assumed a strategic importance because they are going toward high quality levels, high customization, and high complexity of the products, leading from the “Mass Production” model to the “Mass Customization” one. Another important aspect that supports these market changes is the new capabilities that the IoT (Internet of Things) offers. This term is a neologism that refers to an Internet extension toward the world of objects and places, which was introduced by Kevin Ashton in 1999 and further developed by the research agency Gartner [1].
Additive Manufacturing (AM) is defined as “a process of joining materials to make objects from 3D model data, usually layer upon layer, as opposed to subtractive manufacturing methodologies” [2], and it is considered one of the most promising manufacturing technologies, owing mainly to the geometrical flexibility it provides, but also to assets such as production flexibility, lead time reduction for short series production, reduced cradle-to-grave energy usage, and CO2 footprint [3]. With the rise of AM in the last decade, a multitude of processes has become available to engineers, at a much lower cost than previously [4]. This has led to considering AM for manufacturing anything from appliances to automobiles and aircrafts. However, the applicability of AM to such areas is questionable. Moreover, although AM processes share a common approach and thus a few common characteristics, each one of the market-available AM technologies presents its own unique opportunities and limitations [4].
Zaman et al. introduce a generic decision methodology, based on multi-criteria decision-making tools, that will not only provide a set of compromised AM materials, processes, and machines but will also act as a guideline for designers to achieve a strong foothold in the AM industry by providing practical solutions containing design-oriented and feasible material-machine combinations from a current database of 38 renowned AM vendors in the world. An industrial case study, related to aerospace, has also been tested in detail via the proposed methodology [5].
AM has the potential to simultaneously build an object’s material and geometry but considering unlimited potential does not guarantee having unlimited capability. The designers working in the AM industry have to not only concentrate on the types of constraints involved in procedures such as Computer-Aided Design (CAD) and the digitization of its ideas [6], discretization (digital and physical) of the parts to be produced, assessing capabilities of AM machines, and processing of materials to gauge the impact on properties, but they also have to cater for new challenges and requirements associated with metrology and quality control, maintenance, repair and recycling, lack of generic interdependency between materials and processes, limitation in material selection, longer design cycle than manufacturing cycle, surface finishing issues, and post-processing requirements [7,8]. Since the stakeholders in AM industry related to part manufacture are not altering the design completely in the “design phase”, thereby resulting in an increase in the costs incurred both due to manufacturability and production time, it is highly important to address the relationship between manufacturing constraints, customer requirements, and design guidelines so that the overall cost including assembly and logistics is minimized [9].
Colosimo et al. present a cost model to evaluate the economic impact of defects and process instability in metal Additive Manufacturing (AM) [10].
The introduction of new technologies could cause deep changes to the entire supply chain configuration. A new approach designed to understand the importance of supply chain considerations for a suitable technology assessment has been studied. It is aimed at proposing a quantitative model for the evaluation of different structures of supply chains based on different production technologies. In particular, by defining a set of Key Performance Indicators and applying a multi-criteria decision method, a final score is computed, giving important information about both environmental and economic aspects [11,12].
Bikas et al. define a framework to assist non-expert potential users of AM technology with evaluating their specific use cases [13].
Di et al. establish a mathematical cost model to quantify the different cost components in the direct metal laser sintering process, and it is applicable for evaluating the cost performance when adopting dynamic process planning with different layer-wise process parameters. The case study results indicate that 12.73% of the total production cost could be potentially reduced when applying the proposed dynamic process planning algorithm based on the complexity level of geometries. In addition, the sensitivity analysis results suggest that the raw material price and the overhead cost are the two key cost drivers in the current additive manufacturing market [14].
Sustainability aspects and cost efficiency in the product lifecycle have great potential for improvement, so cost models are necessary to assist managers in selecting part-specific allocation strategies for metal spare parts realized in AM.
Ott et al. propose a two-stage model as a basis for decision support in spare part allocation. The first stage introduces a multi-criteria part classification regarding classical criteria as well as criteria referring to AM. The impacts on different spare part allocation strategies such as final stockpiling, conventional spare part production, or AM on demand will be the focus. Based on the first stage, a conceptual model for a comprehensive activity-based cost assessment will be adopted to assess the arising costs that occur for each of the compared allocation strategies [15].
Sabiston et al. expand upon existing mathematical constructs by providing an algorithm to minimize the cost and time associated with additively manufactured parts within a three-dimensional topology optimization framework. The formulation has been constructed in such a manner to accommodate large-scale topology optimization problems, including a filtering scheme requiring minimal storage of additional mesh information and an iterative finite element analysis solver. A rigorous trade-off analysis is conducted to determine the optimal contribution of additive manufacturing factors to minimize build time [16].
Liu et al. present a manufacturing cost constrained topology optimization algorithm considering the laser powder bed additive manufacturing process. The proposed algorithm would provide an opportunity to balance the manufacturing cost while pursuing the superior structural performance through topology optimization [17].
Palanisamy et al. adopt a multi-criteria decision-making (MCDM) technique, namely the best-worst method (BWM), to select the suitable material for the product. This is along with the end user expectations in AM. In the initial phase, the suitable machine to be selected from the available machines is based on the parameters such as cost, accuracy, variety of materials, and material wastage. From the variety of materials, the suitable material was selected based on the respondent requirement. The criteria that had a greater influence on the overall cost of the product manufacture through AM are identified and used. According to the BWM, the criteria to be selected by the decision maker based on the respondent expectations are identified. In the BWM method, pairwise comparisons are carried out between the best and worst criterion suggested by the decision makers, as that leads to the selection of the suitable material [18].
Within a research project, the authors have developed a web-based innovative solution that is able to supply services thanks to innovative technologies such as internet capabilities, additive manufacturing processes, product development know-how, and reverse engineering systems.
This paper aims to report the obtained results thanks to the application of AMSA (Additive Manufacturing Spare parts market Application) methodology to one of the selected case studies in order to validate it also for complex geometries. The aim of the defined methodology is to provide support to the AMSA operator to properly evaluate the selection of suppliers based on the characteristics of the geometry to be created. Therefore, a provisional model has been implemented that allows filtering the technologies according to suitable performance indexes. The AMSA platform is a web-based service developed on the basis of the main guidelines defined by the modern paradigm of Cloud Manufacturing (https://www.amsacloudmanufacturing.it/, accessed on 1 December 2020).
The potential advantages that distinguish this paradigm are the following:
  • Flexibility;
  • Tool to support the decision-making process;
  • Intelligent production “on demand”;
  • Production capacities intended as services.
After a brief description of the case studies, the appropriate Key Performance Indicators (KPIs) have been defined and then calculated for a selected case study in order to simulate the working condition of the AMSA operator, in the attempt to identify the most suitable technologies to adopt for the component production. Starting from the Compatibility Index (CBA, provides a relative compatibility index between the product and the AM machine, which is better described in the Appendix A) results, the components production was therefore started and, once realized, the requirements validation was carried out.
At present, the procedure has been developed and tested with the AMSA test cases, so the different indices values need to be further refined with the print of additional components. The implemented relationships are the result of an analytical interpretation of empirical evaluations matured on the field.

2. AMSA Methodology Description

The AMSA methodology was created with the aim to provide a functional tool, that is integrable within a web platform to favor the selection of the most appropriate additive technologies and/or machinery depending on the product characteristics.
In order to facilitate the inclusion of this platform within the additive market, it was decided to start from market research to evaluate the most commercially interesting context. Following this study, it was decided to concentrate activities on additive technologies aimed at the production of metal components:
  • Selective Laser Melting (SLM)
  • Electron Beam Melting (EBM)
  • Directed Energy Deposition (DED).
In addition, it is worth mentioning that they represent almost 100% of the production capacity present on the market, and the three technologies also ensure the possibility of managing a wide range of product requirements, from the large components proposed by DED processes to the dimensional accuracy obtainable with SLM processes, up to the management of particularly reactive materials thanks to the EBM ones. For each of the above-mentioned technologies, an analytical–parametric model has been developed in order to correlate the main process parameters with product performance in terms of costs quality and mechanical characteristics. The developed models, supported by suitable experimental tests that are able to calibrate and optimize the simulation parameters, have allowed us to identify the most relevant process variables responsible for the additive production success for each technology.
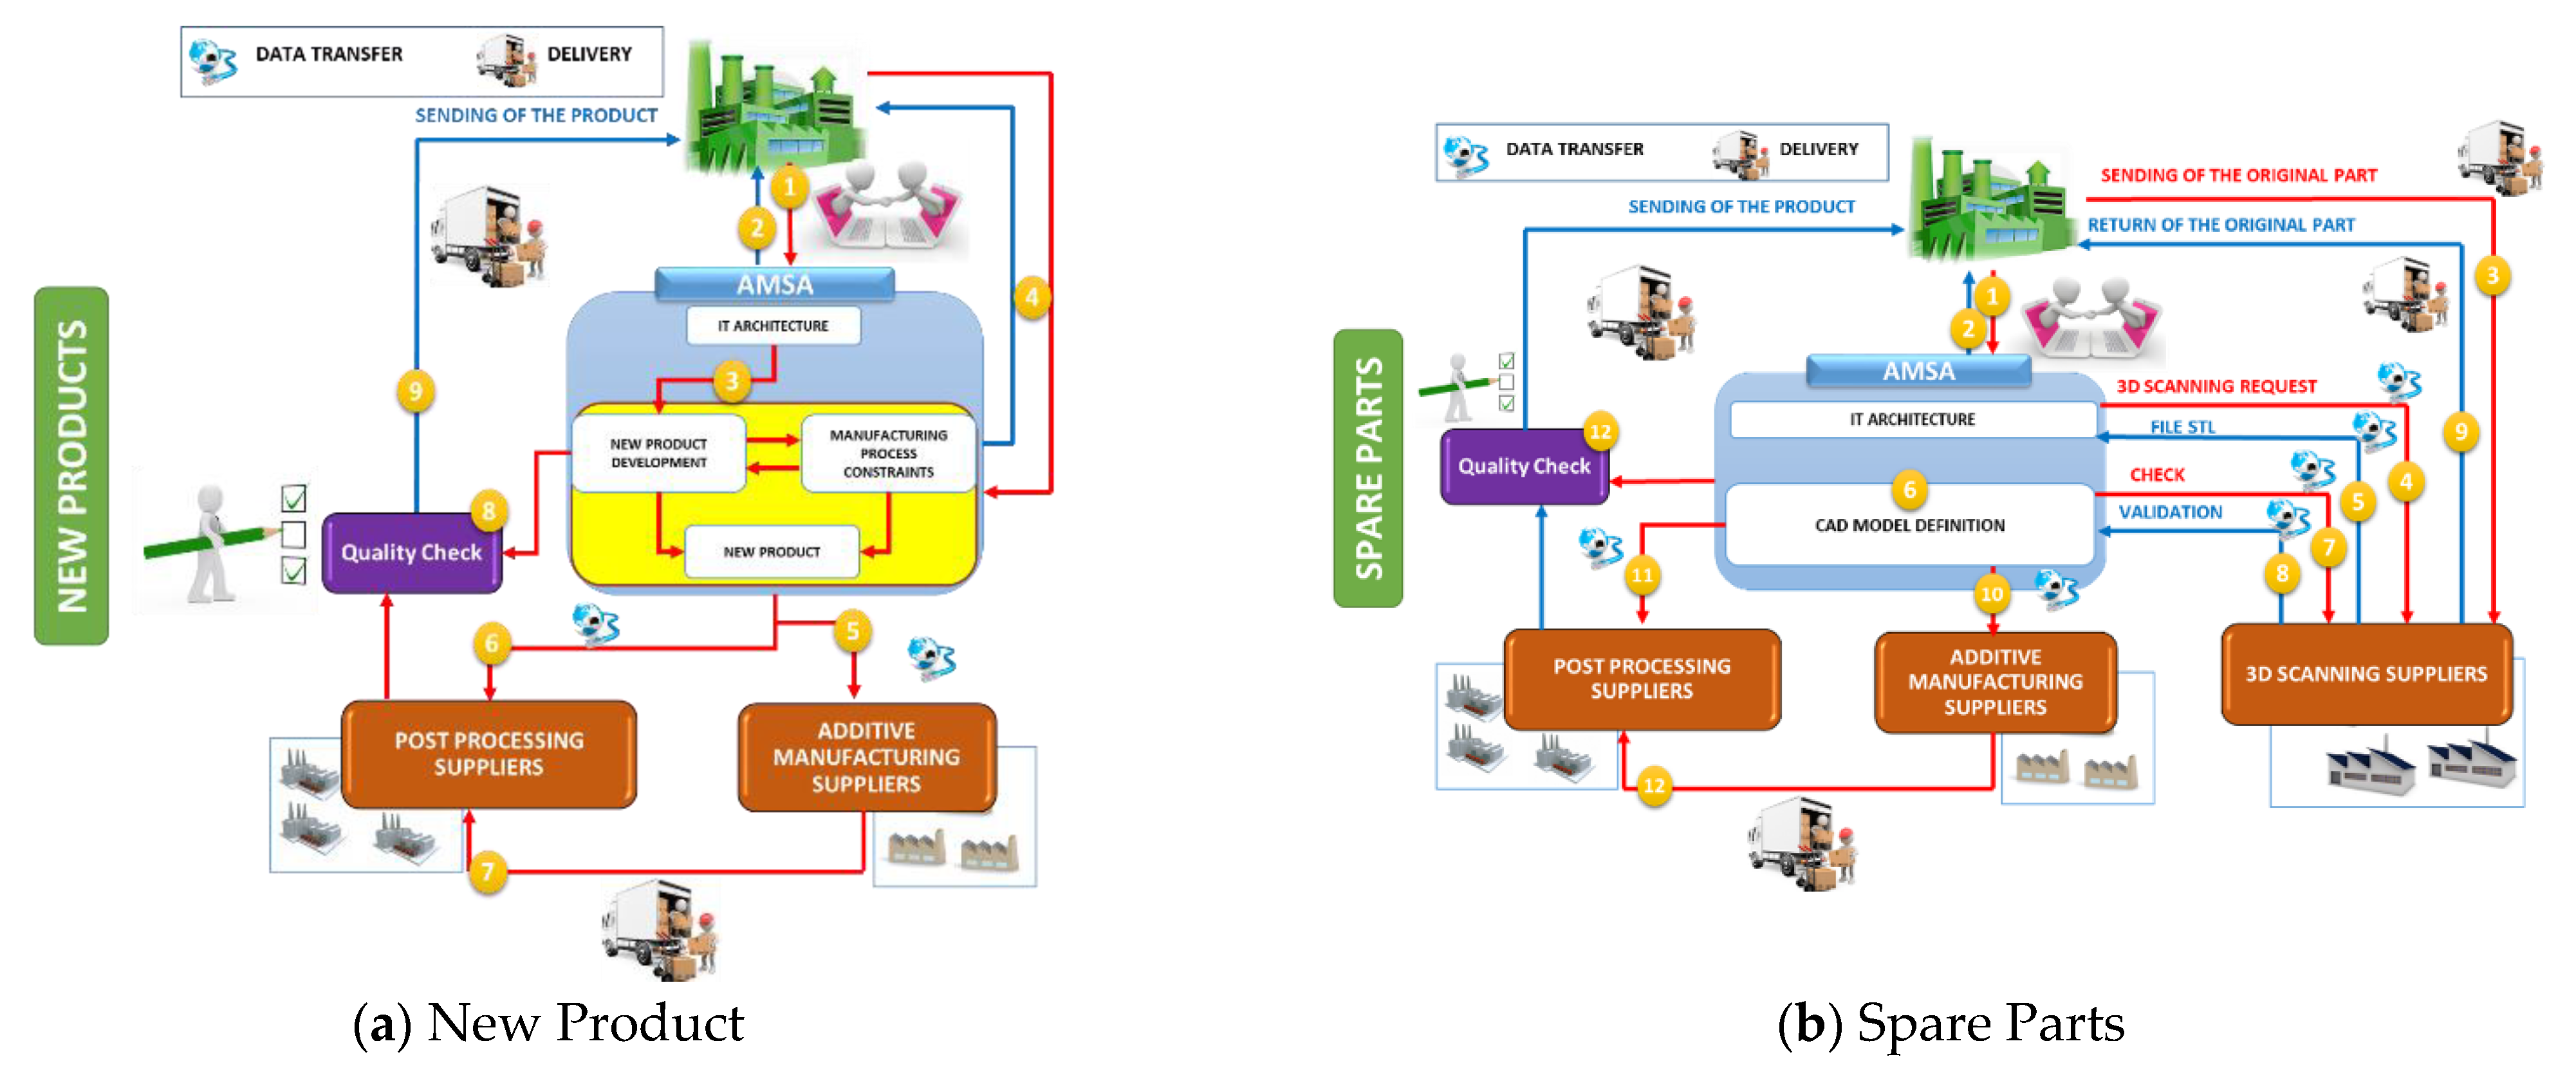
Figure 1 shows the configured supply chains for new products and spare parts. As reported, the supply chain is not fixed, and it varies, taking into account the typology of services. One of the straight points of the AMSA platform is the possibility to adapt the supply chain and the resources to the market changes. AMSA represents also a good opportunity for the suppliers to improve the action range and then their business.
Starting from these results, the AMSA methodology has been developed, with the aim to extrapolate and to create appropriate relationships among different data sources able to provide, for each component to be produced by additive manufacturing, a series of key information:
  • The most suitable technology;
  • The suggested machine type;
  • The production time;
  • The production cost.
Considering the large amount of variables to be managed, it was decided to consider an approach based on the selection of a series of technical KPIs, whose objective is to provide an index of compatibility of each machine type (non-technology) with respect to the requirements of the component to be produced (Table 1).
The technical KPIs have a percentage values from 0 to 100% and different calculation methods depending on the considered case.
Once the KPIs calculation is completed, the platform provides a list of solutions ordered based on a compatibility KPI (CBA), which were obtained as an average (properly weighed) of the other available KPIs. With the compatibility KPI, the platform provides two other fundamental KPIs, which provide a complete summary that is able to facilitate the choice of the most appropriate machinery:
  • Cost KPI (CST): provides an evaluation of the component price to be produced associated with the various machines available in AMSA;
  • Time KPI (TMP): provides an estimate of production times according to the considered technology.
Identification of the technical KPIs, which define the CBA compatibility KPI, has been defined from a comprehensive analysis of the following aspects:
  • The physical and mechanical characteristics of the materials selected for industrial applications;
  • Analytical models selected from what is available in the technical and scientific literature;
  • Analytical–empirical models developed by the research group during previous R&D (Research and Development) activities;
  • Finite Element (FE) models where useful to make the correlation between process parameters and obtainable final results objective;
  • The performance specifications description to be achieved for the selected industrial applications.
Therefore, the final list of the defined technical KPIs is the following:
  • Material evaluation (MAT);
  • Overall dimensions study (ING);
  • Precision analysis (PRE);
  • Resolution analysis (RIS);
  • Roughness analysis (RGS);
  • Study of the undercuts (STQ).
To formulate each one of the KPIs, the research team has tried to take into consideration all the aspects that are evaluated by the specialists during the process design phase for a specific product. These aspects have been correlated with each other in specific flow diagrams and then translated into analytical expressions, which are appropriately calibrated according to a series of experimental results. Figure 2 shows, as an example, the flow chart of the MAT KPI.
In the specific case of the material to be used for the production of the component, it is a direct request from the customer, which must be crossed with the available technologies to verify that it is actually obtainable with the available machines and evaluate any problems related to the timing or processability. MAT KPI is an index between 0 and 1, and has as its objective the expression of the process described in the Figure 1: once the request for an estimate has been received, the material indicated by the customer must be compared with the databases of the machines made available by the AMSA platform to identify the list of those who are actually capable of handling the material. Therefore, the list of machines is ordered according to three criteria:
  • Powder supply time;
  • Time to change material in the machine;
  • Risk of material processability.
Evaluating the aspects highlighted in Figure 1, the following expression of MAT was proposed; the details are provided in the Appendix A.
MAT = θ mat · ( α appr · 1 1 + τ apprw [ g ] + α mt · 1 1 + τ AMmt [ g ] + α fr · ( 2 f r ) )
  • θmat: compatibility between material and machine;
  • αappr: metal powder supply coefficient;
  • τapprw[g]: supply time for metallic powders (days);
  • αmt: material change coefficient;
  • τAMmt[g]: material change time (days);
  • αfr: material processability risk coefficient;
  • fr: risk factor of material processability, which represents a factor for increasing the mass of material required by the process, and it is requested to the supplier.
A clearly different approach was instead reserved for the KPIs of Cost (CST) and Time (TMP), which present particularly complex formulations that are able to take into consideration all the production phases of a product from design to finishing (Figure 3).
In addition, in this case, the complete formulations are provided in Appendix A. With the application of the methodology, appropriately integrated within the AMSA platform, users are therefore able to evaluate the main process aspects and compare them, as described below.
3. Test Cases

  • Automotive manifold (Figure 4): The use case representative of the possible industrial application for the spare part is a manifold that is used in the automotive sector for the discharge of exhausted gas. The product is currently made by welding three different components: a flat base suitably drilled, a truncated cone of connection, and a final neck on which the exhaust pipe is inserted. The welds are clearly visible in the image shown in Figure 4. The material is 316L stainless steel, which is able to withstand the high temperatures of the gas generated by combustion.
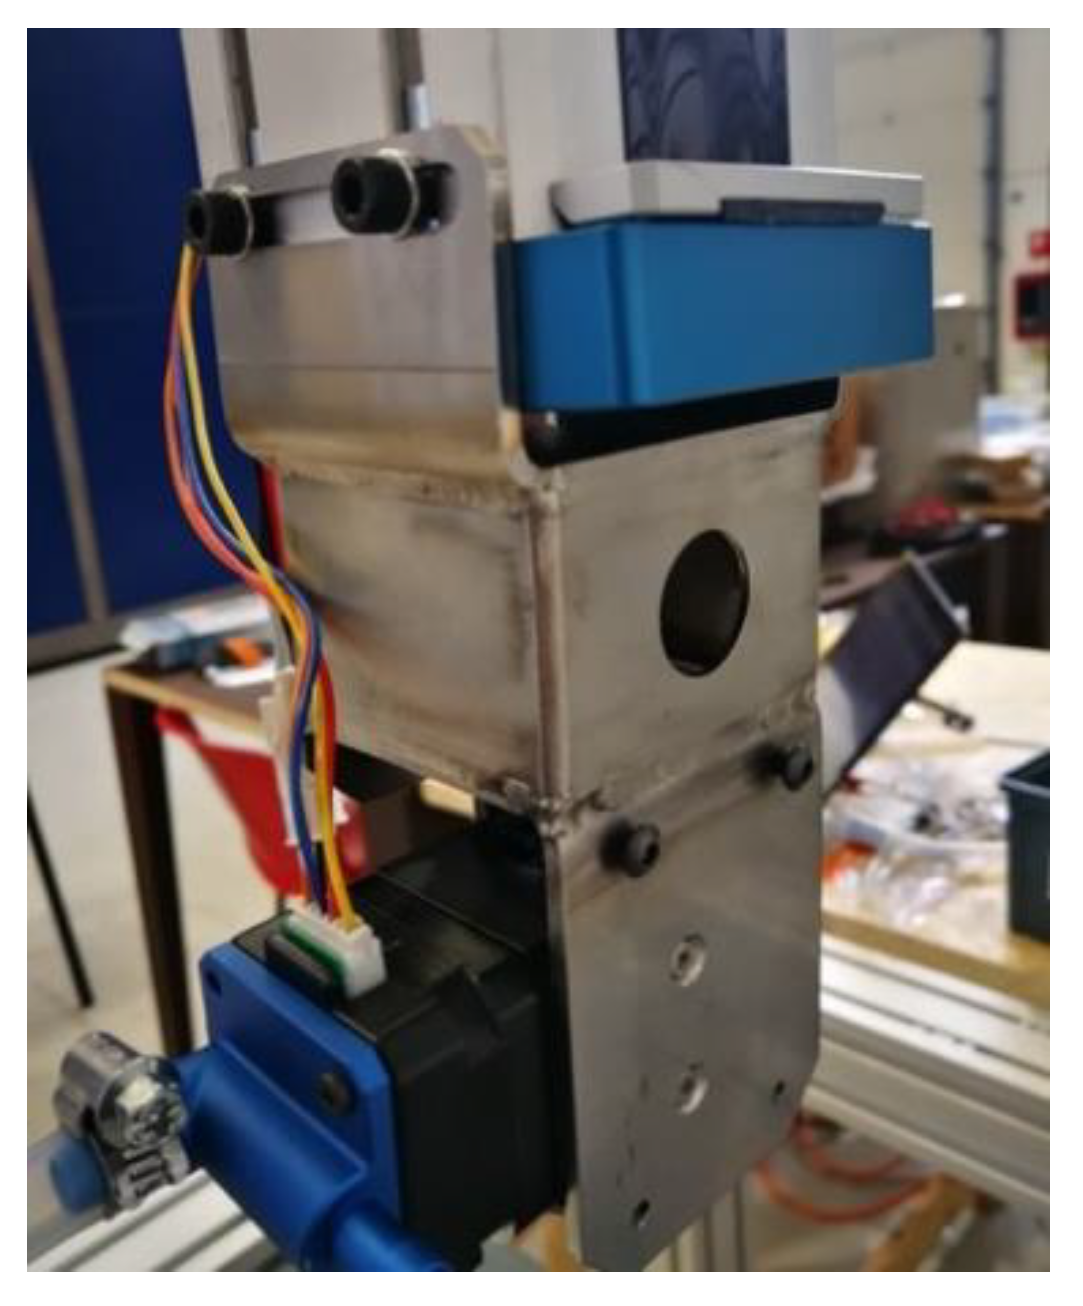
  • Fused Deposition Modeling (FDM) head (Figure 5): The use case identified to represent the classes of components indicated as “new product” and “small series” is an assembly of metal parts welded together, which was designed by the research group to connect an FDM nozzle to the Z-axis of a Cartesian machine carried out within another research project. The prototype works in two different configurations:
    -
    FDM for traditional plastics (PLA, ABS, PP);
    -
    FDM for PEEK in a controlled temperature atmosphere.
The difference between the two configurations consists in the assembly of a heated chamber conveniently sized to guarantee a constant temperature of 120 °C and thus reduce thermal stress due to the additive process to a minimum that can generate important tensions and distortions, such as compromising the correct growth of the component. In the case of PEEK, this minimum requires process temperatures over 350 °C.

4. Methodology Application to the Case Studies

In this section, the KPIs have been calculated based on the three machine types available: DED, SLM, and EBM. As an example, the application of the methodology for the FDM head for traditional plastics is reported.

4.1. KPIs Calculation for the FDM Head for Traditional Plastics

The FDM head for traditional plastics has been made in A357 and must respect defined functional requirements.

4.1.1. MAT KPI

This index evaluates the effects of compatibility between the material requested by the customer and the analyzed AM machine.
The A357 material is compatible with DED and SLM technologies. For this last machine, it represents a “main material”; for this reason, in this case, the supply time and the material change time are equal to zero. The EBM does not manage aluminum alloys because due to working conditions very close to the vacuum, there have been detected cases of material vaporization subjected to electron beam bombardment. This problem has no consequences only from the point of view of the deposition process, but it represents a critical condition also from the point of view of safety, because the vaporized particles generate scattering in the electrons, which are therefore spread uncontrollably inside the chamber. Regarding DED, a rather high-risk coefficient has been inserted, since the aluminum alloys processability has always been particularly problematic with this technology (Table 2).

4.1.2. ING KPI

ING KPI evaluates the compatibility between the dimensions of the component(s) to be produced with respect to the AM machine. The aspects considered by this KPI are as follows:
  • Compatibility between the component overall dimensions and the machine working volume;
  • Convenience of work volume saturation in the case of powder bed processes.
The considered component has dimensions such that it can be processed by all the considered machinery. The lowest value of ING for powder bed technologies derives from the fact that the production of a single piece does not saturate the working volume, which instead happens (for obvious reasons) in the case of DED (Table 3).

4.1.3. PRE KPI

PRE KPI evaluates the compatibility between the precision required by the component and the precision guaranteed by the machine. The aspects considered by the KPI are as follows:
  • Reference precision of the component;
  • Accuracy guaranteed by the machine.
The precision required by the component is compatible only with SLM and EBM technologies; this means that in the case of DED, it is necessary to provide subsequent mechanical processes to ensure that the customer’s requirements are respected (Table 4).

4.1.4. RIS KPI

RIS KPI evaluates the compatibility between the smallest feature of the component and the machine’s capabilities in making it. The aspects considered by the KPI are as follows:
  • The smallest feature dimension in the component;
  • Machine resolution.
The resolution required by the component is compatible with all technologies; therefore, it is not necessary to provide subsequent mechanical processes to remove excess material (Table 5).

4.1.5. RGS KPI

RGS KPI evaluates the compatibility between the roughness required by the component and the roughness obtainable by the AM machine. The aspects considered by the KPI are as follows:
  • Component reference roughness;
  • Roughness guaranteed by the machine.
The roughness required by the component is not compatible with the available machinery for which, for the interested areas by that type of roughness, it is necessary to provide subsequent mechanical processing (Table 6).

4.1.6. STQ KPI

STQ KPI evaluates the compatibility between the undercut surfaces and the capacity of the considered AM machine. The aspects considered by the KPI are as follows:
  • Surface of the undercut areas;
  • Total component surface.
The amount of surfaces in undercut conditions is rather important compared to the total; therefore, the KPI suggests the powder bed technologies that are more easily able to manage it (Table 7).

4.1.7. CST KPI

The objective of this KPI is to provide an indicative economic quotation of the product according to the indicated technology. The aspects considered by the KPI are costs due to the following:
  • Material;
  • Printer usage time;
  • Operator;
  • Geometry complexity.
The CST KPI presents results only for SLM and DED, because the EBM does not support aluminum and the methodology also sets the result of CST to zero. In this case, the value of the DED machine is slightly lower, but the SLM technology provides a valid alternative due to the fact that DED has several disadvantages on aluminum management. In this case, the quantity of lot numbers has its weight: if the lot number had been higher and next to 4 (work volume saturation for SLM), the CST value would clearly favor the SLM machine (Table 8).

4.1.8. TMP KPI

TMP KPI provides an estimation of component delivery time. The aspects considered by the KPI are as follows:
  • Powder supply time;
  • Material change time in the machine;
  • Time for process design;
  • Accessory times for the machine heating and cooling phases;
  • Production time;
  • Machine cleaning time.
This KPI provides an estimate of the lot production times. In the case of EBM, it remains equal to zero because, as already mentioned, it does not support the used material. In the case of the SLM, it is the main material for which TMP only represents the production time equal to about one day. For the DED, on the other hand, it also includes delivery times for the powder that is not in stock (Table 9).

4.1.9. CBA KPI

The compatibility coefficient is represented by the appropriately weighted sum of a series of contributions given by specific KPIs. This last can be analyzed separately by the AMSA technician in the analysis of the estimate quotation, but the values will flow into the CBA calculation, which will be used to order the list of suppliers to be evaluated (Table 10).
It provides a relative Compatibility Index between the product and the considered AM machine.
Indeed, CBA provides an overview of the various KPIs:
  • Both the material and the component overall dimensions are supported by SLM and DED; the material is not supported by the EBM, which is therefore automatically excluded from the CBA calculation.
  • The required precision is manageable only by SLM; therefore, in the case of DED, it is necessary to provide a specific post-processing step.
  • The required resolution is largely managed by all the machines.
  • The required roughness requires post-processing for all machines.
  • There are undercuts; therefore, they should be more easily managed by powder bed technologies.
  • The cost slightly favors the DED, while the production time clearly favors the SLM.
Therefore, the final result of CBA suggests the geometry production by SLM.

5. Methodology Validation

Component production has allowed us to obtain the necessary information for the KPI compilation and therefore the methodology validation.

5.1. FDM Head for Traditional Plastics

According to the KPI results, the head for traditional plastics should be produced by SLM (A357). In the present paper, only the geometry and material analysis are presented, since both the process parameters identification and the CAM development are not the object of the present work.

5.2. Geometry and Material Analysis

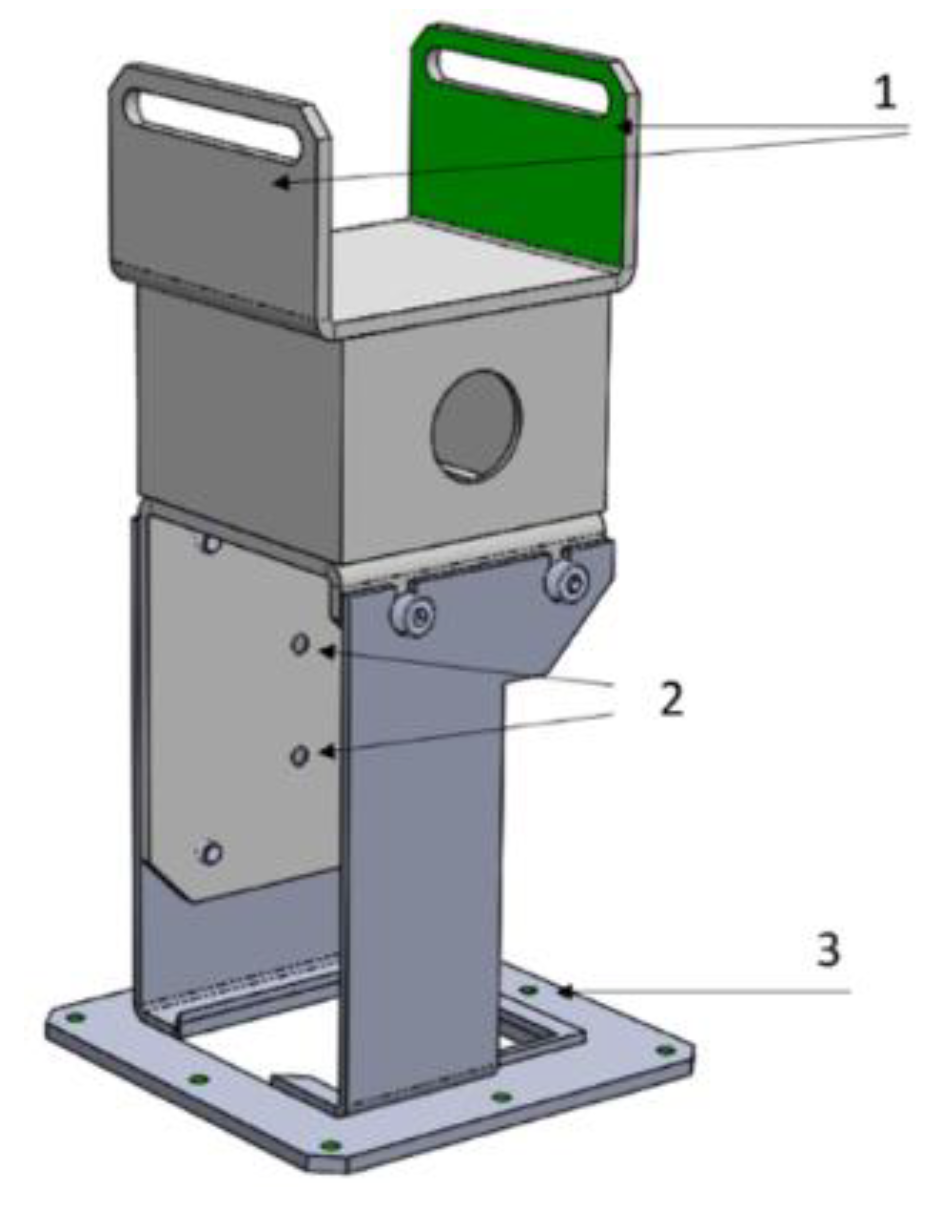
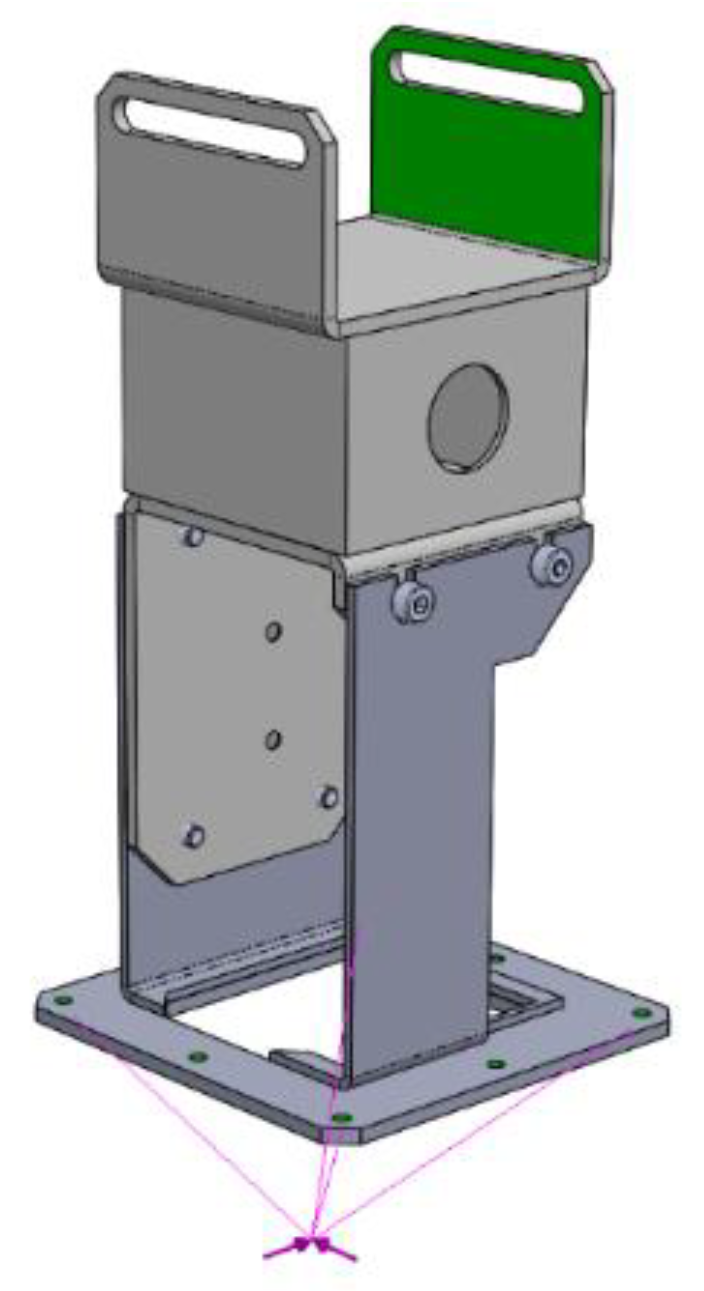
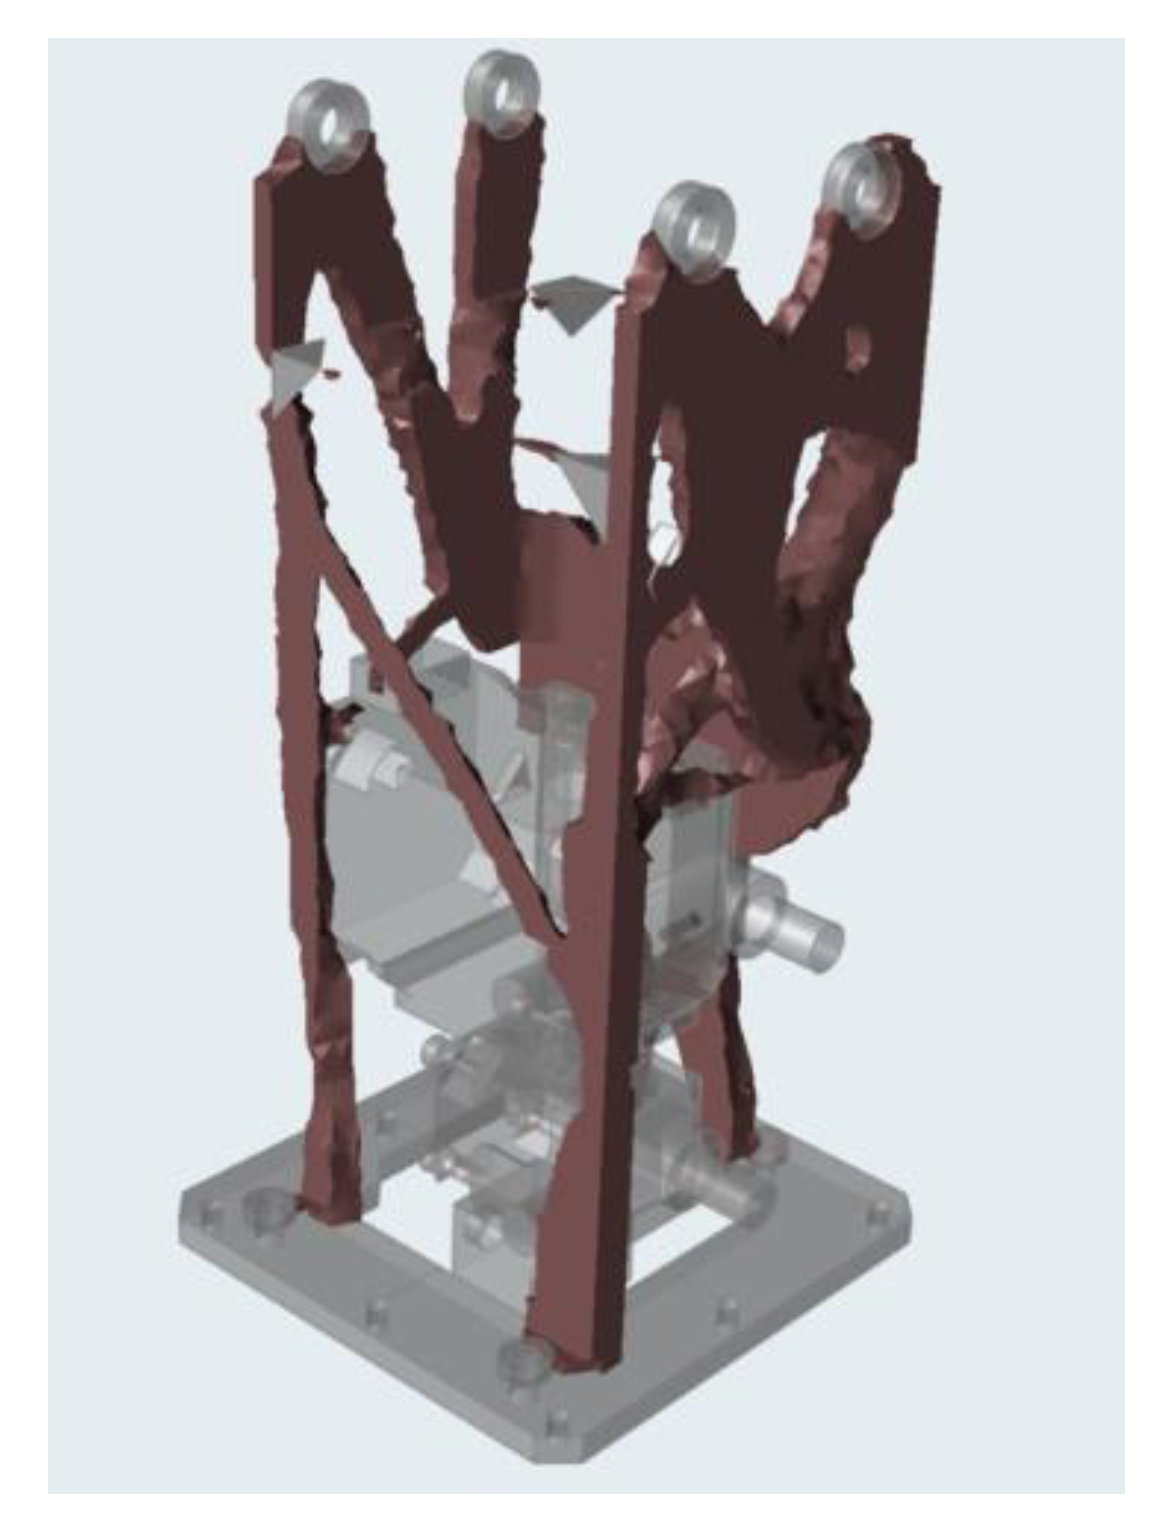
For the FDM head, it has been necessary to proceed with a specific topology optimization phase. The geometry is reported in Figure 6, where two slots are visible in the upper part for the Cartesian Z-axis fixing (1), the holes (2) for the extruder mounting, and the holes (3) for the folding assembly, which protects the aluminum structure from the heat produced by the process chamber. Altair’s INSPIRE® software [19] has been used for topology optimization. The four screw fixings have been constrained to the Z-axis of the Cartesian. As load, we considered the component and extruder weight and the force due to the head movement, which has been applied on the lower plate as an acceleration equal to 0.1 g in the X and Y-directions (Figure 7).
To simplify the component redesign after the optimization, the non-design zones have been remodeled, and the slots for fixing to the Cartesian have become bushings, as well as the holes for extruder fixing (Figure 8). The base plate has been cut by a laser, and to ensure assembly, other bushings have been modeled for coupling screws insertion. Tetra elements have been modeled to maintain a flush between this component and the Z-axis.
Since the base plate must also allow the capacitive sensor to be mounted in the case of PEEK production, and it must necessarily be removable, it was decided to remove it from the “design space” and provide, on the optimized geometry, four holes to ensure this assembly option.
The following optimizations have been realized:
  • Optimization for A357 Aluminum to obtain the head for traditional plastics (SLM—small series);
  • Optimization for Ti6Al4V Titanium to obtain the head for traditional plastics (SLM—new product).
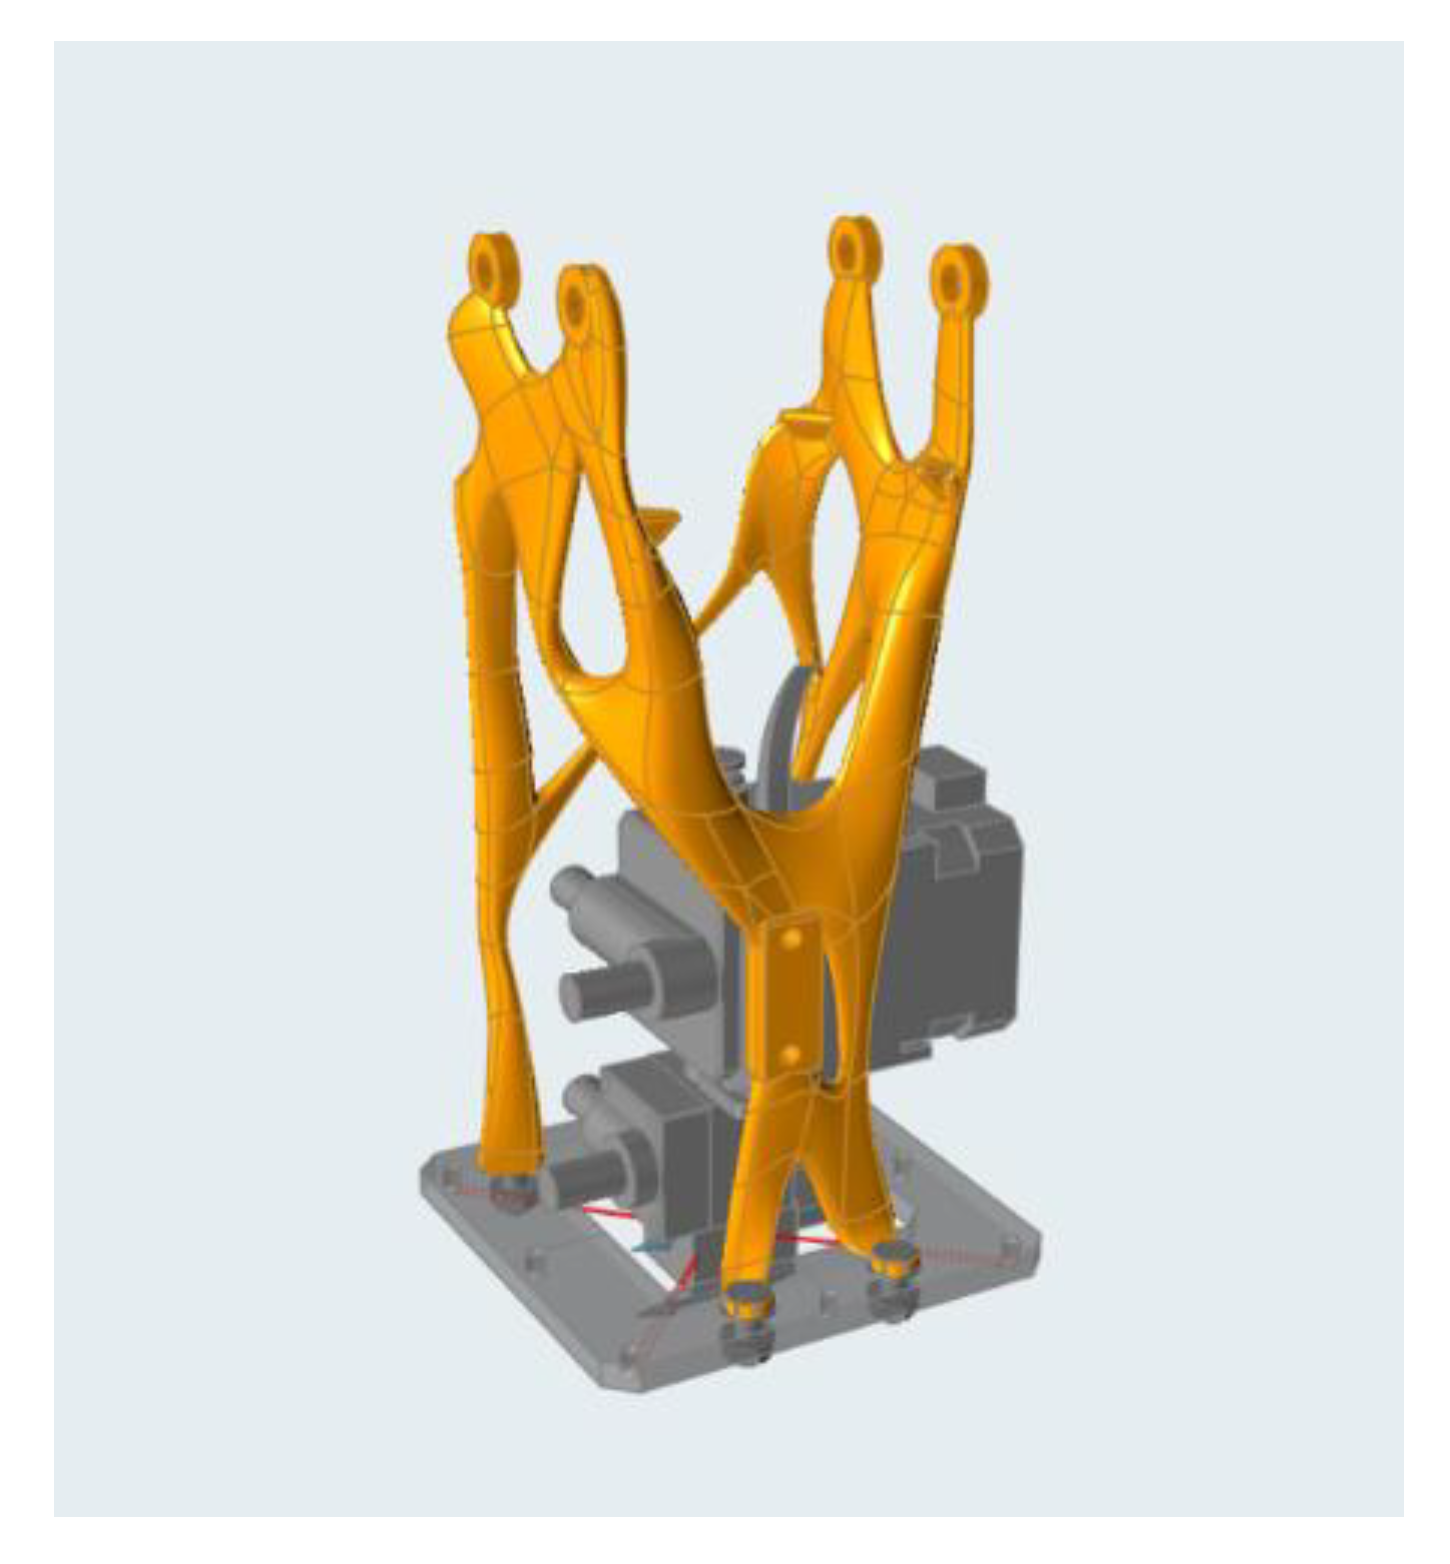
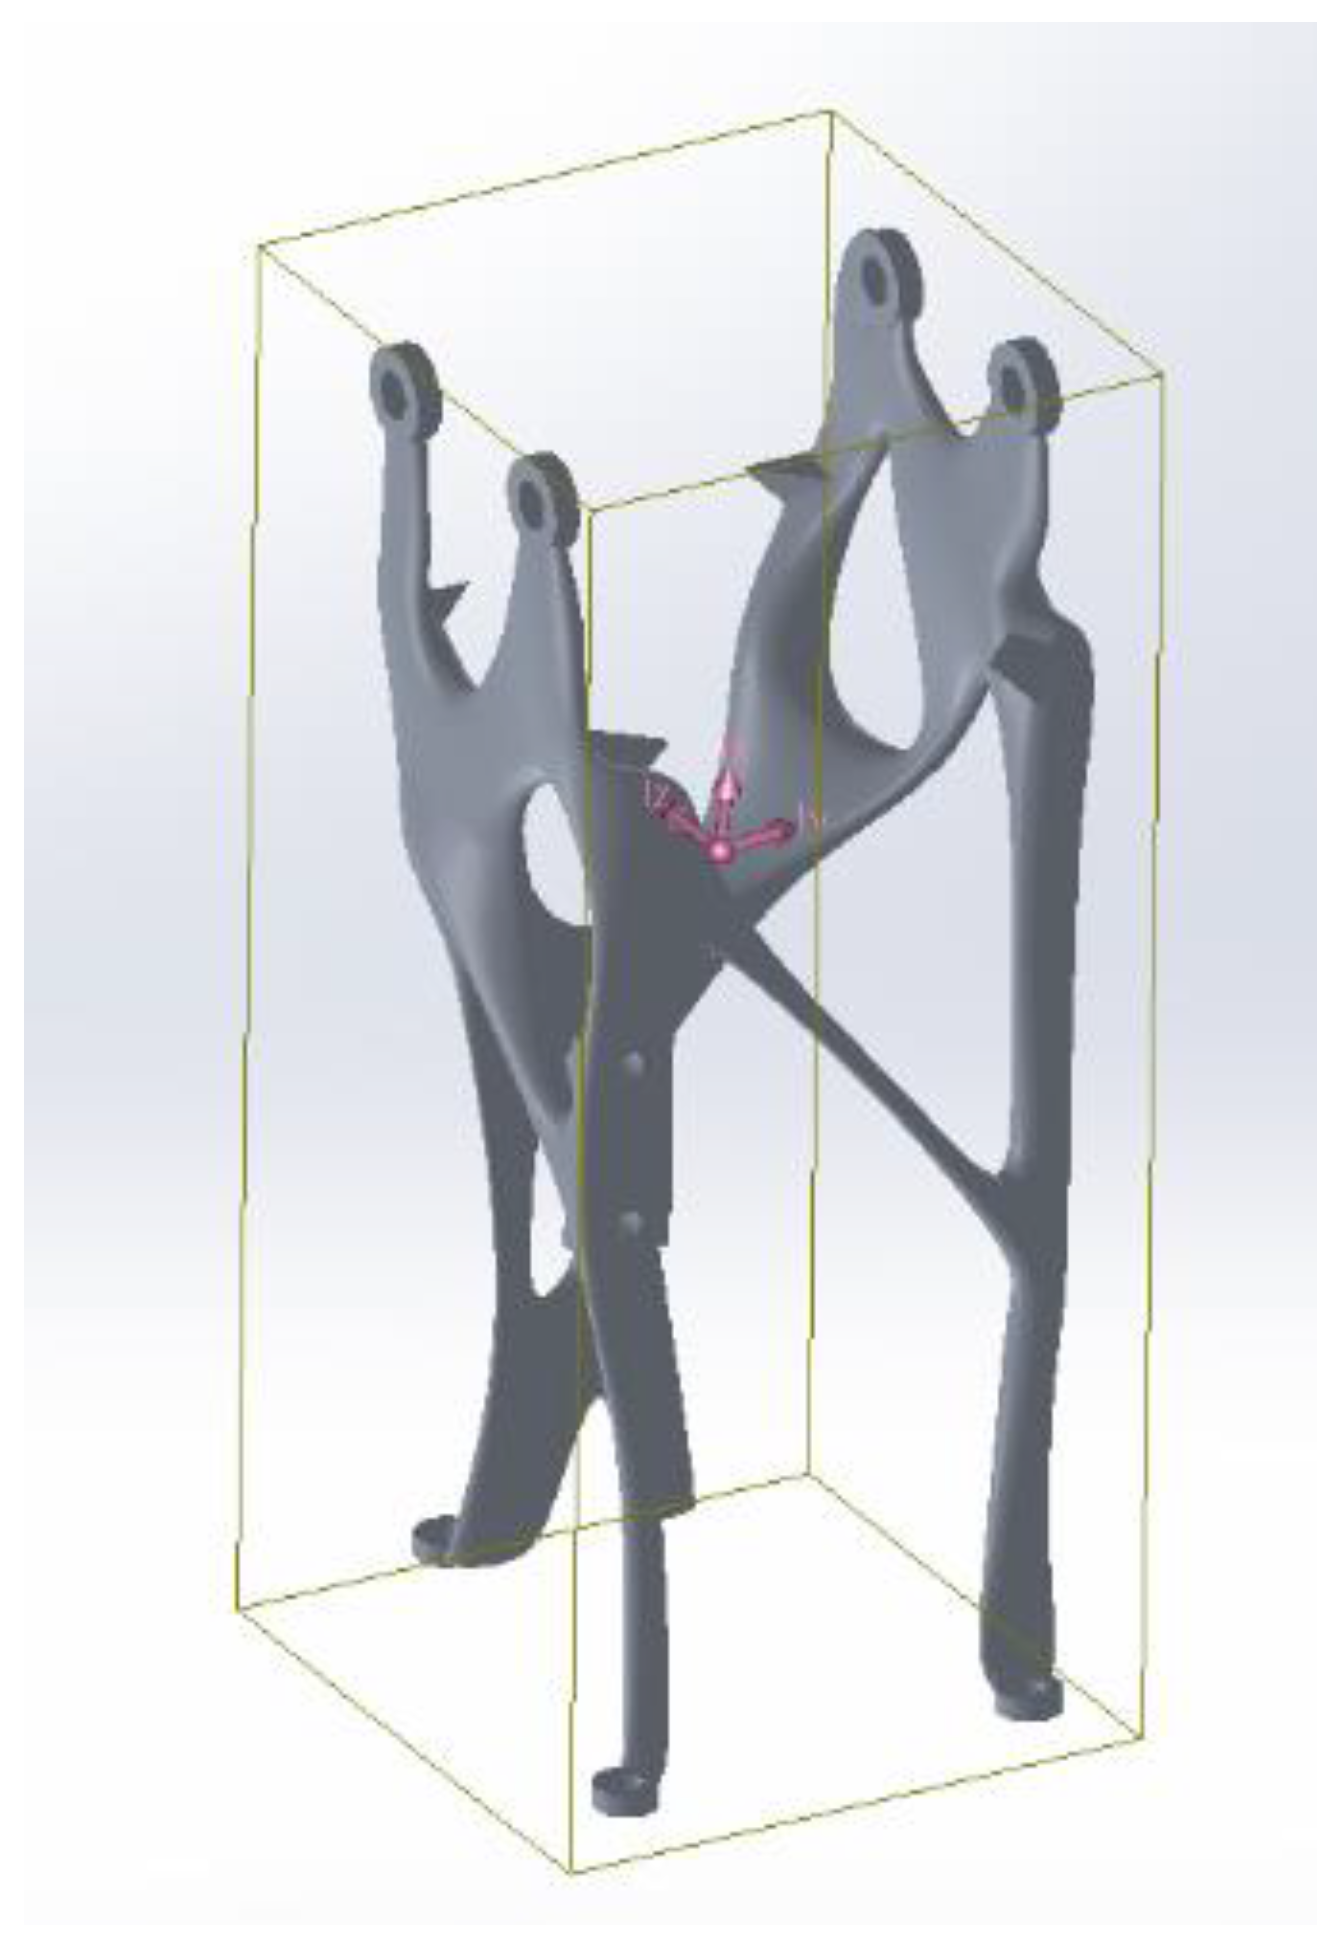
The stiffness maximization has been defined as an objective function. The two results have provided very similar geometries between them, and then, they have been remodeled with Inspire’s PolyNurbs feature, which allows us to “coat” imperfect geometries deriving from topology optimization with more regular shapes, in order to obtain components almost ready for printing (Figure 9). Subsequently, the model has been engineered in the SolidWorks® environment (Figure 10).
Particular attention has been given to the interface areas between the PolyNurbs and the non-design areas: the transition between the two portions of the CAD model must be gradual to avoid the stress concentration in these areas during the printing process.
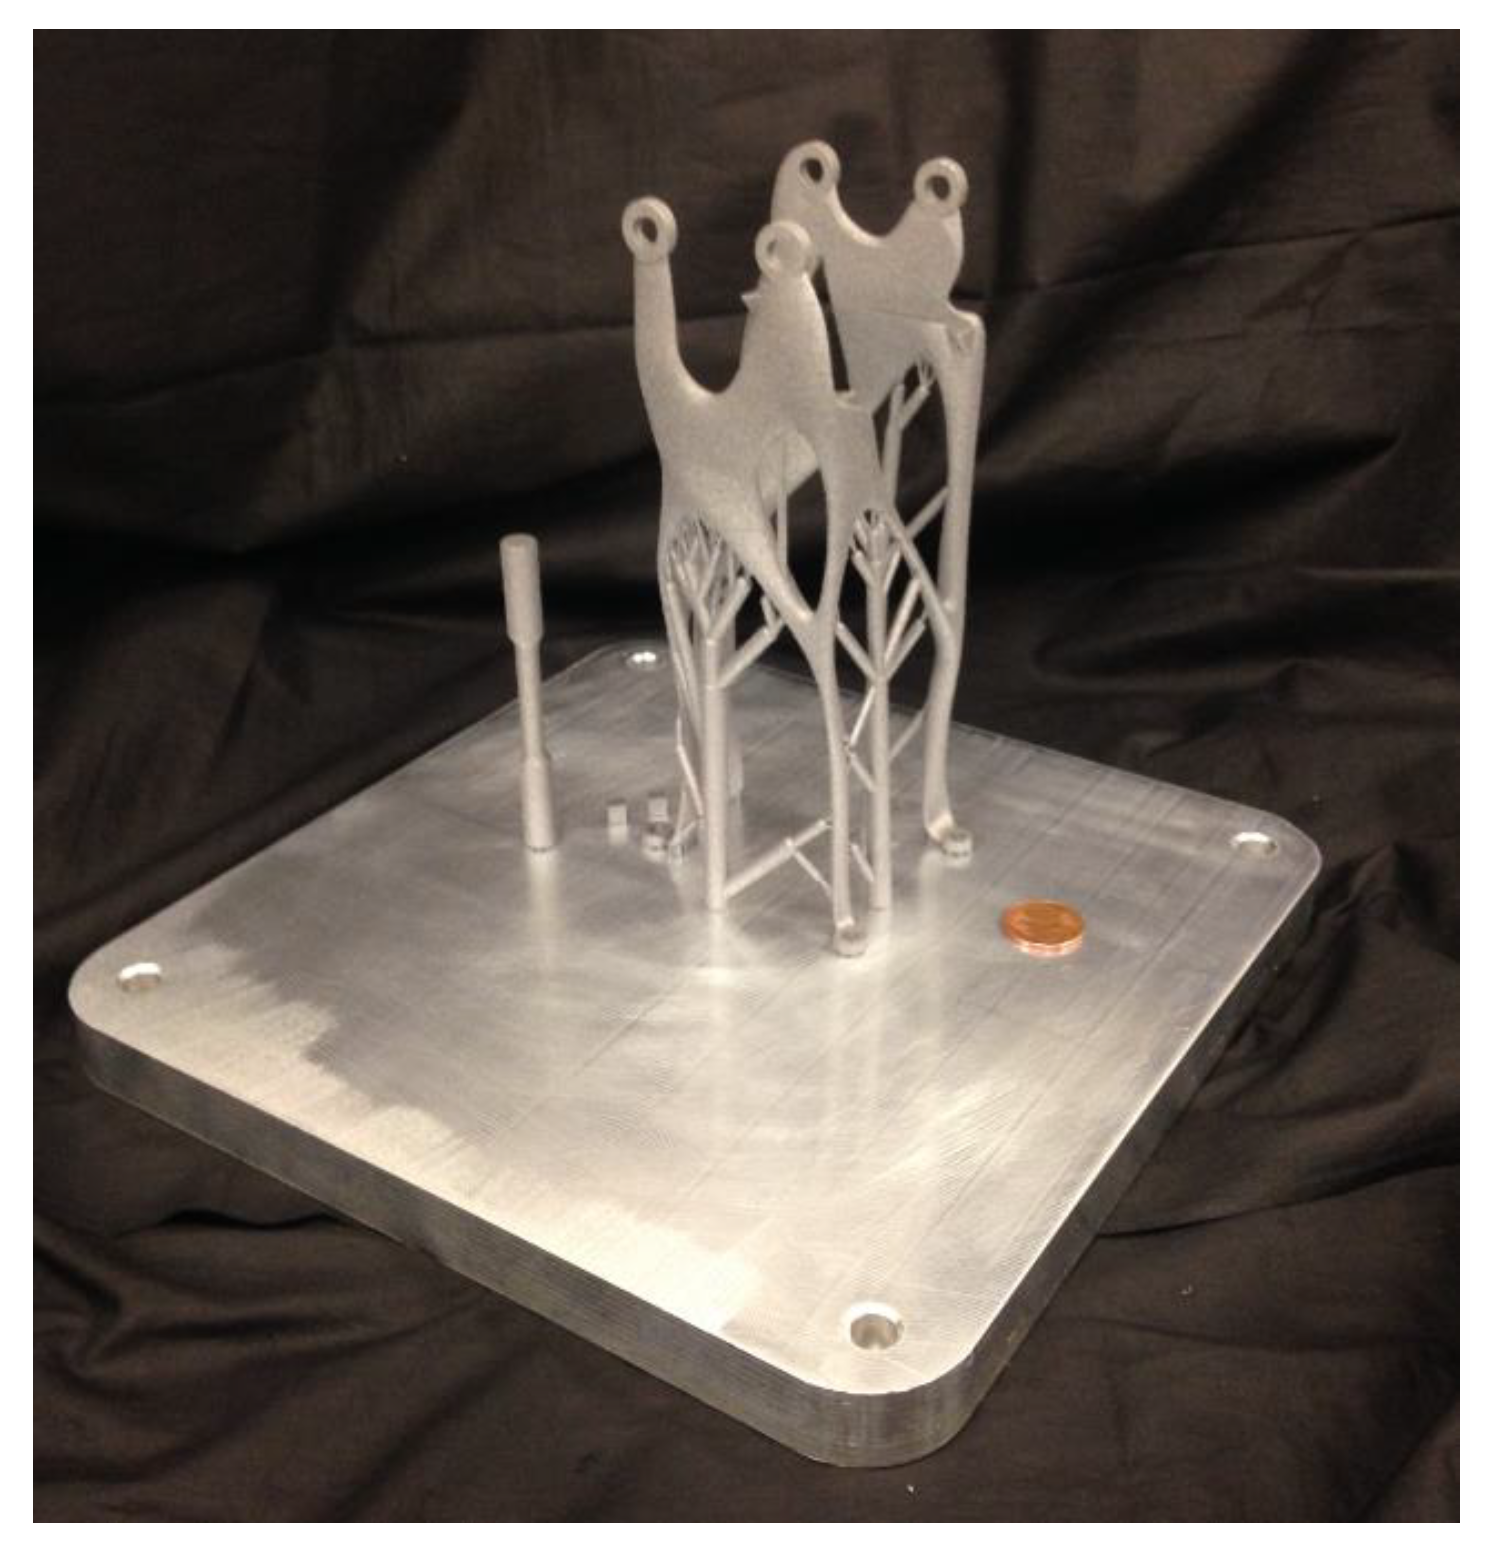
After the CAD modeling, the components were verified again by static analysis to detect any stress concentrations. Figure 11 shows the real component created that was detached from the sacrificial platforms and analyzed to verify the success of the production process.

6. Functional Requirements Verification and KPIs Validation for Small Series (SLM)

The created component has been removed from the sacrificial platforms and analyzed to verify the obtained quality. As can be seen in Table 11, all the positioning tolerances as well as the dimensional tolerances have been respected. The planarity of the reference plans for the head mounting was verified.
However, the holes’ internal surfaces roughness did not respect the reference values, and they have required further processing in order to consider the requirement satisfied. The roughness has been measured and has been equal to 5.2 Ra on the reference plans and 7.7 Ra in the nozzle fixing holes.
Furthermore, the vibrations resistance was verified only from a numerical point of view; in fact, the topological optimization was carried out based on this constraint.
From KPIs validation point of view, it is possible to compare the real data with those predicted by the implemented methodology. Table 10 shows how precision, and undercuts, as expected, were easily managed by technology. It is also confirmed that the roughness was not obtainable with the additive process, and in fact, the process was able to provide a maximum of 5.2 Ra.
Finally, as regards the production cost, a comparison was made with the calculated real results, and a deviation of approximately 3.8% was found. Specifically, considering the number of productive hours of an industrial machine equal to 2800, a cost of €1600 was obtained, compared to the calculated value of €1541 (Table 10).

7. Conclusions

The target of this study has been to evaluate the capabilities of the AMSA methodology considering a defined test case representative of a typical application in order to validate the complex geometries that AMSA service could face. For this reason, the main operations that the AMSA technician could manage for a possible production order request have been simulated. The KPIs have been calculated considering the formulation described in Appendix A.
Starting from the CBA results, the component has been manufactured. After the production, in order to evaluate the AMSA methodology performance, a verification of the functional requirements and the KPI values have been carried out. The obtained results highlight that the AMSA methodology is robust enough to manage complex geometries, and it represents a valid tool for manufacturing engineers during the decision process related to the handling of possible production orders. The procedure has been developed for AMSA test cases, and the different indices values need to be further refined with the printing of additional components.
On the basis of the obtained results, the methodology seems to respond, above all qualitatively, quite well to the variables introduced, even for complex components such as the considered use cases.
From a quantitative point of view, especially as regards the production cost, it would be good to carry out other tests with different geometries in order to have a statistical basis capable of further improving the formulation of the technological coefficients that have a significant weight in the CST calculation. What has been demonstrated certainly represents an important result that can be the starting point for the drafting of real algorithms able to assist the AMSA operator in deciding which technology to use for production, highlighting all the critical aspects that should be kept into account.

Author Contributions

Conceptualization, A.D.P. and T.P.; methodology, A.D.P. and T.P.; Validation, A.D.P. and T.P. All authors have read and agreed to the published version of the manuscript.

Funding

This research was funded by Ministry of Economic Development, Bando Horizon 2020-PON 2014/2020.

Informed Consent Statement

Not applicable.

Data Availability Statement

Data sharing not applicable.

Conflicts of Interest

The authors declare no conflict of interest.

Appendix A

To better understand the details, the complete formulation of the indexes listed above is shown below.

Appendix A.1. Material Index “MAT”

The following is the complete formulation of the MAT index with the relative control variables.
MAT = θ mat · ( α appr · 1 1 + τ apprw [ g ] + α mt · 1 1 + τ AMmt [ g ] + α fr · ( 2 f r ) )
  • θ mat : compatibility between material and machine
  • α appr : metal powder supply coefficient
  • τ appr w [ g ] : supply time for metallic powders [days]
  • α mt : material change coefficient
  • τ AM mt [ g ] : material change time [days]
  • α fr : material processability risk coefficient
  • f r : risk factor of material processability, which represents a factor for increasing the mass of material required by the process, and it is requested to the supplier.

Appendix A.2. Production Cost Index “CST”

Below, we describe the complete formulation of the CST index with the list of related control variables.
CST = θ mat θ ing · { [ ( n · δ d ) · ( V d ε W d + S d · γ r t · φ w ε W r ) ] · C w + [ n · δ t · V boundt · φ t ] · C t + [ n · μ g · S bound · ( 1 + φ g ) · δ g ] · C g } · f r + { K d · ( C d op · ( τ d or + τ d sl + τ d ps + τ d cm ) ) + K am · [ ( C AM eq + C AM mh + C AM en + C AM op ) · ( τ AM mt + ( τ AM start + τ AM risc ) · [ n m ] + V d V AM · n + τ AM cc · ( [ n m ] 1 ) + ( τ AM raffr + τ AM clean ) · [ n m ] ) ] }
  • θ mat : compatibility between material and machine
  • θ ing : compatibility between component and the machine working volume
  • δ d : material density indicated by the customer (kg/m3);
  • V d : volume of the component to be produced (m3);
  • S d : total area of the component (m2);
  • γ rt : average machining allowance thickness identified by technology (m);
  • φ w : ratio between the surface subject to machining allowance and the total surface area of the component (%);
  • ε w r : powders management efficiency in the production of machining allowance (%);
  • ε w d : powders management efficiency in the production of the component (%);
  • C w : unit cost of metal powders (€/kg);
  • δ t : material density chosen for the supports (kg/m3);
  • V bound t : parallelepiped volume of the containment of support structures (m3);
  • φ t : technological coefficient for the mass of material for the supports (%);
  • C t : unit cost of the material required for the supports (€/kg);
  • δ g : material density of the anchor plate (kg/m3);
  • μ g : thickness of the anchor plate (kg/m3);
  • S bound : surface of the component’s bounding box (kg/m3);
  • φ g : increase coefficient of the bounding box surface (%);
  • f r : material risk coefficient;
  • C g : unit cost of the anchor plates (€/kg);
  • K d : complexity coefficient for process design;
  • K AM : complexity coefficient for additive production;
  • c d op : operator hourly cost for process design;
  • τ d or : operator time to identify component orientation (h)
  • τ d sl : operator time to identify the optimal slicing strategy (h)
  • τ d ps : operator time to identify process parameters (h)
  • τ d cm : operator time to set the tool path (h)
  • c AM eq : hourly cost for Additive Production due to amortization;
  • c AM mh : hourly cost for Additive Production due to maintenance;
  • c AM en : hourly cost for Additive Production due to energy consumption;
  • c AM op : hourly cost for Additive Production due to the operator;
  • τ AM mt : material change time (h);
  • τ AM start : machine start-up time (h)
  • τ AM risc : machine preheating time (h);
  • n : components of the lot number;
  • m : maximum number of components that can be produced within a job;
  • [ n m ] : number of jobs required by a machine with a maximum capacity of m components to make n components;
  • τ AM cc : cycle change time (h);
  • P AM : machine productivity (m3/h);
  • τ AM raffr : chamber cooling time (h);
  • τ AM clean : excess powders removal time (h).

Appendix A.3. Production Time Index “TMP”

The following is the complete formulation of the TMP index with the relative control variables.
TMP = θ mat θ ing · { τ appr w [ h ] + ( τ d or + τ d sl + τ d ps + τ d cm ) + [ τ AM mt + ( τ AM start + τ AM risc ) · ( n m ) ] + [ V d P AM · n + τ AM cc · ( ( n m ) 1 ) ] + [ ( τ AM raffr + τ AM clean ) · ( n m ) ] }
  • θ mat : compatibility between material and machine
  • θ ing : compatibility between component and the machine working volume
  • τ appr w [ h ] : powder supply time (h)
  • τ d or : operator time to identify component orientation (h)
  • τ d sl : operator time to identify the optimal slicing strategy (h)
  • τ d ps : operator time to identify process parameters (h)
  • τ d cm : operator time to set the tool path (h)
  • τ AM mt : material change time (h)
  • τ AM start : machine start-up time (h)
  • τ AM risc : machine preheating time (h)
  • m : maximum components number that can be produced within a job
  • τ AM raffr : room cooling time (h)
  • τ AM clean : excess powder removal time (h)
  • τ AM cc : cycle change time (h)
  • n : number of components of the lot
  • P AM : machine productivity (m3/h)
  • V d : total volume to be melted (m3)

Appendix A.4. Overall Dimensions of the Component in the Machine “ING”

The following is the complete formulation of the ING index with the relative control variables.
ING = θ ing · { [ ( [ ( x AM X d ) ] x AM + ( Y AM Y d ) y AM + ( z AM z d ) z AM ) / 3 ] + [ n m ( n cycle 1 ) ] 2 }
  • θ ing : compatibility between component and the machine working volume
  • x AM
  • y AM : machine working volume
  • z AM
  • x d
  • y d : volume of the parallelepiped containing the component
  • z d
  • n : number of components of the lot
  • ncycle: job numbers
  • m : maximum number of components that can be produced within a job

Appendix A.5. Technology Precision “PRE”

The following is the complete formulation of the PRE index with the relative control variables.
PRE = θ pre · ( ζ d ζ AM ) ζ d
  • θ pre : product—machine coefficient, θ pre = 0 ζ d < ζ AM   θ pre = 1 ζ d > ζ AM ;
  • ζ d : reference precision of the component;
  • ζ AM : machine precision.

Appendix A.6. Technology Resolution “RIS”

The following is the complete formulation of the RIS index with the relative control variables.
RIS = θ ris · ( ξ d ξ AM ) ξ d
  • θ ris : product—machine coefficient, θ ris = 0 ζ d < ζ AM   θ ris = 1 ζ d > ζ AM ;
  • ζ d : reference resolution of the component;
  • ζ AM : machine resolution.

Appendix A.7. Undercuts Management “STQ”

The following is the complete formulation of the STQ index with the relative control variables.
STQ = S d ( S t · 2 + S d )
  • S d : total component surface;
  • S t : total undercut surface;
  • ψ : support management coefficient.

Appendix A.8. Technology Roughness “RGS”

The following is the complete formulation of the RGS index with the relative control variables.
RGS = θ rgs · ( χ d χ AM ) χ d
  • θ rgs : product—machine coefficient, θ rgs = 0 χ d < χ AM   θ rgs = 1 χ d > χ AM ;
  • χ d : component reference roughness;
  • χ AM : roughness obtainable with the machine.

Appendix A.9. Compatibility Index “CBA”

The following is the complete formulation of the CBA index with the relative control variables.
CBA = θ mat · θ ing · { α gmt · ( PRE + RIS + RGS + STQ 4 ) + α cst · ( 1 CST CST max · ( 1 + α cst ) ) + α tmp · ( 1 TMP TMP max · ( 1 + α tmp ) ) }
The KPI in equal to zero when θ mat   or   θ ing are null, which are conditions corresponding respectively to an incompatibility in terms of material (the material is not supported by the machine) or overall dimensions (the component is too large compared to the machine’s working volume).
If PRE, RIS, RGS, or STQ are equal to zero, CBA does not become null because the component is actually feasible; it requires only additional treatments or workings that cannot be ignored if the customer’s request is to be satisfied.
  • θ mat : θ mat = 0 → incompatible material θ mat = 1 → compatible material;
  • θ ing : compatibility between component and the machine working volume
  • α gmt : weight associated with geometric KPIs;
  • α cst : weight associated with cost KPIs;
  • α tmp : weight associated with time KPIs;
  • PRE: technology precision;
  • RIS: technology resolution;
  • RGS: technology roughness;
  • STQ: undercuts management;
  • CST: production cost;
  • TMP: production time;
  • CST max : maximum CST value calculated among all available machines;
  • TMP max : maximum TMP value calculated among all available machines.

References

  1. Ashton, K. That ‘internet of things’ thing. RFID J. 2009, 22, 97–114. [Google Scholar]
  2. ASTM F2792-12a. Standard Terminology for Additive Manufacturing Technologies, (Withdrawn 2015); ASTM International: West Conshohocken, PA, USA, 2012. [Google Scholar]
  3. Bikas, H.; Stavropoulos, P.; Chryssolouris, G. Additive manufacturing methods and modelling approaches: A critical review. Int. J. Adv. Manuf. Technol. 2016, 83, 389–405. [Google Scholar] [CrossRef] [Green Version]
  4. Wohlers, T.T.; Campbell, I.; Diegel, O.; Kowen, J.; Caffrey, T. Wohlers Report. 3D Printing and Additive Manufacturing State of the Industry; Wohlers Associates: Fort Collins, CO, USA, 2007. [Google Scholar]
  5. Uz Zaman, U.K.; Rivette, M.; Siadat, A.; Mousavi, S.M. Integrated product-process design: Material and manufacturing process selection for additive manufacturing using multi-criteria decision making. Robot. Comput. -Integr. Manuf. 2018, 51, 169–180. [Google Scholar] [CrossRef] [Green Version]
  6. Huang, Y.; Leu, M.C.; Mazumder, J.; Donmez, A. Additive manufacturing: Current state, future potential, gaps and needs, and recommendations. J. Manuf. Sci. Eng. 2015, 137, 014001. [Google Scholar] [CrossRef] [Green Version]
  7. Vaezi, M.; Chianrabutra, S.; Mellor, B. Multiple material additive manufacturing—part1: A review. J. Virtual Phys. Prototyp. 2013, 8, 19–50. [Google Scholar] [CrossRef]
  8. Cozmei, C.; Caloian, F. Additive manufacturing flickering at the beginning of existence. Procedia Econ. Financ. 2012, 3, 457–462. [Google Scholar] [CrossRef] [Green Version]
  9. Gibson, I.; Rosen, D.; Stucker, B. Additive Manufacturing Technologies: 3D Printing, Rapid Prototyping, and Direct Digital Manufacturing, 2nd ed.; Springer: New York, NY, USA; Heidelberg, Germany; Dordrecht, The Netherlands; London, UK, 2015; ISBN 978-1-4939-2112-6. [Google Scholar]
  10. Colosimo, B.M.; Cavalli, S.; Grasso, M. A cost model for the economic evaluation of in-situ monitoring tools in metal additive manufacturing. Int. J. Prod. Econ. 2020, 223, 107532. [Google Scholar] [CrossRef]
  11. Rinaldi, M.; Caterino, M.; Fera, M.; Manco, P.; Macchiaroli, R. Technology selection in green supply chains—The effects of additive and traditional manufacturing. J. Clean. Prod. 2021, 282, 124554. [Google Scholar] [CrossRef]
  12. Afshari, H.; Searcy, C.; Jaber, M.Y. The role of eco-innovation drivers in promoting additive manufacturing in supply chains. Int. J. Prod. Econ. 2019, 223, 107538. [Google Scholar] [CrossRef]
  13. Bikas, H.; Koutsoukos, S.; Stavropoulos, P. A decision support method for evaluation and process selection of Additive Manufacturing. Procedia CIRP 2019, 81, 1107–1112. [Google Scholar] [CrossRef]
  14. Di, L.; Yang, Y. Cost Modeling and Evaluation of Direct Metal Laser Sintering with Integrated Dynamic Process Planning. Sustainability 2021, 13, 319. [Google Scholar] [CrossRef]
  15. Ott, K.; Pascher, H.; Sihn, W. Improving sustainability and cost efficiency for spare part allocation strategies by utilisation of additive manufacturing technologies. Procedia Manuf. 2019, 33, 123–130. [Google Scholar] [CrossRef]
  16. Sabiston, G.; Kim, I.Y. 3D topology optimization for cost and time minimization in additive manufacturing. Struct. Multidiscip. Optim. 2020, 61, 731–748. [Google Scholar] [CrossRef]
  17. Liu, J.; Chen, Q.; Liang, X.; To, A.C. Manufacturing cost constrained topology optimization for additive manufacturing. Front. Mech. Eng. 2019, 14, 213–221. [Google Scholar] [CrossRef]
  18. Palanisamy, M.; Pugalendhi, A.; Ranganathan, R. Selection of suitable additive manufacturing machine and materials through best–worst method (BWM). Int. J. Adv. Manuf. Technol. 2020, 107, 2345–2362. [Google Scholar] [CrossRef]
  19. Altair’s INSPIRE® User Guide. Available online: https://www.altair.com/inspire/ (accessed on 2 March 2021).
Figure 1. AMSA (Additive Manufacturing Spare parts market Application) supply chain: (a) new product; (b) spare part.
Metals 11 00409 g001
Figure 2. Flow chart of the material evaluation (MAT) Key Performance Indicator (KPI).
Metals 11 00409 g002
Figure 3. List of production phases considered for the Cost KPI (CST) and Time KPI (TMP) calculation.
Metals 11 00409 g003
Figure 4. Real automotive manifold.
Metals 11 00409 g004
Figure 5. Fused Deposition Modeling (FDM) head of PEEK extrusion machine.
Metals 11 00409 g005
Figure 6. Component coupling surface.
Metals 11 00409 g006
Figure 7. Accelerations application point.
Metals 11 00409 g007
Figure 8. Material density distribution after topology optimization.
Metals 11 00409 g008
Figure 9. Remodeled component with PolyNurbs.
Metals 11 00409 g009
Figure 10. A357 component for Selective Laser Melting (SLM).
Metals 11 00409 g010
Figure 11. Real component made by SLM (small series).
Metals 11 00409 g011
Table 1. Matrix example that associates the Key Performance Indicator (KPIs) with the various machine types available on the platform (Powder Bed, PB or Directed Energy Deposition, DED).
AVAILABLE MACHINES
PRODUCT AMachine PB_1Machine PB_2Machine PB_3Machine DED_1Machine DED_2Machine DED_3
KPIKPI1 29%94%83%79%45%61%
KPI225%75%51%92%7%97%
KPI313%99%25%11%71%90%
KPI426%53%89%41%39%8%
KPI576%97%44%66%18%50%
KPI678%91%26%79%57%44%
KPI725%61%40%33%12%29%
KPI852%76%54%83%3%10%
KPI958%16%61%48%100%97%
KPI1030%98%93%25%82%97%
KPI1116%28%11%77%76%2%
COMPATIBILITY39%72%53%58%46%53%
Table 2. MAT calculation for the FDM head for traditional plastics.
MATAllowed Values DescriptionDEDSLMEBM
MaterialA357A357A357
θmat[0]; [1]0 = incompatible material110
1 = compatible material
αappr[0:1]Weight related to the powder supply time0.50.50.5
τapprw[g][0:ꝏ)Time expressed in days equal to the powder supply time7014
αmt[0:1]Weight related to material change time0.30.30.3
τAMmt[g][0:ꝏ)Time expressed in days equal to the powder change time in the machine for a given material205
αfr[0:1]Weight related to the risk of material processability in the machine0.20.20.2
fr[1: ꝏ)Material processability risk in the machine - Increase factor of material mass required by the process1.511
MAT45%100%0%
Table 3. Overall dimensions study (ING) calculation for the FDM head for traditional plastics.
INGAllowed ValuesDescription DEDSLMEBM
θing[0]; [1]Bigger component of the machine working volume111
Compatible component with the machine working volume
xAM[0:ꝏ)Machine working volume expressed as X-Y-Z in m1.0000.2450.200
yAM[0:ꝏ)1.5000.2450.200
zAM[0:ꝏ)2.0000.3000.300
xd[0:ꝏ)Volume of the parallelepiped containing the component to be produced expressed as X-Y-Z in m0.1000.1000.100
yd[0:ꝏ)0.10001000.100
zd[0:ꝏ)0.1850.1850.185
m[0:ꝏ)Maximum number of components that can be produced within a job148
n[0:ꝏ)Number of components of the lot111
ncycle[0:ꝏ)Cycles number required by the machine to produce the entire lot111
ING96%39%29%
Table 4. Precision analysis (PRE) calculation for the FDM head for traditional plastics.
PREAllowed ValuesDescriptionDEDSLMEBM
θpre[0]; [1] θ pre = 0 ζ d < ζ AM 011
θ pre = 1 ζ d > ζ AM
ζd[0:ꝏ)Reference precision of the component0.2000.2000.200
ζAM[0:ꝏ)Machine precision0.5000.0500.100
PRE0%75%50%
Table 5. Resolution analysis (RIS) calculation for the FDM head for traditional plastics.
RISAllowed ValuesDescriptionDEDSLMEBM
θ ris [0]; [1] θ ris = 0 ξ d < ξ AM 111
θ ris = 1 ξ d > ξ AM
ξ d [0:ꝏ)Reference resolution of the component2.0002.0002.000
ξ AM [0:ꝏ)Machine resolution1.0000.3000.400
RIS50%85%80%
Table 6. Roughness analysis (RGS) calculation for the FDM head for traditional plastics.
RGSAllowed ValuesDescriptionDEDSLMEBM
θrgs[0]; [1] θ rgs = 0   χ d < χ AM 000
θ rgs = 1 χ d > χ AM
χd[0:ꝏ)Component reference roughness3.23.23.2
χAM[0:ꝏ)Roughness obtainable with the machine15.05.010.0
RGS0%0%0%
Table 7. Study of the undercuts (STQ) calculation for the FDM head for traditional plastics.
STQAllowed ValuesDescriptionDEDSLMEBM
Sd[0:ꝏ)Total surface of the component0.0280.0280.028
St[0:ꝏ)Total surface in undercut0.0030.0030.003
ψ[0:1]Support management coefficient0.10.61.0
STQ9%78%91%
Table 8. CST calculation for the FDM head for traditional plastics.
CSTAllowed ValuesDescriptionDEDSLMEBM
θmat[0]; [1]0 = incompatible material110
1 = compatible material
θing[0]; [1]0 = bigger component of the machine working volume111
1 = component compatible with the working volume of the machine
n[0:ꝏ)Number of components of the lot111
δd[0:ꝏ)Density of the material indicated by the customer (kg/m3)267026702670
Vd[0:ꝏ)Volume of the component to be produced (m3)5.03 × 10⁻⁸ 5.03 × 10−85.03 10−8
Sd[0:ꝏ)Total surface of the component(m2)0.02820.02820.0282
γrt[0:ꝏ)Average machining allowances thickness identified by technology (m)0.0020.00020.0005
φw[0:1]Ratio between the surface subject to machining allowance and the total surface of the component (%)8%8%8%
εwr[0:1]Powder management efficiency in the machining allowance production (%)70%85%85%
εwd[0:1]Powder management efficiency in the component production (%)70%85%85%
Cw[0:ꝏ)Unit cost of metal powders (€/kg)701300
δt[0:ꝏ)Material density chosen for the supports (kg/m3)267026702670
Vboudt[0:ꝏ)Volume of the parallelepiped containing the support structures (m3)0.00030.00030.0003
φt[0:1]Technological coefficient for the supports material mass (%)0.10.60.3
Ct[0:ꝏ)Unit material cost required for the supports (€/kg)701300
δg[0:ꝏ)Density of the anchor plate material (kg/m3)267026702670
μg[0:ꝏ)Anchor plate thickness (m)0.0250.0250.025
Sbound[0:ꝏ)Surface of the component bounding box (m2)0.010.010.01
φg[0:ꝏ)Coefficient of increase of the bounding box surface (%)10%5%5%
fr[0:1]Material risk coefficient1.511
Cg[0:ꝏ)Unit cost of anchor plates (€/kg)550
Kd[0:ꝏ)Complexity coefficient for process design1.311
cdop[0:ꝏ)Cost operator time for process design €/h303030
τdor[0:ꝏ)Operator time to identify component orientation (h)0.50.50.5
τdsl[0:ꝏ)Operator time to identify the optimal slicing strategy (h)222
τdps[0:ꝏ)Operator time to identify process parameters (h)0.50.50.5
τdcm[0:ꝏ)Operator time to set the tool path (h)0.50.50.5
KAM[0:1]Complexity coefficient for additive production1.311
cAMeq[0:ꝏ)Hourly cost for Additive Production due to amortization5046.581.4
cAMmh[0:ꝏ)Hourly cost for Additive Production due to maintenance107.115
cAMen[0:ꝏ)Hourly cost for Additive Production due to energy consumption1.931.682.57
cAMop[0:ꝏ)Hourly cost for additive production due to the operator000
τAMmt[0:ꝏ)Material change time (h)0.505
τAMstart[0:ꝏ)Machine start-up time (h)133
τAMrisc[0:ꝏ)Machine preheating time (h)011
m[0:ꝏ)Maximum components number that can be produced within a job148
τAMcc[0:ꝏ)Cycle change time (h)241
Vd[0:ꝏ)Total volume to be melted (m3)0.0001059760.0002230140.000142268
PAM[0:ꝏ)Machine productivity (m3/h)0.0001000.0000150.000080
τAMraffr[0:ꝏ)Room cooling time (h)228
τAMclean [0:ꝏ)Excess powder removal time (h)0.544
CST (€)633.39 €1,541.08 €
Table 9. TMP calculation for the FDM head for traditional plastics.
TMPAllowed ValuesDescriptionDEDSLMEBM
θmat[0]; [1]0 = incompatible material110
1 = compatible material
θing[0]; [1]0 = Bigger component of the machine working volume111
1 = component compatible with the working volume of the machine
n[0:ꝏ)Number of components of the lot111
Vd [0:ꝏ)Volume of the component to be produced (m3)5.03 × 10−85.03 × 10−85.03 × 10⁻⁸
τapprw[h][0:ꝏ)Powder supply time (h)1680336
τdor [0:ꝏ)Operator time to identify component orientation (h)0.50.50.5
τdsl[0:ꝏ)Operator time to identify the optimal slicing strategy (h)222
τdps[0:ꝏ)Operator time to identify process parameters (h)0.50.50.5
τdcm[0:ꝏ)Operator time to set the tool path (h)0.50.50.5
τAMmt[0:ꝏ)Material change time (h)0.505
τAMstart[0:ꝏ)Machine start-up time (h)133
τAMrisc[0:ꝏ)Machine preheating time (h)011
m[0:ꝏ)Maximum components number that can be produced within a job148
τAMcc[0:ꝏ)Cycle change time (h)241
Vd [0:ꝏ)Total volume to be melted (m3)0.000105980.000223010.00014227
PAM[0:ꝏ)Machine productivity (m3/h)0.0001000.0000150.000080
τAMraffr[0:ꝏ)Room cooling time (h)228
τAMclean[0:ꝏ)Excess powder removal time (h)0.544
TMP (gg)7.52.60.0
Table 10. Compatibility Index (CBA) calculation for the FDM head for traditional plastic.
CBAAllowed ValuesDescriptionDEDSLMEBM
θmat[0]; [1]0 = incompatible material110
1 = compatible material
θing[0]; [1]0 = Bigger component of the machine working volume111
1 = component compatible with the machine working volume
PRE[0:1]Precision KPI 0%75%50%
RIS[0:1]Resolution KPI 50%85%80%
RGS[0:1]Roughness KPI 0%0%0%
STQ[0:1]Undercuts KPI9%78%91%
CST (€)[0:ꝏ)Cost KPI 633.39 €1,541.08 €
TMP (gg)[0:ꝏ)Time KPI 7.52.60
CBA (%)40%53%0%
Table 11. Functional requirements verification of the FDM head for traditional plastics.
FDM Head for Traditional Plastic
(Small Series)
CharacteristicFunctional Requirement
Head fixing component Z-axisPositioning tolerances of the fixing holesmk 0.1 Metals 11 00409 i001
Reference plan planarity mk 0.1 Metals 11 00409 i002
Dimensional tolerance of through fixing holes mk 0.1 Metals 11 00409 i003
Reference plan planarity roughness Ra 3.2 Metals 11 00409 i004
Nozzle head fixing componentPositioning tolerances of the fixing holesmk 0.1 Metals 11 00409 i005
Dimensional tolerance of through fixing holes mk 0.1 Metals 11 00409 i006
Internal roughness of the holesRa 1.6 Metals 11 00409 i007
Folding head fixing componentPositioning tolerances of the fixing holesmk 0.1 Metals 11 00409 i008
Reference plan planaritymk 0.1 Metals 11 00409 i009
Dimensional tolerance of through fixing holesmk 0.1 Metals 11 00409 i010
Structure and materialVibration resistanceAble to support acceleration of 0.1g Metals 11 00409 i011
Publisher’s Note: MDPI stays neutral with regard to jurisdictional claims in published maps and institutional affiliations.