Article

A New Approach to Determine Tensile Stress-Strain Evolution in Semi-Solid State at Near-Solidus Temperature of Aluminum Alloys

1
Department of Applied Science, University of Quebec at Chicoutimi, Saguenay, QC G7H 2B1, Canada
2
Department of Mining, Metallurgy and Materials Engineering, Laval University, Québec, QC G1V 0A6, Canada
3
Arvida Research and Development Centre, Rio Tinto Aluminum, Saguenay, QC G7S 4K8, Canada
*
Author to whom correspondence should be addressed.
Metals 2021, 11(3), 396; https://doi.org/10.3390/met11030396
Submission received: 29 January 2021 / Revised: 13 February 2021 / Accepted: 22 February 2021 / Published: 28 February 2021

Abstract

:
Accurate determination of the materials’ strength and ductility in the semi-solid state at near-solidus temperatures is essential, but it remains a challenging task. This study aimed to develop a new method to determine the stress-strain evolution in the semi-solid state of aluminum alloys within the Gleeble 3800 unit. Stress evolution was determined by the newly developed “L-gauge” method, which converted the displacement of the “restrained” jaw, measured using an L-gauge, into the force. This method gives the possibility to determine the flow stress more accurately, especially for the very low stress rang (1–10 MPa) in the semi-solid state at near-solidus temperatures. The digital image correlation technique implemented in the Gleeble unit allowed effective measurement of the heterogeneous strain fields evolving within the specimen under tensile loading. Therefore, the stress-strain curves measured in the semi-solid state help to better understand the alloy’s susceptibility to hot tearing. The results of an AA6111 alloy under different liquid fractions (2.8% at 535 °C and 5.8% at 571 °C) were demonstrated. The reliable stress-strain data and heterogenous strain distribution are beneficial to develop the thermomechanical models and hot-tearing criteria.

1. Introduction

Hot tearing remains as one of the major issues encountered during direct-chill (DC) casting of certain aluminum alloys [1]. The solidification shrinkage, thermal contraction, and the thermal gradients resulting from different cooling rates at different regions of castings lead to the generation of tensile stress and accumulation of strain within the material in a semi-solid state [2,3,4]. The presence of liquid channels or pockets in interdendritic regions of castings significantly deteriorates the response of the mushy zone to the evolving tensile stresses, and if the evolving tensile stress becomes greater than the strength of the mushy zone, then the crack (hot tearing) forms. However, the growth of a crack can be prevented if the crack is healed by the surrounding liquid. Therefore, alloys with a large solidification interval have been reported to be prone to hot tearing [3,4]. The extent of these tensile stress and strain and the response of the castings in the semi-solid state are the main factors determining the occurrence of hot tearing [1,5]. The hot tearing in castings is thus controlled by their mechanical behavior (strength and ductility) at high solid fractions as well as in liquid feeding [6,7,8].
Reheating techniques are regarded as the most common approach to assessing the mechanical behavior of alloys in near-solidus regions. It involves heating the specimen to the test temperature and holding it shortly and then applying either tension or compression forces to determine its mechanical response [9]. Among these two modes of testing, the tension one is the most relevant since the accumulated tensile strain in the mushy zone can promote void formation in the semi-solid microstructure, giving rise to the occurrence of hot tearing [2,9]. However, conducting a tensile test and accurately determining the materials’ strength and ductility at near-solidus temperatures remains a challenging task [3].
One of the challenges faced during a high-temperature tensile test is the temperature evolution and its control in the specimen, since a small temperature variation might influence the liquid fraction in the mushy zone, thus affecting the reproducibility of the tensile tests [3]. Phillion et al. [9] proposed a methodology for conducting semi-solid tensile experiments using a Gleeble thermomechanical simulator, which enables accurate control of temperature evolution due to electrical resistance (joule) heating used in this unit. However, the resistive heating, in turn, results in a parabolic temperature distribution along the longitudinal direction of the tensile specimen due to mainly localized heat loss at the gripper sections of the specimen through conduction [10,11]. Moreover, the strength of aluminum alloys in near-solidus temperatures is quite low, ranging between 0.5 and 10 MPa [2,9,12]. At such low-stress values, the accuracy of load cells during the test becomes quite critical since the error limit of the load cells can cause some fluctuations in flow stress, making an accurate determination of strength properties quite difficult. Indeed, a study by Colley et al. [13], as opposed to ref. [14], revealed quite different levels of flow stresses (9 MPa vs. 3 MPa, respectively) for AA5182 alloy under the given test temperature (560 °C) and strain rate (10−4 s−1). Similar distinctions can be seen in the results reported by Kron et al. [15] and Twite et al. [16] for AA6061 alloy.
The alloy ductility in a semi-solid state is another key property for predicting hot-tearing susceptibility [3,17]. However, measuring strain in semi-solid materials also seems not so easy. While some studies concerning the deformation behavior of semi-solid aluminum alloys have solely relied on the displacement of the movable jaw (stroke) [10,12], other investigations [2,9,13] have adopted diametric change measurement to determine the strain evolution during the tensile test. Digital image correlation (DIC) has become a powerful technique for measuring strain evolution during mechanical testing [11,18]. Coupling the semi-solid tensile experiments with the DIC technique might provide further insights into the mechanisms underlying the occurrence of hot tearing as this technique enables obtaining heterogeneous strain fields evolving in the specimen [11].
In the present study, an attempt was made to develop a new method within the Gleeble 3800 system, a thermomechanical physical simulator, to accurately and reliably measure the tensile stress-strain evolution in the semi-solid state at near-solidus temperatures of aluminum alloys.

2. Experimental Design and Methods

2.1. Materials

In this study, an AA6111 alloy (Al-0.6Mg-0.6Si-0.5% Cu-0.2Fe-0.1Mn, in wt.%) was chosen for tensile test experiments owing to its large solidification interval and relatively high hot-tearing/cracking susceptibility. Tensile test specimens were machined from the mid-center regions of the cross section of a rectangular DC cast ingot, provided by the Arvida Research and Development Centre of Rio Tinto Aluminum (Saguenay, QC, Canada).

2.2. A New Method for Measuring Tensile Properties in the Near-Solidus Regions

A new and simple approach was implemented to determine the stress evolution in the range of a few MPa in near-solidus regions. Strain evolution was determined by coupling the tensile test with the DIC technique. A detailed explanation of the newly designed tensile test setup is presented in the next sub-sections.

2.2.1. Design of Specimen Geometry for Better Temperature Distribution

The Gleeble 3800 unit (Dynamic System Inc., Poestenkill, NY, USA) enables heating the specimen quickly to the test temperature without much affecting its initial (as-cast) microstructure. Moreover, it is possible to accurately control the temperature evolution during testing. Unfortunately, parabolic temperature distribution is produced along the longitudinal direction [11]. This is due mainly to localized heat loss at the gripper sections of the specimen through conduction [9]. After a series of trials and errors aiming to reduce the thermal gradient in the longitudinal direction of the specimen, the sample geometry shown in Figure 1 was chosen for the tensile tests. In general, increasing the length of the specimen showed a tendency of decreasing the thermal gradient; however, considering the dimensions of the working chamber of the Gleeble unit and the high ductility of the aluminum alloy at high temperature, the length of the specimen was established at 120 mm. Figure 2a shows the observed parabolic temperature distributions along the longitudinal direction of the specimen at various temperatures. The extent of temperature gradient increased with the increase of the temperature (Figure 2b); for example, it was ~1.7 K at the target temperature of 400 °C and ~2.64 K at 600 °C within the range of 6 mm at the center of the specimen. However, no thermal gradient was observed in the transversal direction of the tensile specimen (Figure 2c).
The tensile testing was programmed to heat the specimen at a rate of 2 K/s followed by holding the specimen at the target temperature for 30 s and then running the tensile test at a strain rate of 0.001 s−1. Temperature evolution in the specimen during heating and tensile testing was controlled through the K-type thermocouple that was spot-welded on the broad surface of the specimen. Figure 3a,b shows the temperature evolution at the center region of the specimen during a tensile test, indicating that the temperature of the specimen was well controlled during heating, holding, and tensile loading stages.

2.2.2. Stress Measurement

A new tensile test setup was implemented into the low-force cell module of the Gleeble 3800 thermomechanical simulator unit. The general view of the tensile setup in the low-force cell module is shown in Figure 4a. During heating and holding, the movable jaw can move freely. This allows maintaining near-zero force applied to the specimen despite its thermal expansion during the heating. When a tensile load is applied to the specimen, the movable jaw moves along with the moving ram, but the restrained jaw, as its name states, remains fixed in its position. However, in the near-solidus regions when the amount of the force causing the tensile specimen to fracture is very low, the built-in load cells of the Gleeble machine induce too much noise in the measurement because of the lack of sensitivity of the load cells in their low limit of operation. In the present study, a new approach was adopted to measure the force, hereafter referred to as the “L-gauge” method. An L-gauge is a length-measuring device with a resolution of ~1 micron and the L-gauge method is based on the conversion of the precisely measured displacement of the jaw into the force. The assembly that connects the restrained jaw with the base of Gleeble was modified to make the restrained jaw movable under tensile loading, and the L-gauge was installed such that it measures the displacement of the restrained jaw relative to the base of Gleeble (a). The schematic of the modified assembly that connected the restrained jaw with the base of the Gleeble can be seen in b. The assembly consisted of the block that was fixed to the base of Gleeble and the threaded rod which was connected to the restrained jaw, on one side, and to the block, on the other side. The threaded rod was bound to the block through the nut and the coned disk spring washers (b). Therefore, upon tensile loading, the spring washers also tended to deflect in response to the applied load, resulting in the displacement of the threaded rod, and thus, the movement of the restrained jaw in the direction of tensile loading. The restrained jaw continued to move until the spring washers became fully flat, which occurred when the applied load level reached ~80 kgf in this setup.
Figure 5a shows the evolution of force, applied to the specimen and recorded using the built-in load cell, and the displacement of restrained jaw relative to the base of the Gleeble, measured by the L-gauge, with time. While force evolves with lots of fluctuations, the displacement evolves almost without fluctuations. A linear relationship is established between the applied force and the displacement of the restrained jaw relative to the base of the Gleeble (Figure 5b). This relationship remained constant after numerous tests and therefore, the slope of this relationship was used as a parameter to measure the applied force by converting the displacement of the restrained jaw relative to the base, measured by the L-gauge, into the force.

2.2.3. Stress Measurement Using the DIC Technique

The specimen installed in the grips was positioned in the Gleeble jaws such that one of the broad surfaces of the specimen with a stochastic pattern was faced towards the front door of the Gleeble chamber (Figure 4a). The stochastic pattern was created by carefully spraying the liquid suspension (JIG-A-LOO, Quebec, QC, Canada) to obtain finely and uniformly distributed, non-agglomerated particles on the surface of the specimen, which enables tracking the deformation during tensile loading. A digital camera (Sony Alpha a7R III, Nihonbashi, Tokyo, Japan) with macro lens Canon (Ōta, Tokyo, Japan) was installed with its optical axis that was set perpendicular to the broad surface of the specimen (Figure 6a). A typical image obtained prior to testing, i.e., at zero strain, giving the reference image, is shown in Figure 6b. Images were captured continuously during the tensile test at a rate of 2–3 frames per second. The camera was remotely shifted from time to time in the tensile loading direction during the tensile test to bring the optical axis towards the center of the specimen surface. The images acquired during the tests were processed using GOM software (GOM Correlate Professional, 2017, Braunschweig, Germany) to measure the evolved strain distribution along the longitudinal direction of the specimen in each captured image [19]. Strain fields in the deformed images were measured using GOM software by matching the stochastic patterns in the deformed images with that of the reference image. Figure 6c shows the image after 62 s of tensile test, in which the facet was deformed (indicated by red rectangular) compared with the original reference facet (indicated by yellow rectangular) in Figure 6b. Therefore, the distance between the center of original reference facet and the center of deformed facet represents the displacement, which can be transferred into strains.
To verify the accuracy of GOM software in measuring the strain in the deformed images, it was necessary to measure the strain using images corresponding to a known extension. Therefore, an image with a stochastic pattern was purposely extended in the horizontal axis (simulating loading direction) to provide several deformed images, each with known and uniformly distributed strains (actual strains). The deformed images had the same size as the reference one to make analysis using GOM possible. The deformed images along with the reference image were then processed using GOM software to measure the strain in each of the deformed images and then compare the measured and actual strains for each image. When creating surface components within GOM software, the facet size was 18 pixels and a point distance of 18 pixels was selected. As shown in Figure 7, the measured strain for each image was quite the same as the actual ones, indicating the high accuracy of this method.

3. Results and Discussion

In the present work, two temperatures (535 and 571 °C) with different fractions of liquid were selected to show the feasibility of the newly developed method of presenting the strain-stress behaviors of experimental alloys in near-solidus regions. The fraction of liquid was calculated based on the Scheil model in Thermo-Calc (Thermo-Calc Software Inc., SoIna, Sweden) with the TCAL7 and MALDEMO databases, which allowed the back diffusion in solid as well as the integration of cooling rates to simulate the casting condition. According to the simulation results, the fraction of liquid (fL) of the experimental alloy at 535 °C was 2.8% while it was 5.8% at 571 °C.

3.1. Stress Evolution

Figure 8 compares stress evolution curves measured using the built-in load cell and a new L-gauge method for AA6111 alloy at 535 °C with a fraction liquid of 2.8%. The stress from the load cell evolved with large fluctuations. The fluctuation range was ~2–3 MPa, which is quite high for semisolid materials [3] considering the alloy had the maximum tensile strength of ~11 MPa at this temperature. Moreover, the fluctuation path was not always repeated, which can lead to some inaccuracies when smoothing such curves. The origin of such large fluctuation could be the operation of the load cell at its low limit, where the accuracy of the load cell becomes reduced. Contrarily, the stress evolved very smoothly when measured using the new L-gauge method, allowing accurate determination of the stress behavior of semisolids. At this liquid fraction, the alloy appeared to be ductile, which was evidenced by the relatively long duration of the tensile test (~120 s).
Figure 8b shows stress evolution curves obtained by the load cell and new L-gauge method for AA6111 alloy at 571 °C with a fraction liquid of 5.8%. To show the fluctuation range better, some data obtained from both methods before the start of the test are also included in this figure. The beginning of tensile loading was set at 0 in the figure for the sake of simplicity. Obviously, before tensile loading, the stress from the load cell evolved with large fluctuations, whereas the stress from the L-gauge showed no sign of fluctuations, and most importantly, after the start of tensile loading, the response of the L-gauge to an increasing load level was still excellent. Unlike the load cell, which was not able to determine the tensile strength of AA6111 alloy at 571 °C as the alloy tensile strength was very low within the fluctuation range of the load cell, the L-gauge method allowed accurate measurement of the amount of actual stress up to the fracture of the specimen (~3 MPa). Moreover, the tensile test at this temperature proceeded quickly (just ~5 s), indicating the brittle nature of the fracture of the specimen at the fraction liquid of 5.8%, which seemed to ease the crack initiation and propagation processes.
Some previous works have reported different strength levels measured for the same alloy and similar test conditions. Two studies revealed quite different levels of flow stresses (9 MPa from Colley et al. [13] vs. 3 MPa from Van Haaften et al. [14], respectively) for the AA5182 alloy under the given test temperature (560 °C) and strain rate (10−4 s−1). Similar phenomena were observed in the studies by Kron et al. [15] and Twite et al. [16] for AA6061 alloy. Considering the simplicity of the new method adopted in this study to accurately and precisely measure the applied force, the new method is believed to be superior to the built-in load cells for tensile tests in characterizing the mechanical behavior of aluminum alloys in near-solidus regions using the Gleeble thermomechanical unit.

3.2. Strain Evolution

In most previous studies concerning the mechanical behavior of aluminum alloys in semi-solid states, the strain evolution during tensile loading was either measured using the diametric change method [2,9,13] or obtained from the displacement (stroke) [10,20]. Reliable strain measurement is a key step as it can contribute to a better understanding of the alloy’s susceptibility to hot tearing or cracking. Although the DIC method has been widely used for tensile tests of various materials at room temperature, it was not used for the tensile tests in the near-solidus regions of aluminum alloys. The DIC method can be an effective technique for revealing new insights into the formation mechanisms of hot tearing and cracking defects as it can reveal not only the global strain evolution (the average strain of a specimen) but also the extent of localized strain typically experienced during necking [21].
The strain evolutions as a function of time at 535 °C and 571 °C using the DIC method are shown in Figure 9 and Figure 10, respectively. Figure 10a shows the strain evolutions at two different regions: (1) at the center and (2) at about 2.5 mm away longitudinally from the center. It is known that when the necking point is reached during a tensile test, the strain tends to localize [21]. An unavoidable thermal gradient in the longitudinal direction of the specimen, with the highest temperature appearing at its center, further facilitates the localization of strain at the center region of the specimen. As can be seen in Figure 10b, which shows the distribution of strain along the longitudinal direction of the tensile specimen, the highest local strain value corresponded to the center of the specimen. At 10 s, which was close to the necking stage, the strain was nearly the same at different positions in the longitudinal direction, with slightly higher strain observed at the center compared to the edges. Minor inhomogeneity in the strain distribution before reaching the necking was due to temperature inhomogeneity along the length of the specimen. However, beyond necking, e.g., at 50 s, the center of the specimen exhibited much higher local strain (~35%) than the regions away from the center. Although the tensile test at 535 °C lasted for ~85 s, accurate strain measurement was possible up to about half of the time (~50 s) because, after significant straining of the specimen, the particles on its surface became unrecognizable by the GOM software. However, 50 s appeared enough to determine not only the strain corresponding to the maximum stress during the tensile test, but also the extent of strain localization following the necking stage. Since the extent of the strain localization in semi-solids is sensitive to the amount and the distribution of liquid in the specimen, this parameter might help to better determine the hot-tearing sensitivity of aluminum alloys.
When the tensile test was conducted at 571 °C, the local strain at the center of the specimen reached only ~0.4% before fracture (see Figure 11a,b). However, as one can see in Figure 11b, the strain was highly localized in the very central region of the specimen. This is because a higher fraction of liquid existed in the specimen at 571 °C than that at 535 °C (~5.8% fL at 571 °C vs. ~2.8% fL at 535 °C). Highly localized strain evolving in this region, where the fracture occurred, implies that the solid network existed in the specimen and, as observed in the previous section, the alloy still possessed some strength at this temperature, but the presence of higher fL resulted in a quite brittle fracture of the specimen.

3.3. Stress-Strain Curves

The stress measured using the new method and the strain at fracture calculated using the DIC technique were synchronized to build the stress-strain curves. Figure 11 shows typical stress-strain curves representing the tensile tests at 535 °C and 571 °C. At 535 °C, the UTS of the alloy was ~11 MPa, and alloy’s ductility was quite high (see Figure 11a). When tested at 571 °C (Figure 11b), the alloy exhibited a low strength (~3 MPa) as the alloy had a higher liquid fraction. It has been reported that at ~600 °C, the AA6111 alloy exhibits zero ductility due to the presence of certain amounts of liquid pockets/channels in the alloy [2]. However, the possibility of measuring localized strain using the DIC technique and more accurately measuring the stress using the L-gauge method allowed us to better assess the stress-strain evolution at such high temperatures in the semi-solid state. As seen in Figure 10, the fracture point of the specimen exhibited relatively high strain evolution, whereas the regions just away from the center had indeed very limited strain evolution. Therefore, the stress-strain curve in Figure 11b corresponds solely to the region of the specimen where the fracture occurred. The results also imply that the stress and strain curve, with strain representing only a center region of specimen, is not sufficient for understanding the deformation behavior of the alloy in the semi-solid state, but also that the extent of strain localization on the specimen during the tensile test should be considered.
Accurate determination of stress-strain evolutions, which are also used as the input parameters for thermal-mechanical process models, is of critical importance since a model with more accurate input parameters can better predict the occurrence of solidification defects, which, in turn, enable tailoring the alloy composition and casting process to retard the formation of casting defects, such as hot tearing/cracking.

4. Conclusions

In the present study, a new method, namely the L-gauge method, in combination with the digital image correlation (DIC) technique, was used to accurately measure the stress and strain evolutions during tensile tests in near-solidus regions of aluminum alloys within the Gleeble thermomechanical simulator unit. The method has the following characteristics:
  • The stress measured using the L-gauge method evolved very smoothly, i.e., without large fluctuations, when compared to the stresses obtained from the load cell of the Gleeble unit. This enabled an accurate determination of the flow stress even when the high-temperature strength of aluminum alloys in near-solidus regions was quite low, ranging between 1 and 10 MPa.
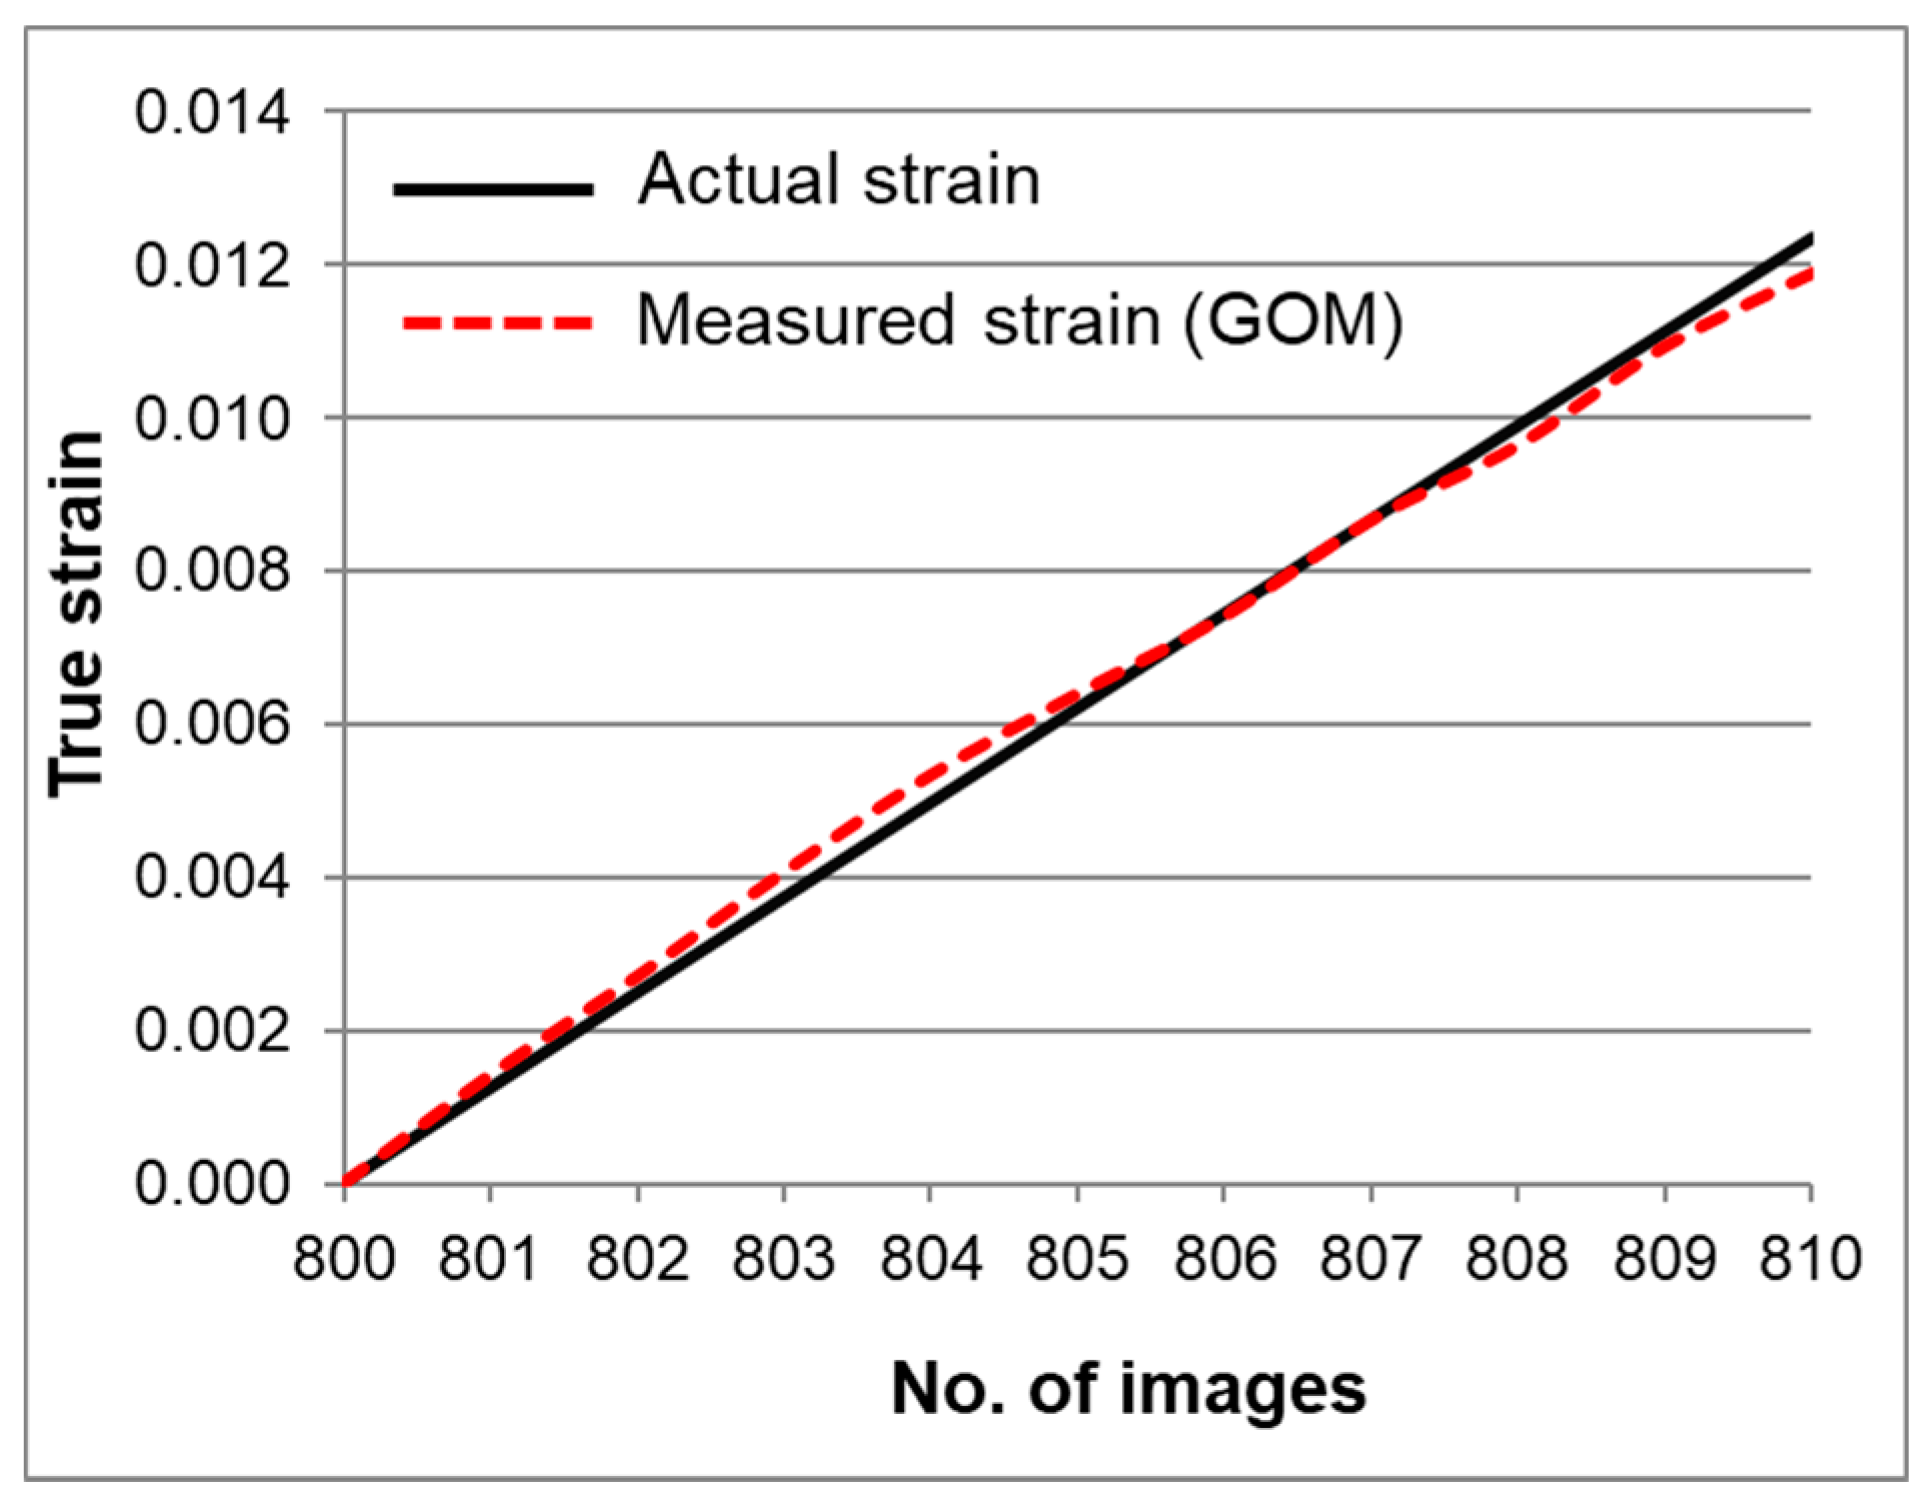
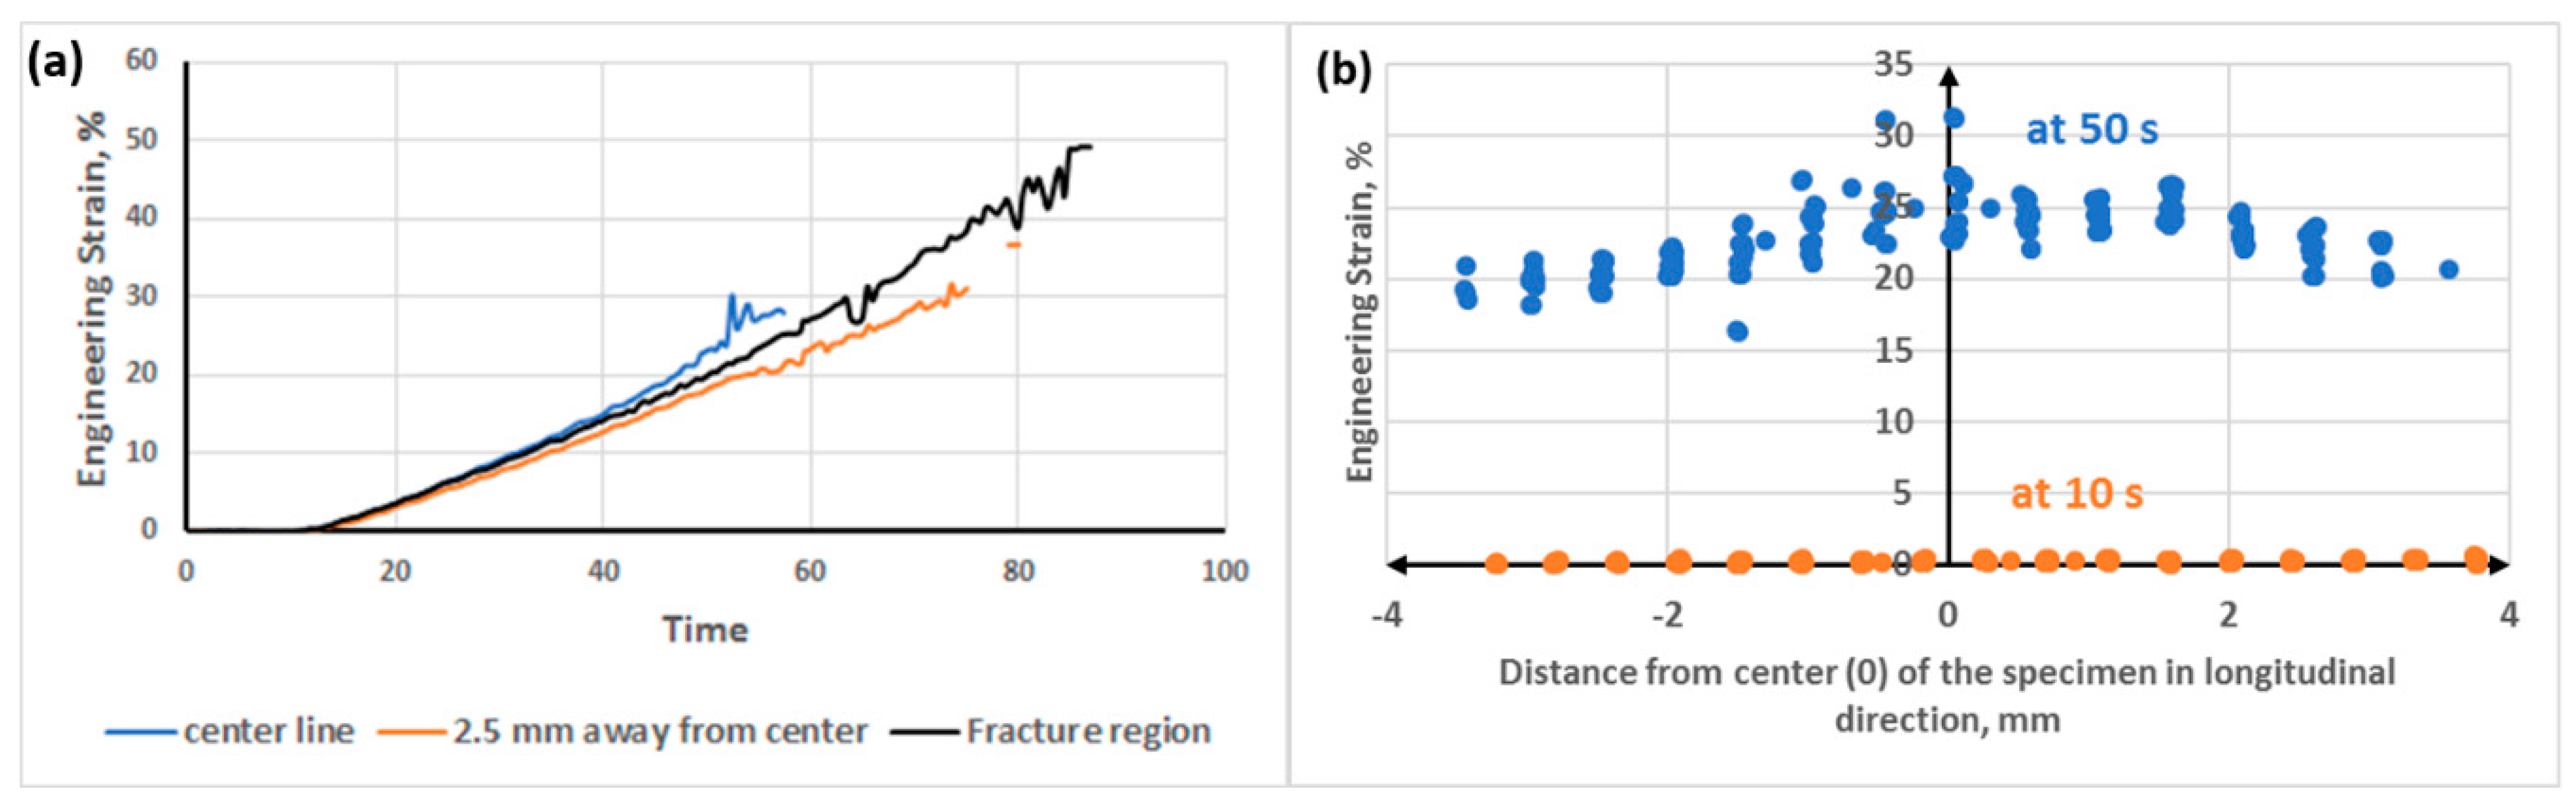
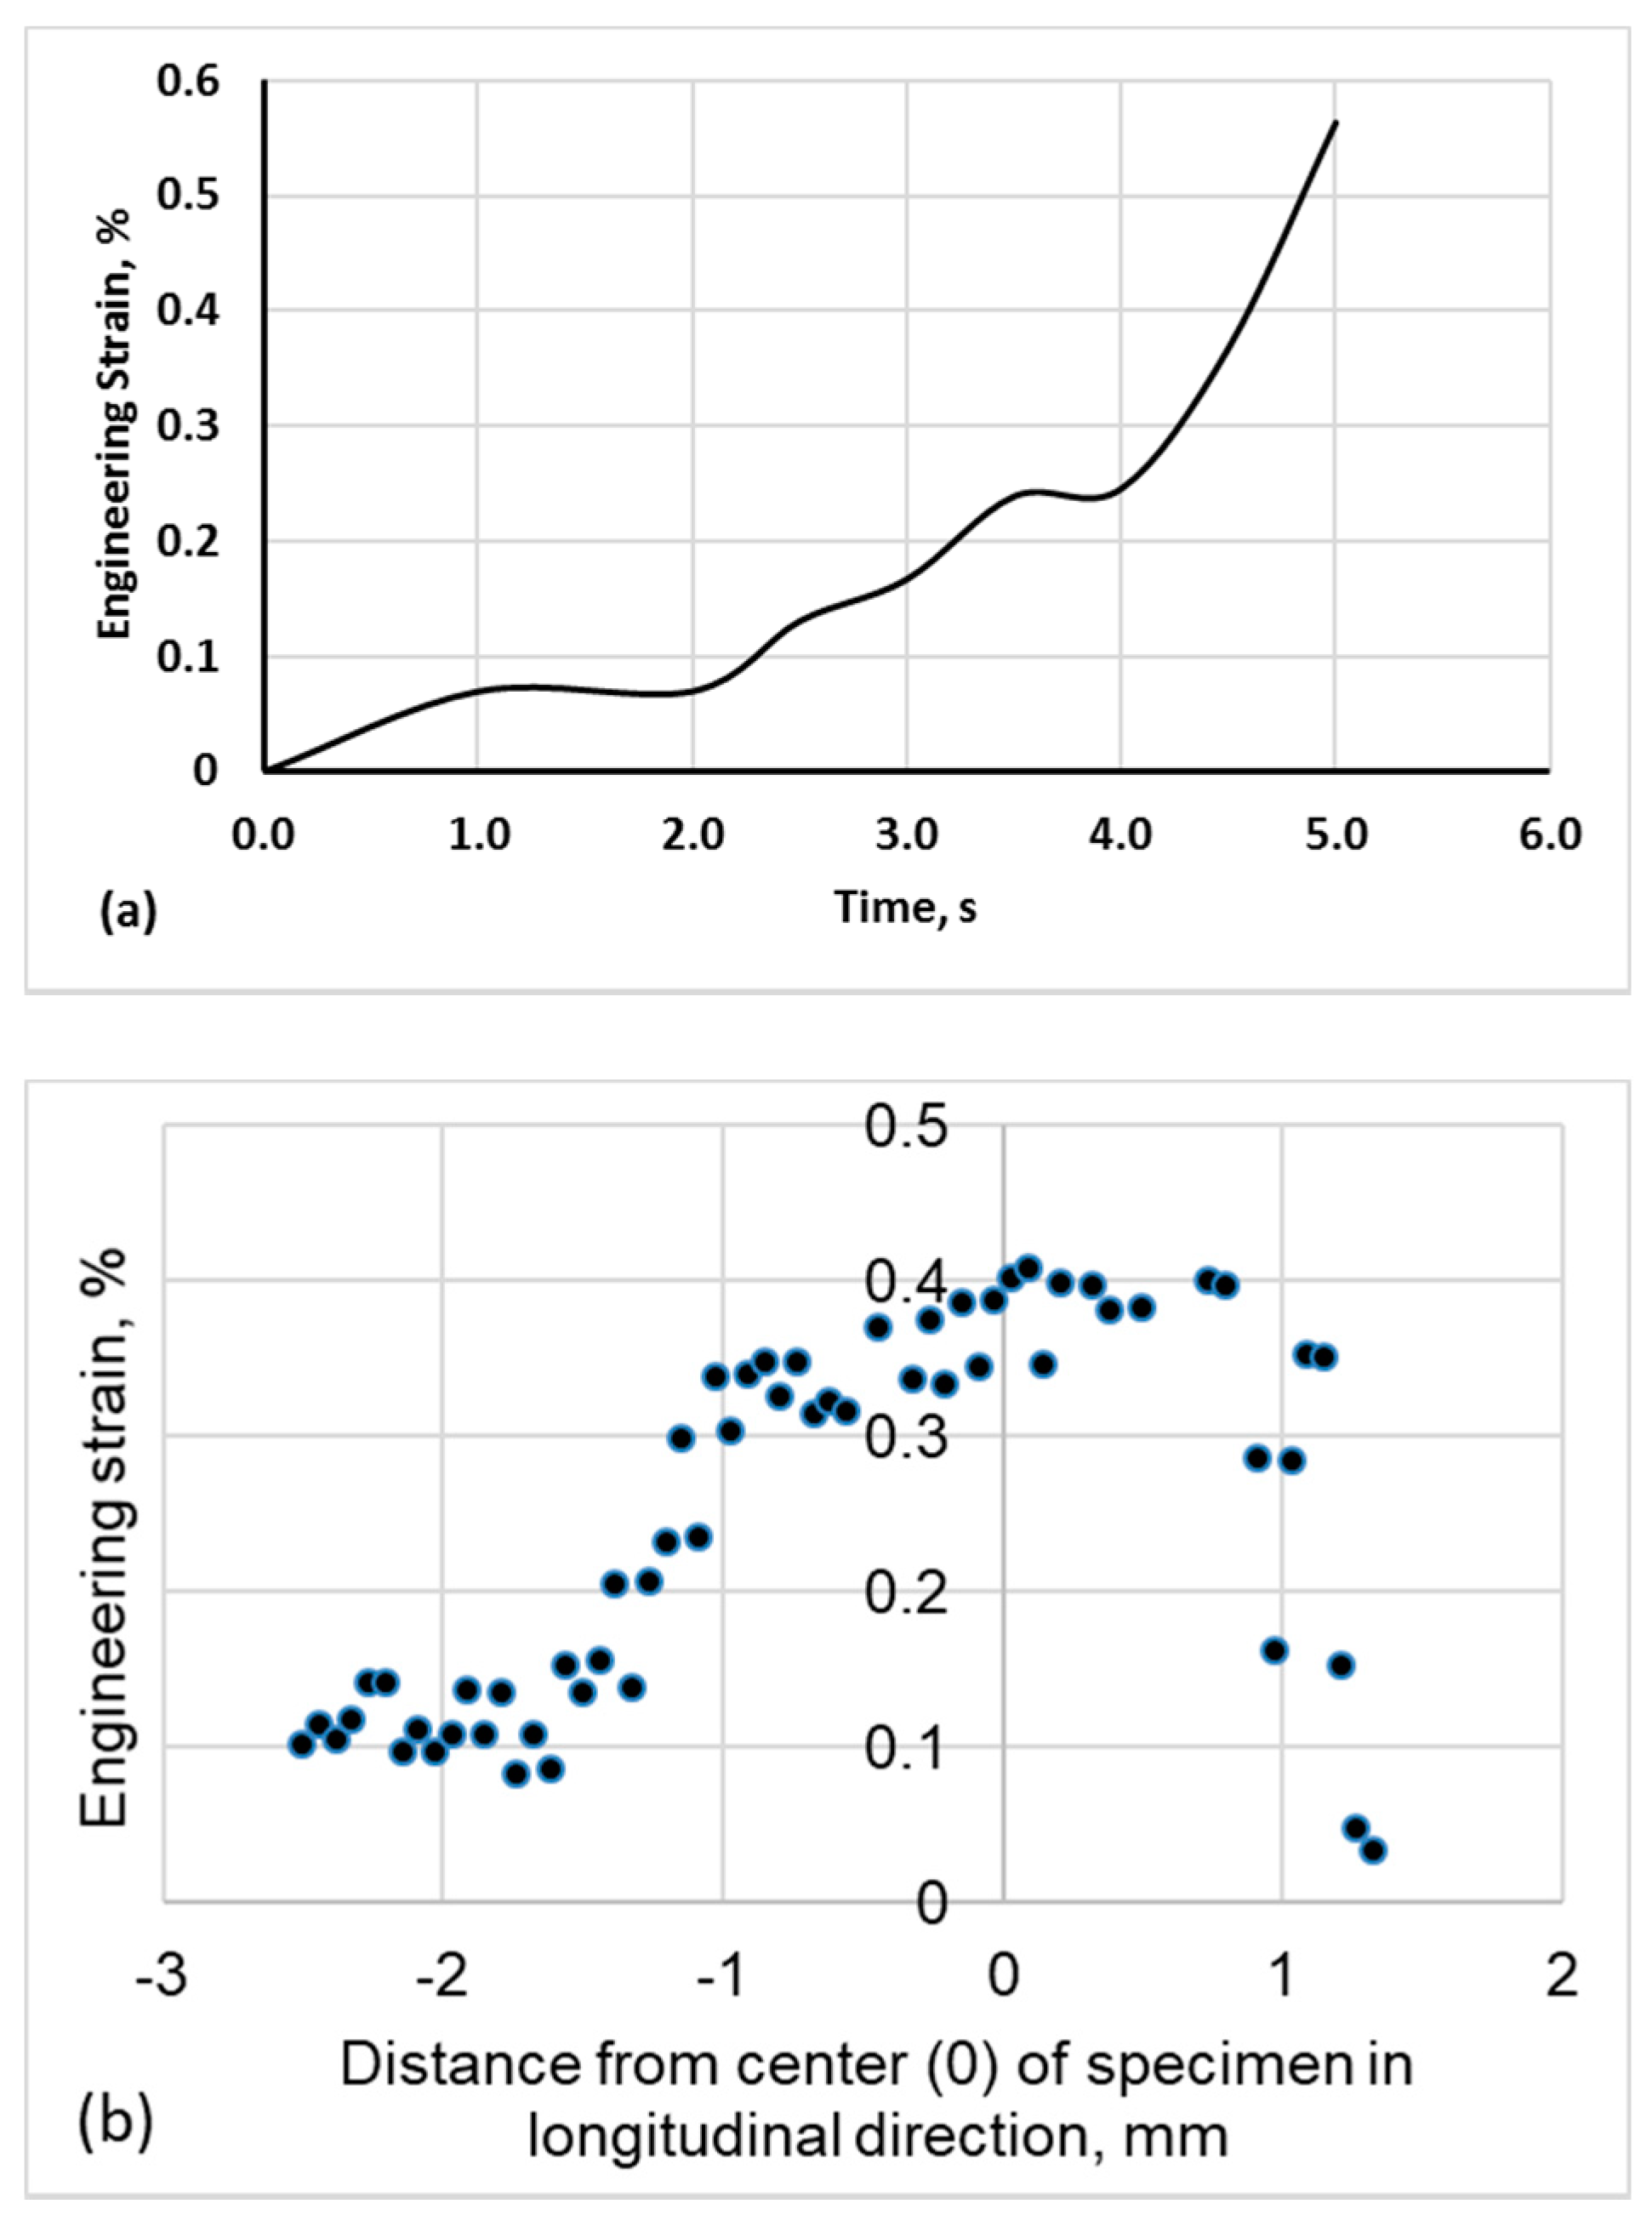
  • The DIC technique measured the strain fields evolving within the specimens under tensile loading. Accurate measurement of heterogeneous strain fields in the specimens allowed effective assessment of the extent of strain localizations, which were highly sensitive to the fraction of liquid in the near-solidus regions of the specimens.
  • Synchronization of stress and strain to obtain stress-strain curves and assessment of the extent of strain localization in the specimens allowed a better understanding of the susceptibility of alloys to hot tearing and provided more reliable stress and strain data for the thermomechanical models.

Author Contributions

Conceptualization, J.R., D.L. and X.-G.C.; methodology, J.R., M.Q., D.L. and K.L.; investigation, J.R. and M.Q.; validation, D.L., K.L. and M.J.; writing—original draft preparation, J.R.; writing—review and editing, D.L., K.L., M.J., J.C. and X.-G.C.; supervision, D.L., J.C. and X.-G.C. All authors have read and agreed to the published version of the manuscript.

Funding

This research was funded by the Fonds de recherche du Québec—Nature et technologies (FRQNT) under Grant No. 2018-LU-252831 and the Mitacs Acceleration under Grant No. IT14722.

Institutional Review Board Statement

Not applicable.

Informed Consent Statement

Not applicable.

Data Availability Statement

The measured data are available on request.

Acknowledgments

The authors would like to acknowledge the financial support by the Fonds de recherche du Québec—Nature et technologies (FRQNT) and the Mitacs Acceleration. The authors would also like to thank Dany Racine for his contribution in the Gleeble setting and testing.

Conflicts of Interest

The authors declare no conflict of interest.

References

  1. Kou, S. A criterion for cracking during solidification. Acta Mater. 2015, 88, 366–374. [Google Scholar] [CrossRef]
  2. Phillion, A.B.; Thompson, S.; Cockcroft, S.L.; Wells, M.A. Tensile properties of as-cast aluminum alloys AA3104, AA6111 and CA31218 at above solidus temperatures. Mater. Sci. Eng. A 2008, 497, 388–394. [Google Scholar] [CrossRef]
  3. Eskin, D.G.; Suyitno; Katgerman, L. Mechanical properties in the semi-solid state and hot tearing of aluminium alloys. Prog. Mater. Sci. 2004, 49, 629–711. [Google Scholar] [CrossRef]
  4. Eskin, D.G.; Katgerman, L.; Mooney, J.F. Contraction of aluminum alloys during and after solidification. Met. Mat. Trans. A 2004, 35, 1325–1335. [Google Scholar] [CrossRef]
  5. van Haaften, W.M.; Kool, W.H.; Katgerman, L. Hot tearing studies in AA5182. J. Mater. Eng. Perform. 2002, 11, 537–543. [Google Scholar] [CrossRef]
  6. Magnin, B.; Maenner, L.; Katgerman, L.; Engler, S. Ductility and Rheology of an Al-4.5% Cu Alloy from Room Temperature to Coherency Temperature. Mater. Sci. Forum 1996, 222, 1209–1214. [Google Scholar] [CrossRef]
  7. Han, Q.; Hassan, M.I.; Saito, K.; Viswanathan, S.; Das, S.K. The reheating-cooling method: A technique for measuring mechanical properties in the nonequilibrium mushy zones of alloys. Met. Mat. Trans. A 2005, 36, 2073–2080. [Google Scholar] [CrossRef]
  8. Lalpoor, M.; Eskin, D.G.; Katgerman, L. Cold-Cracking Assessment in AA7050 Billets during Direct-Chill Casting by Thermomechanical Simulation of Residual Thermal Stresses and Application of Fracture Mechanics. Met. Mat. Trans. A 2009, 40, 3304–3313. [Google Scholar] [CrossRef] [Green Version]
  9. Phillion, A.B.; Cockcroft, S.L.; Lee, P.D. A new methodology for measurement of semi-solid constitutive behavior and its application to examination of as-cast porosity and hot tearing in aluminum alloys. Mater. Sci. Eng. A 2008, 491, 237–247. [Google Scholar] [CrossRef]
  10. Bolouri, A.; Liu, K.; Chen, X.G. Effects of Iron-Rich Intermetallics and Grain Structure on Semisolid Tensile Properties of Al-Cu 206 Cast Alloys near Solidus Temperature. Met. Mat. Trans. A 2016, 47, 6466–6480. [Google Scholar] [CrossRef] [Green Version]
  11. Li, Y.; Li, S.; Chen, Y.; Han, G. Constitutive parameters identification based on DIC assisted thermo-mechanical tensile test for hot stamping of boron steel. J. Mater. Process. Technol. 2019, 271, 429–443. [Google Scholar] [CrossRef]
  12. Liu, K.; Chen, X.G. Influence of the modification of iron-bearing intermetallic and eutectic Si on the mechanical behavior near the solidus temperature in Al-Si-Cu 319 cast alloy. Phys. B Condens. Matter 2019, 560, 126–132. [Google Scholar] [CrossRef]
  13. Colley, L.J.; Wells, M.A.; Maijer, D.M. Tensile properties of as-cast aluminum alloy AA5182 close to the solidus temperature. Mater. Sci. Eng. A 2004, 386, 140–148. [Google Scholar] [CrossRef]
  14. van Haaften, W.M.; Kool, W.H.; Katgerman, L. Tensile behaviour of semi-solid industrial aluminium alloys AA3104 and AA5182. Mater. Sci. Eng. A 2002, 336, 1–6. [Google Scholar] [CrossRef]
  15. Kron, J.; Fredrikkson, H. High-temperature tensile testing of in situ solidified aluminum base alloys. In International Sympozium on Liquid Metal Processing and Casting; Lee, P.D., Mitchell, A., Jardy, A., Bellot, J.P., Eds.; SF2M-Paris: Nancy, France, 2003; pp. 393–400. [Google Scholar]
  16. Twite, M.R.; Spittle, J.A.; Brown, S.G.R. The Tensile Properties of Semi-Solid Aluminum Alloys. Int. J. Form. Process. 2004, 7, 233–260. [Google Scholar] [CrossRef]
  17. Mathier, V.; Grasso, P.D.; Rappaz, M. A New Tensile Test for Aluminum Alloys in the Mushy State: Experimental Method and Numerical Modeling. Met. Mat. Trans. A 2008, 39, 1399–1409. [Google Scholar] [CrossRef] [Green Version]
  18. Quanjin, M.; Rejab, M.R.M.; Halim, Q.; Merzuki, M.N.M.; Darus, M.A.H. Experimental investigation of the tensile test using digital image correlation (DIC) method. Mater. Today Proc. 2020, 27, 757–763. [Google Scholar] [CrossRef]
  19. GOM GmbH. GOM Testing—Technical Documentation as of V8 SR1, Digital Image Correlation and Strain Computation Basics; GOM GmbH: Braunschweig, Germany, 2016. [Google Scholar]
  20. Levasseur, D.; Larouche, D. Tensile creep testing of an Al-Cu alloy above solidus with a dynamic mechanical analyser. Mater. Sci. Eng. A 2011, 528, 4413–4421. [Google Scholar] [CrossRef]
  21. Khadyko, M.; Morin, D.; Børvik, T.; Hopperstad, O.S. Tensile ductility of extruded aluminium alloy AA6063 in different tempers. Mater. Sci. Eng. A 2019, 744, 500–511. [Google Scholar] [CrossRef]
Figure 1. The geometry of tensile test specimen.
Metals 11 00396 g001
Figure 2. Temperature distribution along the longitudinal and transversal directions of a specimen: (a) measured temperature distribution along the longitudinal direction, (b) comparison of temperature difference (Tmax-Tmin) at ± 3 mm distance relative to the center along the longitudinal direction, and (c) measured temperature distribution along the transversal.
Metals 11 00396 g002
Figure 3. Temperature evolution at the center of the specimen during a tensile test: (a) performed at 535 °C and (b) an enlarged view in the circle of (a).
Metals 11 00396 g003
Figure 4. The tensile setup in the low-force cell module of the Gleeble unit used to conduct a tensile test at near-solidus temperatures: (a) general view (blue arrow indicating the tensile sample), and (b) schematic of the assembly that was modified to convert the displacement of the “restrained” jaw under tensile loading into the force.
Metals 11 00396 g004
Figure 5. Evolution of the applied force and the relationship between applied force and displacement: (a) the applied force measured using the built-in load cell and the displacement of restrained jaw relative to base of Gleeble with time, and (b) the linear relationship between applied force (from built-in load cell) and displacement (measured using L-gauge) of restrained jaw relative to the base of the Gleeble unit. The red curve in (b) is a linear fit, from which the slope is determined.
Metals 11 00396 g005
Figure 6. Tensile test setup with the camera: (a) its optical axis set perpendicular to the surface of the specimen, (b) a reference image acquired before tensile loading, and (c) a deformed image acquired after 62 s of tensile loading.
Metals 11 00396 g006
Figure 7. Comparison of the actual and measured strains (using GOM software) in the images with known and uniformly distributed strains.
Metals 11 00396 g007
Figure 8. Comparison of stress evolution curves determined using the built-in load cell and new L-gauge method, as a function of time in AA611 alloy at (a) 535 °C (2.8% fL) and (b) 571 °C (5.8% fL). The beginning of tensile loading was set at 0 for the sake of simplicity (see the dotted arrow).
Metals 11 00396 g008
Figure 9. Strain evolutions calculated using the pictures captured during the tensile test at 535 and analyzed using the GOM Correlate software: (a) strain evolution at the center and 2.5 mm away from the center in the longitudinal direction of the specimen as a function of test time, and (b) strain distribution within 5 mm distance of the center in the longitudinal direction of the specimen at two different times.
Metals 11 00396 g009
Figure 10. Strain evolutions calculated using the pictures captured during the tensile test at 571 °C and analyzed using the GOM Correlate software: (a) strain evolution at the center of the specimen as a function of test time, and (b) strain distribution within 5 mm distance of the center in the longitudinal direction.
Metals 11 00396 g010
Figure 11. Stress-strain curves at the region of crack propagation, built from the results of the tests conducted at (a) 535 °C and (b) 571 °C.
Metals 11 00396 g011
Publisher’s Note: MDPI stays neutral with regard to jurisdictional claims in published maps and institutional affiliations.

