Article

Influence of CFRC Insulating Plates on Spark Plasma Sintering Process

1
Łukasiewisz Research Network - Metal Forming Institute, 14 Jana Pawla II St., 61-139 Poznań, Poland
2
FCT Systeme GmbH, Rauenstein Gewerbepark 16, 96528 Frankenblick, Germany
*
Author to whom correspondence should be addressed.
Metals 2021, 11(3), 393; https://doi.org/10.3390/met11030393
Submission received: 29 January 2021 / Revised: 19 February 2021 / Accepted: 22 February 2021 / Published: 27 February 2021
(This article belongs to the Special Issue Recent Advances in Field-Assisted Sintering Technologies)

Abstract

:
Spark Plasma Sintering (SPS) is a technology used for fast consolidation of metallic, ceramic, and composite powders. The upscaling of this technology requires a reduction in energy consumption and homogenization of temperature in compacts. The application of Carbon Fiber-Reinforced Carbon (CFRC) insulating plates between the sintering setup and the electrodes is frequently considered as a measure to attain these goals. However, the efficiency of such a practice remains largely unexplored so far. In the present paper, the impact of CFRC plates on required power, total sintering energy, and temperature distribution was investigated by experiments and by Finite Element Modeling (FEM). The study was performed at a temperature of 1000 °C with a graphite dummy mimicking an SPS setup. A rather moderate influence of CFRC plates on power and energy demand was found. Furthermore, the cooling stage becomes considerably longer. However, the application of CFRC plates leads to a significant reduction in the axial temperature gradient. The comparative analysis of experimental and modeling results showed the good capability of the FEM method for prediction of temperature distribution and required electric current. However, a discrepancy between measured and calculated voltage and power was found. This issue must be further investigated, considering the influence of AC harmonics in the DC field.

1. Introduction

Spark plasma sintering (SPS), also known as field-assisted sintering technique (FAST), is an advanced technology for fast consolidation of metallic, ceramic, and composite powders [1,2]. The short sintering time at FAST/SPS is achieved by rapid resistance (Joule) heating, application of mechanical pressure, and activation of some intrinsic sintering mechanisms by electric field and pulsed direct current (PDC) [1,2,3,4,5,6]. Nowadays, FAST/SPS process is in transition from laboratory scale to industrial application [7,8]. This development leads to new challenges for researchers, designers, and processing engineers, which must be addressed. In particular, the enhanced productivity of FAST/SPS units, sintering of large-sized parts with complex shape, reliable insurance of required quality must be achieved. Finally, the FAST/SPS technique should be economically competitive with other pressure-assisted sintering technologies such as conventional hot pressing, hot isostatic pressing or powder forging. From this standpoint, two matters become of special importance. The first point is the energy efficiency. This is a prerequisite for economic benefit but also an important issue of technical efficiency. Reduction in required power enables the use of cheaper power source with lower capacity, increase in productivity (with higher heating rates and shorter sintering cycle), sintering of larger parts, better condition for exploitation of other components in a FAST/SPS device e.g., transformer and cooling system. Early, Laptev et al., have shown that power and energy consumption during FAST/SPS can be drastically diminished by proper insulation of sintering tool [9]. Besides thermal insulation of external die surfaces for reduction of radiation losses, insulation of FAST/SPS tool from water-cooled electrodes was considered. In general, this can be performed by insertion of a thermal buffer between electrodes and sintering tool [10]. Laptev et al., realized this approach in a small FAST/SPS machine (H-HP D5, FCT Systeme, Rauenstein, Germany) by application of conical spacers made from carbon fiber-reinforced carbon composite (CFRC) with low thermal conductivity but with acceptable electrical conductance. [9]. However, in regular practice, a CFRC plate placed between conical protection plate and water-cooled electrode is rather used. The influence of such an insulating plate on total energy balance is unexplored so far. The second point is the understanding of temperature distribution within FAST/SPS setup and especially in sintered part. This is a matter of importance for meaningful temperature control and for the evaluation of homogeneity in density and other properties within sintered part. This topic was partly investigated for FAST/SPS setup with CFRC conical protection plates [9]. The positive influence of CFRC insulation on temperature distribution was noticed. The diminishing in temperature gradients was more evidenced for parts of large size. This result was obtained mainly theoretically by finite element method (FEM). Therefore, experimental validation of this conclusion is desirable. In particular, the effect of more relevant to practice CFRC insulating plates has to be studied.
In the present paper, the influence of such a plate was studied using two setups. In the first setup the CFRC plates were not used. In the second setup, the FAST/SPS tool was thermal insulated from water-cooled electrodes by CFRC plates. Total energy, power, current, voltage and temperature of electrodes were recorded during the entire FAST/SPS cycle. Temperature and voltage distributions within both setups were experimentally studied and compared with the results of related FEM analysis. The effect of CFRC insulating plates on energy balance and temperature distribution was evidenced. The accuracy of newly updated finite element model for prediction of thermal, electrical, and energetic parameters of FAST/SPS was evaluated and discussed.

2. Experimental

The sketches of used FAST/SPS setups are presented in Figure 1. Besides, a part of the electrodes made from beryllium copper is shown. The first setup (Figure 1a) consisted of a one-piece graphite dummy and two graphite spacers. In the second setup (Figure 1b) two CFRC plates with a thickness of 10 mm were additionally placed between spacers and electrodes. The dummy and both spacers were manufactured from isostatically pressed R 7710 graphite (SGL Carbon GmbH, Meitingen, Germany). The Sigrabond® Premium CFRC composite from the same supplier was used as the insulating plates. Both sides of CFRC plates were ground. The graphite dummy mimicked a FAST/SPS setup (including conical protection plates) with the 10 mm hole for temperature measurement by an axial pyrometer. The dummy was used instead of a real FAST/SPS setup for two main reasons. First, a setup with such a dummy does not have vertical contacts like punch/die in a regular FAST/SPS setup. Their resistance to current and heat flow is high, not well defined, and influences the experimental and modeling results in an unpredictable way. Therefore, to verify any hypothesis or theory, the application of a dummy may be preferable. Second, in contrast to a regular FAST/SPS setup, the dummy enables convenient temperature measurement at any point, including its geometrical center (i.e., at location T_0). In the used dummy, the temperature was recorded at three locations marked in Figure 1 as T_1 (0, 6), T_2 (9, 36), and T_3 (9, 53). The numbers in brackets denote the R and Z coordinates of a metering point in millimeters. In addition, the temperature was measured in the spacer at location T_4 (9, 105) and in the water-cooled electrode at location T_5 (12.5, 135, or 145). Furthermore, the used dummy provided the measurement of voltage drop between all these points and symmetrically located ones U_1, U_2, U_3, U_4, and U_5.
The experiments were performed in an H-HP D25 facility (FCT Systeme, Rauenstein, Germany) under a medium vacuum of 0.4 hPa. A continuous unidirectional current was used for heating. The primary pulsing mode was not used. However, the applied DC voltage contained the secondary ripples (or AC components). Gucci et al., studied this issue in more detail [11]. The thermocouple in location T_1 sent an input signal to the PID controller, which adjusted the supplied power with generation of a programmed temperature profile. The dummy was heated-up at the rate of 100 °C/min till a temperature of 1000 °C in location T_1. The next segment included dwell at 1000 °C for 5 min. In one cycle, the holding time was reduced to 1 min. The last segment was the forced cooling to room temperature. A load of 44 kN was applied during the whole heating cycle.
The current and the voltage were recorded during the entire SPS cycles. The voltage was trapped after the transformer and after the rectifier. Thus, the voltage drop over diodes was not accounted for. The probes were connected to a Simatic S7 controller (Siemens AG, Munich, Germany), which served also as a data logger. Thereby, both current and voltage were averaged by the root mean square (RMS) method, i.e., as IRMS and URMS, to ensure their meaningful measurements in PDC mode. The consumed power was defined as a product of these quantities i.e., S = I RMS · U RMS . Thus, a potential portion of reactive power was not accounted for. Therefore, the calculated value of S was considered as an apparent power. All data were recorded every second. The energy increment was determined as a product of power and time increment. The total energy was calculated as a sum of energy increments. The temperatures at the locations described above were measured by K-type thermocouples. Thermocouples were also used as the leads for voltage measurement. They were connected over an additional RMS transducer to the S7 controller. The performed experiments are summarized in Table 1 for the regular setup and for the setup with CFRC plates in Table 2.

3. Finite Element Modeling

3.1. Basic Equations

The total power balance during FAST/SPS was described by the following equation.
Q ˙ e = Q ˙ h +   Q ˙ l
Here Q e ˙ is the power supplied to the FAST/SPS setup by an external power source; Q ˙ h is the power required for heating; Q ˙ l is the thermal loss. For simplification of modeling, an ideal (galvanic) DC current was used instead of the real DC current. Thus, the possible electromagnetic effects of AC components contained in the real DC current were not considered. The same procedure was applied to the electric field and voltage. The electric power was determined by the Joule’s law (2) taking into account the classical Ohm’s law (3).
Q e ˙ = V q ˙ e · d V = V { i } · { E } T · d V = V [ σ ] · { E } · { E } T · d V
{i} = [σ]·{E}
Here q e ˙ is the specific Joule’s power; { i } is the current density vector; { E } is the electric field vector; [ σ ] is the diagonal matrix of electrical conductivity, V is the volume of FAST/SPS setup. The entries of [ σ ] matrix are functions of temperature. For an isotropic material, all entries of this matrix are equal to each other. The heating power was calculated as
Q h ˙ = V c p · ρ · T ˙ · d V + Q ˙ c r
Here cp is the specific heat capacity; ρ is the density; Q ˙ c r is the heat resulting from electrical contact resistance.
Q ˙ c r = S c a σ c · [ U c ] 2 · d S c a
Here σ c is the electric conductance per unit area; [ U c ] is the voltage drop over the contact surface and S c a is the contact area.
Thermal power losses are a sum of the radiation loss ( Q ˙ r ) and the heat loss due to cooling of electrodes ( Q ˙ c ), i.e.,
Q ˙ l = Q ˙ r +   Q ˙ c
The radiation heat loss was modeled by the Stefan–Boltzmann law
Q r ˙ = S e σ S · ε · ( T e 4 T a 4 ) · d S e
Here σS is the Stefan–Boltzmann constant; ε is the emissivity; Te is the temperature of the external surface of a FAST/SPS setup; Ta is the ambient temperature and Se is the area of radiating surface. The heat loss due to cooling of electrodes was considered as the convective heat transfer from electrode to cooling water. This process was modeled by Newton’s law of cooling.
Q c ˙ = S c h · ( T c T w ) · d S c
Here h is the heat transfer coefficient; Tc is the temperature of cooled surface; Tw is the temperature of cooling water and Sc is the area of cooled surface. The possible convective losses at free surface of setup were not considered because a vacuum atmosphere in FAST/SPS vessel was assumed.
The electric field in the setup was modeled by Faraday’s law.
{ E } =   · { U } T
Here { U } is the electrical potential vector. In a similar manner, the thermal field was simulated by Fourier’s law.
{ q ˙ } =   [ λ ] · T
Here { q ˙ } is the heat flux density vector; [ λ ] is the thermal conductivity matrix; T is the temperature gradient. The thermal flux through unit contact surfaces was calculated by the formula
q ˙ c t = S c a λ c · [ T c ] · d S c a
Here λ c is the thermal conductance of unit area; [ T c ] is the temperature drop over the contact surface and S c a is the contact area. More detail about the used mathematical model can be found in our previous papers [9,12].

3.2. Properties

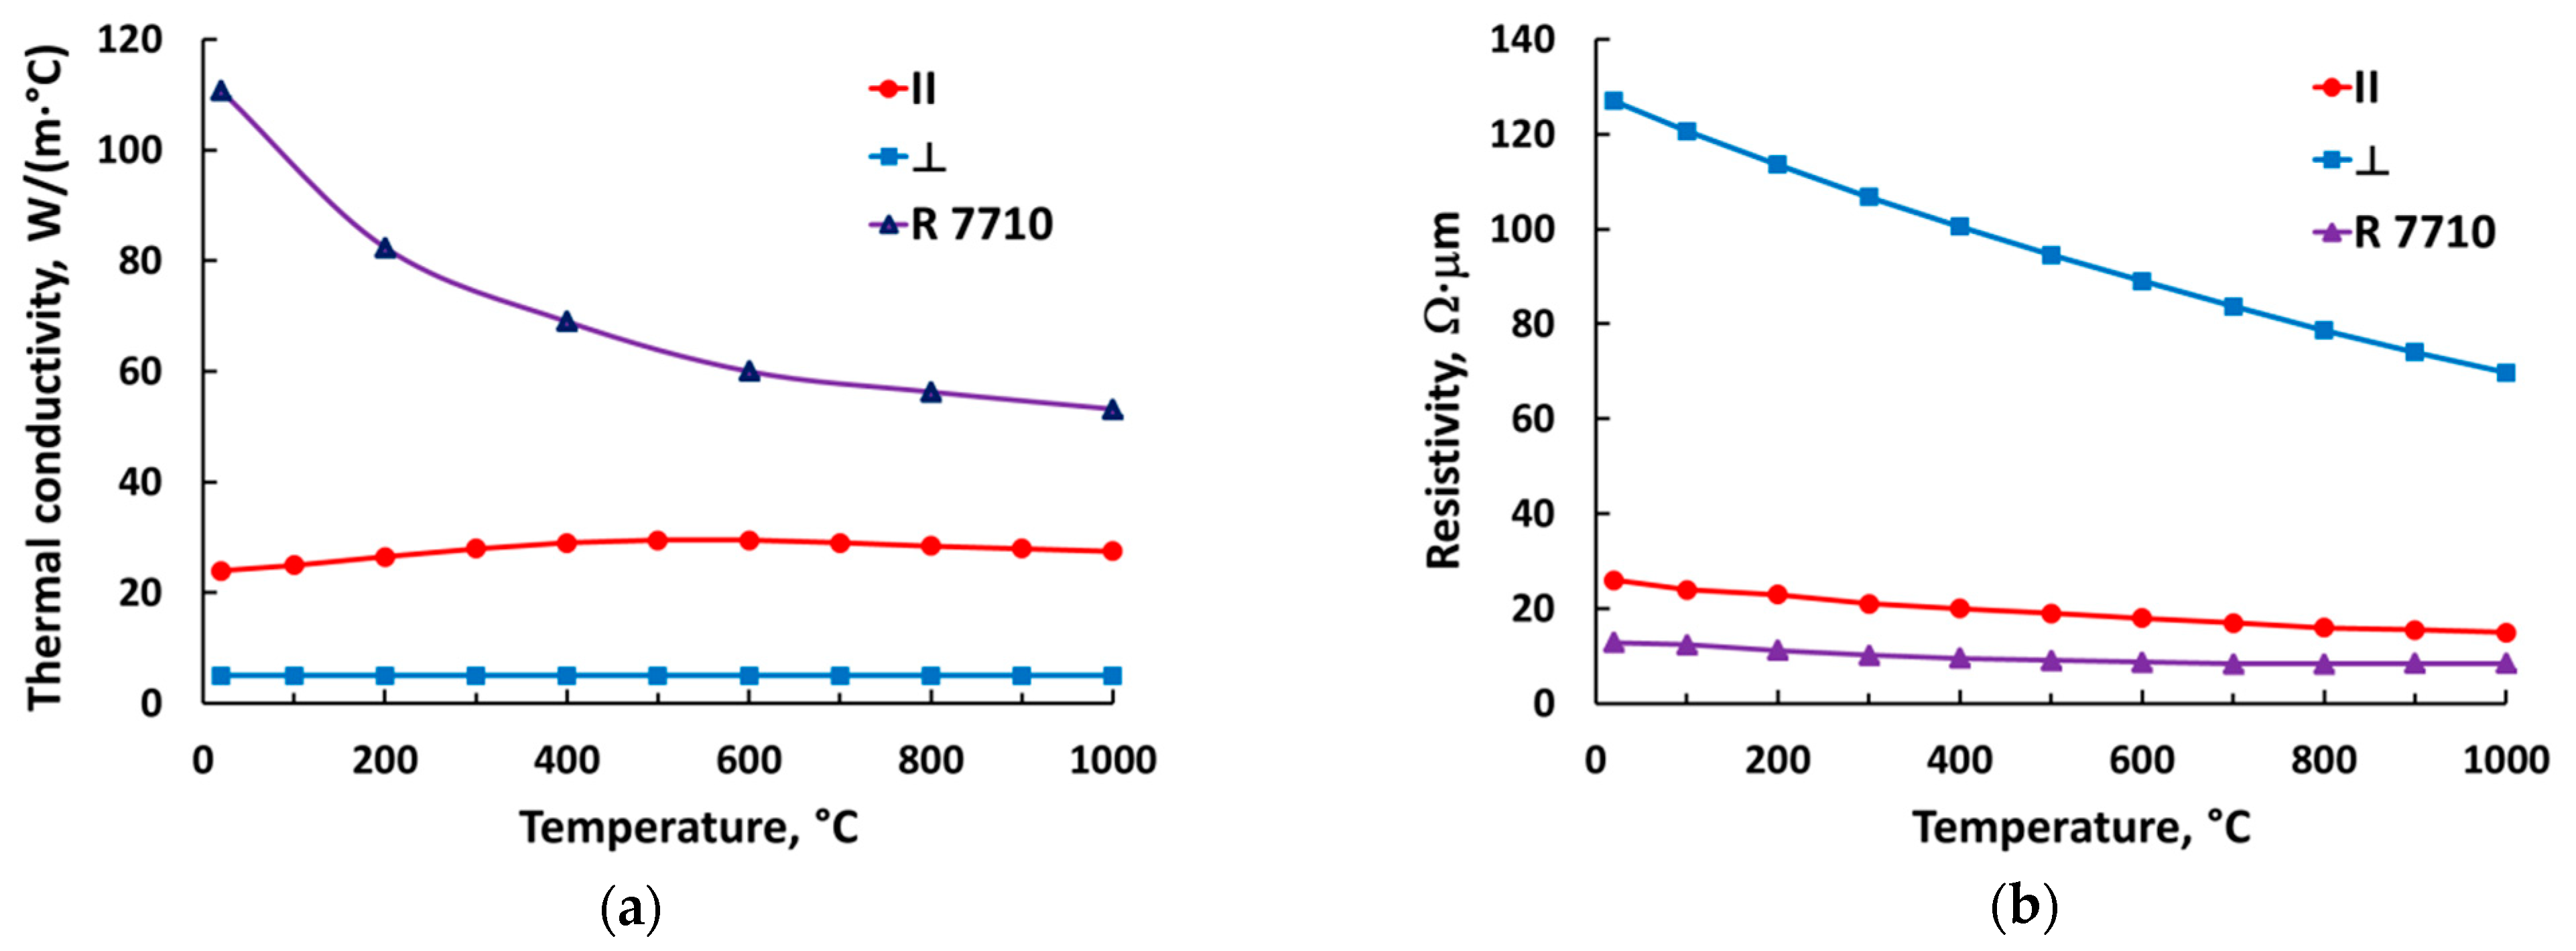
3.2.1. Bulk Properties

The density, electrical resistivity and thermal conductivity for graphite R 7710 were taken from manufacturer (SGL Carbon GmbH, Mettingen, Germany). The specific heat capacity for graphite was borrowed from the paper by McDonalds [13]. These data are presented in graphical form in the previous paper by Laptev et al., [9]. The properties of beryllium copper were taken from supplier. The density and specific heat capacity for CFRC were taken from the paper by Laptev et al., [9]. The CFRC is a strongly anisotropic material. Therefore, the thermal conductivity and electrical resistivity must be considered in the carbon fabric plane and in the perpendicular direction. The data for thermal conductivity in both directions are available from supplier. However, the electrical resistivity of CFRC is provided only in the plane of carbon fabric. Therefore, the CFRC resistivity vs. temperature in the perpendicular direction was determined in the H-HP D 25 facility, by measuring the resistance of a CFRC disc-shaped sample between graphite punches, and subtracting the resistance measured in a second experiment without sample. The thermal conductivity and electrical resistivity of CFRC plates in both characteristic directions are shown in Figure 2. The related properties of graphite R 7710 also are presented for comparison. The thermal conductivity of CFRC in the direction of heat flow () is 10–20 times (depending on temperature) lower than that of graphite. Accordingly, the resistivity of CFRC plate in the direction of current flow () is much larger than the resistivity of R 7710 graphite. However, the total resistance of CFRC plate is still low enough to be critical for the conductivity of entire FAST/SPS setup.

3.2.2. Contact Properties

The elements of both discussed setups have merely horizontally placed contact surfaces. The contacts are pressurized by the hydraulic cylinder of SPS device. The electrical and thermal resistance of horizontal contacts is usually low, and even may be not considered in FEM modeling [14,15]. However, electrical and thermal contact properties must be defined in FEM model to enable appropriate numerical analysis. In the present study, the specific electric conductivity of horizontal contacts σc was described with the empirical formula (12) proposed by Wei et al., [16].
σ c   = 10 ( 0.24   ×   ln T + 1.94 ) ×   ( 27.61   ×   p 1.09 )   S mm 2
Here, T is the temperature (°C) and p is the contact pressure (MPa). In our model, all contact surfaces had the shape of a disc with an external diameter of 80 mm and with a central round hole of 10 mm. With an applied load of 44 kN during entire SPS cycle the contact pressure was p = 9 MPa. The specific thermal conductivity of contacts λc was taken from the paper by Vanmeensel et al., [17].

3.3. Modeling Procedure

The ANSYS® Mechanical APDL 15.0 software (ANSYS Inc., Canonsburg, PA, USA) was used for finite element modeling. The model was implemented as an APDL input file.

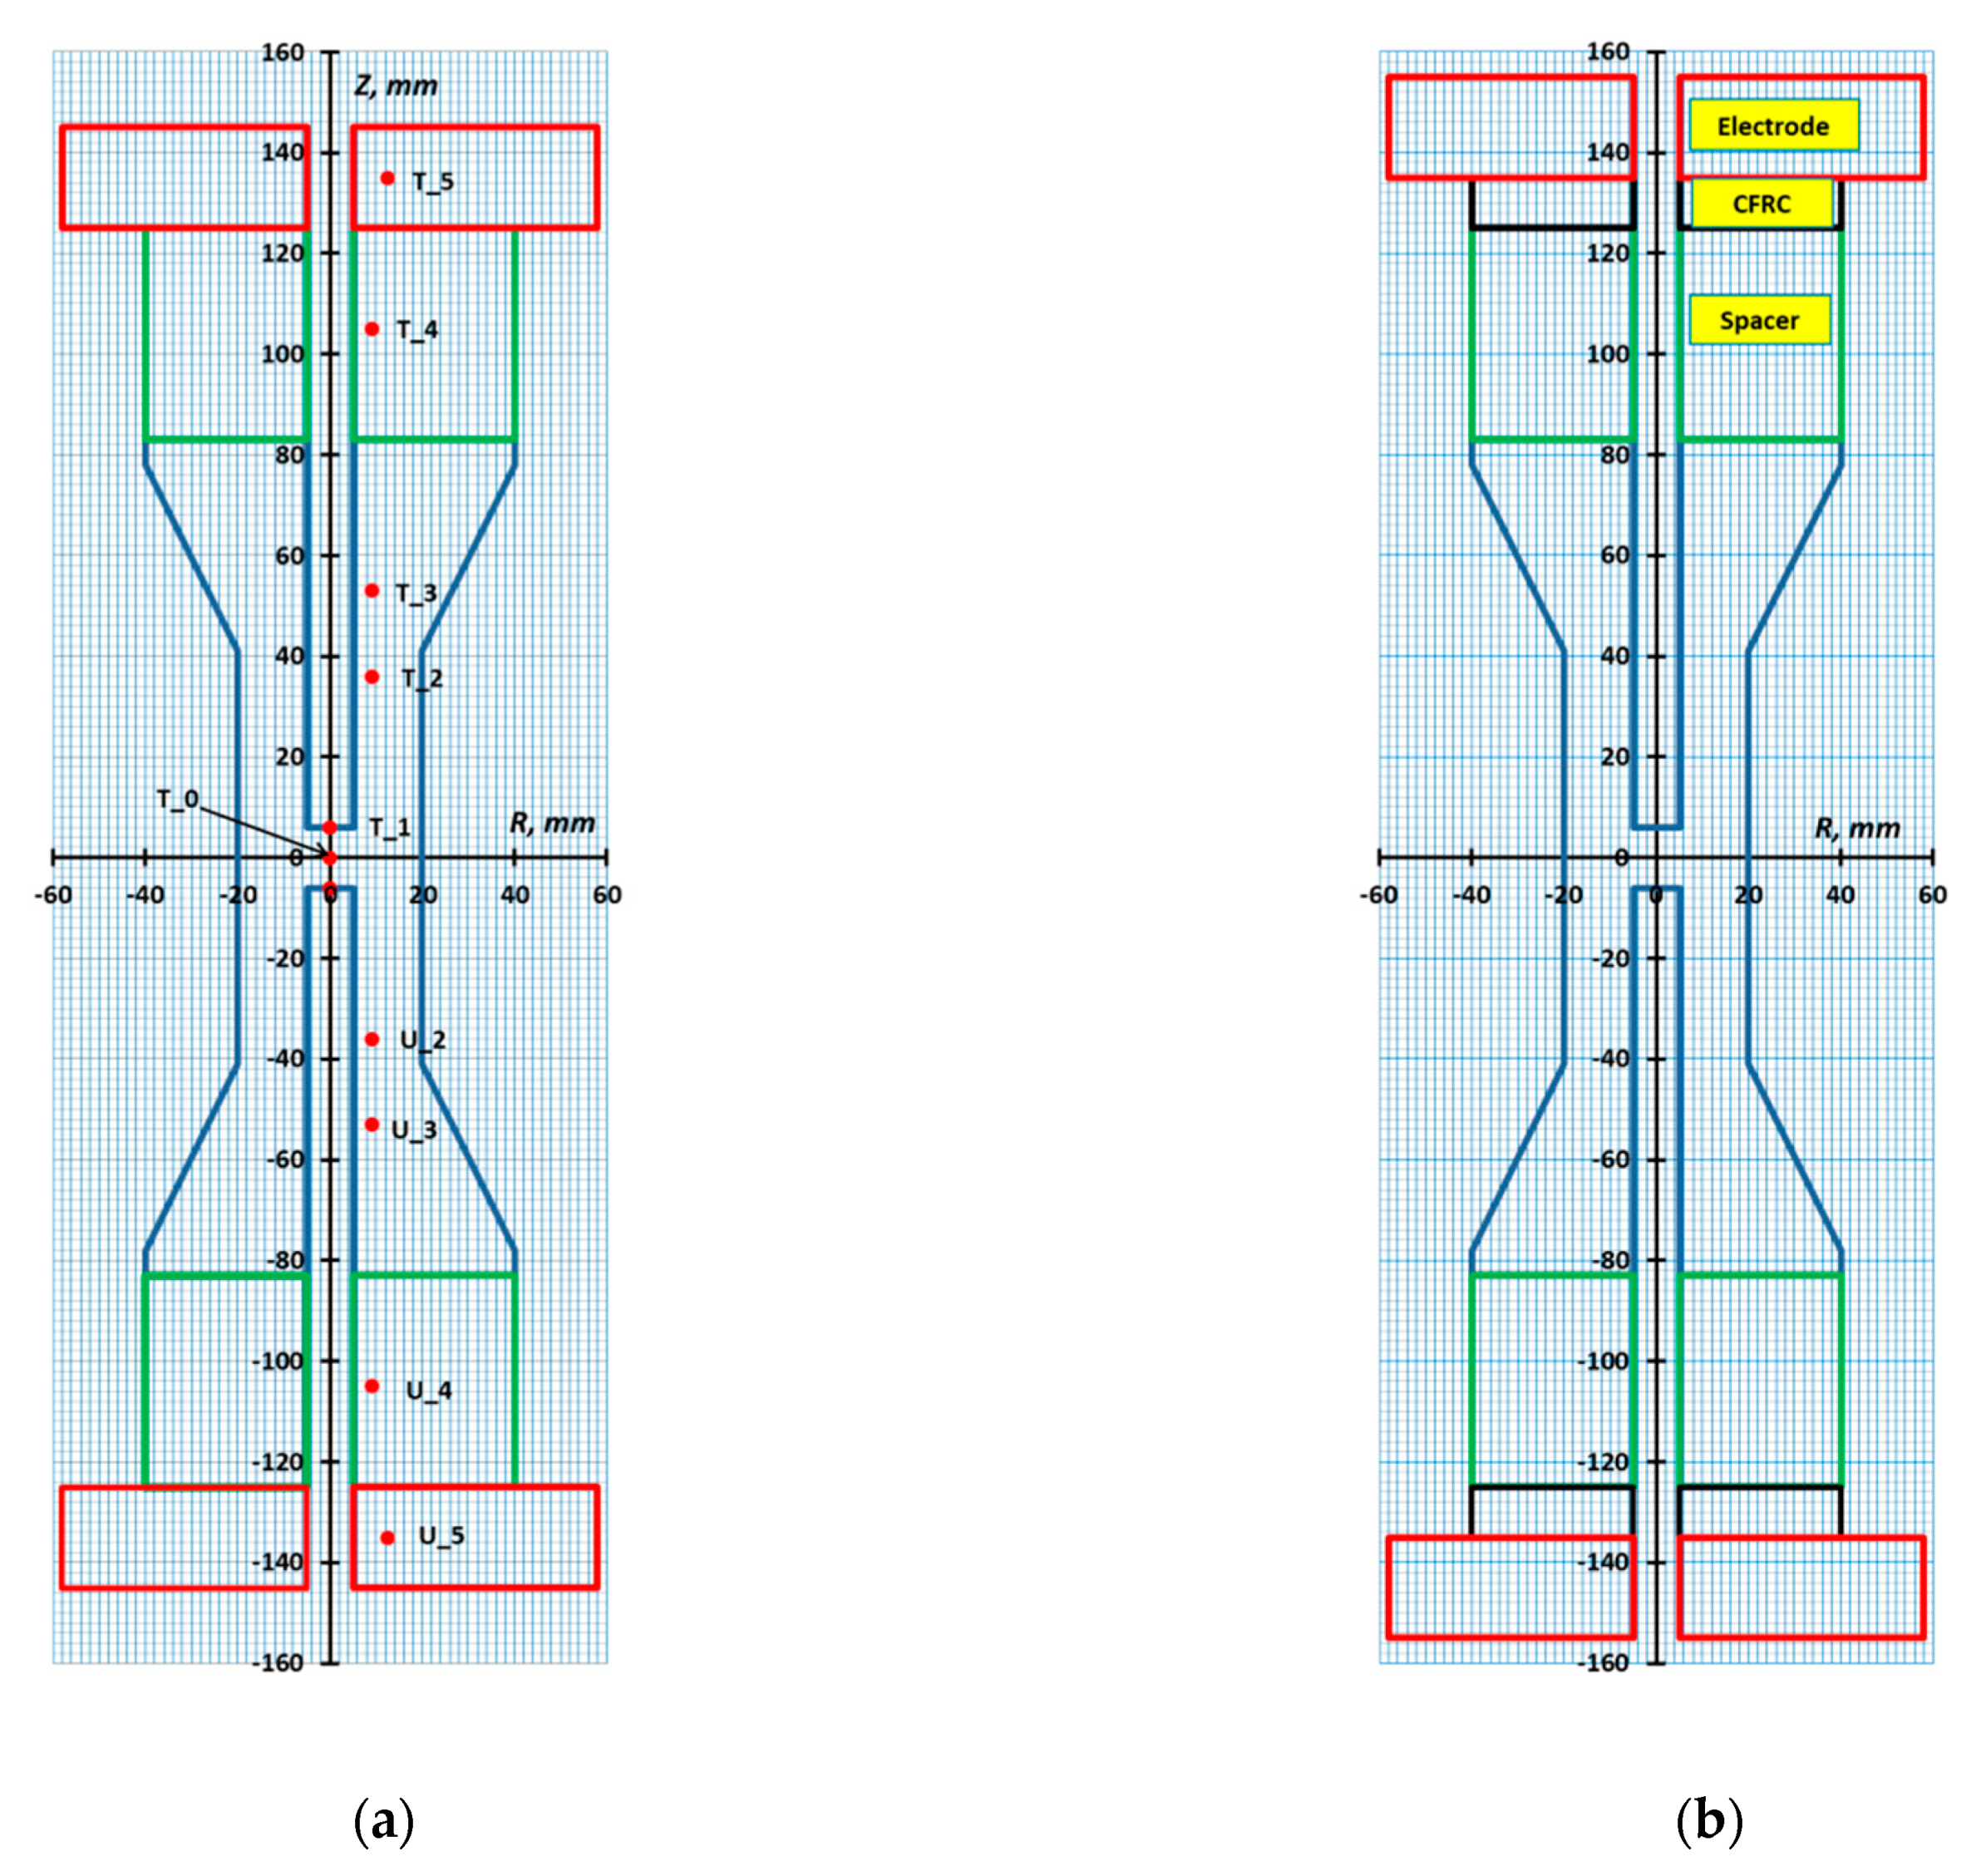
3.3.1. Geometry and Meshing

Due to rotational symmetry, only a half of the entire configuration was considered. The quadrilateral-shaped, axisymmetric PLANE 223 element with thermal-electrical capability and with a size of around 2 mm was used. The combination of free and mapped (where possible) meshing was applied. Contact interaction was modeled by TARGE169 and CONTA171 elements.

3.3.2. Initial, Boundary Conditions, and Load

An initial temperature of 25 °C was taken for the entire setup. A heat transfer coefficient of h = 2870 W/(m2∙°C) was applied on internal surfaces of both water-cooled electrodes. With this value, the best conformity with measured temperature of electrode (T_5) has been achieved. In our experiments, some difference in the temperature of upper and lower electrode was observed. However, this difference was only several degrees and did not influence remarkable the temperature field in the relatively high dummy. A constant cooling water temperature of Tw = 25.5 °C was used. According to recommendations published by Zavaliangos et al., an emissivity coefficient of 0.8 was taken for graphite (the dummy and the spacers) [18]. An emissivity of 0.2 was applied on external surfaces of electrodes. An emissivity coefficient of 0.945 within all internal holes of setup was used. The electric potential on the bottom of the lower electrode was set to zero. A time-varying voltage was applied on the top of the upper electrode. This voltage was tuned by the virtual PID controller to generate the programmed time-temperature profile. The voltage on the top was set to zero during cooling.

3.3.3. Virtual PID Controller

The standard PID algorithm was applied. Temperature in location T_1 (Figure 1) was defined as the process variable. Voltage on the top u ( t ) was taken as the control variable. Accordingly, the control function can be expressed by Equation (13).
u ( t ) = K p · Δ T ( t ) + K i · 0 t Δ T ( t ) · d t + K d · d d t Δ T ( t )
Here Kp is the proportional gain; Ki is the integral gain; Kd is the derivative gain; t is the instantaneous time; Δ T ( t ) = T s ( t ) T c a l ( t ) = error; T s ( t ) is the set temperature and T c a l ( t ) is the calculated temperature. The control function was rearranged to the finite-difference form.
u ( t ) = K p · Δ T ( t ) + K i · 0 τ Δ T ( t ) · Δ t + K d · Δ ( Δ T ( t ) ) Δ t
Here Δ t is the time step; n is the time step number ;   τ = n · Δ t = total time. The control function calculated by (14) was integrated into the used APDL code. The tuning of the PID controller was done manually: First, the proportional gain was adjusted. Then integral gain and finally derivative gain were tuned. With a time step of 1 s a good accuracy in generation of predefined time-temperature profile was achieved. Earlier, Muñoz and Anselmi-Tamburini developed a similar virtual PID controller [19]. The main distinguishing feature of their controller was the use of current as the control variable. In general, both these approaches are equivalent. However, the application of voltage is simpler in ANSYS APDL, and a discussion of the homogeneity of current density through the top electrode surface can be avoided.

4. Results

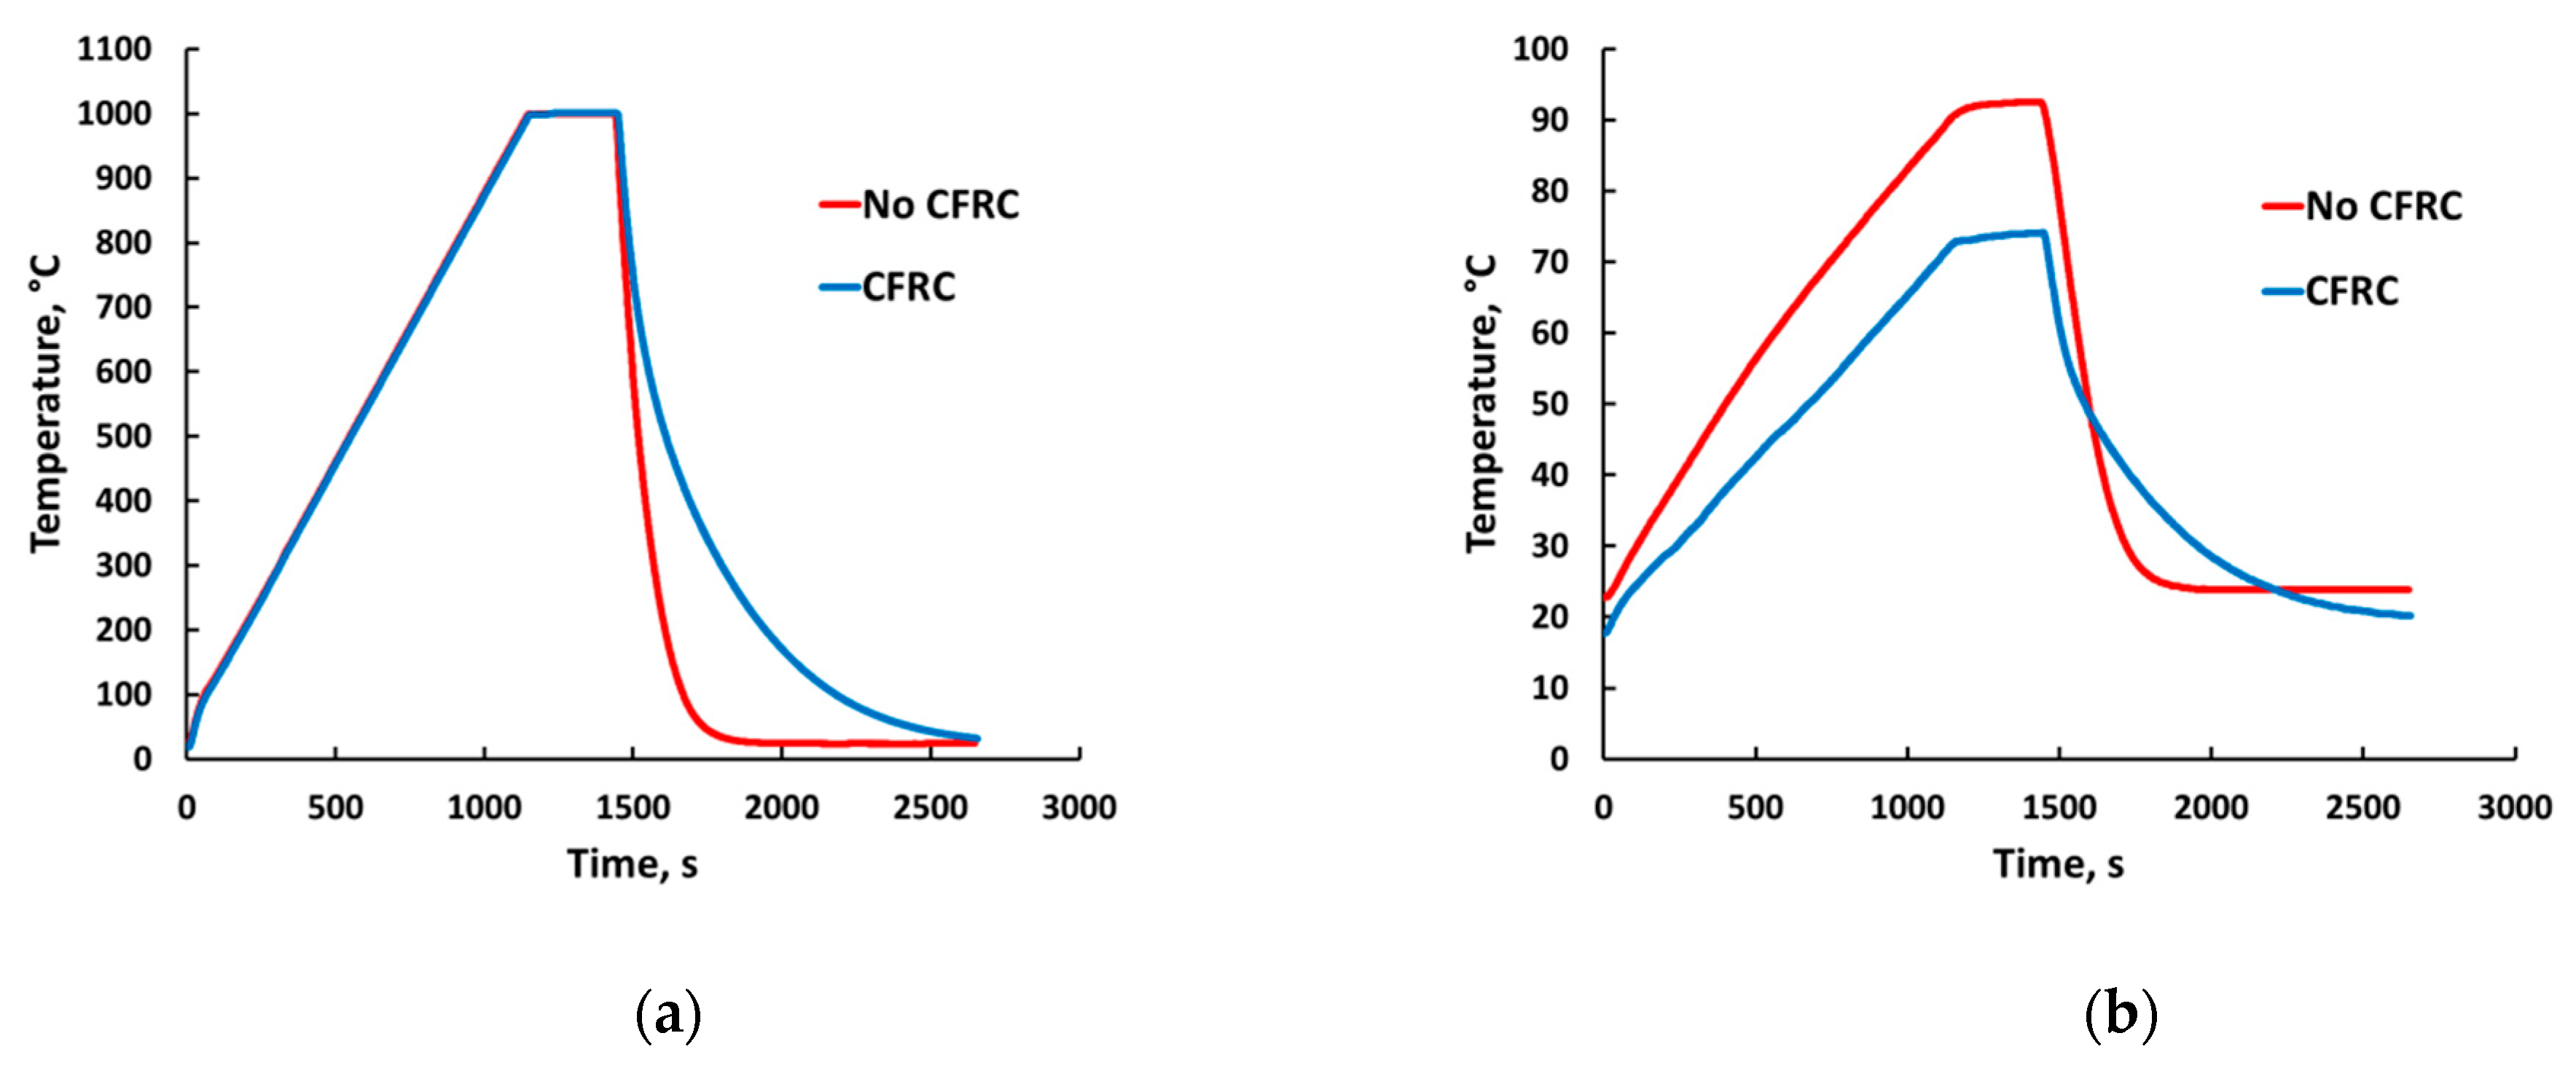
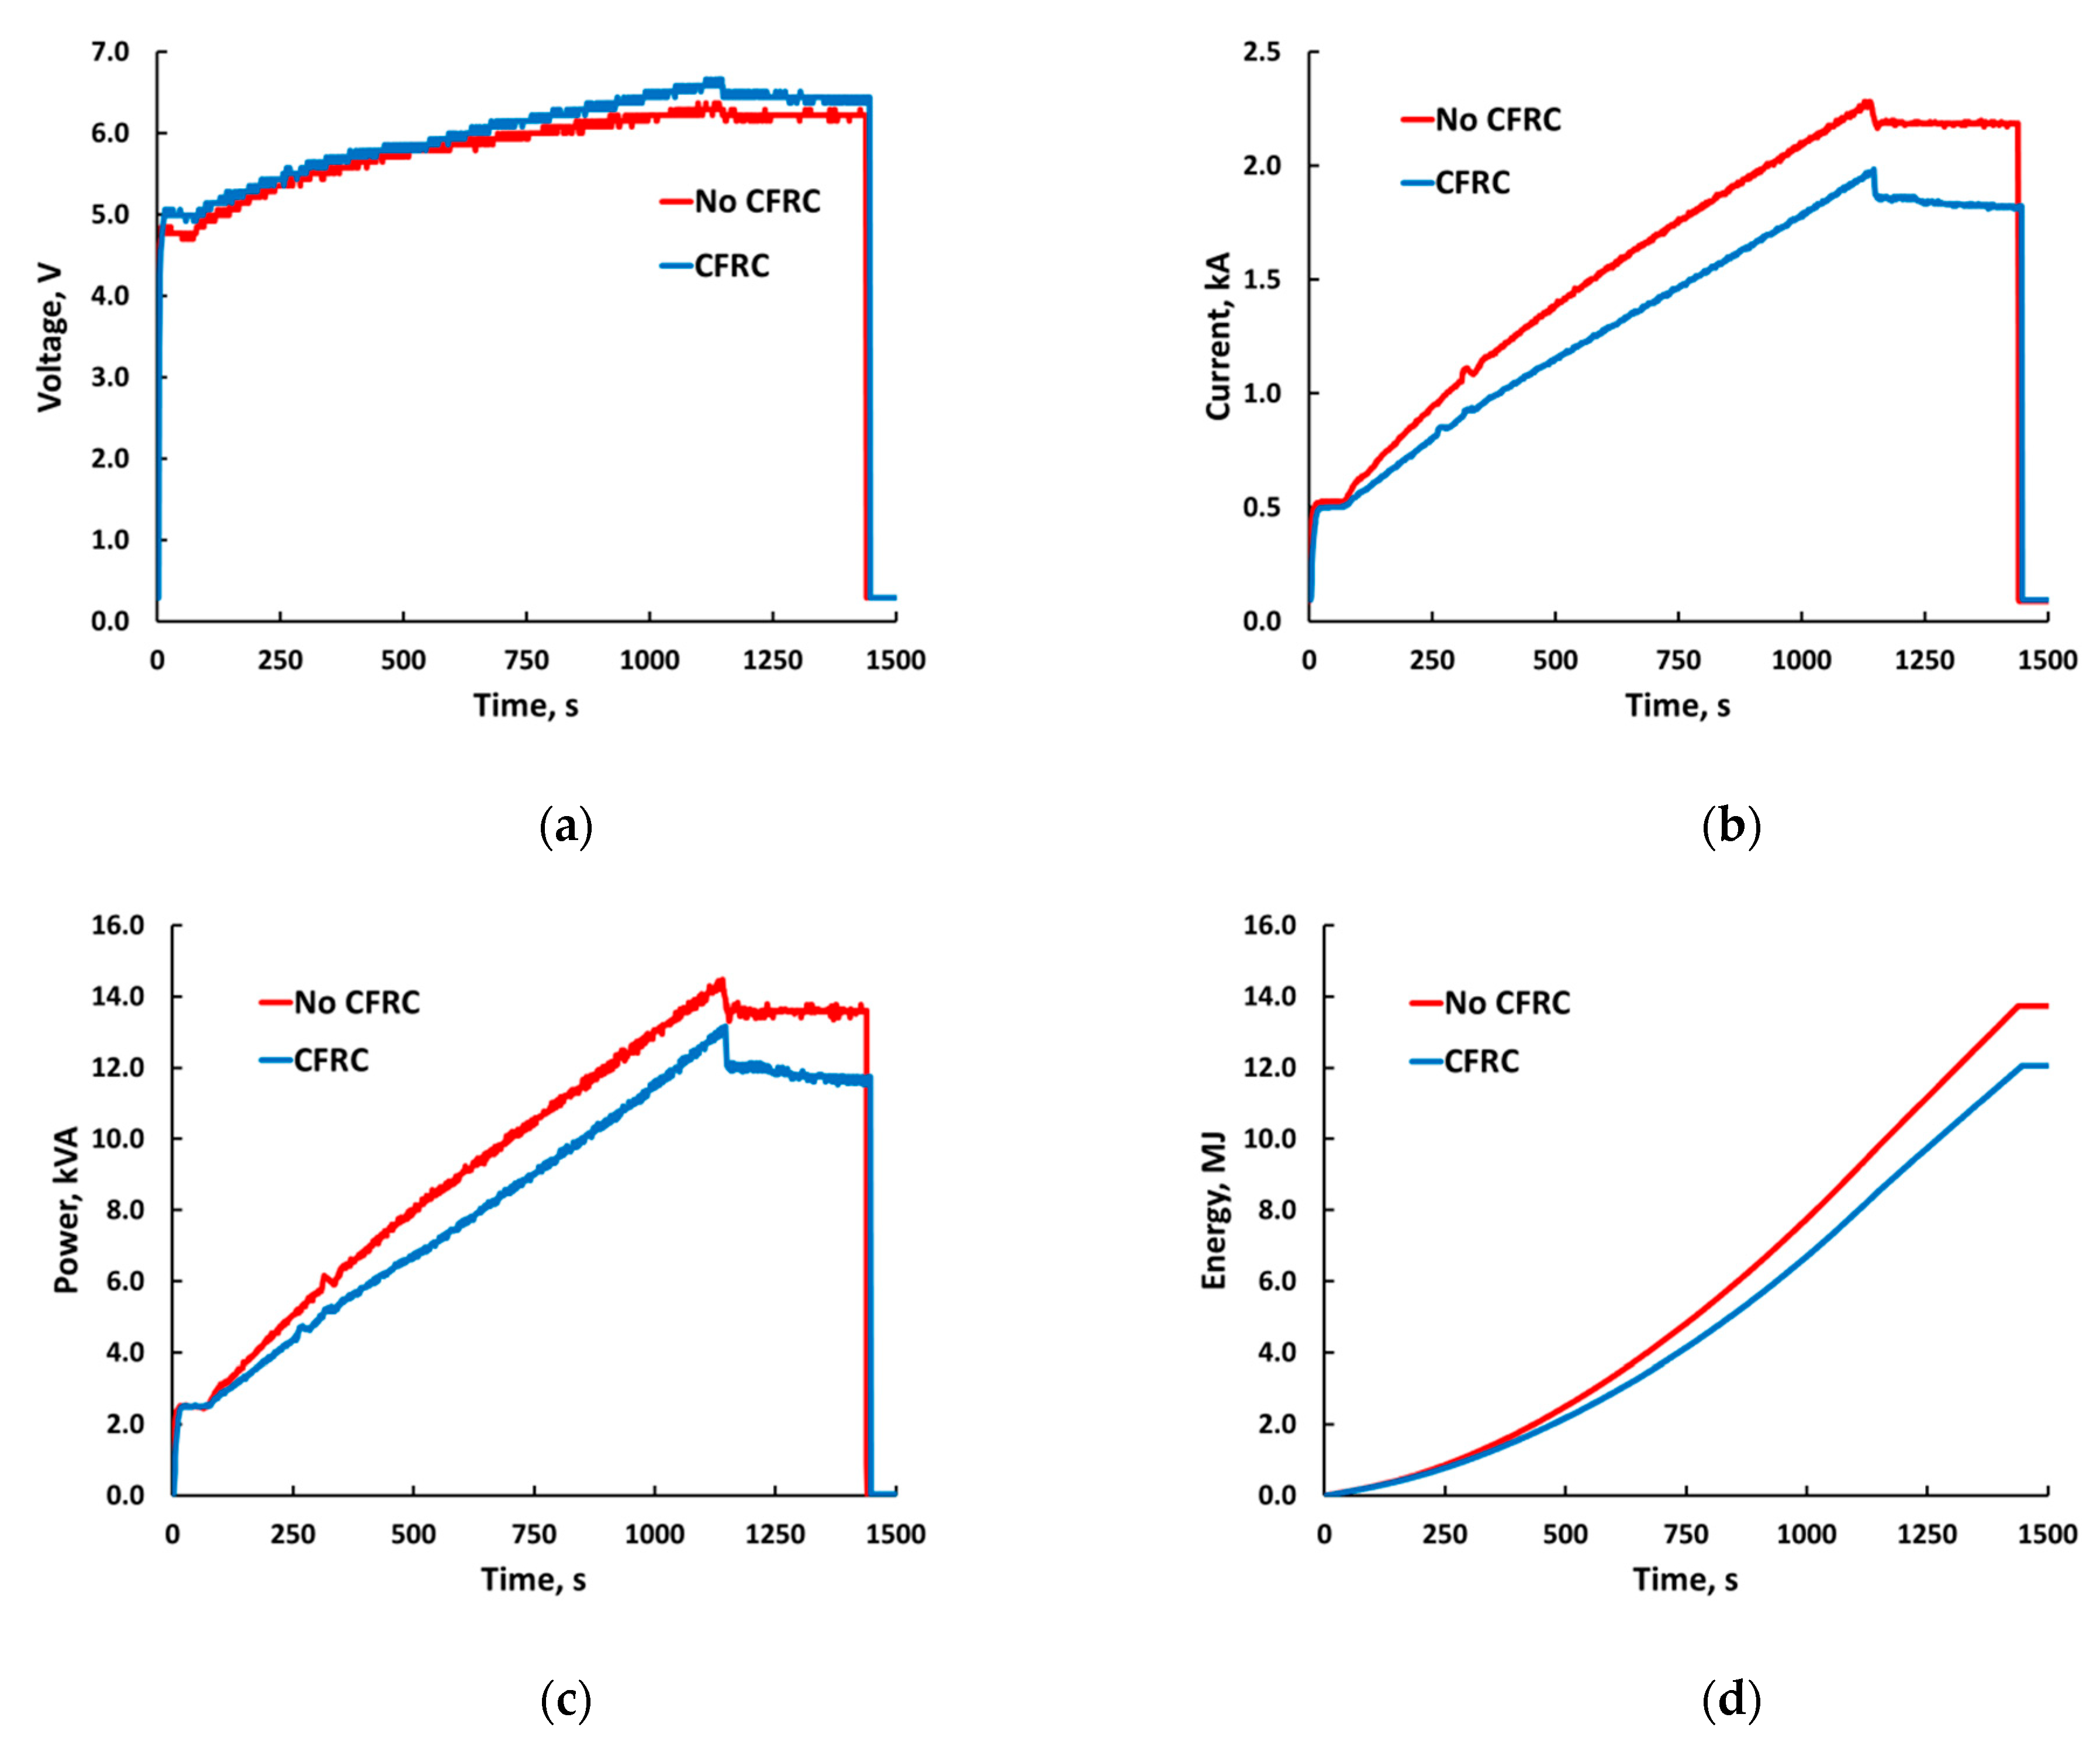
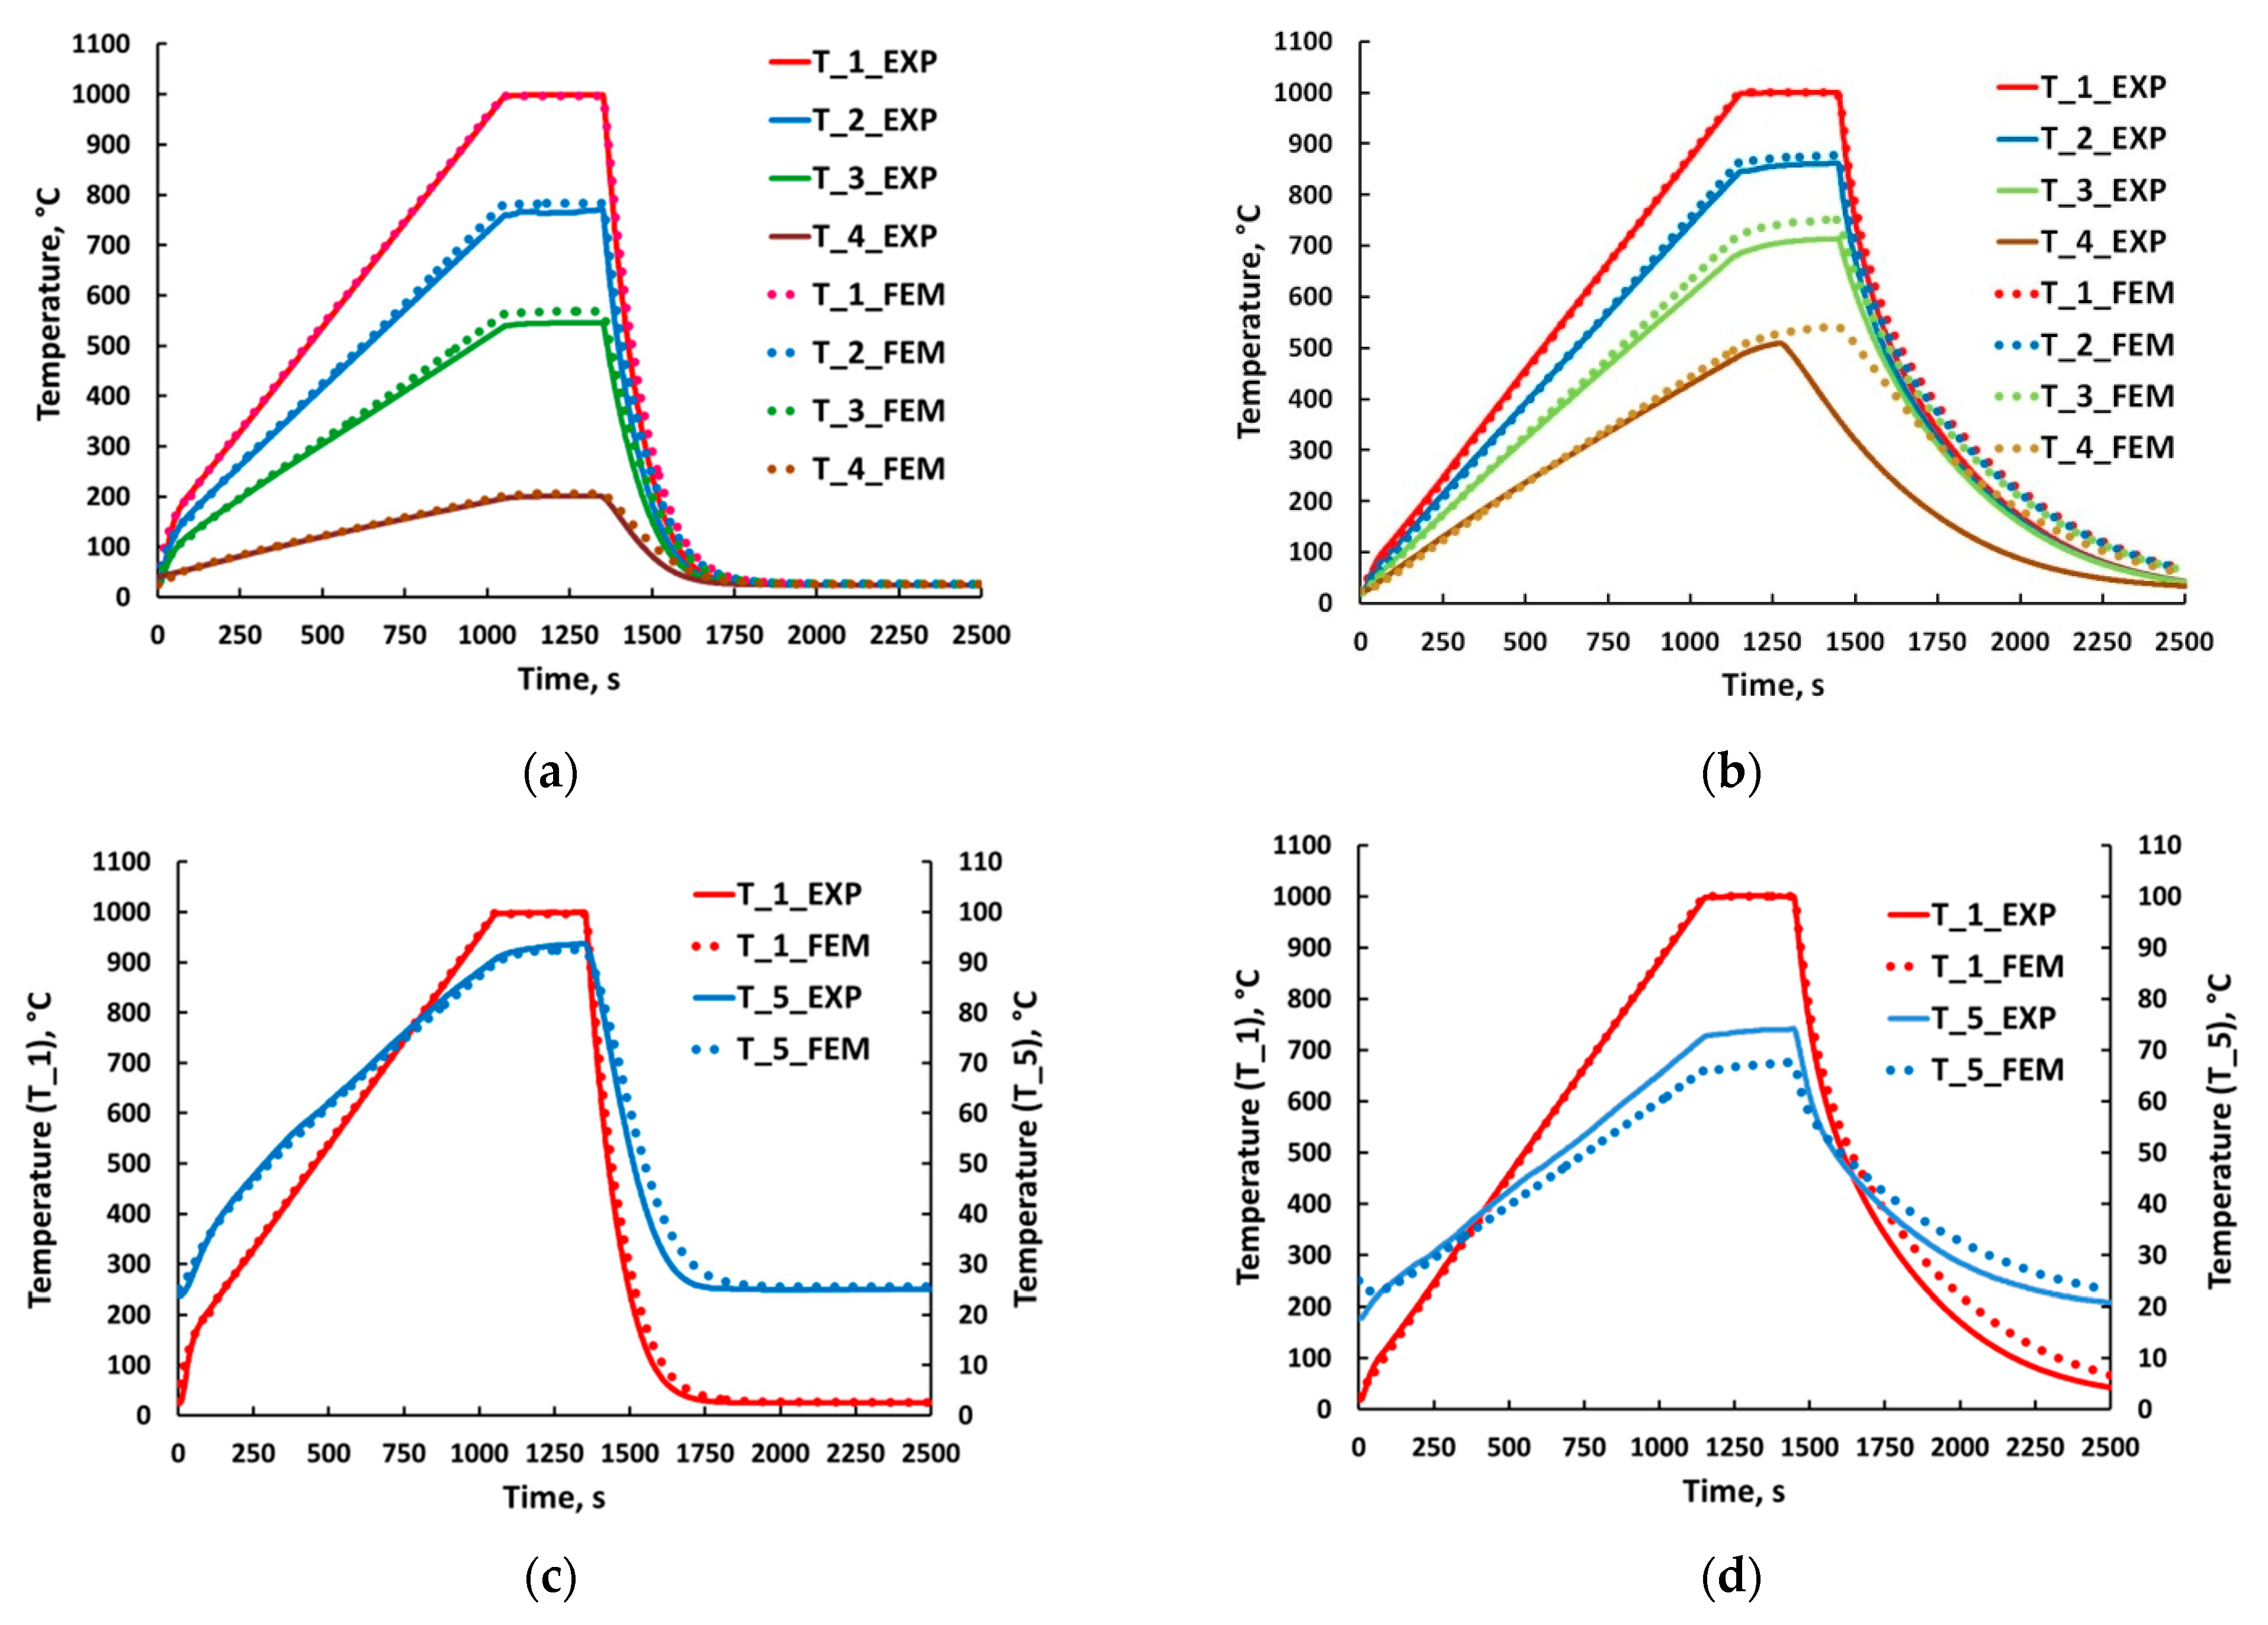
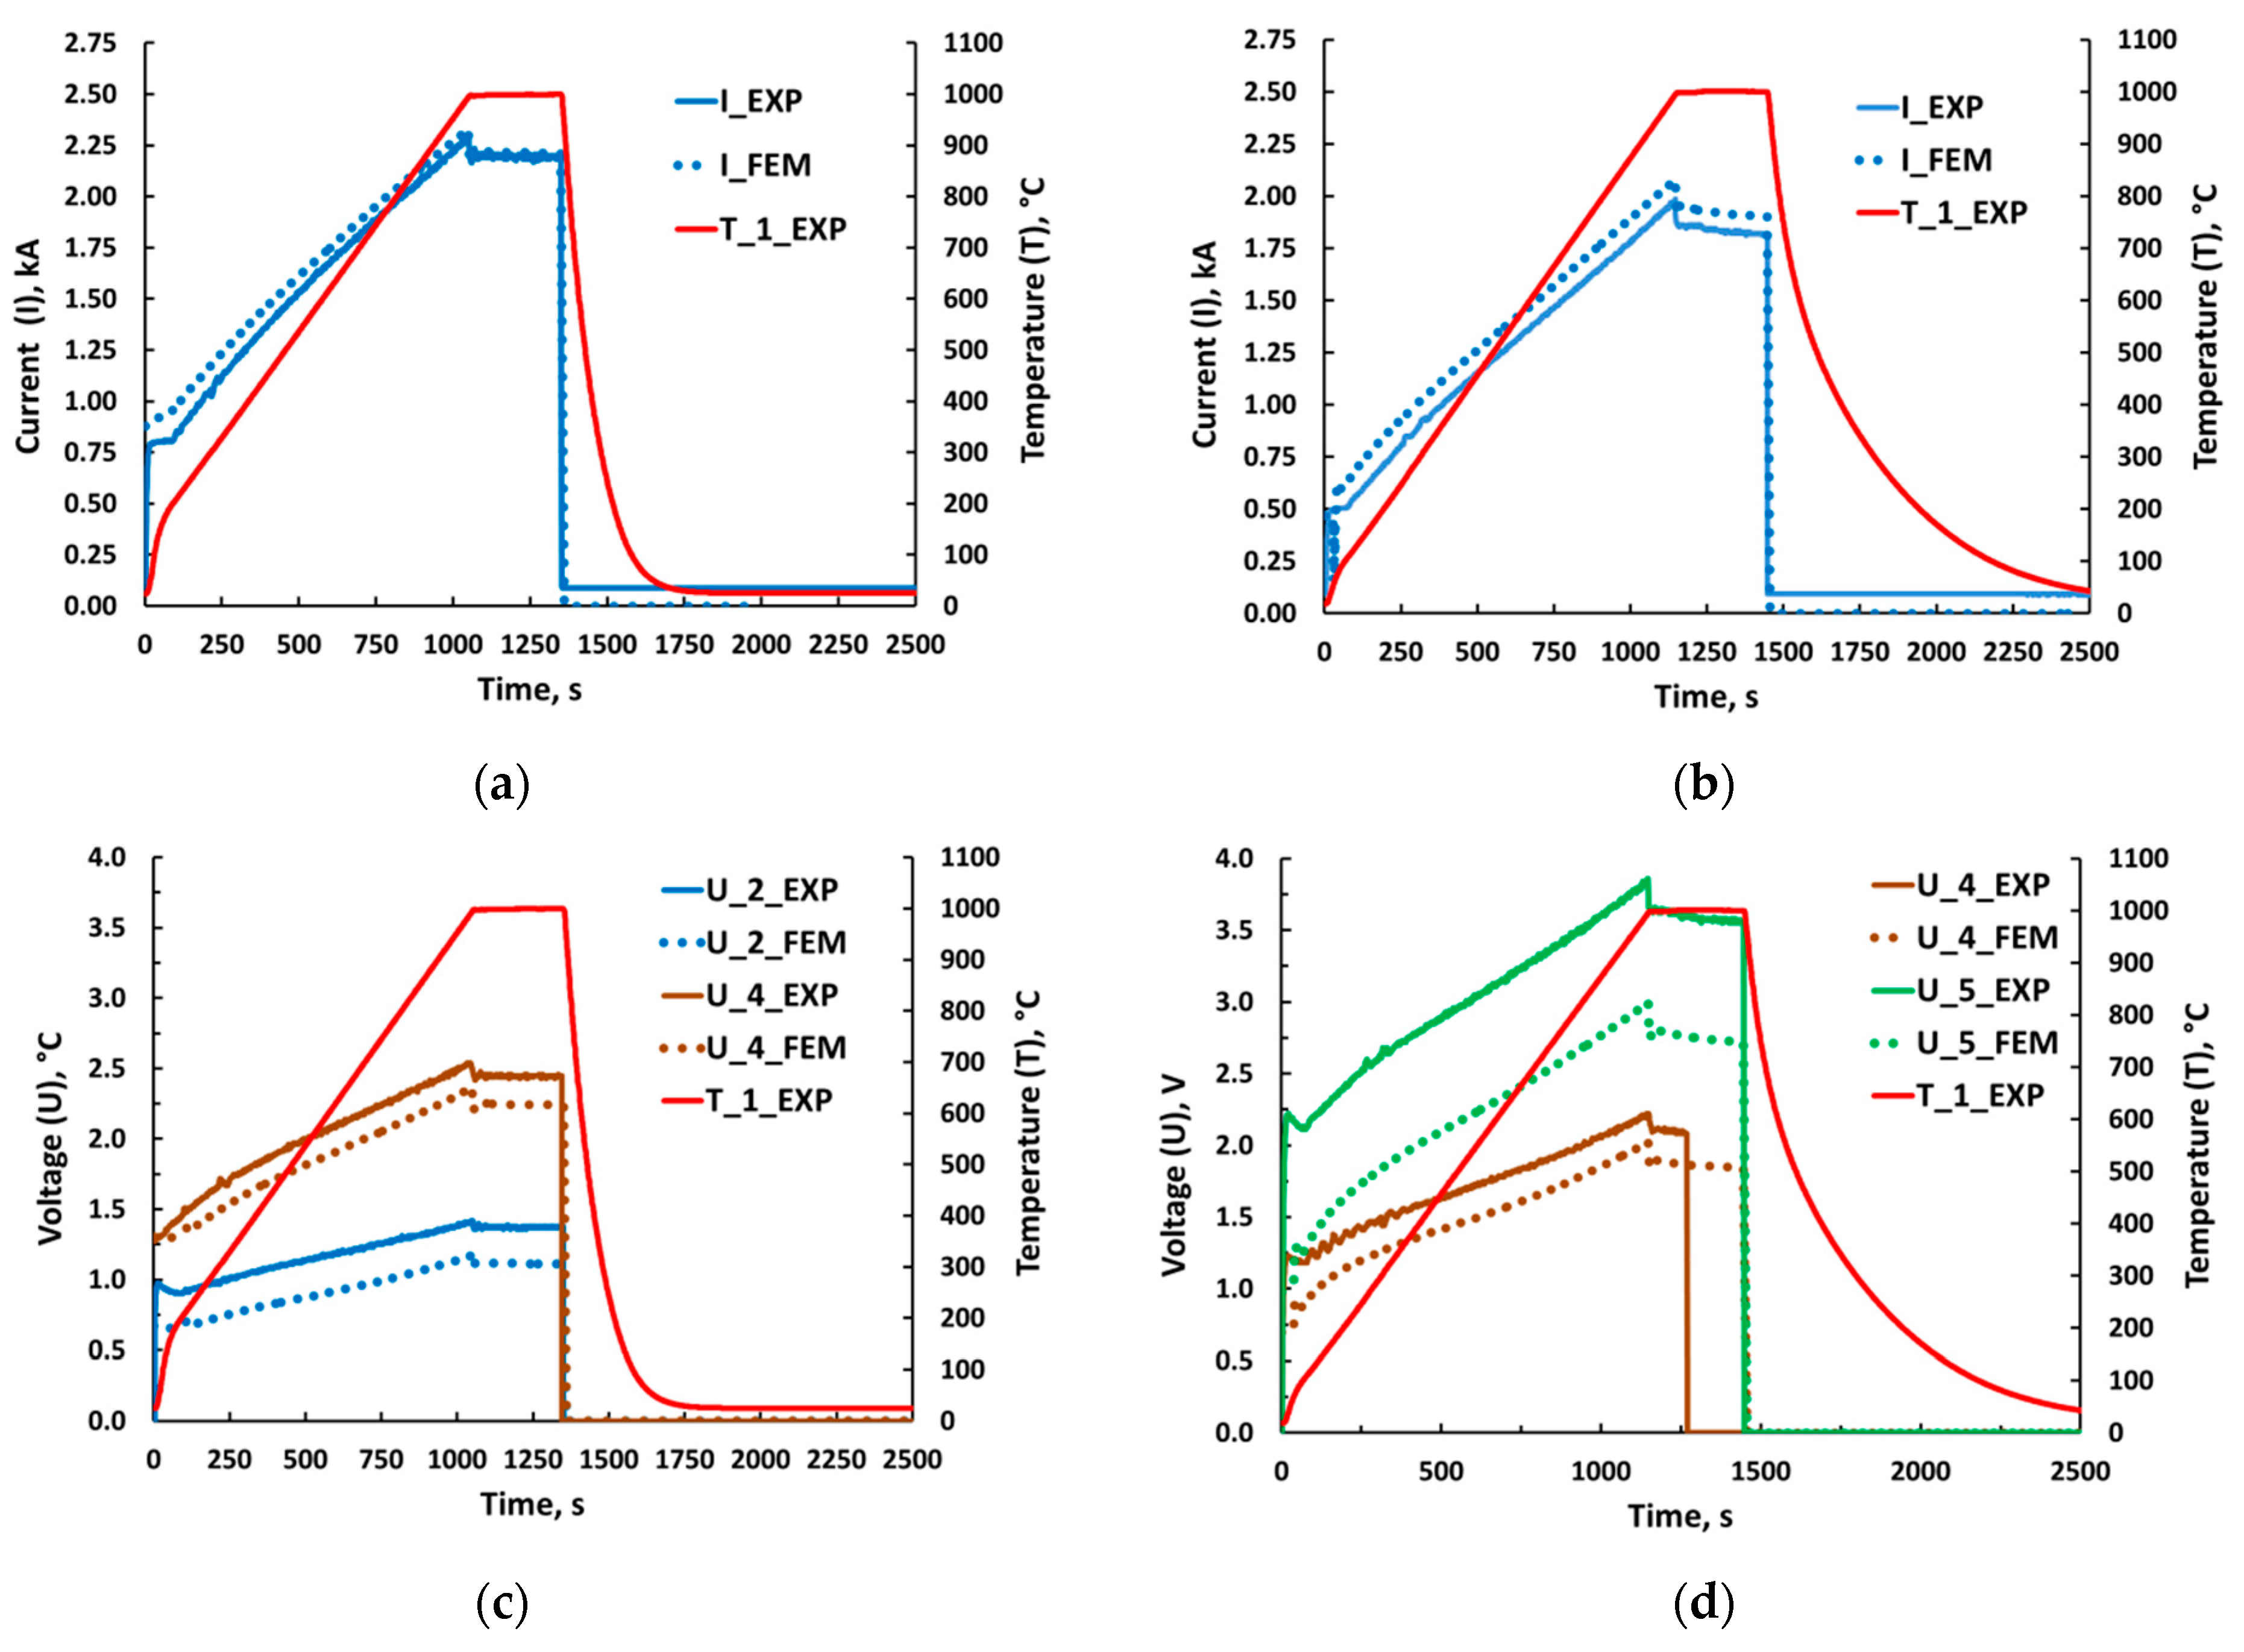
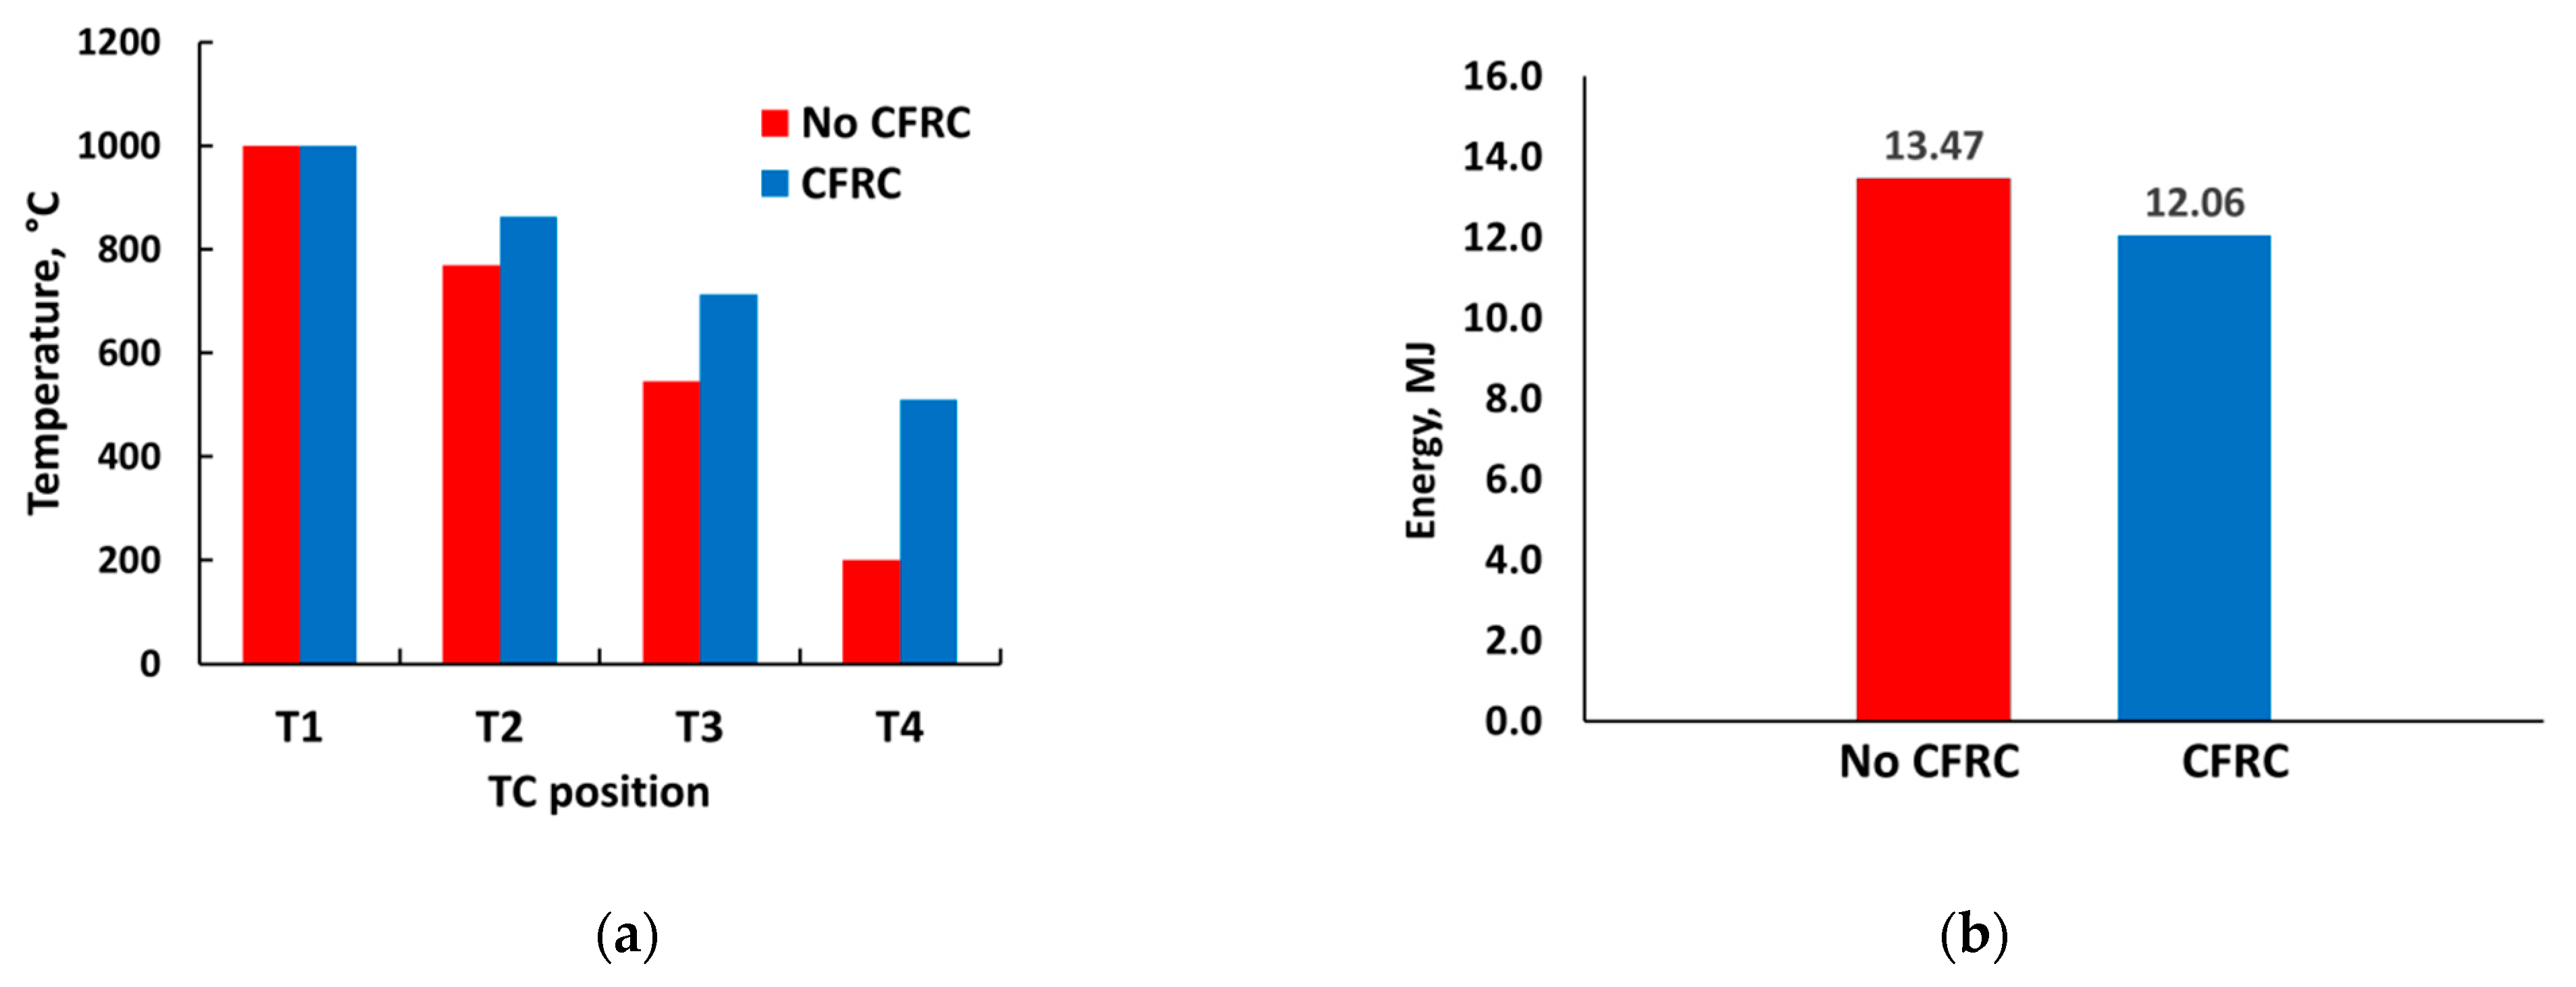
4.1. Influence of CFRC Plates on General Parameters

The influence of CFRC plates on the temperature development at T_1 (bottom of pyrometer hole) and T_5 (upper electrode) locations is shown in Figure 3. The first distinctive feature is the slower cooling for the setup with CFRC plates. The second peculiarity is the lower temperature of the water-cooled electrode. Both these issues evidence the reduced heat flow from setup towards electrodes. Thus, a decrease of temperature gradients in an axial direction can be expected. The lower temperature of electrodes is beneficial for the entire cooling system. In particular, less energy for cooling is needed. However, for the setup with CFRC plates a longer cooling time is required.
The impact of CFRC plates on the electrical quantities, power and energy is shown in Figure 4. The application of CFRC plates hardly influences the voltage measured after rectifier. An additional resistance in the circuit, originated from CFRC plates, explains a small increase in voltage. However, the electric current is notably less if CFRC plates are used. As a result, the power needed for heating and following holding is lower with CFRC plates. Accordingly, the overall energy consumed during FAST/SPS cycle is reduced when CFRC plates are used. The reduction in energy is rather moderate. However, this effect can be more noticeable at sintering with higher temperatures.

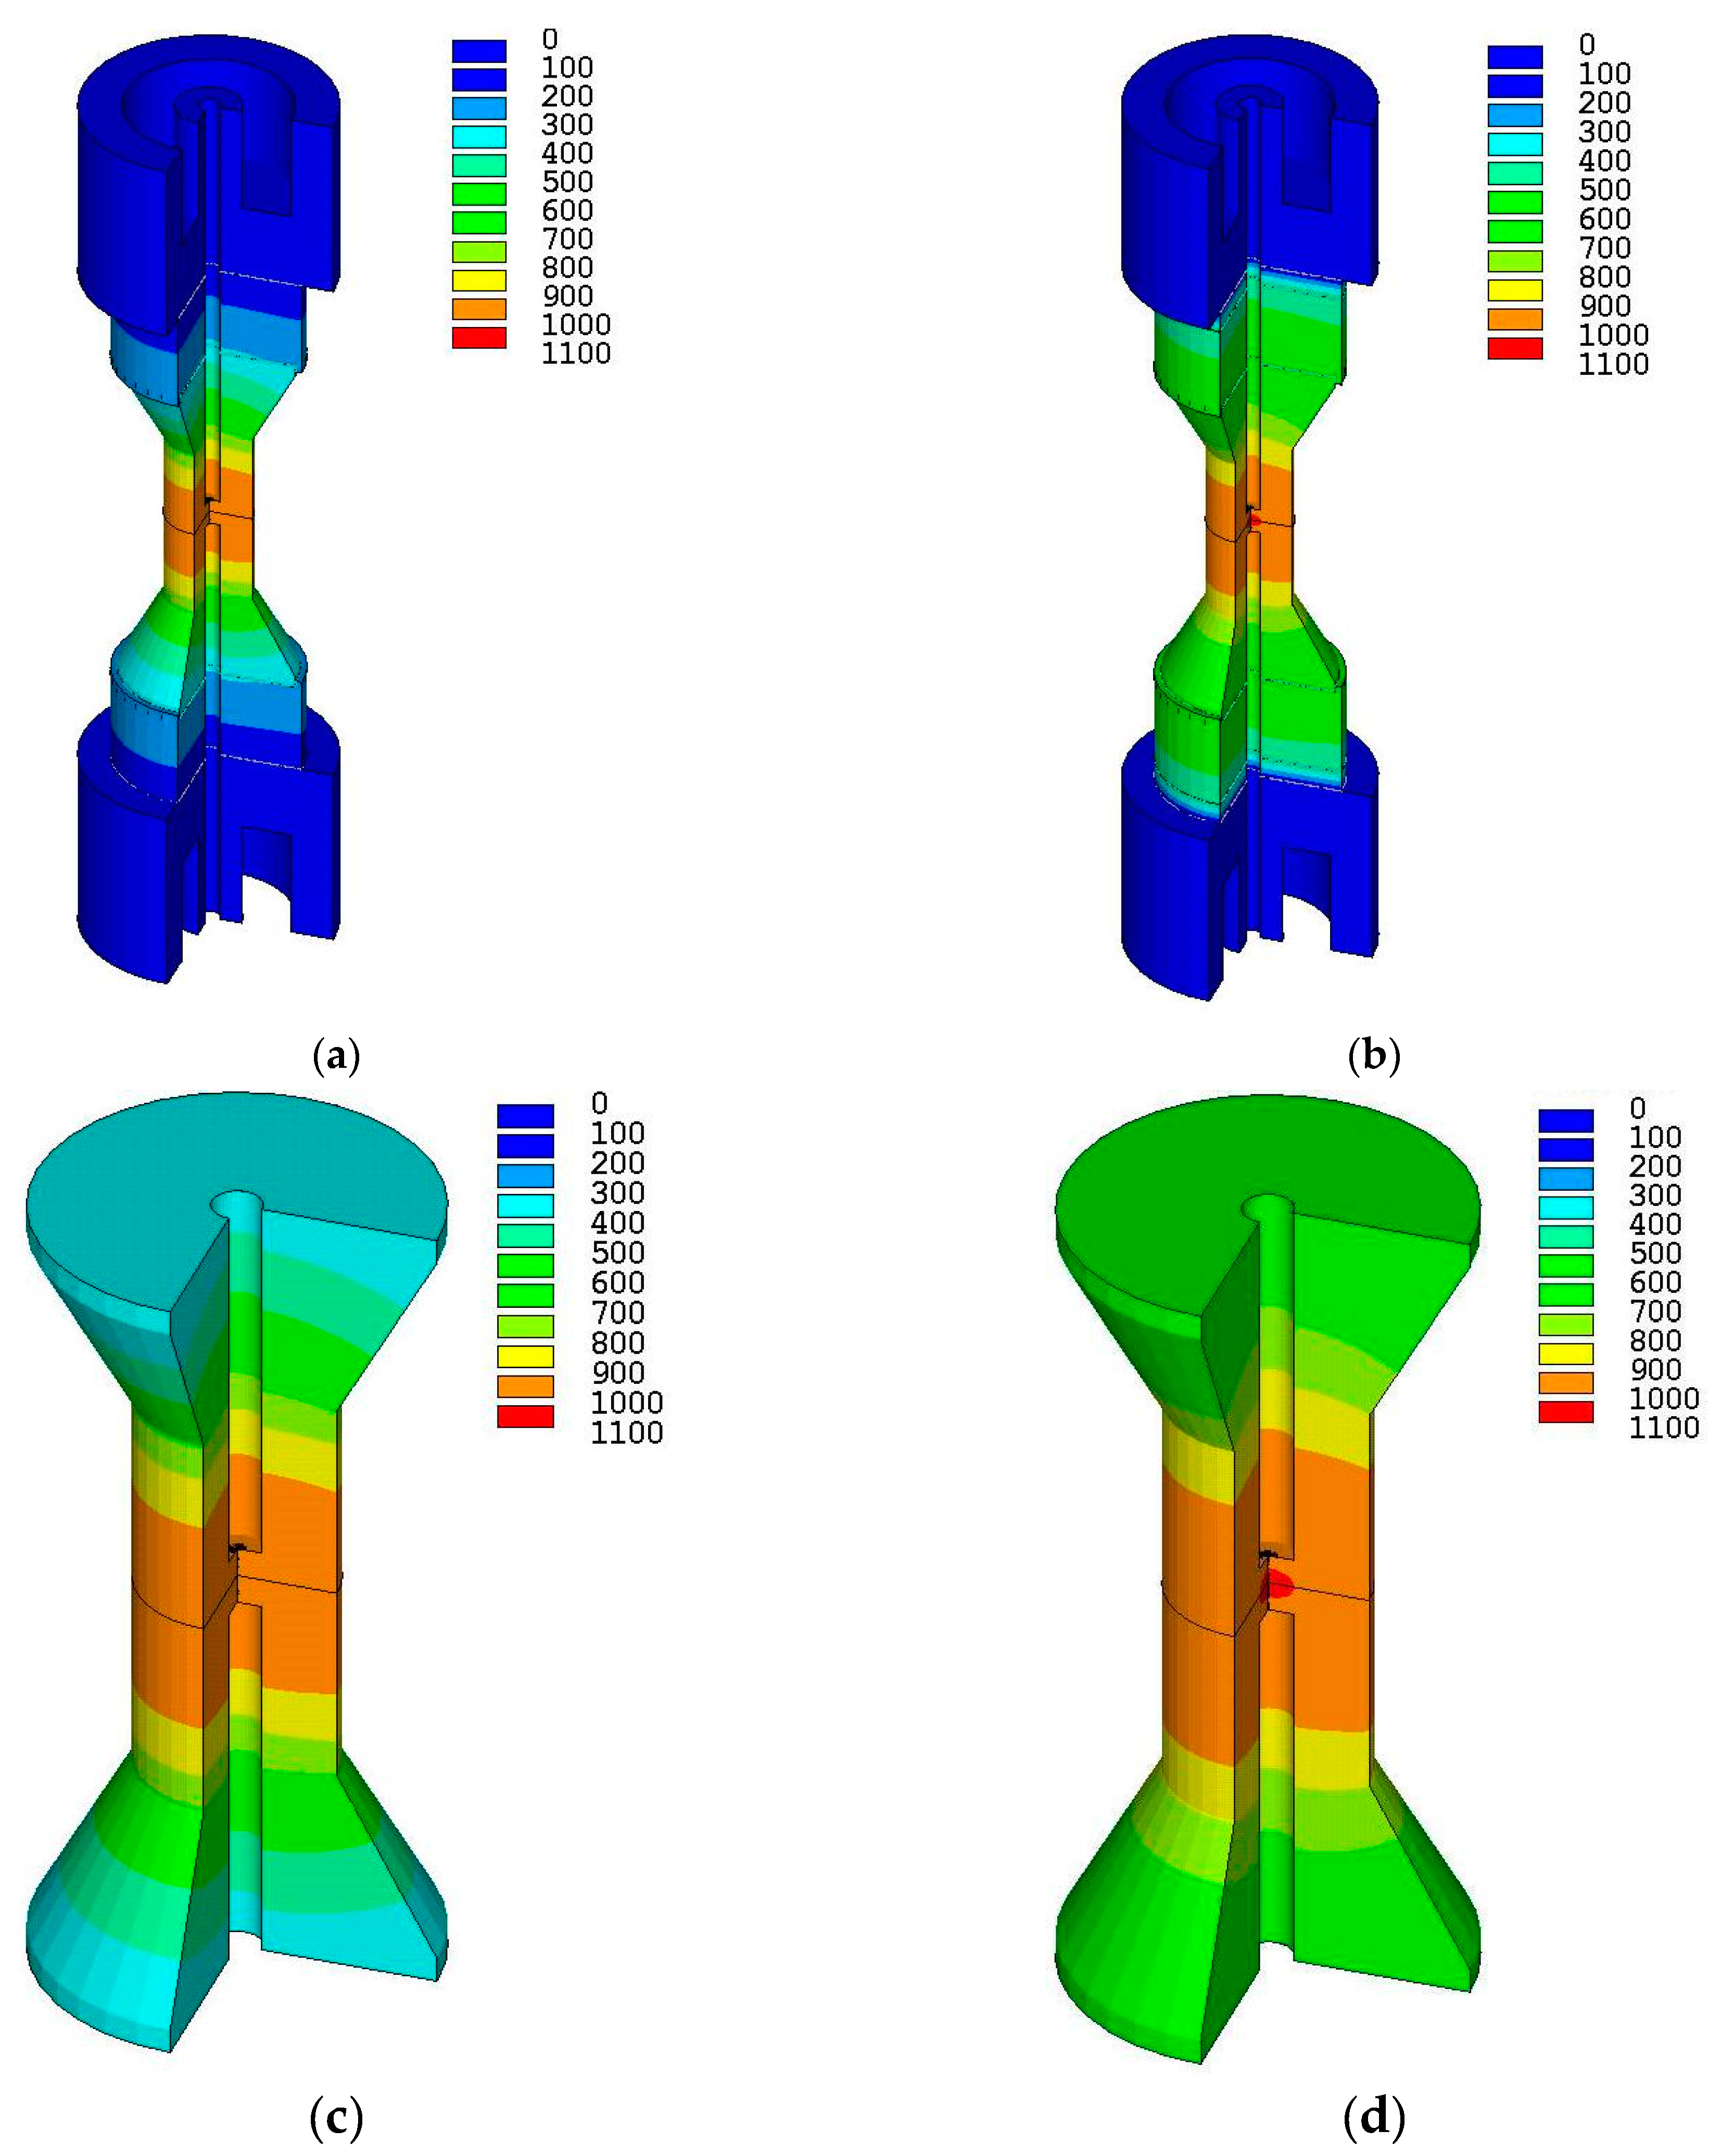
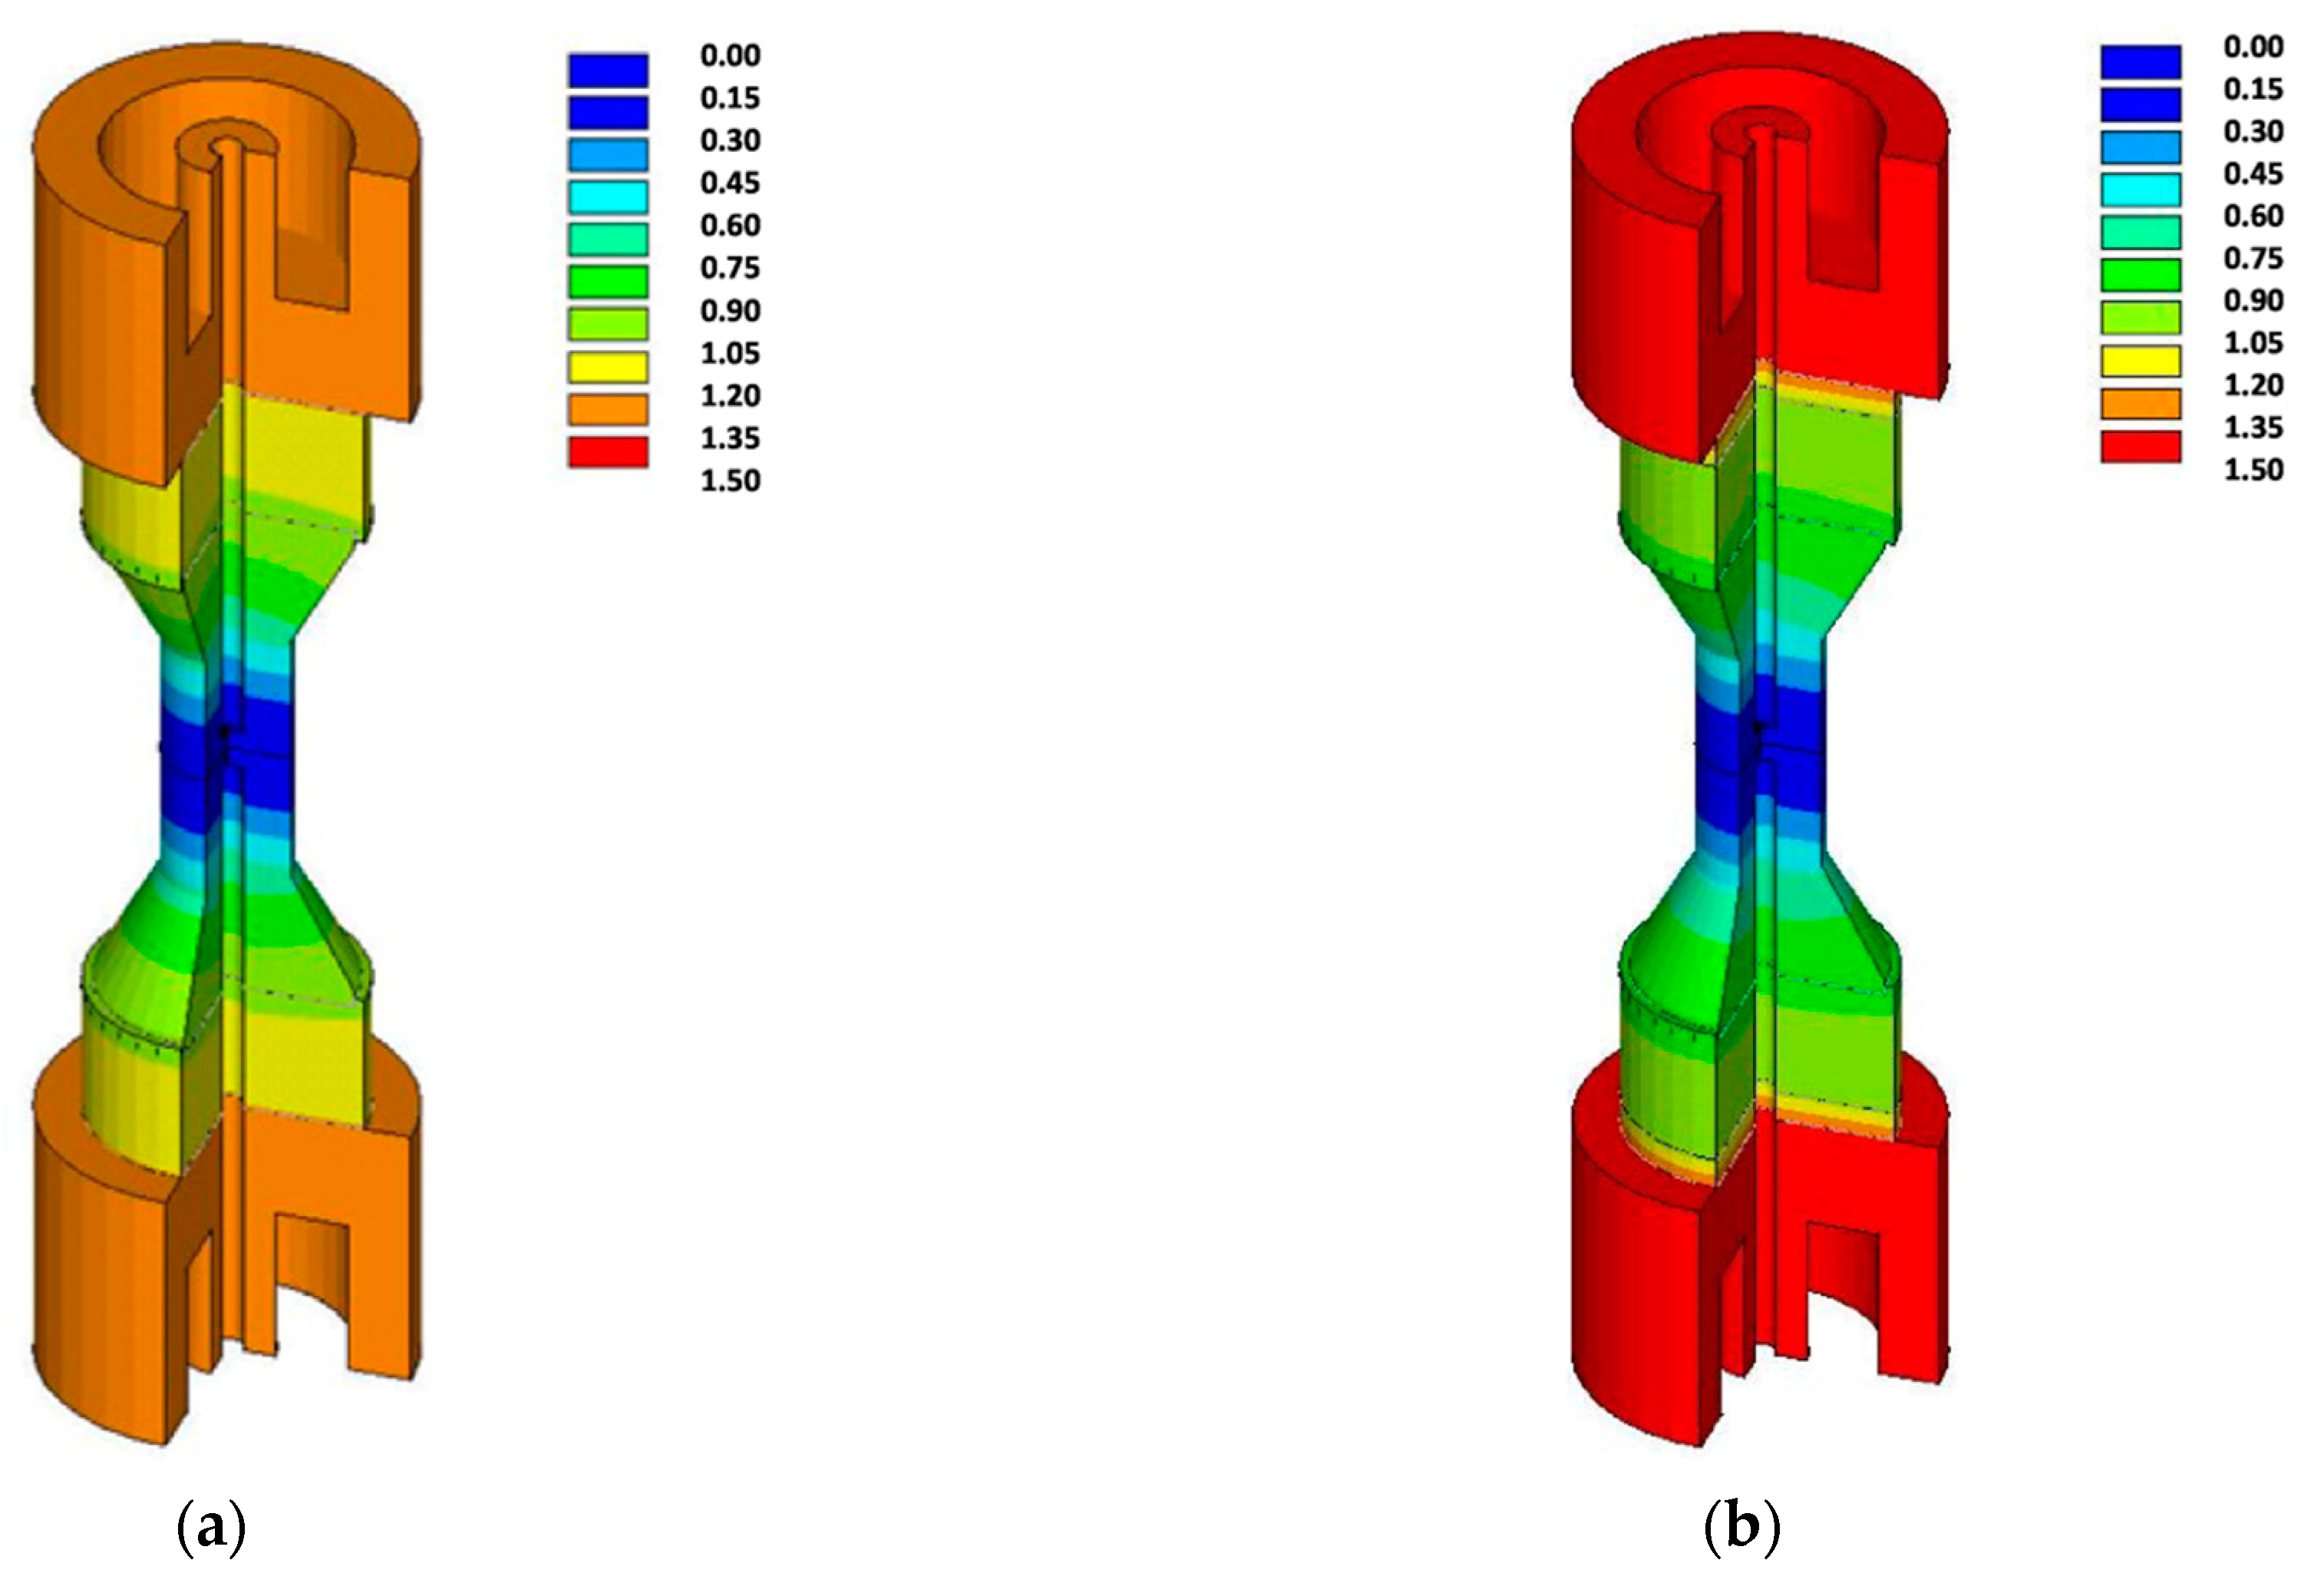
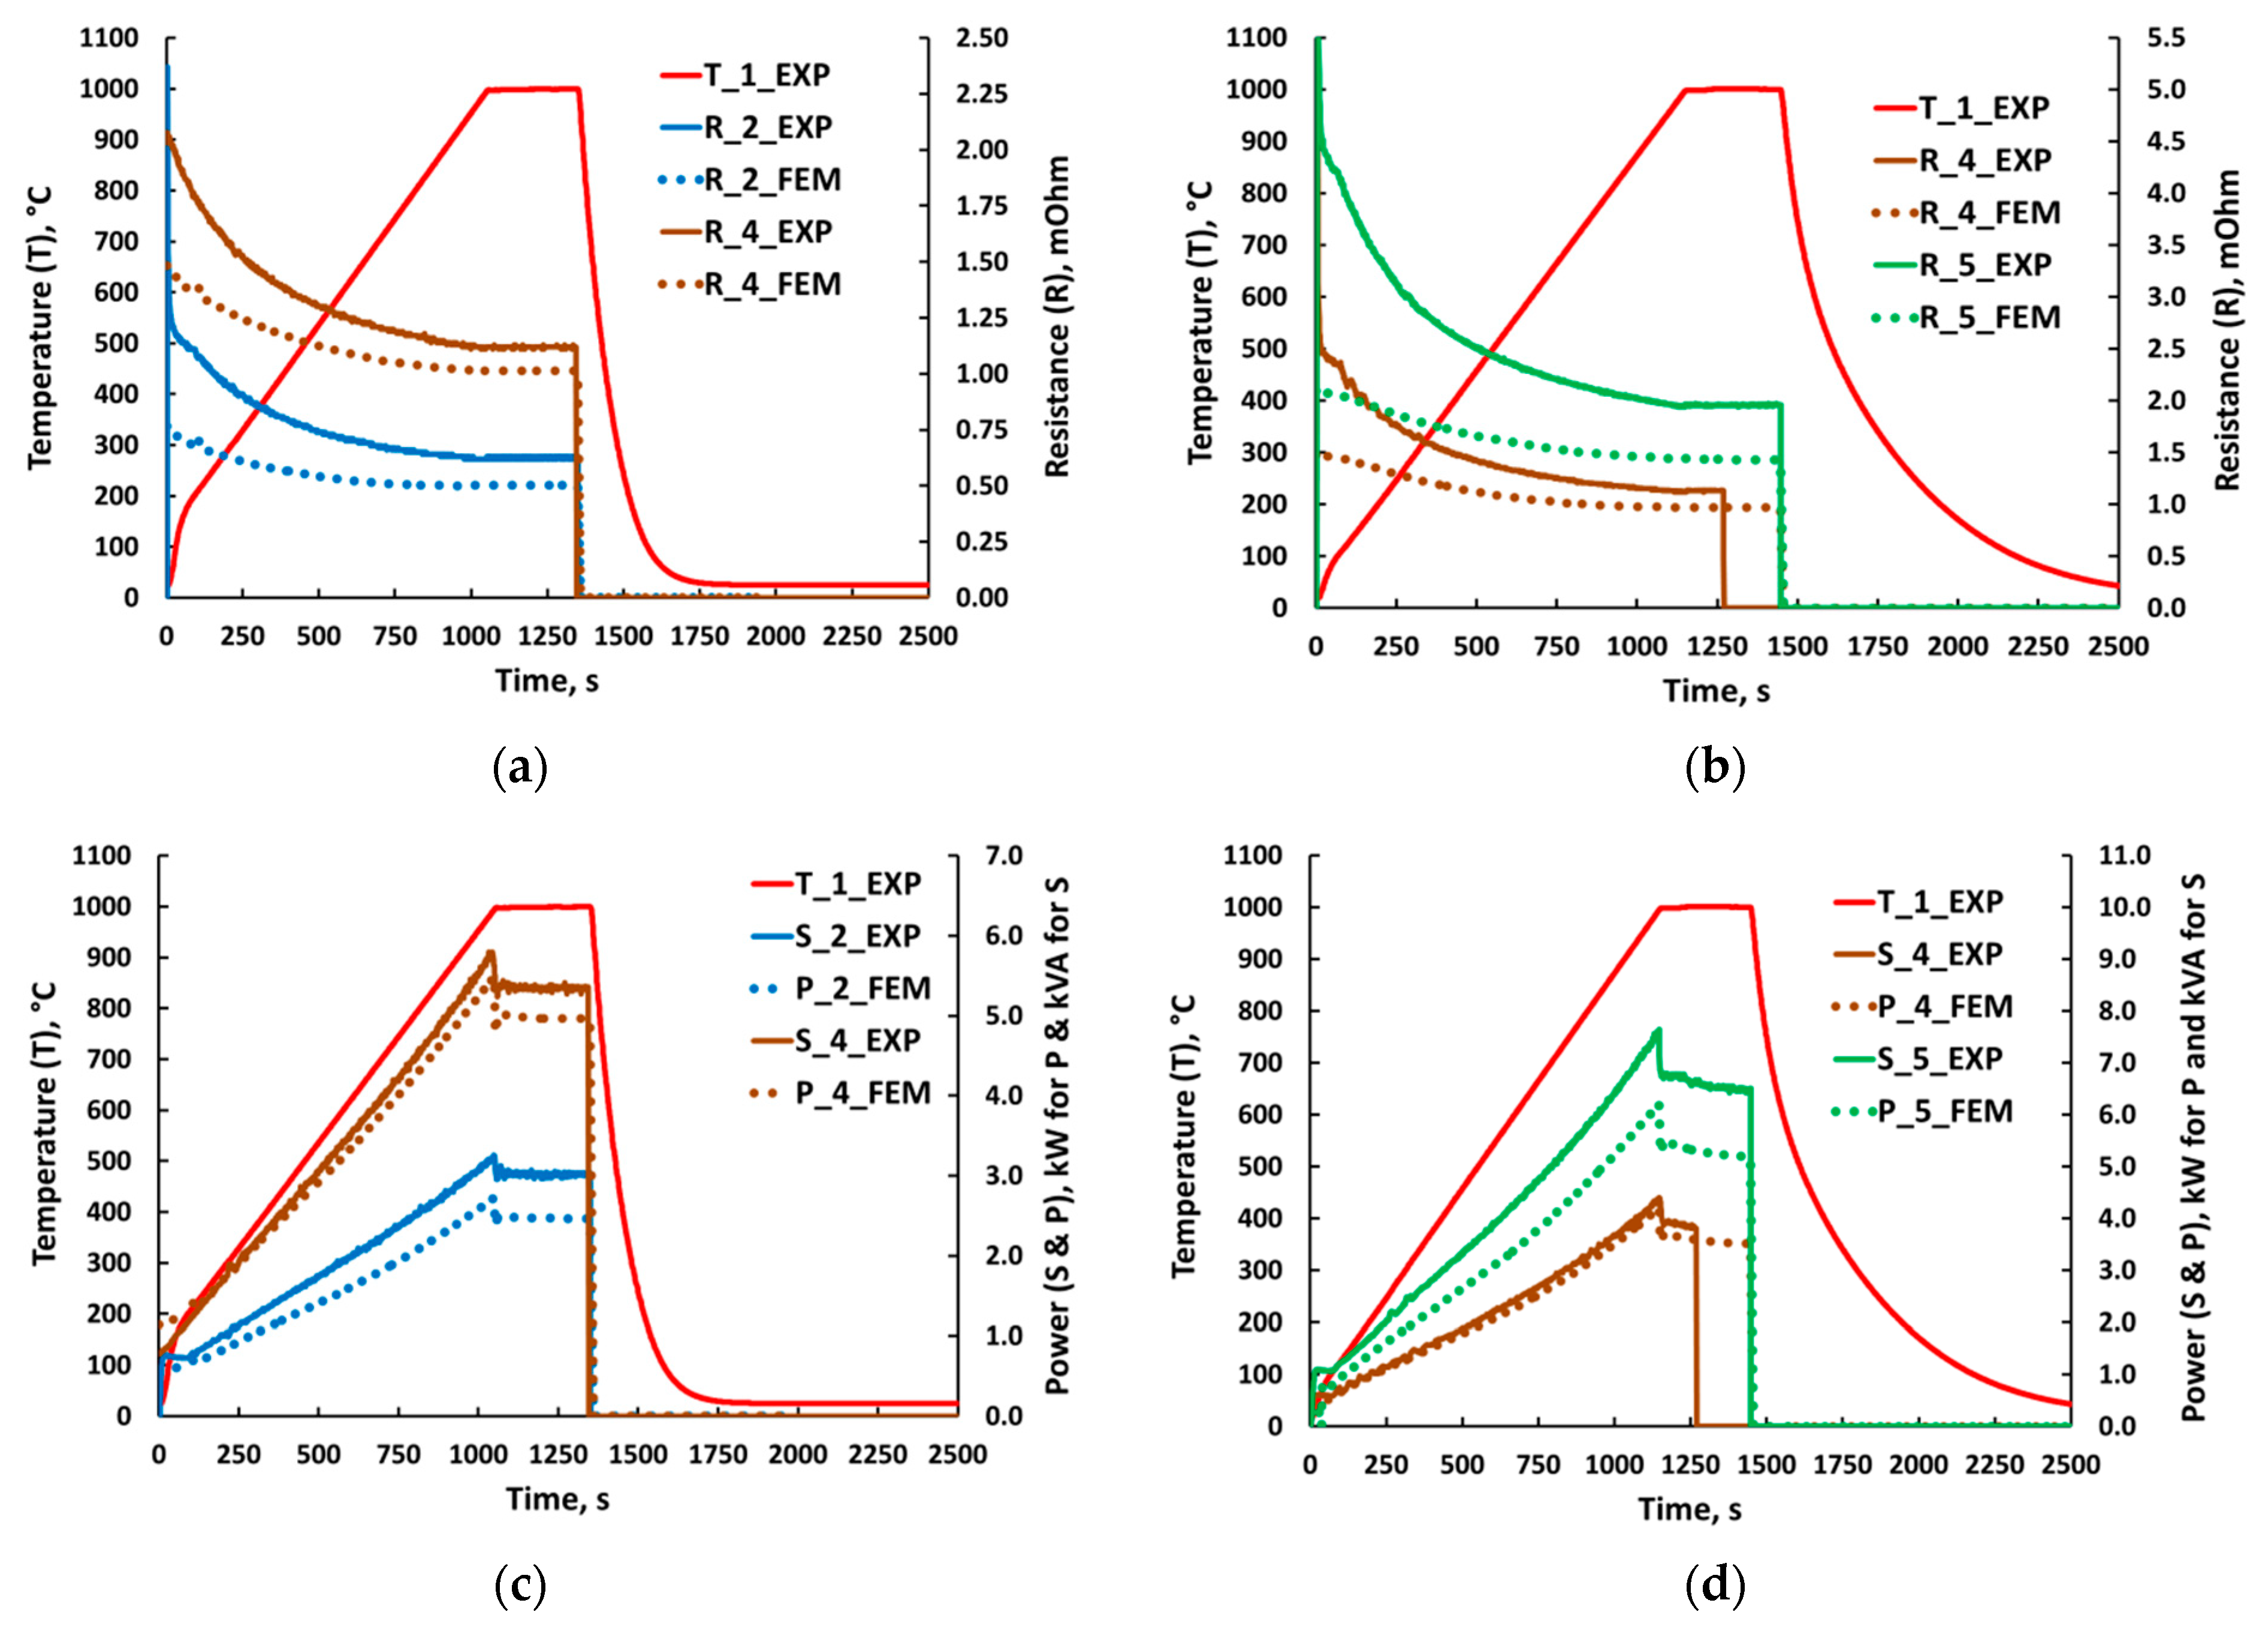
4.2. Influence of CFRC Plates on Local Parameters

Figure 5 shows the temperature distribution in the whole setup and in the dummy after 200 s holding at 1000 °C. The temperature contours were obtained by FEM modeling, as discussed in Section 3. The contours evidence the large temperature gradient in an axial direction. At first sight, the temperature distribution in both setups appears similar. However, more detailed observation shows a reduced temperature gradient in the setup with CFRC plates. This feature becomes more visible in Figure 6, where the temperatures in the reference points are considered. The temperature development, recorded by thermocouples in the regular setup, is presented in Figure 6a. The temperature, measured in the setup with CFRC plates, is shown in Figure 6b. In both diagrams, the results of FEM modeling are also included. The measured and calculated temperatures are in good agreement. This means that the set of properties used for modeling is reasonable and the boundary conditions are meaningful. In addition, the accuracy in tuning of temperature profile by the virtual PID controller is evidenced. The temperature, developed in the upper electrode, is shown in Figure 6c for the regular setup and in Figure 6d for the setup with CFRC plates. The good agreement of experimental and modeled results during heating and holding stages for the regular setup is visible. At the same time, a certain discrepancy between measured and calculated data for the setup with CFRC is observed. This can be caused by certain inaccuracies of the CFRC thermal properties applied for FEM modeling. However, the difference in experimental and modeling results in such a case is only 8 °C or less.
The application of CFRC plates leads to an increase of the system resistance, and as a result to the increase of the related voltage drop. This is clearly visible from comparison of the FEM modeled voltage contours in both setups presented in Figure 7. The current, required for heating, grows with increase in temperature (Figure 8a,b). This is mainly a result of increase in graphite-specific thermal capacity at rising temperature [17]. As it was already mentioned above, the current is lower with the application of CFRC plates. The comparison of measured and modeled current profiles in Figure 8a,b shows a good agreement in both cases. Thus, the used approach and FEM code are suitable for electric current modeling. The situation with voltage modeling is different. The voltage in the reference points grows during heating similar to the current (Figure 8c,d). However, the discrepancy between measured and modeled values is relatively large. This difference is more noticeable when the CFRC plates are used. The possible reasons for that are discussed in the next section.

5. Discussion

From the results discussed above, it follows that the application of CFRC plates has diverse influence on thermal, electrical, and energetic parameters during resistive heating in a FAST/SPS device. In particular, the temperature distribution within the setup becomes more homogeneous. The axial temperature gradient decreases, especially near the CFRC plate (Figure 9a). This fact can be important for the sintering of parts with enhanced height, when the axial temperature gradient is an important issue. Furthermore, the application of CFRC plates provides a reduction of power demand and energy consumption. In the discussed case of heating to 1000 °C, the energy saving is rather moderate (Figure 9b). However, this can be an important economic and technical advantage if higher temperatures are used. The application of CFRC plates provides a significant decrease in the temperature of water-cooled electrodes (Figure 3b). This is a condition for a cost-effective and consistent work of the cooling system. At the same time, the use of CFRC plates leads to a longer cooling time. This increases the total duration of the sintering cycle.
The Finite Element Modeling enables an accurate prediction of temperature distribution within both regular FAST/SPS setup and setup with CFRC plates (Figure 8a). Besides, the FEM modeling provides an adequate calculation of required current (Figure 8c). A slight underestimation of current can be explained by a certain deviation of real graphite properties from used for modeling and by non-ideal DC current profile. At the same time, the modeled voltage drop between reference points is noticeably lower than observed in experiments (Figure 8c,d). The related resistances calculated by the classical Ohm’s law are shown in Figure 10a,b. The modeled and observed decline of resistance with temperature is a result of the reduction in graphite resistivity with growing temperature. Besides, the calculated resistances are remarkably lower than the measured ones. This discrepancy can be explained by three main reasons or by their combination. First, the real resistivity of graphite and CFRC can be higher than applied for modeling. However, this difference is rather small, especially for graphite, because the current modeling was relatively precise. Second, the contact resistances can be underestimated, particularly at low temperature. The resistance of contacts diminishes with temperature and applied pressure. Therefore, the discrepancy between calculated and measured resistances becomes lesser with increase in temperature (Figure 10a,b). This argument was used by Sastry et al., [20] and Manière et al., [21]. However, the difference in simulated and experimental results was also observed between two locations R_2, without any internal contacts (Figure 10a). The third possible reason for observed discrepancy is the presence of AC components in DC voltage [11]. In such a case, the Ohm’s law rearranges to the form U = IZ. Here U is the voltage, I is the current and Z is the impedance. The impedance consists of the real part (resistance) and the imaginary part (reactance). Only the real part of impedance produces the heat. Thus, the real voltage is larger than calculated with the assumption of an ideal DC current. The reactance appears in electrical circuits with inductors (e.g., coils) and capacitors [22]. Pavia et al., studied the voltage and current pulsing with a SPS machine type 2080 produced by Syntex Inc., Kawasaki, Japan [15]. The authors reported the absence of visual phase difference between voltage and current in secondary pulses (ripples). However, the resistance within each pulse was not calculated. Furthermore, a non-sinusoidal pulse profile was evident. Apparently, this profile consists of several AC harmonics. Although all our experiments were performed in DC mode, preliminary measurements revealed certain non-sinusoidal AC components contained in the DC current (2 kHz ripples were created with the inverter switching frequency). Probably, this leads to RMS (root mean square) averaged voltage measurements, larger than modeled ones with classical Ohm’s law and with assumption of a galvanic DC current. In consequence, the same is true for the calculated resistance and power values. However, this matter should be studied in more detail.
The development of power dissipation between corresponding locations is presented in Figure 10c,d. As expected from previous analysis, the measured power was in general larger than obtained by FEM modeling. This can be explained by the reasons discussed above for the voltage. If this is the case, the measured power must be considered as an apparent power, while the modeled power is always active power. The ratio between them, called power factor, lies in the range 1 to 1.25 (Figure 10c,d). In general, the modeled power must be always lower than the measured one. The difference can vary depending on applied FAST/SPS facility, design of electric circuit and type of used devices (transformer, rectifier, invertor, etc.) [11]. However, as noted above, this issue requires a special investigation.

6. Conclusions

Insulation of the FAST/SPS setup from the water-cooled electrodes by intermediate CFRC plates results in several important effects. First, the power and the energy needed for heating are remarkably reduced. Second, even more significant, the temperature of electrodes noticeable diminishes. Third, the temperature distribution in the setup becomes much more homogeneous, with a particularly pronounced decrease of thermal gradients towards water-cooled electrodes. However, the cooling of the setup with CFRC insulation needs more time compared to the setup without CFRC insulation. This leads to a prolonged duration of the entire FAST/SPS cycle.
The Finite Element Modeling provides an accurate calculation of the temperature distribution in regular FAST/SPS setups, and in setups with CFRC insulation if material properties and boundary conditions are accurately defined. Furthermore, FEM simulation provides adequate results for the electrical current required for heating. However, the modeled voltage and power were always less than the experimental values. This is most likely a consequence of non-sinusoidal AC components (ripples), contained in the applied voltage. In such a case, the modeled power is an active power, whereas the measured power is an apparent power. However, this matter requires a more detailed investigation.

Author Contributions

Conceptualization, A.M.L. and J.H.; Data curation, A.M.L. and J.H.; Formal analysis, A.M.L. and J.H.; Investigation, A.M.L., J.H. and R.I.; Methodology, J.H. and A.M.L.; Resources, J.H. and R.I.; Supervision, A.M.L. and J.H.; Validation, J.H., and R.I.; Writing—original draft, A.M.L.; Writing—review & editing, A.M.L. and J.H. All authors have read and agreed to the published version of the manuscript.

Funding

This research received no external funding.

Institutional Review Board Statement

Not applicable.

Informed Consent Statement

Not applicable.

Data Availability Statement

Data is contained within the article.

Conflicts of Interest

The authors declare no conflict of interest.

References

  1. Guillon, O.; Gonzalez-Julian, J.; Dargatz, B.; Kessel, T.; Schierning, G.; Räthel, J.; Herrmann, M. Field-assisted sintering technology/Spark plasma sintering: Mechanisms, materials, and technology developments. Adv. Eng. Mater. 2014, 16, 830–849. [Google Scholar] [CrossRef]
  2. Bram, M.; Laptev, A.M.; Mishra, T.P.; Nur, K.; Kindelmann, M.; Ihrig, M.; Pereira da Silva, J.G.; Steinert, R.; Buchkremer, H.P.; Litnovsky, A.; et al. Application of electric current-assisted sintering techniques for the processing of advanced materials. Adv. Eng. Mater. 2020, 22, 2000051. [Google Scholar] [CrossRef]
  3. Aleksandrova, E.V.; Ilyina, A.M.; Grigoryev, A.G.; Olevsky, E.A. Contribution of electric current into densification kinetics during spark plasma sintering of conductive powder. J. Am. Ceram. Soc. 2015, 98, 3509–3517. [Google Scholar] [CrossRef]
  4. Vanmeensel, K.; Laptev, A.; Huang, S.G.; Vleugels, J.; Van der Biest, O. The role of the electrical current and field during Pulsed Electric Current Sintering. In Ceramics and Composites Processing Methods; Bansal, N.P., Boccaccini, A.R., Eds.; John Wiley & Sons, Inc.: Hoboken, NJ, USA, 2012; pp. 43–74. [Google Scholar]
  5. Mishra, T.P.; Laptev, A.M.; Ziegner, M.; Sistla, S.K.; Kaletsch, A.; Broeckmann, C.; Guillon, O.; Bram, M. Field-assisted sintering/spark plasma sintering of gadolinium-doped ceria with controlled re-oxidation for crack prevention. Materials 2020, 13, 3184. [Google Scholar] [CrossRef] [PubMed]
  6. Dong, P.; Wang, Z.; Wang, W.; Chen, S.; Zhou, J. Understanding the spark plasma sintering from the view of materials joining. Scr. Mater. 2016, 123, 118–121. [Google Scholar] [CrossRef]
  7. Suárez, M.; Fernández, A.; Menéndez, J.L.; Torrecillas, R.; Kessel, H.U.; Hennicke, J.; Kirchner, R.; Kessel, T. Challenges and opportunities for Spark Plasma Sintering: A key technology for a new generation of materials. In Sintering Applications; Ertug, B., Ed.; IntechOpen: London, UK, 2013; pp. 319–342. [Google Scholar]
  8. Tokita, M. Spark Plasma Sintering: Method, systems, applications and industrialization. Powder Metall. Rev. 2019, 8, 89–102. [Google Scholar]
  9. Laptev, A.M.; Bram, M.; Vanmeensel, K.; Gonzalez-Julian, J.; Guillon, O. Enhancing efficiency of field assisted sintering by advanced thermal insulation. J. Mater. Process. Technol. 2018, 262, 326–339. [Google Scholar] [CrossRef]
  10. Grasso, S.; Sakka, Y.; Maizza, J. Electric current activated/assisted sintering (ECAS): A review of patents 1906–2008. Sci. Technol. Adv. Mater. 2009, 10, 053001. [Google Scholar] [CrossRef] [PubMed]
  11. Gucci, F.; Saunders, T.; Reece, M.; Grasso, S. Refined SPS modeling based on calibrated current and voltage measurements. In Spark Plasma Sintering: Current Status, New Developments and Challenges; Cao, G., Estournès, C., Garay, J., Orrừ, R., Eds.; Elsevier: Amsterdam, The Netherlands, 2019; pp. 163–184. [Google Scholar]
  12. Vanmeensel, K.; Laptev, A.; Hennicke, J.; Vleugels, J.; Van der Biest, O. Modelling of the temperature distribution during field assisted sintering. Acta Mat. 2005, 53, 4379–4388. [Google Scholar] [CrossRef]
  13. McDonald, R.A. Heat content and heat capacity of an extruded graphite from 341° to 1723°K. J. Chem. Eng. Data 1965, 10, 243. [Google Scholar] [CrossRef]
  14. Manière, C.; Durand, L.; Brisson, E.; Desplats, H.; Carré, P.; Rogeon, P.; Estournès, C. Contact resistances in spark plasma sintering: From in-situ and ex-situ determinations to an extended model for the scale up of the process. J. Eur. Ceram. Soc. 2017, 37, 1593–1605. [Google Scholar] [CrossRef] [Green Version]
  15. Pavia, A.; Durand, L.; Ajustron, F.; Bley, V.; Chevallier, G.; Peigney, A.; Estournès, C. Electro-thermal measurements and finite element method simulations of a spark plasma sintering device. J. Mater. Process. Technol. 2013, 213, 1327–1336. [Google Scholar] [CrossRef] [Green Version]
  16. Wei, X.; Giuntini, D.; Maximenko, A.L.; Haines, C.H.; Olevsky, E.A. Experimental investigation of electric contact resistance in spark plasma sintering tooling setup. J. Am. Ceram. Soc. 2015, 98, 3553–3560. [Google Scholar] [CrossRef]
  17. Vanmeensel, K.; Laptev, A.; Sheng, H.; Tkachenko, I.; Van der Biest, O.; Vleugels, J. Experimental study and simulation of plastic deformation of zirconia-based ceramics in a pulsed electric current apparatus. Acta Mat. 2013, 61, 2376–2389. [Google Scholar] [CrossRef]
  18. Zavaliangos, A.; Zhang, J.; Krammer, M.; Groza, J.R. Temperature evolution during field activated sintering. Mater. Sci. Eng. A 2004, 379, 218–228. [Google Scholar] [CrossRef]
  19. Muñoz, S.; Anselmi-Tamburini, U. Temperature and stress fields evolution during spark plasma sintering processes. J. Mater. Sci. 2010, 45, 6528–6539. [Google Scholar] [CrossRef]
  20. Sastry, K.Y.; Vanmeensel, K.; Froyen, L.; Vleugels, J.; Van der Biest, O.; Laptev, A.; Hennicke, J. Simulation of temperature evolution during field assisted sintering of rapidly solidified Al-alloy powder. In Proceedings of the Euro PM 2005: Powder Metallurgy Congress and Exhibition, Prague, Czech Republic, 2–5 October 2005; EPMA: Shrewsbury, UK, 2005; Volume 1, pp. 99–105. [Google Scholar]
  21. Manière, C.; Pavia, A.; Durand, L.; Chevallier, G.; Bley, V.; Afanga, K.; Peigney, A.; Estournès, C. Pulse analysis and electric contact measurements in spark plasma sintering. Electr. Pow. Syst. Res. 2015, 127, 307–313. [Google Scholar] [CrossRef] [Green Version]
  22. Alexander, C.K.; Sadiku, W.N.O. Fundamentals of Electric Circuit, 6th ed.; McGraw-Hill: Columbus, OH, USA, 2016; pp. 369–412. [Google Scholar]
Figure 1. Sketch of used field-assisted sintering technique/spark plasma sintering (FAST/SPS) setups: (a) regular setup without CFRC plates and (b) setup with CFRC plates. The locations of temperature and voltage test points are indicated by red marker.
Metals 11 00393 g001
Figure 2. Thermal conductivity (a) and electrical resistivity (b) of isotropic R 7710 graphite and anisotropic CFRC plate: in plane of carbon fabric (II) and in perpendicular direction ().
Metals 11 00393 g002
Figure 3. Temperature evolution recorded at (a) T_1 and (b) T_5 locations.
Metals 11 00393 g003
Figure 4. Influence of CFRC plates on: (a) voltage after rectifier, (b) current, (c) total heater power, and (d) consumed energy.
Metals 11 00393 g004
Figure 5. Modeled temperature distribution (°C) at 1200 s (holding stage): (a,b) in entire setup and (c,d) in dummy. Left—regular setup, right—setup with CFRC plates.
Metals 11 00393 g005
Figure 6. Temperature development as recorded by thermocouples (solid lines) and modeled by FEM (dotted lines): (a,c) in regular setup; (b,d) in setup with CFRC plates. T1–T3—temperature in dummy; T4—temperature in graphite spacer; T5—temperature in electrode.
Metals 11 00393 g006
Figure 7. FEM-modeled voltage at 1200 s (holding stage): (a) regular setup; (b) setup with CFRC spacers.
Metals 11 00393 g007
Figure 8. Current (a,b) and voltage (c,d) development during SPS cycle. Left—regular setup, right—setup with CFRC plates. Solid lines are experimental data and dotted lines are results of FEM modeling. Voltage drop was measured between two symmetric locations in setup.
Metals 11 00393 g008
Figure 9. (a) Temperature at 1200 s (dwell segment) measured by thermocouples in different locations and (b) total energy consumed with different setups.
Metals 11 00393 g009
Figure 10. Resistance (a,b) and power dissipation (c,d) between two symmetrically located probes. Left—regular setup, right—setup with CFRC plates. Solid lines are data calculated from experimental values of voltage and current. Dotted lines are results from FEM modeling.
Metals 11 00393 g010
Table 1. Temperature and voltage measurements with regular setup (i.e., without Carbon Fiber-Reinforced Carbon (CFRC) plates).
Position12345
Temperaturexxxxx
Voltage-x-x-
Table 2. Temperature and voltage measurements with CFRC plates.
Position12345
Temperaturexxxxx
Voltage---xx
Publisher’s Note: MDPI stays neutral with regard to jurisdictional claims in published maps and institutional affiliations.

