Article

Large Eddy Simulation of Multi-Phase Flow and Slag Entrapment in Molds with Different Widths

1
School of Materials Science and Engineering, State Key Laboratory of Advanced Special Steel and Shanghai Key Laboratory of Advanced Ferrometallurgy, Shanghai University, Shanghai 200444, China
2
Shanghai University New Materials (TaiZhou) Research Institute Co., Ltd., Taizhou 225500, China
3
Research Institute, Baoshan Iron&Steel Co., Ltd., Shanghai 200941, China
4
School of Iron and Steel, Soochow University, Suzhou 215137, China
*
Authors to whom correspondence should be addressed.
Metals 2021, 11(2), 374; https://doi.org/10.3390/met11020374
Submission received: 15 January 2021 / Revised: 17 February 2021 / Accepted: 18 February 2021 / Published: 23 February 2021
(This article belongs to the Section Metal Casting, Forming and Heat Treatment)

Abstract

:
Slag entrapment is a critical problem that affects the quality of steel. In this work, a three-dimensional model is established to simulate the slag entrapment phenomenon, mainly focusing on the slag entrapment phenomenon at the interface between slag and steel in molds with different widths. The large eddy simulation (LES) model and discrete particle model (DPM) are used to simulate the movements of bubbles. The interactions between phases involve two-way coupling. The accuracy of our mathematical model is validated by comparing slag–metal interface fluctuations with practical measurements. The results reveal that the average interface velocity and transverse velocity decrease as the mold width increases, however, they cannot represent the severity of slag entrapment at the interface between slag and steel. Due to the influence of bubble motion behavior, the maximum interface velocity increases with mold width and causes slag entrapment readily, which can reflect the severity of slag entrapment. On this basis, by monitoring the change of impact depths in different molds, a new dimensionless number “C” is found to reveal the severity of slag entrapment at the interface between slag and steel. The results show that the criterion number C increases with mold width, which is consistent with the results of flaw detection. Therefore, criterion number C can be used to reflect the severity of slag entrapment in different molds.

1. Introduction

The mold is an important part of steel metallurgy and can be called the “heart” of a continuous casting machine. During this process, the effect of powder added into the mold can be summarized by three aspects: (1) preventing oxidation of molten steel; (2) absorbing non-metallic inclusions; (3) filling the gap between the mold and the slab surface to improve heat transfer and lubricating the mold surface. However, due to the instability of level fluctuation in the mold, the liquid slag is often incorporated into the molten steel, damaging mechanical properties of steel products, especially for automobile steel. Therefore, slag entrapment has become a critical problem that requires serious concern.
Due to “black box” operation, the slag entrapment cannot be seen during the real casting process. Therefore, visual models have been developed to reproduce the slag entrapment at the interface between slag and steel. Among these studies, Gguta et al. [1] found an apparent asymmetric flow near the nozzle. Afterwards, Li et al. [2] captured the asymmetric vortex distribution of the steel/slag interface by injecting black sesames into water, and developed a mathematical model to predict the asymmetry flow in the mold. The study of Iguchi et al. [3] showed that the slag entrapment caused by shearing strength is the main mechanism for the slag entrapment during high casting speed operation, and that the interfacial tension has a significant influence on it. Watanabe and Yamashita et al. [4,5] studied slag entrapment by argon blowing, finding that the maximum depth of slag involved would not exceed three times its diameter. In addition, according to Savolainen et al. [6], the effect of the viscosity of slag on the formation and size of slag droplets should be paid attention to take full control of it. Yamada et al. [7] suggested that argon bubbles in a mold become the desirable sites where alumina inclusions are gathered and form large alumina clusters. Despite these studies, some researchers focused on the influence of liquid properties on slag entrapment in the mold, such as liquid metal density and interfacial tension within the slag–metal interface [8,9,10], in which the critical slag entrapment velocity can be determined. However, this velocity can only predict the slag entrapment caused by shearing stress. Lei Hong et al. [11] proposed another theoretical equation for calculating shear entrapment, taking the viscosity of slag into account. However, Chung and Cramb [12] and others believe that the interfacial tension coefficient should be reduced to about three percent of the original value due to the existence of interfacial reactions. Harman [13] considered nine factors and obtained another formula for calculating critical velocity through non-linear fitting. The above studies are of great significance for understanding the slag entrapment phenomenon. However, the physical models cannot meet all the similarity criteria at the same time, which leads to some limitations for slag entrapment results.
With the rapid development of computer science, computational fluid dynamics (CFD) technology has been an important tool in metallurgical process research, and its advantages are increasingly prominent. Saeedipour et al. [14] established a three-phase mathematical model to study the interface wave problem. Liu et al. [15] established a quasi-four-phase model to study the effect of bubbles on the interface fluctuation of the slag–metal interface. Li et al. [16] analyzed three kinds of slag entrapment mechanisms, and gave the transient process of mold slag entrapment in molten steel. Although these studies are of great significance to the study of slag entrapment, the relationship between mold impact depth and velocity, especially the association with slag entrapment, was not explored. There is still a lack of effective evaluation criteria to predict the effect of slag entrapment.
In this work, the movement behavior of mold slag in the mold is studied to reveal the influence of mold structure on slag entrapment and a theoretical foundation for mold width adjustment is laid. The innovations of this paper are composed of three parts: Firstly, the slag entrapment between different molds are elaborated in detail. (2) Secondly, a mathematical model of four-phase (slag–metal–gas–air) flow is established to explain differences in slag entrapment in (1). Thirdly, a new dimensionless value is established to characterize the severity of slag entrapment in molds. The research results can act as a guide for the continuous casting process.

2. Mathematical Model

2.1. Basic Assumptions

To simplify the calculation, the mathematical model used in this work is based on the following assumptions:
(i) Liquid steel is regarded as a Newtonian fluid, and its basic parameters, such as density and viscosity, are considered as constants.
(ii) The heat transfer and solidification process between molten steel and cooling water are not considered, and the thermal characteristics of slag are ignored.
(iii) The discrete phase bubble is assumed to be spherical, and its size change is ignored in the process of floating.
(iv) The taper of the mold, as well as heat transfer between the mold and slab, are all ignored.

2.2. Governing Equations

There are four phases existing in the mold: molten steel, liquid slag, air, and argon. In this work, we use the volume of fluid (VOF) method to describe interactions between steel, slag, and air and adopt a discrete particle model (DPM) to track trajectories of argon bubbles. The interactions between these phases involve two-way coupling, following the law of Newton. The continuity equation for these phases can be written as follows:
( α k ρ k ) t + ( α k ρ k u ¯ m ) = 0
where ρ k is the density of the phase, the foot mark k representing the phases u ¯ m is the velocity of the mixture phase, α k is the volume fraction of each phase, which fulfills the equation α l + α s + α g = 1 .
Large eddy simulation (LES) is used to solve the Navier–Stokes (N-S) equations of fluid flow:
( ρ m u ¯ m ) t + ( ρ m u ¯ m u ¯ m ) = P ¯ + [ μ effect ( u ¯ m + u ¯ m T ) ] τ i j + ρ m g + 6 π d p 3 F + F γ
In this equation, fluid motion is solved by a set of equations. The term ρ m represents the density of the mixture phase, P ¯ is static pressure. The molecular viscosity μ m and turbulent viscosity μ t in the equation are all weighted average values of the volume fraction of each phase, and the effective viscosity μ effect = μ m + μ t . F is the forces acting on bubbles. The term F γ is the interface tension between these phases.
The expression of subgrid-scale stress τ i j is as follows:
τ i j = 1 3 τ k k δ i j 2 μ t S ¯ i j
where the term τ k k is the isotropic part of the subgrid scale, δ i j is the Kronecker symbol, S ¯ i j is the strain rate, turbulent viscosity μ t = ρ m L s 2 | S ¯ | .
The calculation formula of mixing length is as follows:
L s = min ( κ d , Δ C s )
where κ is the von Karman constant, taken as 0.4, d is the vertical distance from the fluid to the wall, C s is the Smagorinsky constant, taken as 0.2.

2.3. Discrete Particle Model (DPM)

The argon bubbles injected from the nozzle easily float up and escape from the upper surface of the mold. In this process, the momentum exchanges between the argon and steel are treated as two-way coupling, which obeys the second law of Newton:
m p d u ¯ p d t = F
where u ¯ p and m ¯ p are the velocity and mass of particles, respectively, and F is the resultant force acting on the bubbles, the expression of which can be written as follows:
F = F g + F b + F p + F d + F l + F v m
where the terms on the right side of the formula are gravity, buoyancy force, pressure gradient force, drag force, lift force, and virtual mass force, respectively. The calculation equations [17,18,19,20] can be found in Table 1. The bubble size ranges from 0.5–15 mm, following the Rosin–Rammler law:
Y d = e ( d / d m ) n
where the variable Y d is the mass fraction of bubbles whose diameters are greater than d . The averaged bubble diameter d m = 5   mm , and the spread parameter n = 2 .

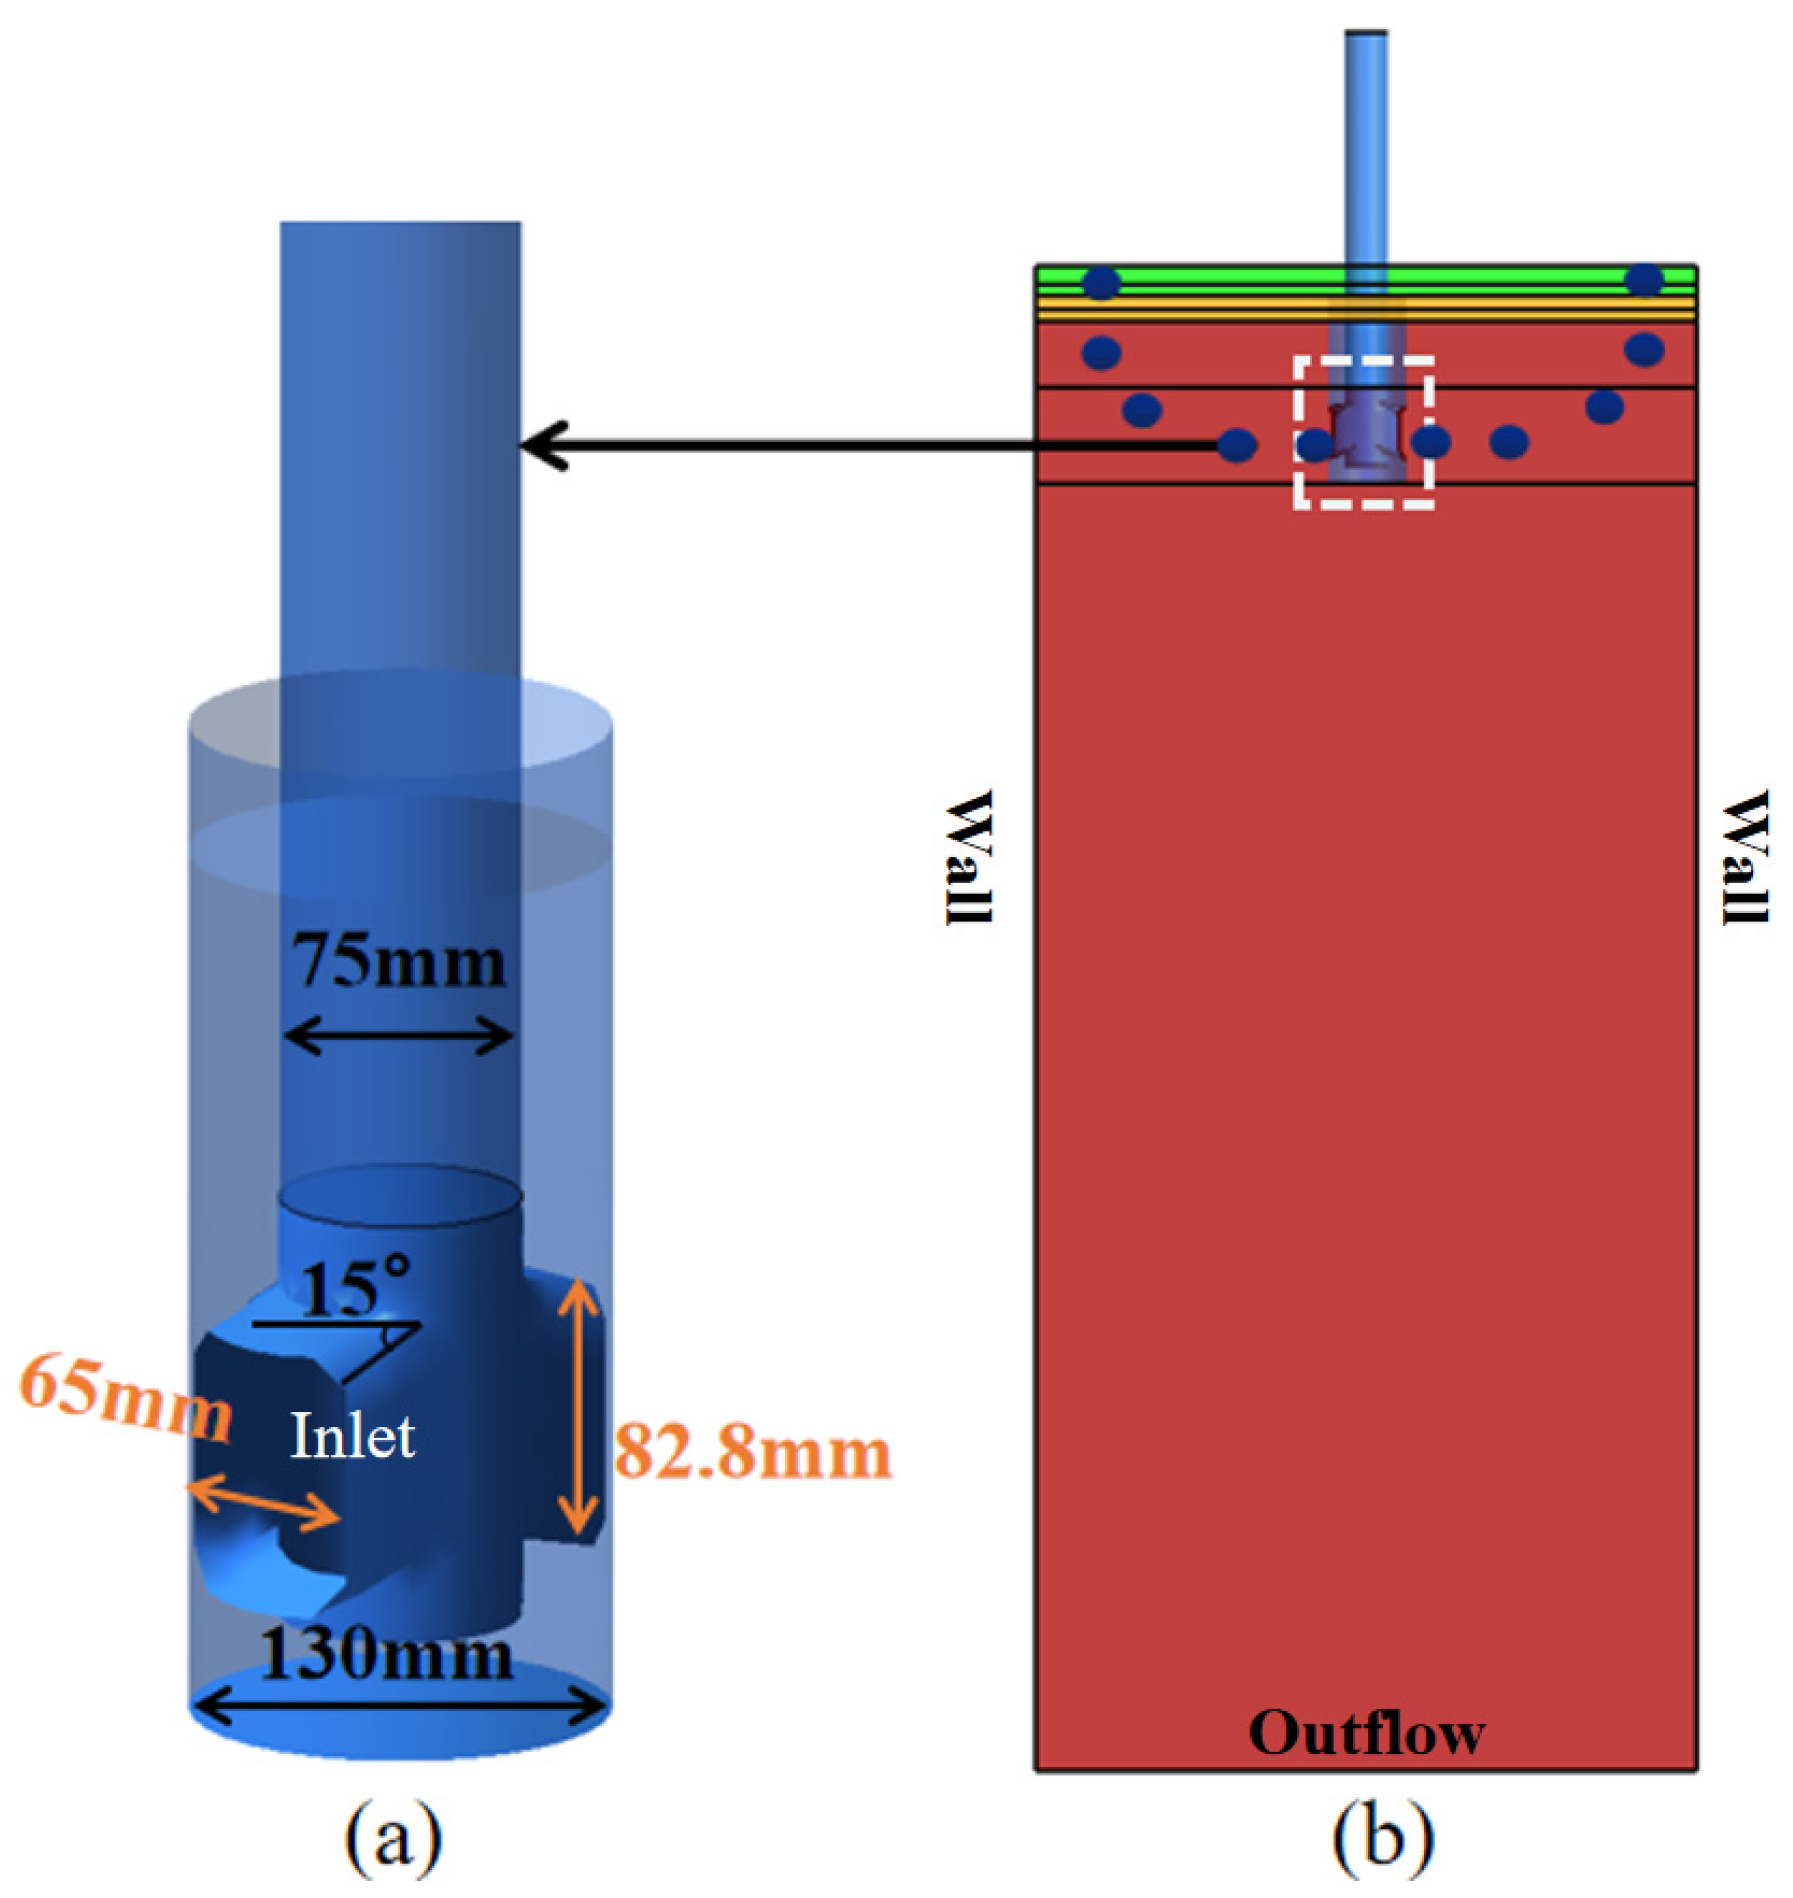
2.4. Boundary Conditions and Numerical Details

As shown in Figure 1, the whole physical model consists of four parts: nozzle, mold, foot roller zone, and secondary cooling zone. In the production process, the thicknesses of argon and the slag layer are 40 mm and 50 mm, respectively. After entering the mold, the argon gas expands rapidly, resulting in a decrease in the density of argon gas. The bubble density in the molten steel can be calculated through the ideal gas law, as shown in Equation (8). The steel velocity from the nozzle is calculated by the casting speed, and a no-slip condition is used to perform the wall treatment of the mold. In this work, three typical widths of the mold were taken to study the slag entrapment inside the mold, and the cross section are 250 mm × 1100 mm, 250 mm × 1400 mm, 250 mm × 1650 mm, respectively.
P = ρ P R g T
where the argon density at 20 °C is 1.78 kg/m3. The pressure P is standard atmospheric pressure, which can be assumed to be equal to standard atmosphere pressure near the top of the mold. Based on this equation, the bubble density in the molten steel (1556 °C) is 0.266 kg/m3.
In order to obtain a fine vortex structure, the mesh is refined near the slag–metal interface and gas–slag interface. The whole region contains 2.1 × 10⁶ structural grids with good independence. The calculation step is set to 0.01 s and the total calculation time is 100 s. To save calculation time and cost, the k-ε model is used to calculate the steady-state field, and then switched to the LES model to simulate the transient flow field. The specific model parameters are shown in Table 2.
The movements of argon bubbles consist three key stages, as shown in Figure 2: (1) Entering the mold from the nozzle and being carried downward by the nozzle jet; (2) floating up into the molten steel and passing through the slag–metal interface and entering into the slag; (3) collapsing and subsequently disappearing after floating near the gas/slag interface. The movements of bubbles in the continuous phases and the escape near the gas/slag interface are achieved by coding user-defined functions (UDFs). In addition, the impact point is defined as the position where the vertical shear force equals zero on the center plane of the mold.

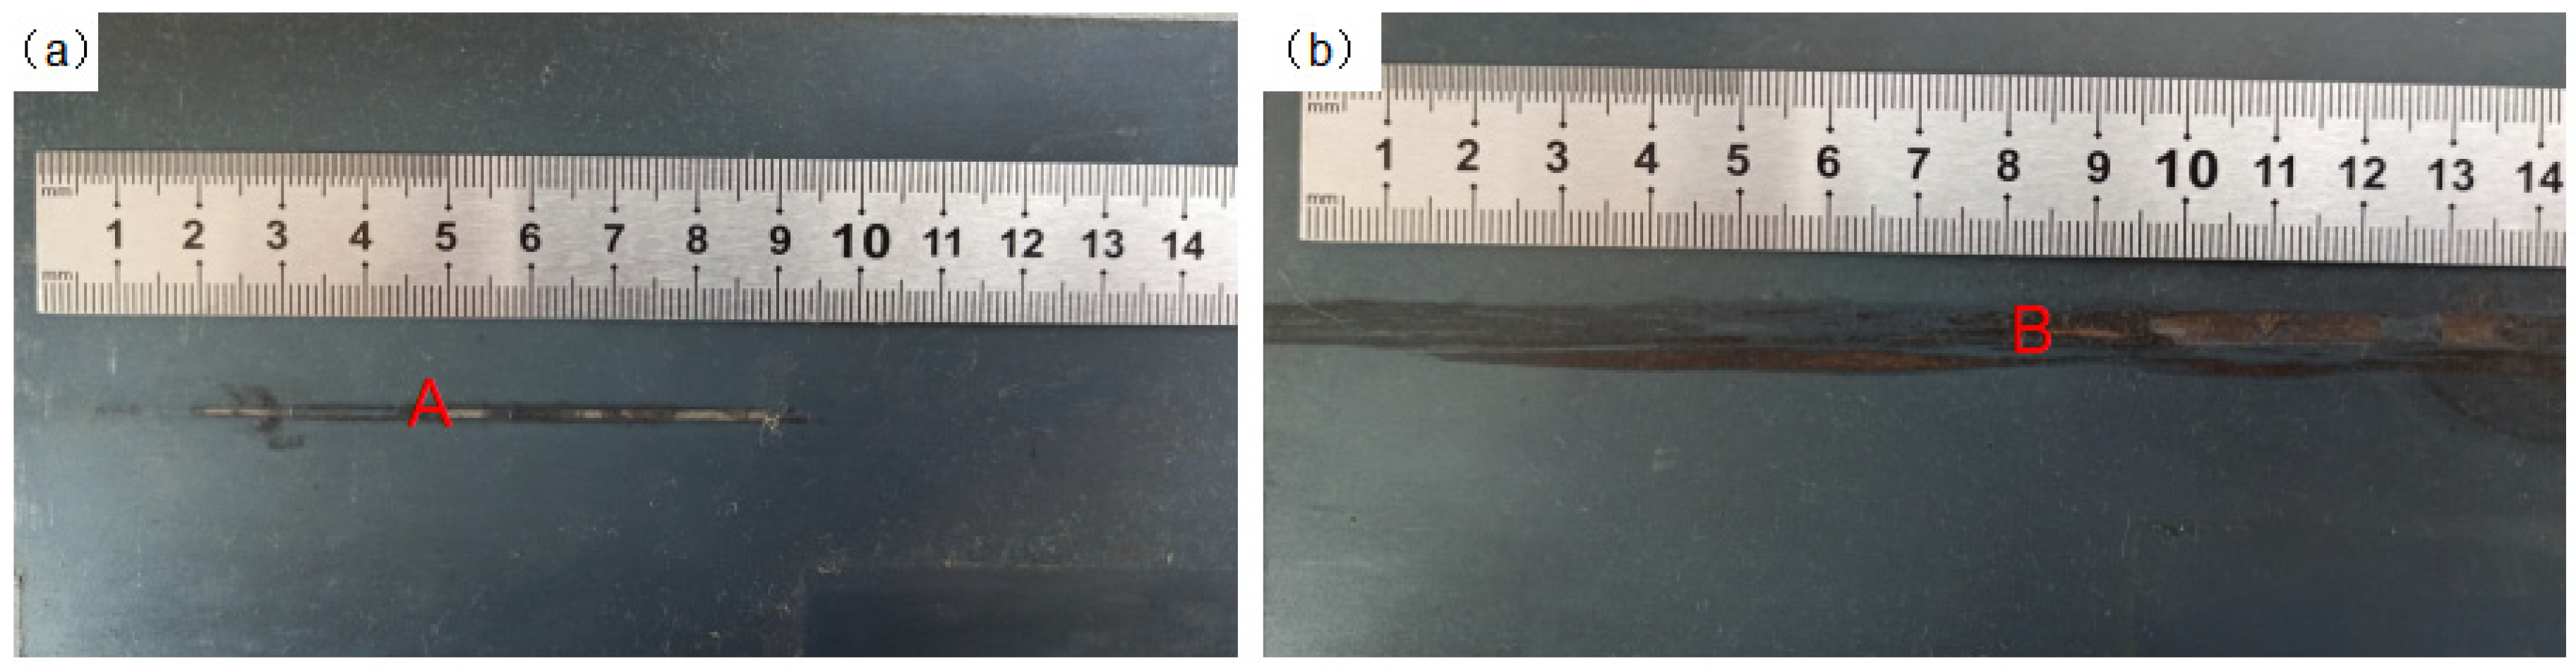
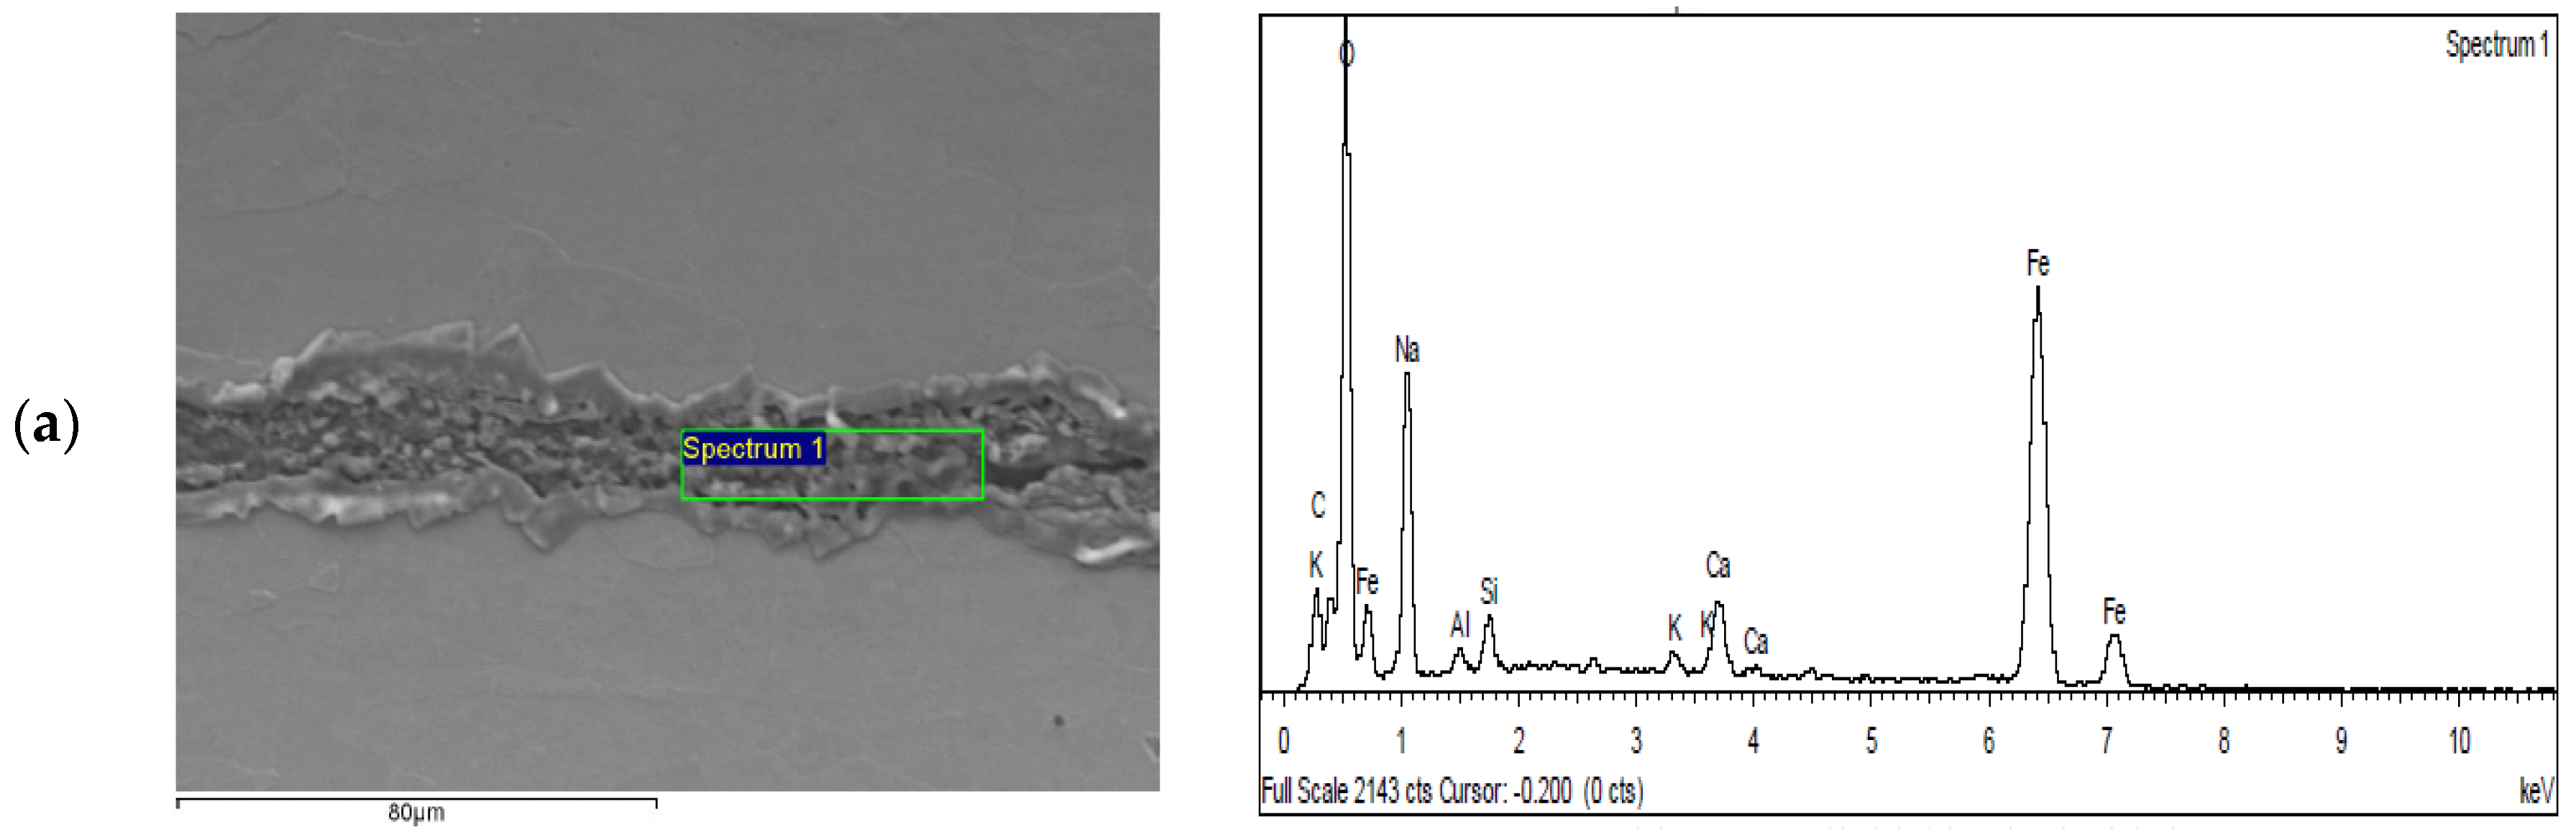
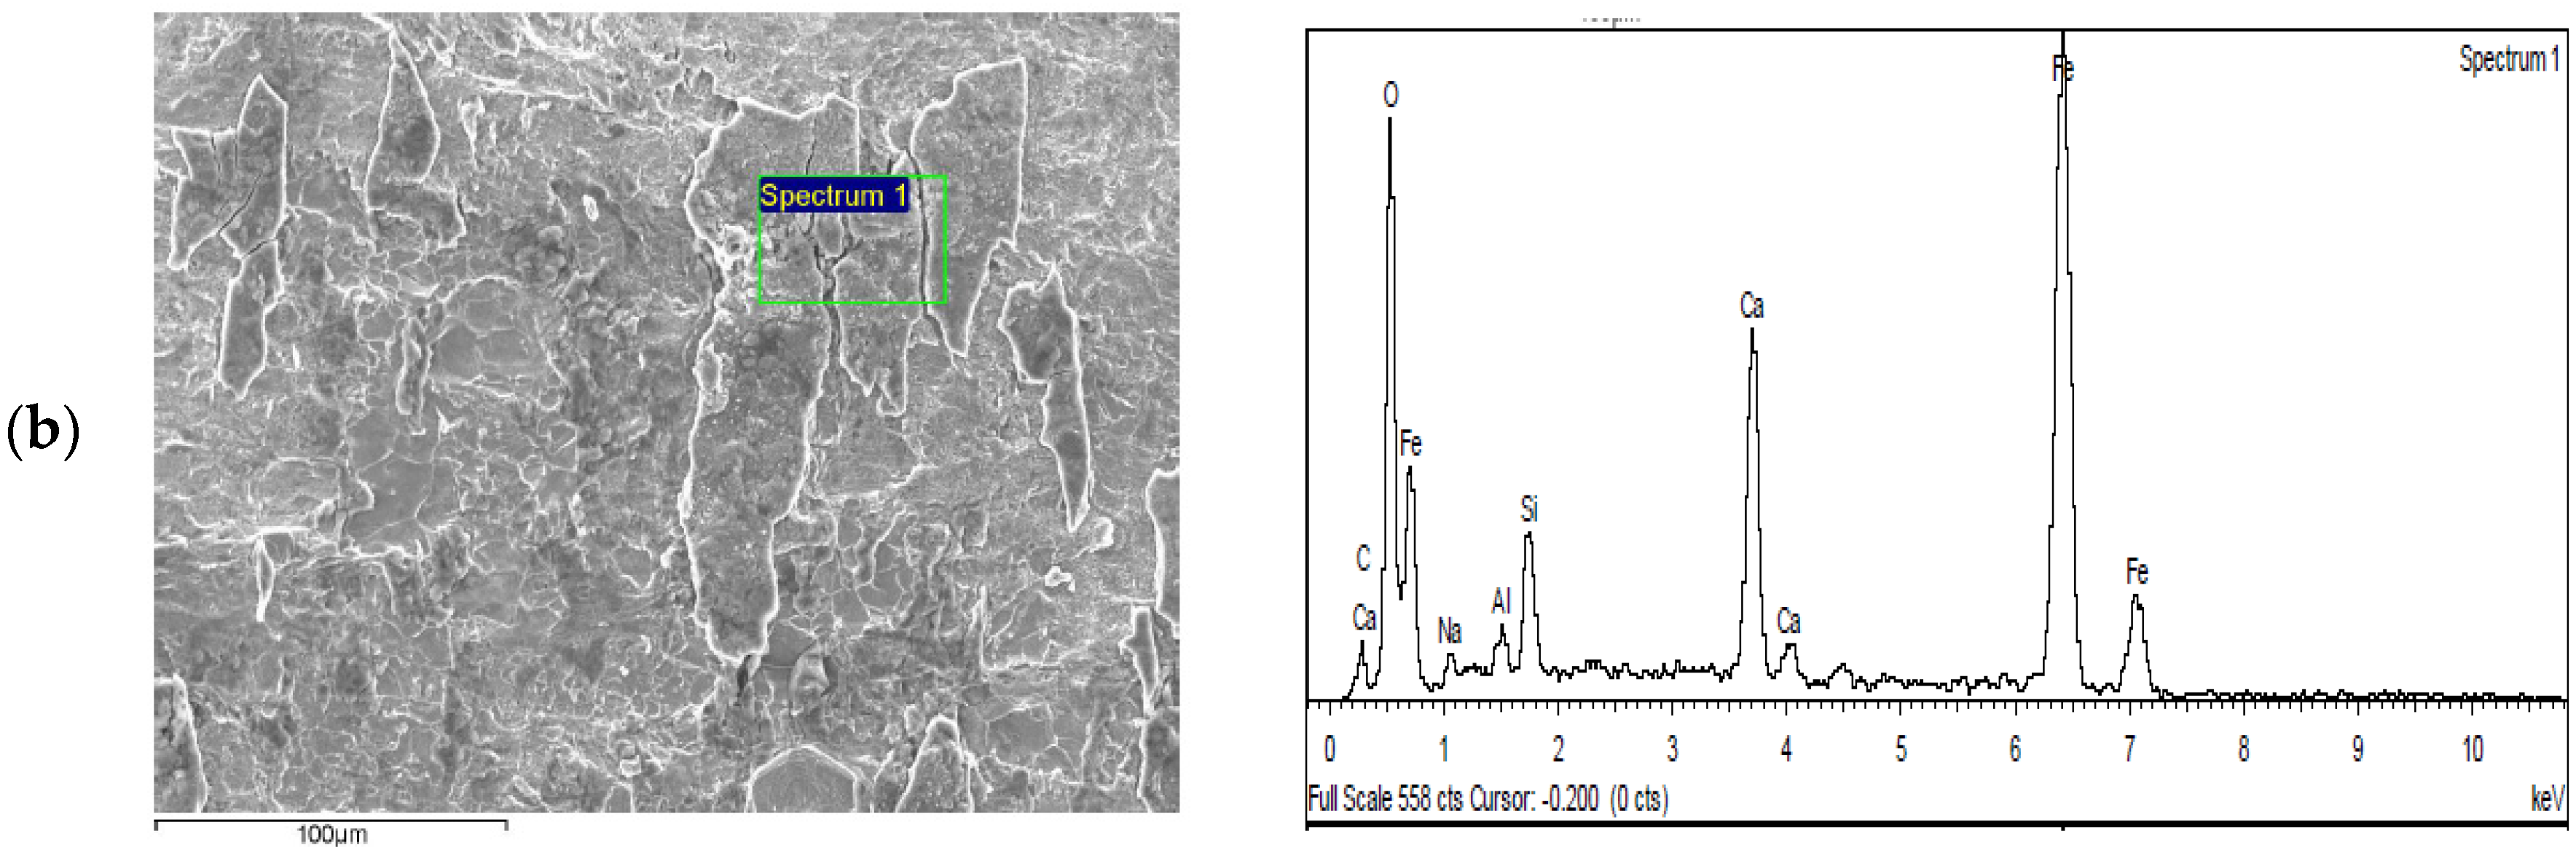
3. Analysis of Inclusions on Slab

Figure 3 shows the surface defects after the rolling process, which is caused by the large inclusions. It is clearly seen that many black lines on the surface of the slabs are stretching across the whole surface of the slab, the lengths of which are more than 90 millimeters. This can degrade the quality of steel significantly. The “black line” problem is a significant problem that constrains the production of automobile steel.
Figure 4 shows the compositions of inclusions inside the black line characterized by scanning electron microscopy (SEM) and energy dispersive spectroscopy (EDS). The results show that Na, Al, Si, Ca, O, and other elements exist in the black lines, whose compositions are similar to that of the liquid slag in the mold. Therefore, it is certain that the black line defect of hot-rolled sheets is caused by slag entrapment.
Figure 5 shows the slag entrapment ratio in slabs with different widths. The slabs are tested after the rolling process. The ratio is defined as the percentage of slabs with slag entrapment problems against totally tested slabs. It can be seen from Figure 5 that the larger the width is, the higher the slag entrapment ratio will be. There must be some special reasons behind this phenomenon, however, few works have reported this problem and tendency. So, in this work, the reason for this phenomenon will be explained in detail, through our mathematical model.

4. Results and Discussion

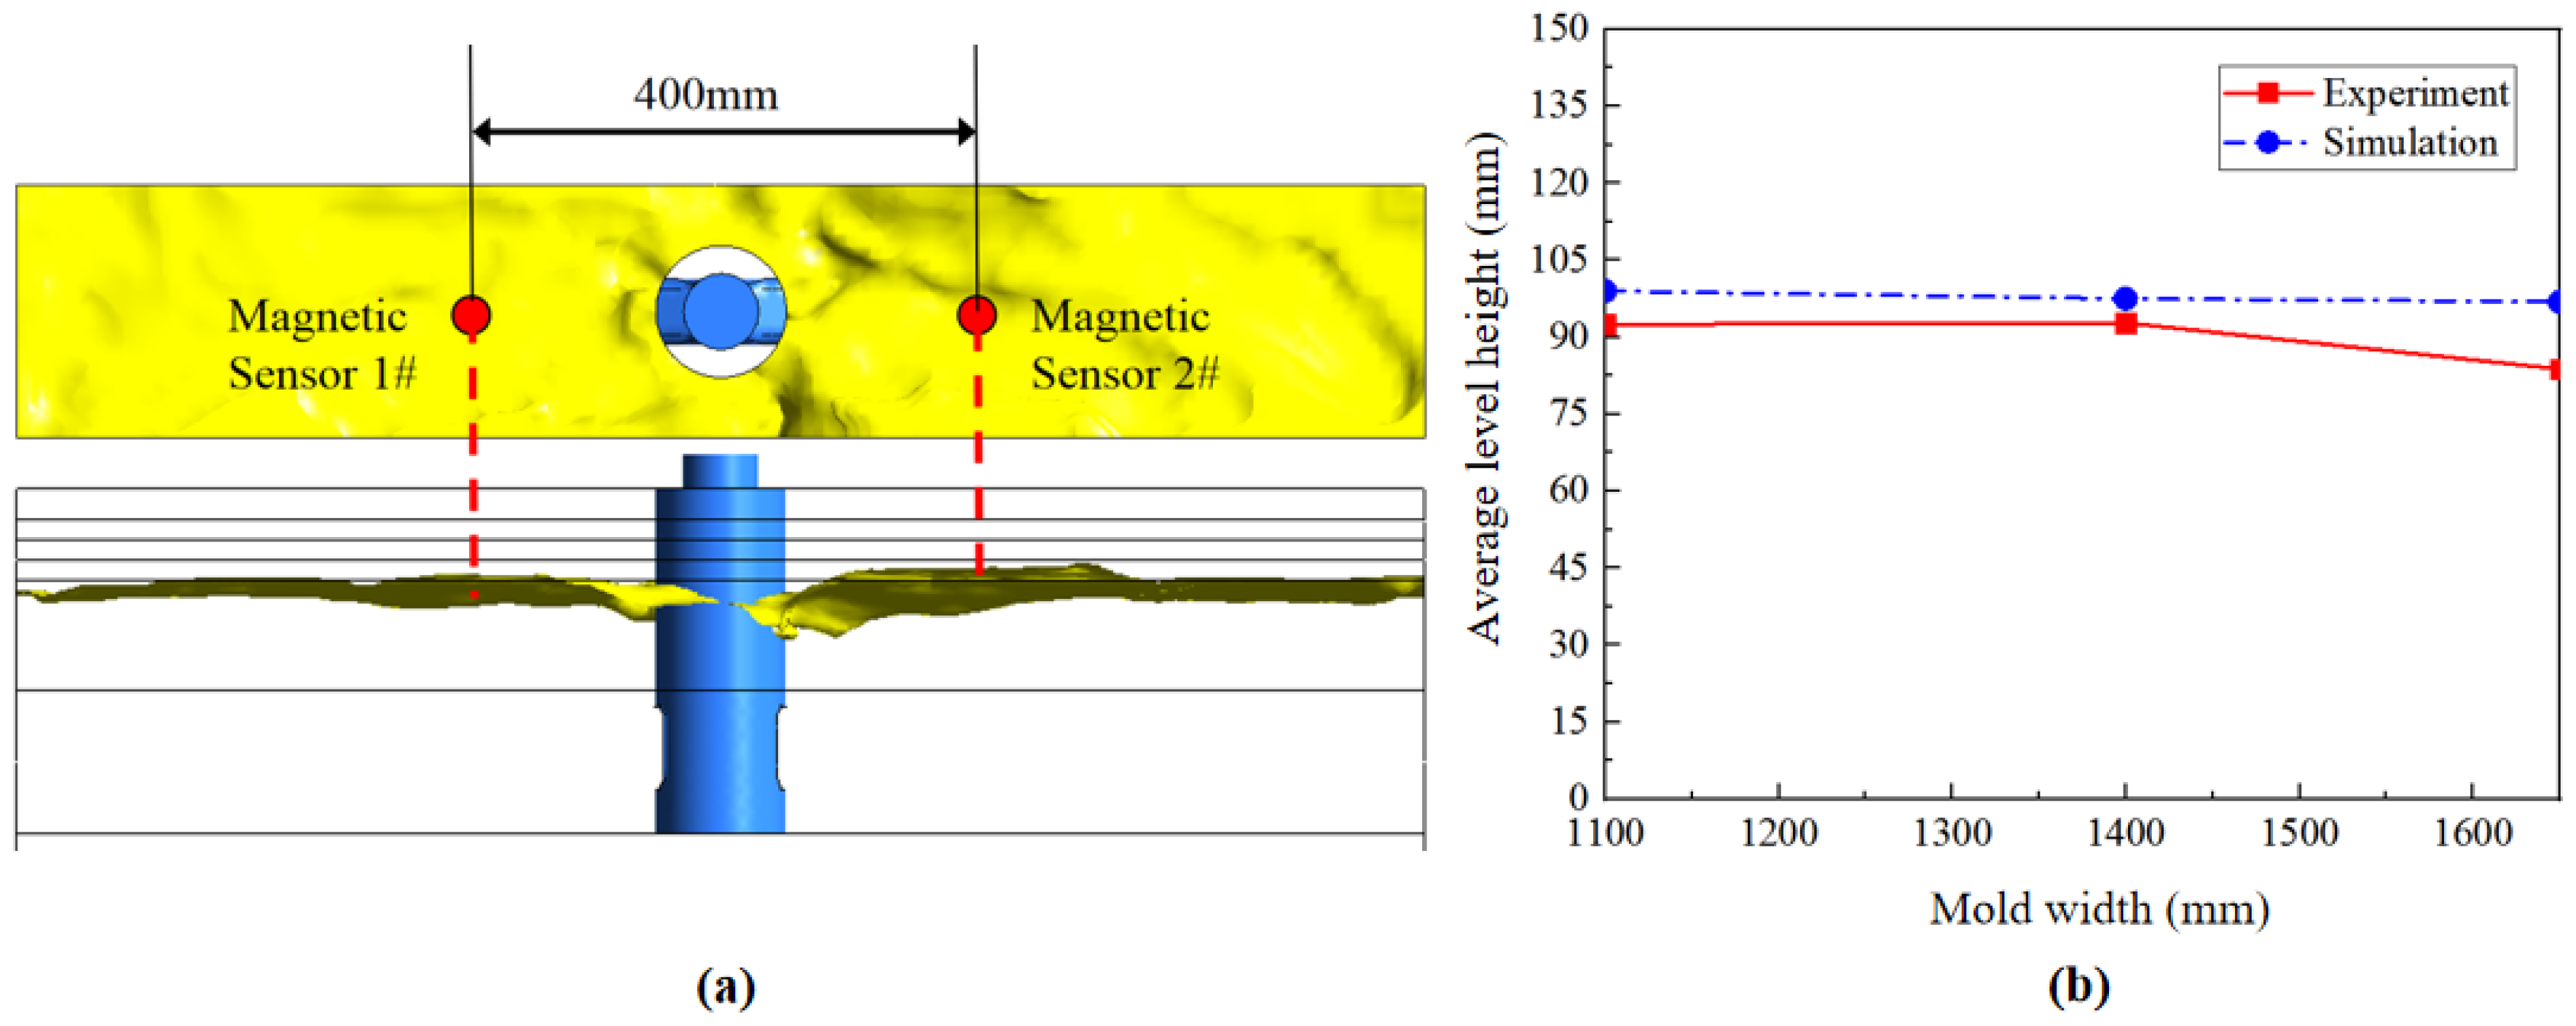
4.1. Level Height of Slag–Metal Interface

Firstly, the accuracy of the mathematical model is verified through interface-level detections obtained from an eddy current sensor. The current sensor is installed on the top of the mold (Figure 6a), which can reveal the distance between the mold top and slag–metal interface. The installation position is in the middle of the mold, and the distance between the two probes is 0.4 m, as shown in Figure 6a. It can be seen from Figure 6b that the actual distance between the mold top and slag–metal interface is 83–93 mm. By comparison, the simulation results show that the value is 97–100 mm. It is easily seen that the simulated result is a little higher than the experimental result, the reason for which is the fact that the height of slag–metal interface is enhanced by bulging. Generally, the simulated results agree well with the experimental results, implying that the mathematical model established in this work is reliable (Figure 6b).

4.2. Transient Flow Spectrum Analysis of Mold

Figure 7 shows the transient molten steel flow patterns of different cross sections. It can be seen that the flow field in the mold is asymmetric and unstable, with multiple vortices of different scales.
Generally, the liquid steel that flows out of the nozzle and impinges on the narrow surface of mold may be divided into two streams: upper recirculation flow and lower recirculation flow. Obviously, increasing the mold width leads to smaller impacting velocity and deeper injection of liquid steel. Furthermore, the maximum velocity of the slag–metal interface also increases, as shown in Figure 8.
The phenomenon can be attributed to the distribution of argon and the velocity field, as shown in Figure 9. The argon bubbles easily float up with a relatively high speed, even higher than the injection velocity of molten steel. When it floats to the gas–slag interface, the bubble collapses and pushes slag firmly into the steel, resulting in an increase in the interface velocity of the slag–metal interface. Therefore, the movements of argon should be strictly controlled in the continuous casting process.
Figure 10 shows the impact depth and impact velocity in molds with different widths. Here, the impact depth is defined as the distance between the slag–metal interface and impact point; and the impact velocity is defined as the velocity of the impact point. It can be seen that the flowing strand develops more fully and the impact depth becomes larger with the increasing of mold width. However, due to the flow loss in the flow process, the larger the mold width is, the smaller the impact velocity will be.

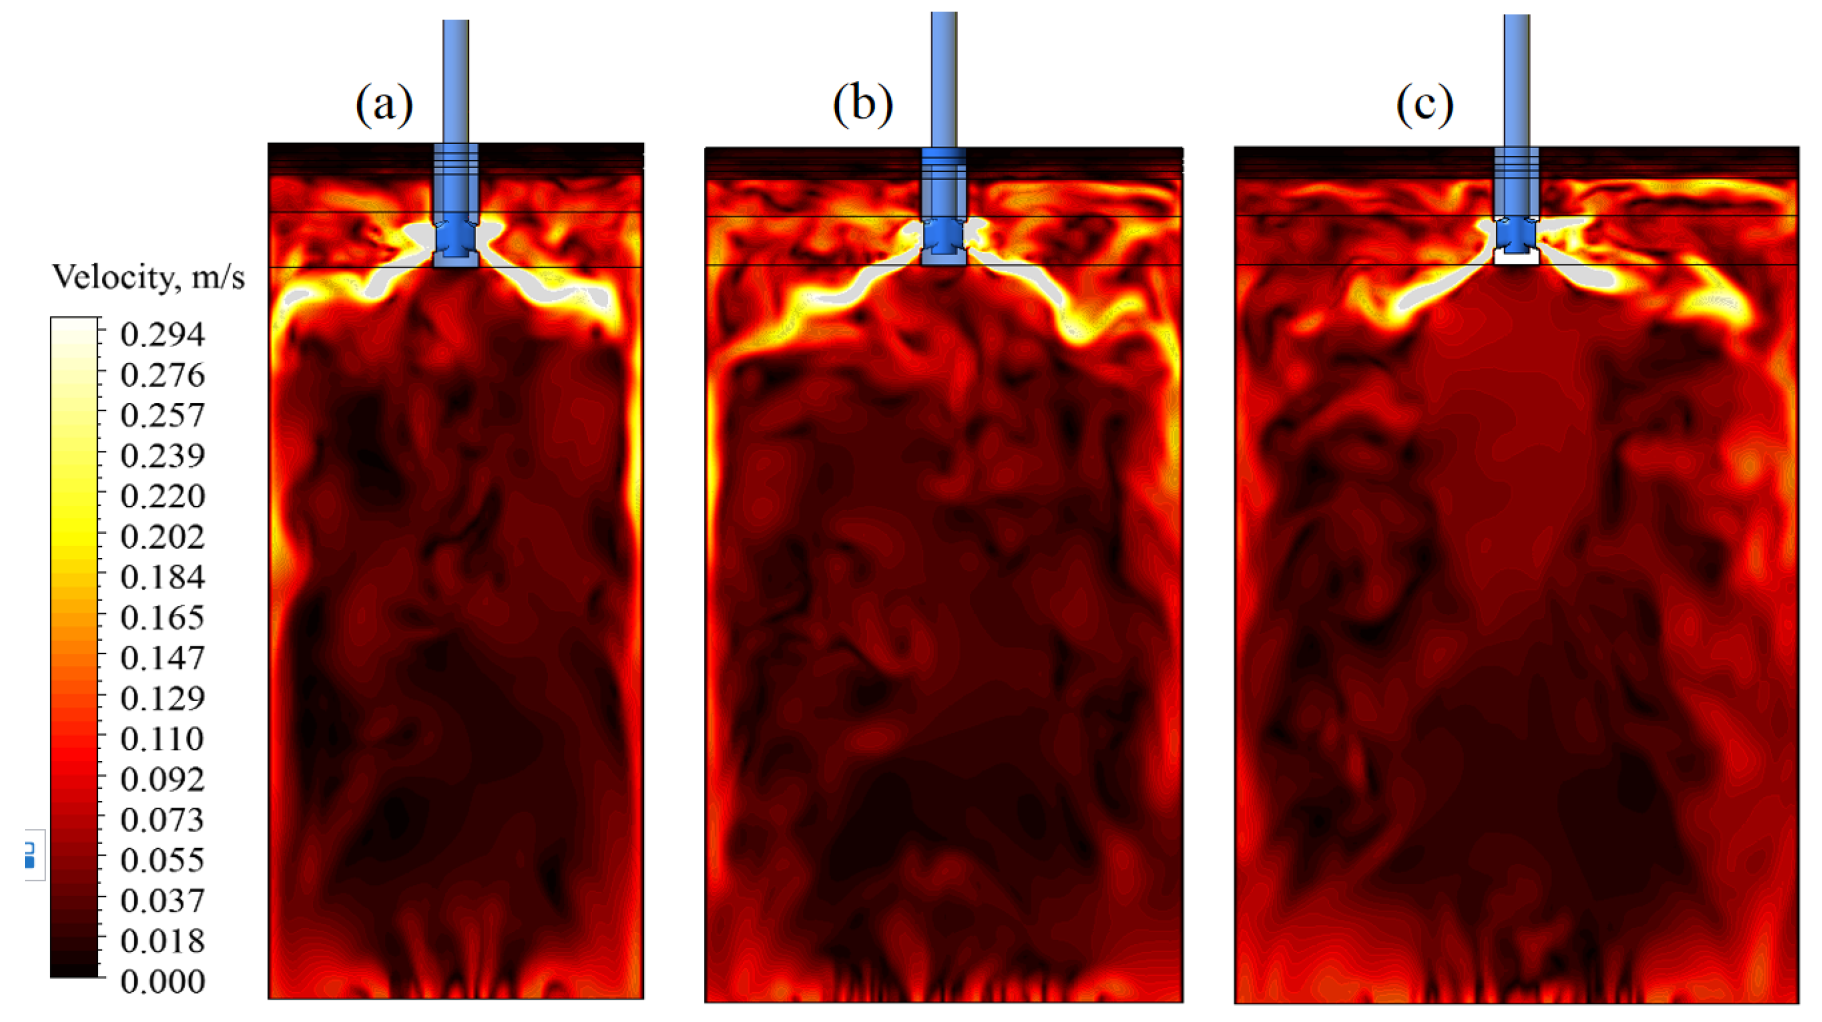
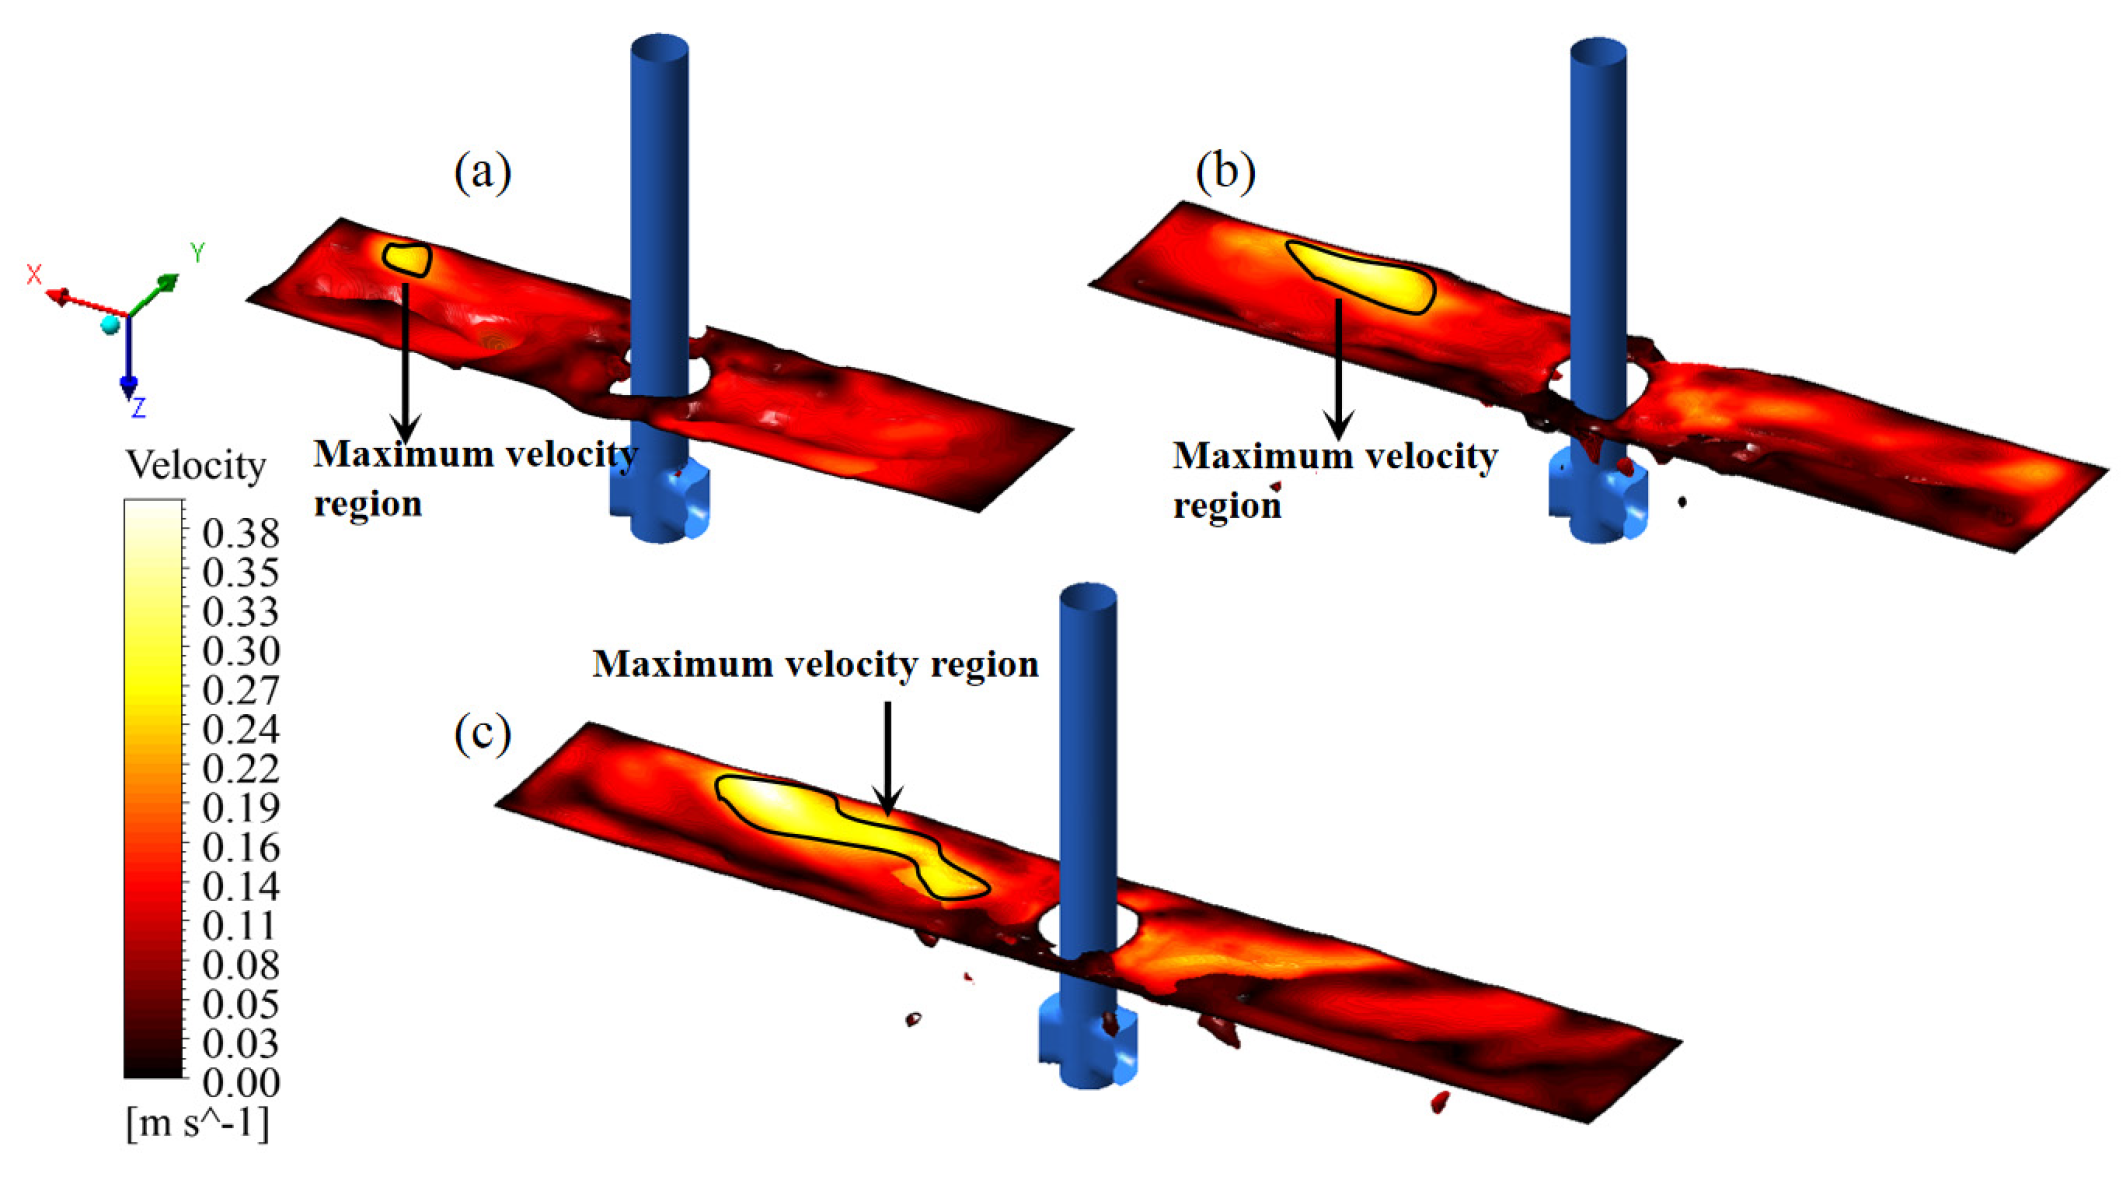
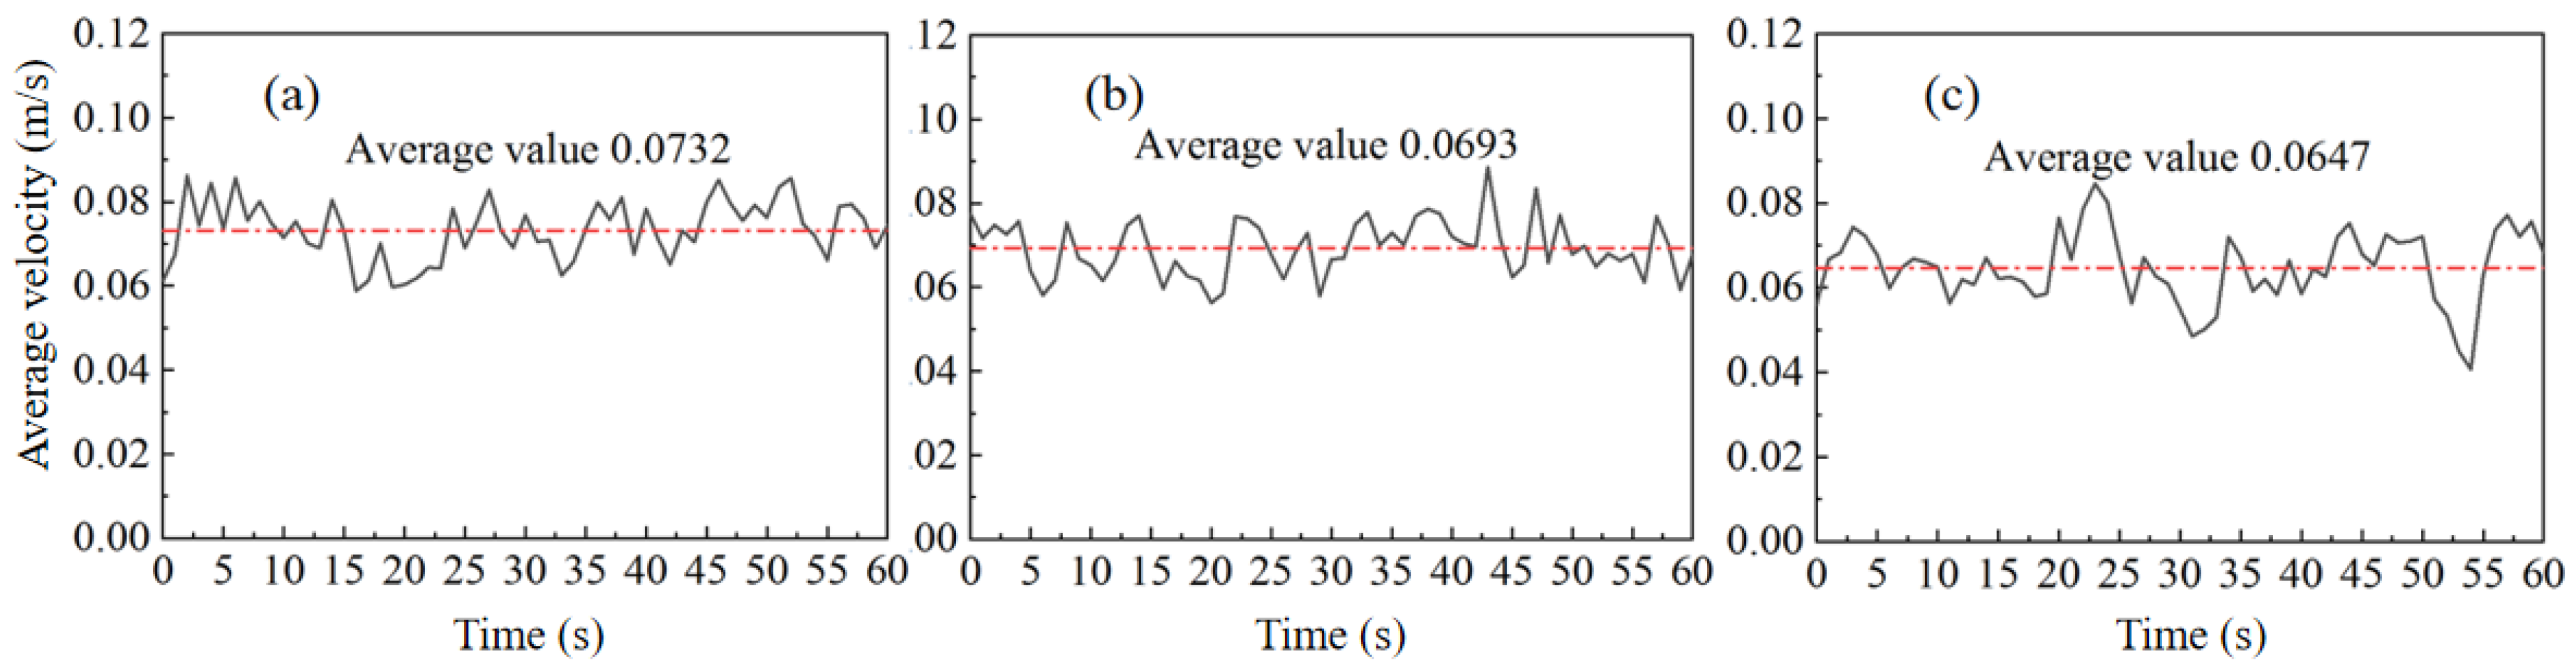
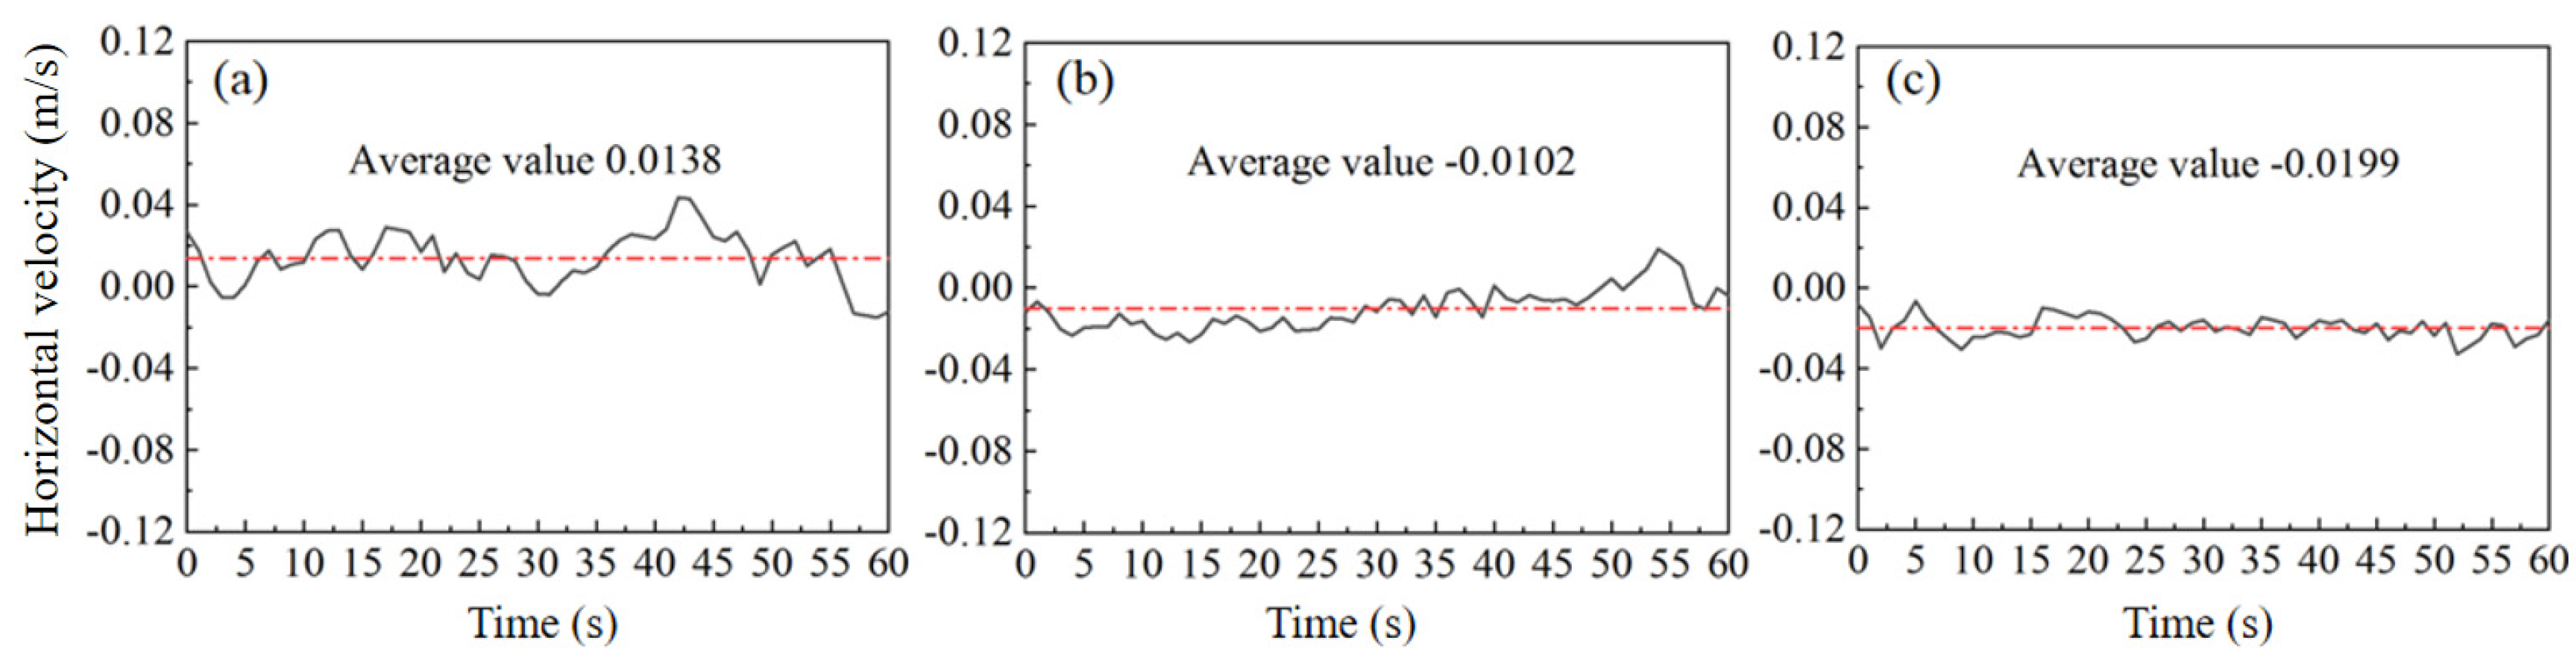
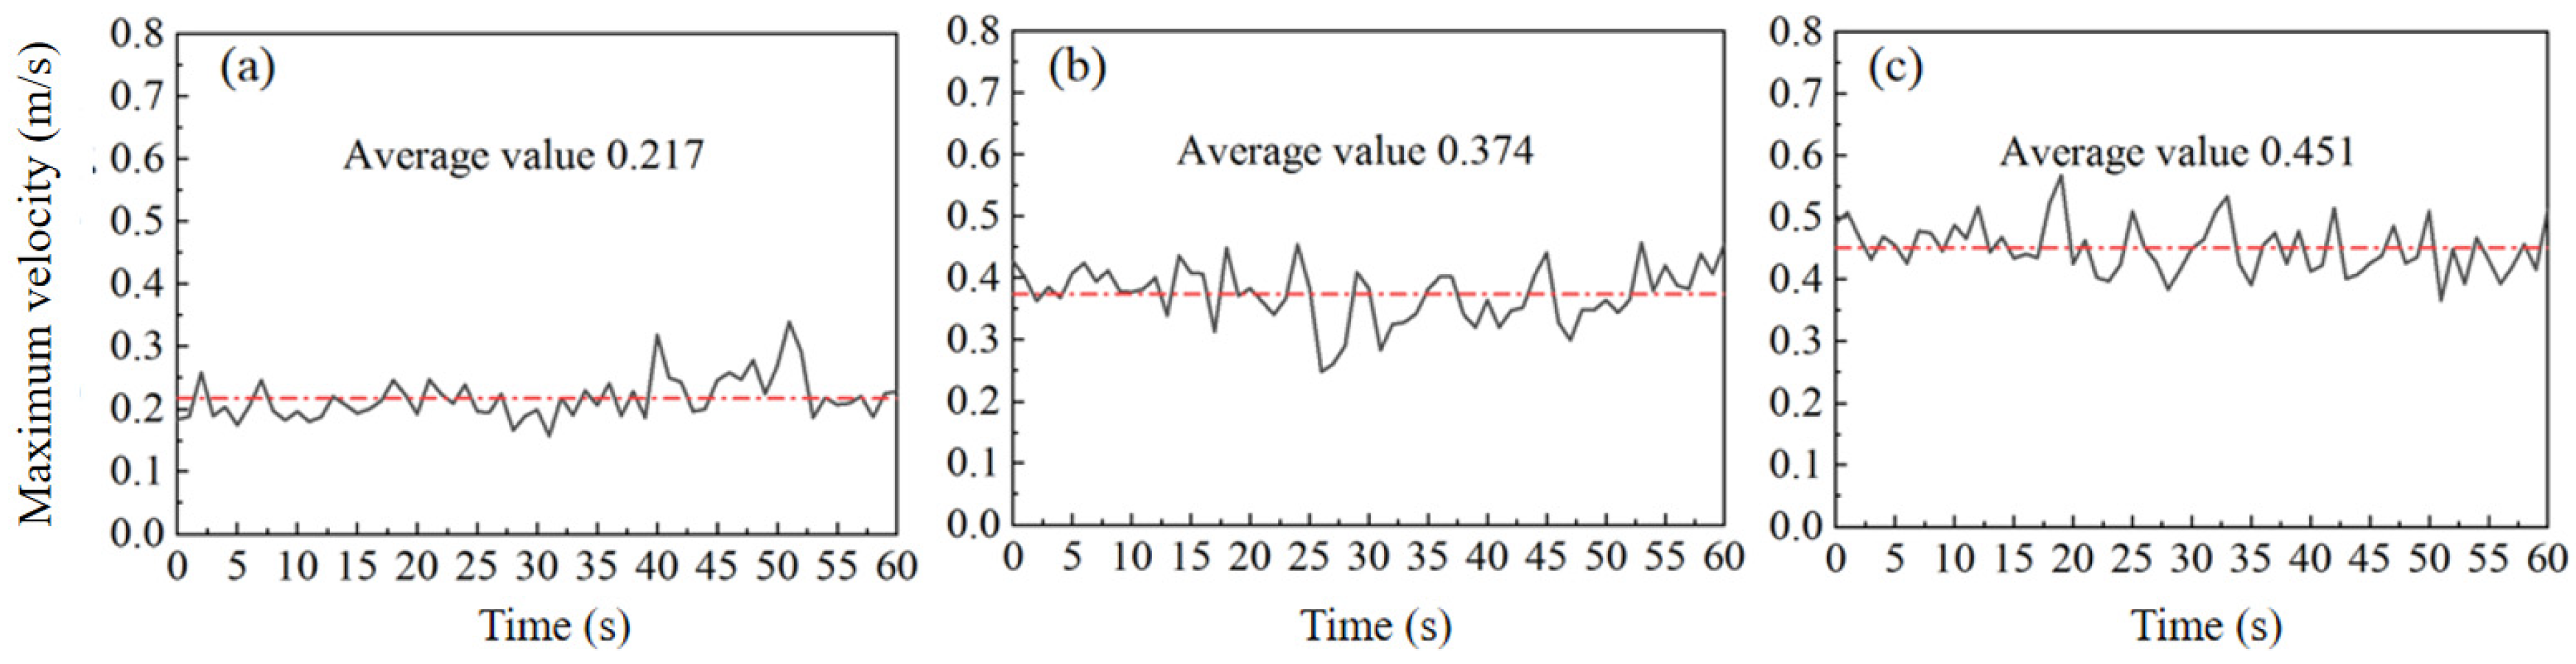
4.3. Analysis of Velocity Characteristics of Slag–Metal Interface

The average velocity fluctuation of the slag–metal interface is monitored and the results are shown in Figure 11. It can be seen that the fluctuations are quite different in different molds. On the one hand, the average velocity is 0.0732 m·s−1 with a small width of the mold and decreases to 0.0693 m·s−1 with a medium width of the mold. On the other hand, the fluctuation of the velocity with a large width of the mold is more significant, and the velocity continues to decrease with an average value of 0.0647 m·s−1. This phenomenon is mainly attributed to the loss of molten steel flow. In a word, with the increase in the mold section, the velocity of the slag–metal interface decreases. However, there is little difference in the interface velocity between slag and liquid metal in these three kinds of molds, which cannot explain the why the slag entrapment increases with different widths. Therefore, the average velocity of the slag–metal interface cannot be used to evaluate slag entrapment severity.
The horizontal velocity fluctuation of the slag–metal interface is shown in Figure 12. The velocity is signed: The negative value of velocity points to the narrow side of the mold, and the positive value points to the direction of the submerged nozzle. In the mold with a small width, most of the velocity value is positive, indicating that the up-flow is strong, corresponding to a flow pattern of double-roll flow (see Figure 7a). However, with the medium width of the mold, the value is mostly negative, indicating that the flow has been transformed into single-roll flow and the flow rate is reduced. When the width of the mold reaches 1650 mm, the flow is completely transformed into single-roll flow, while the flow rate increases. Therefore, the horizontal velocity cannot explain the reasons for the differences of slag entrapment as well.
Figure 13 shows the variation of the maximum interface velocity with time. It can be seen that with the rise in mold width, the maximum velocity of the slag–metal interface also increases, so the probability of slag entrapment increases. This explains the phenomenon that the number of slag droplets entrapped in the mold increases with the increase in the cross section width of the mold, as shown in Figure 3. In addition, it can be found that with the increase in cross section width, the amplitude of velocity fluctuation also increases, that is, a large cross section width easily causes slag entrapment, which is consistent with the changing trend of slag drop number (see Figure 10). Therefore, the maximum interface velocity can reflect the severity of slag entrapment in a different mold, which should be paid more attention to control slag entrapment in steel.

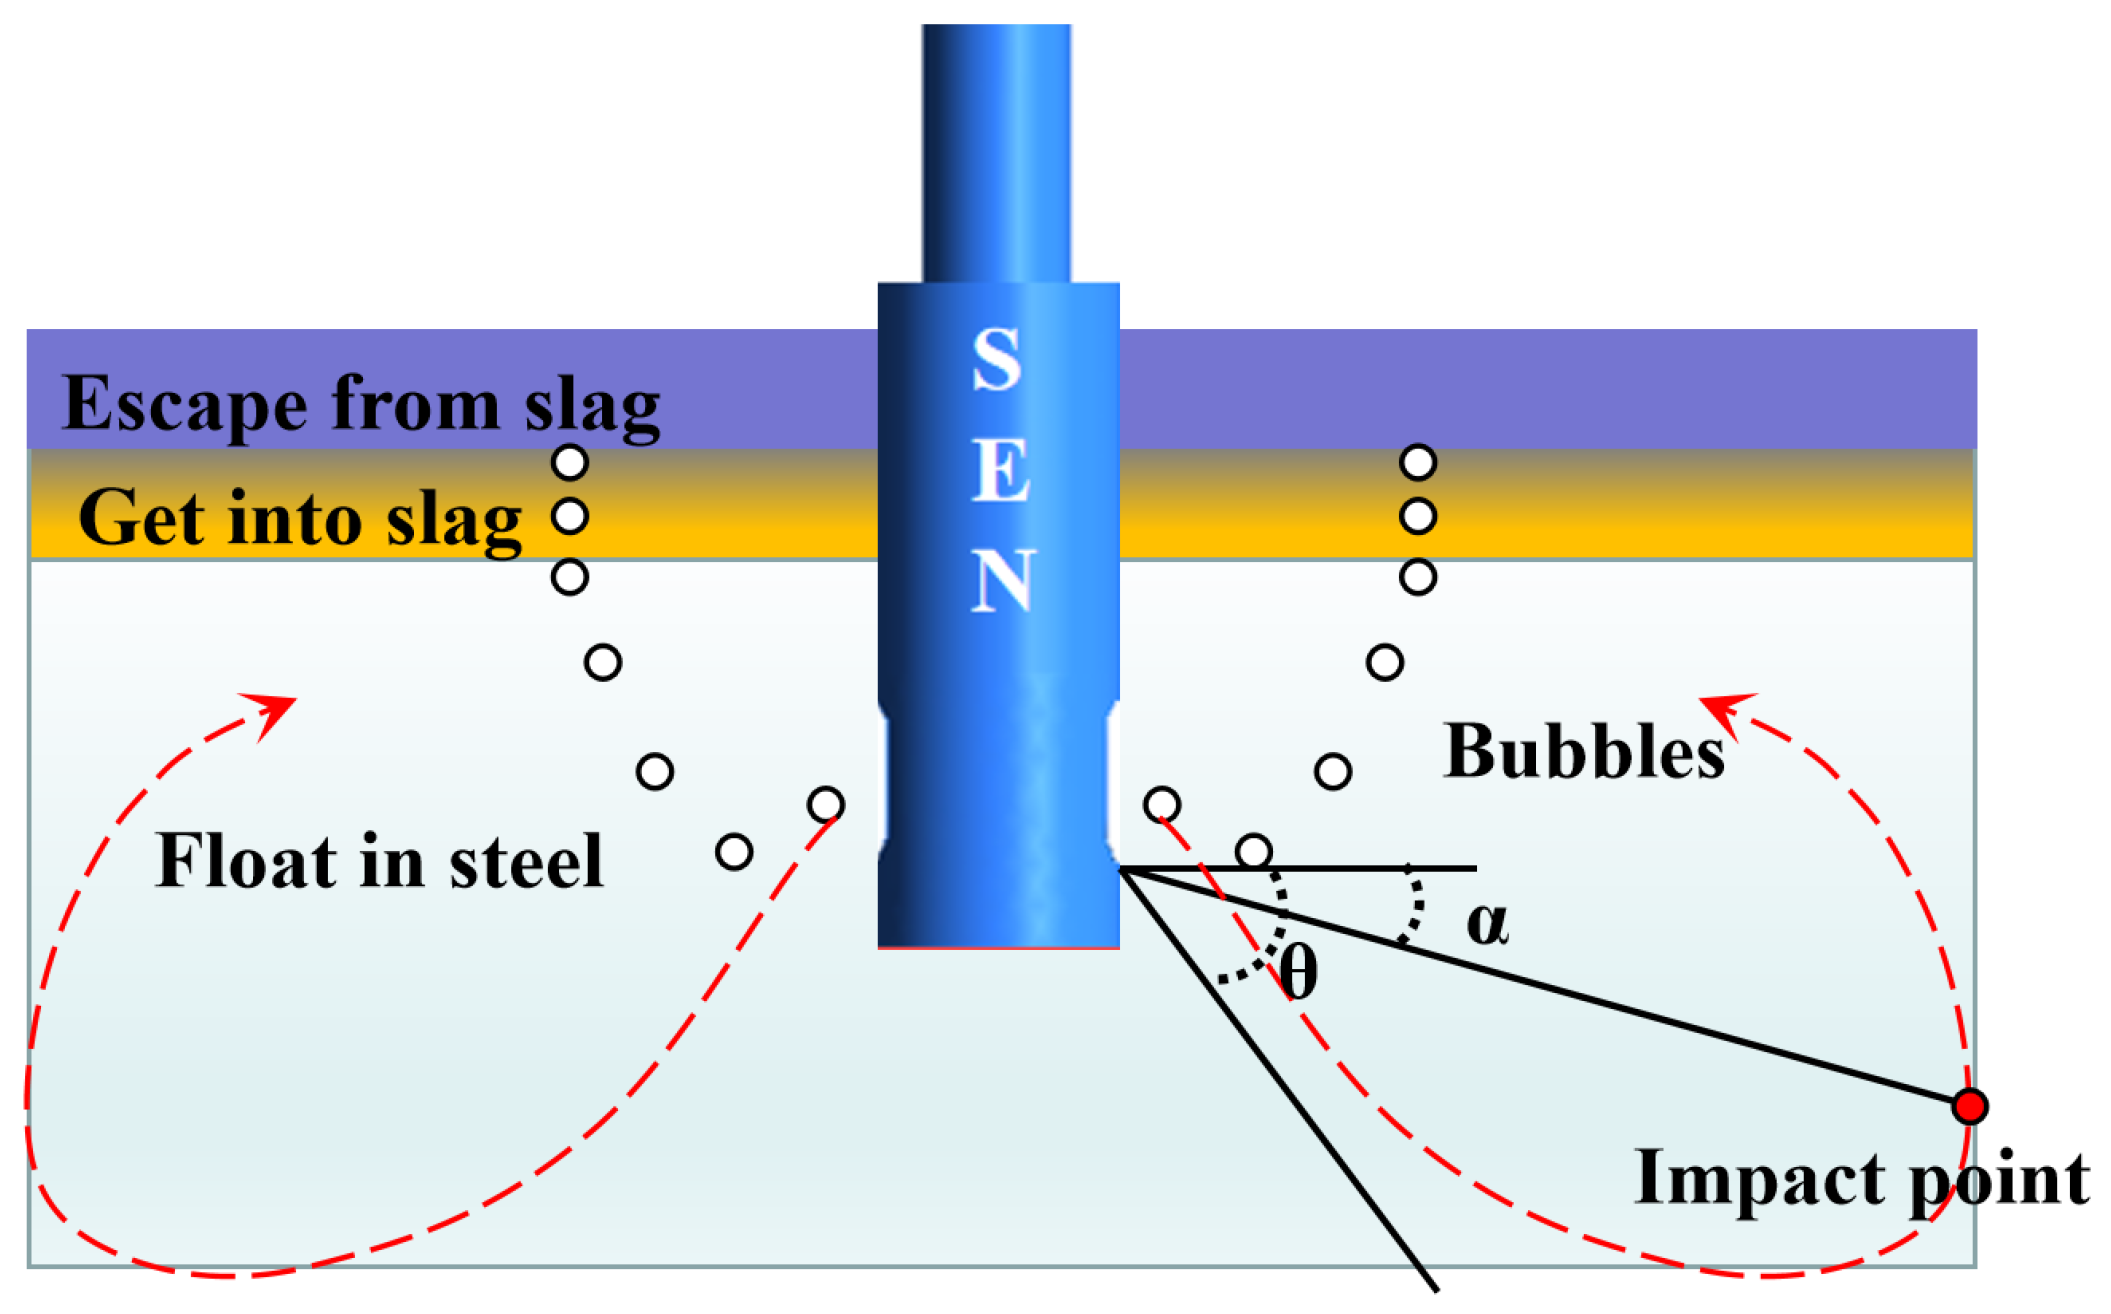
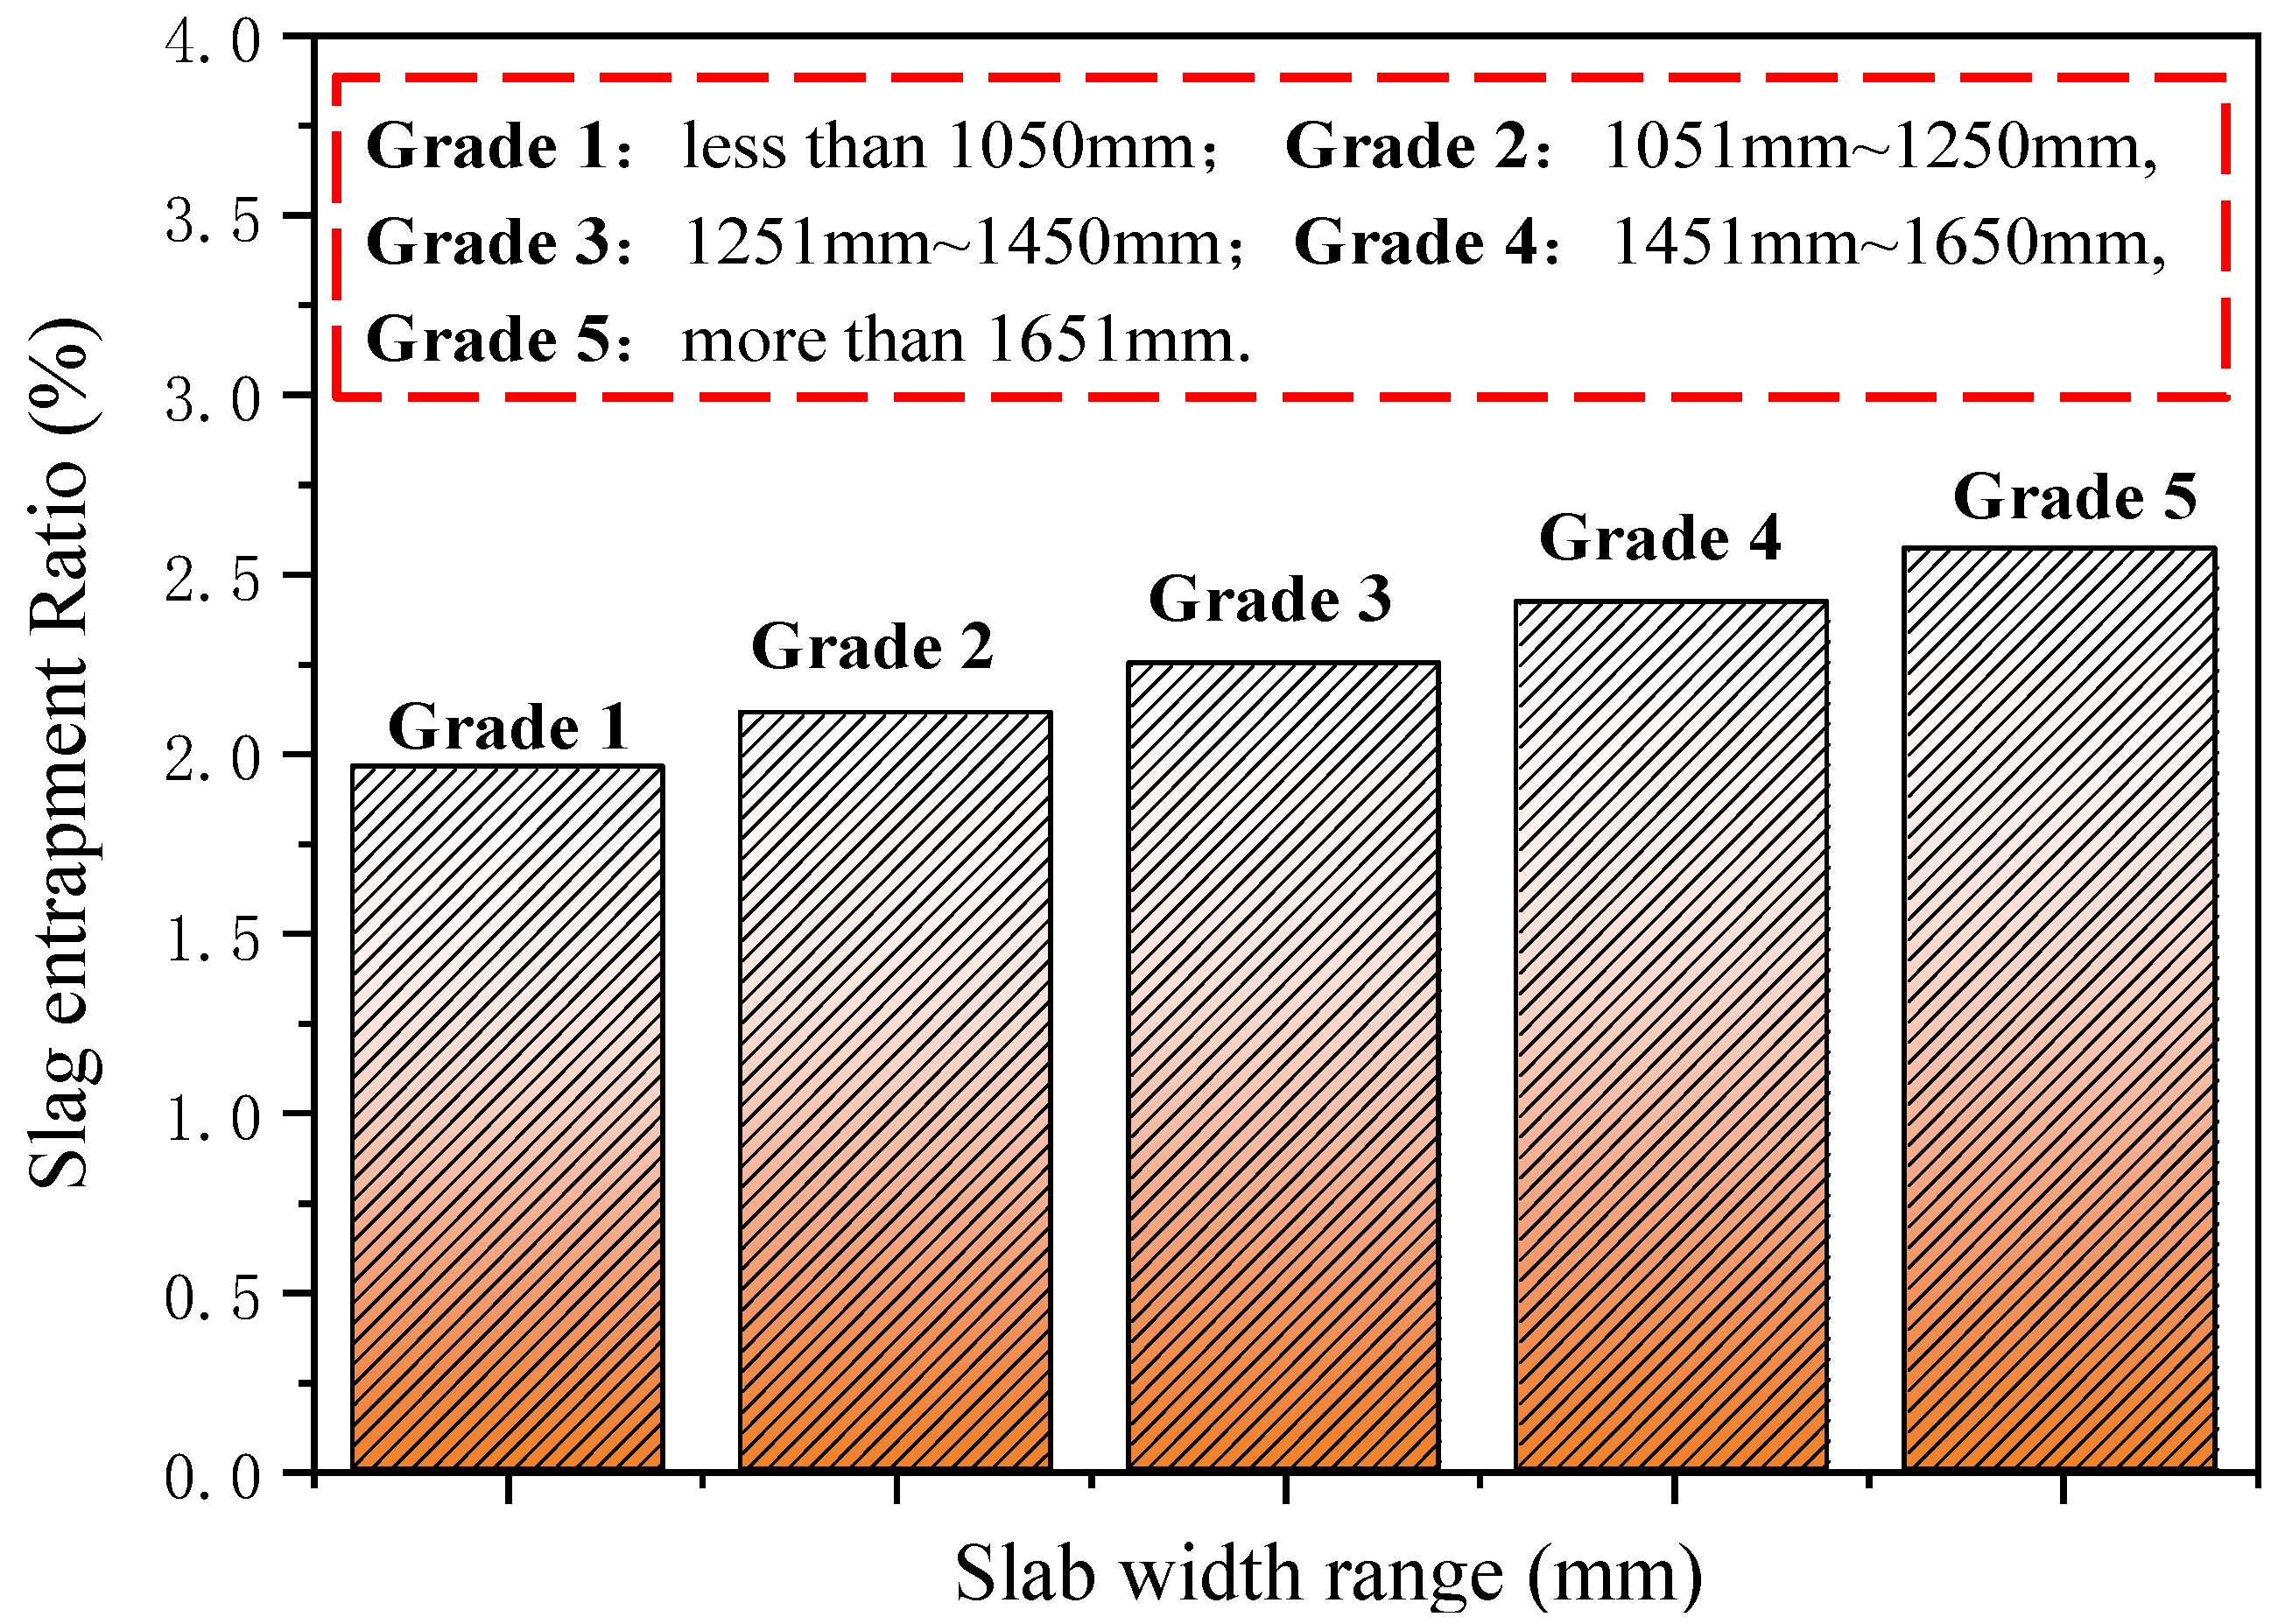
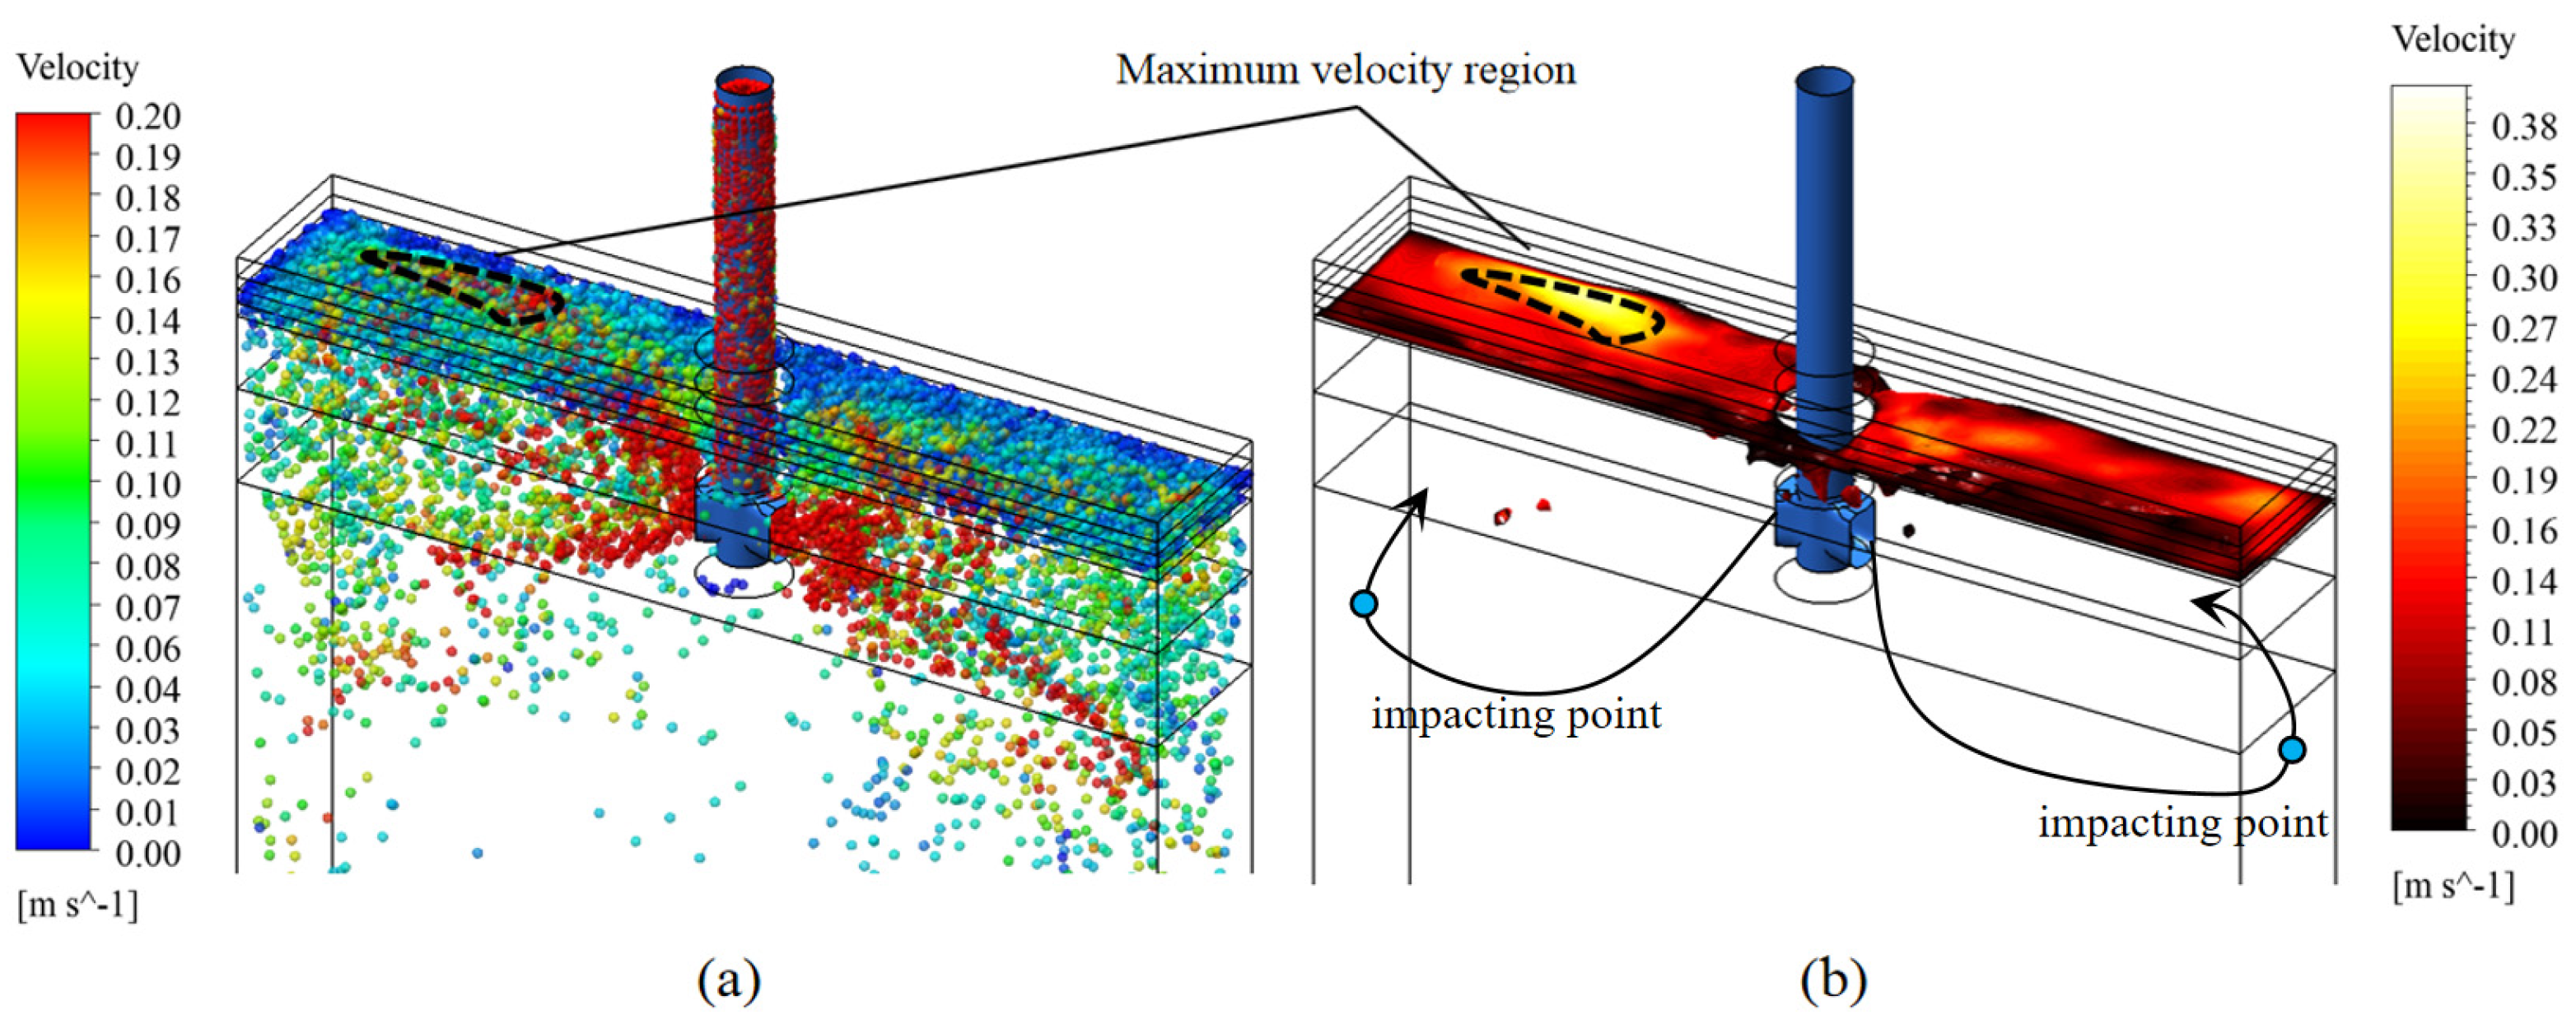
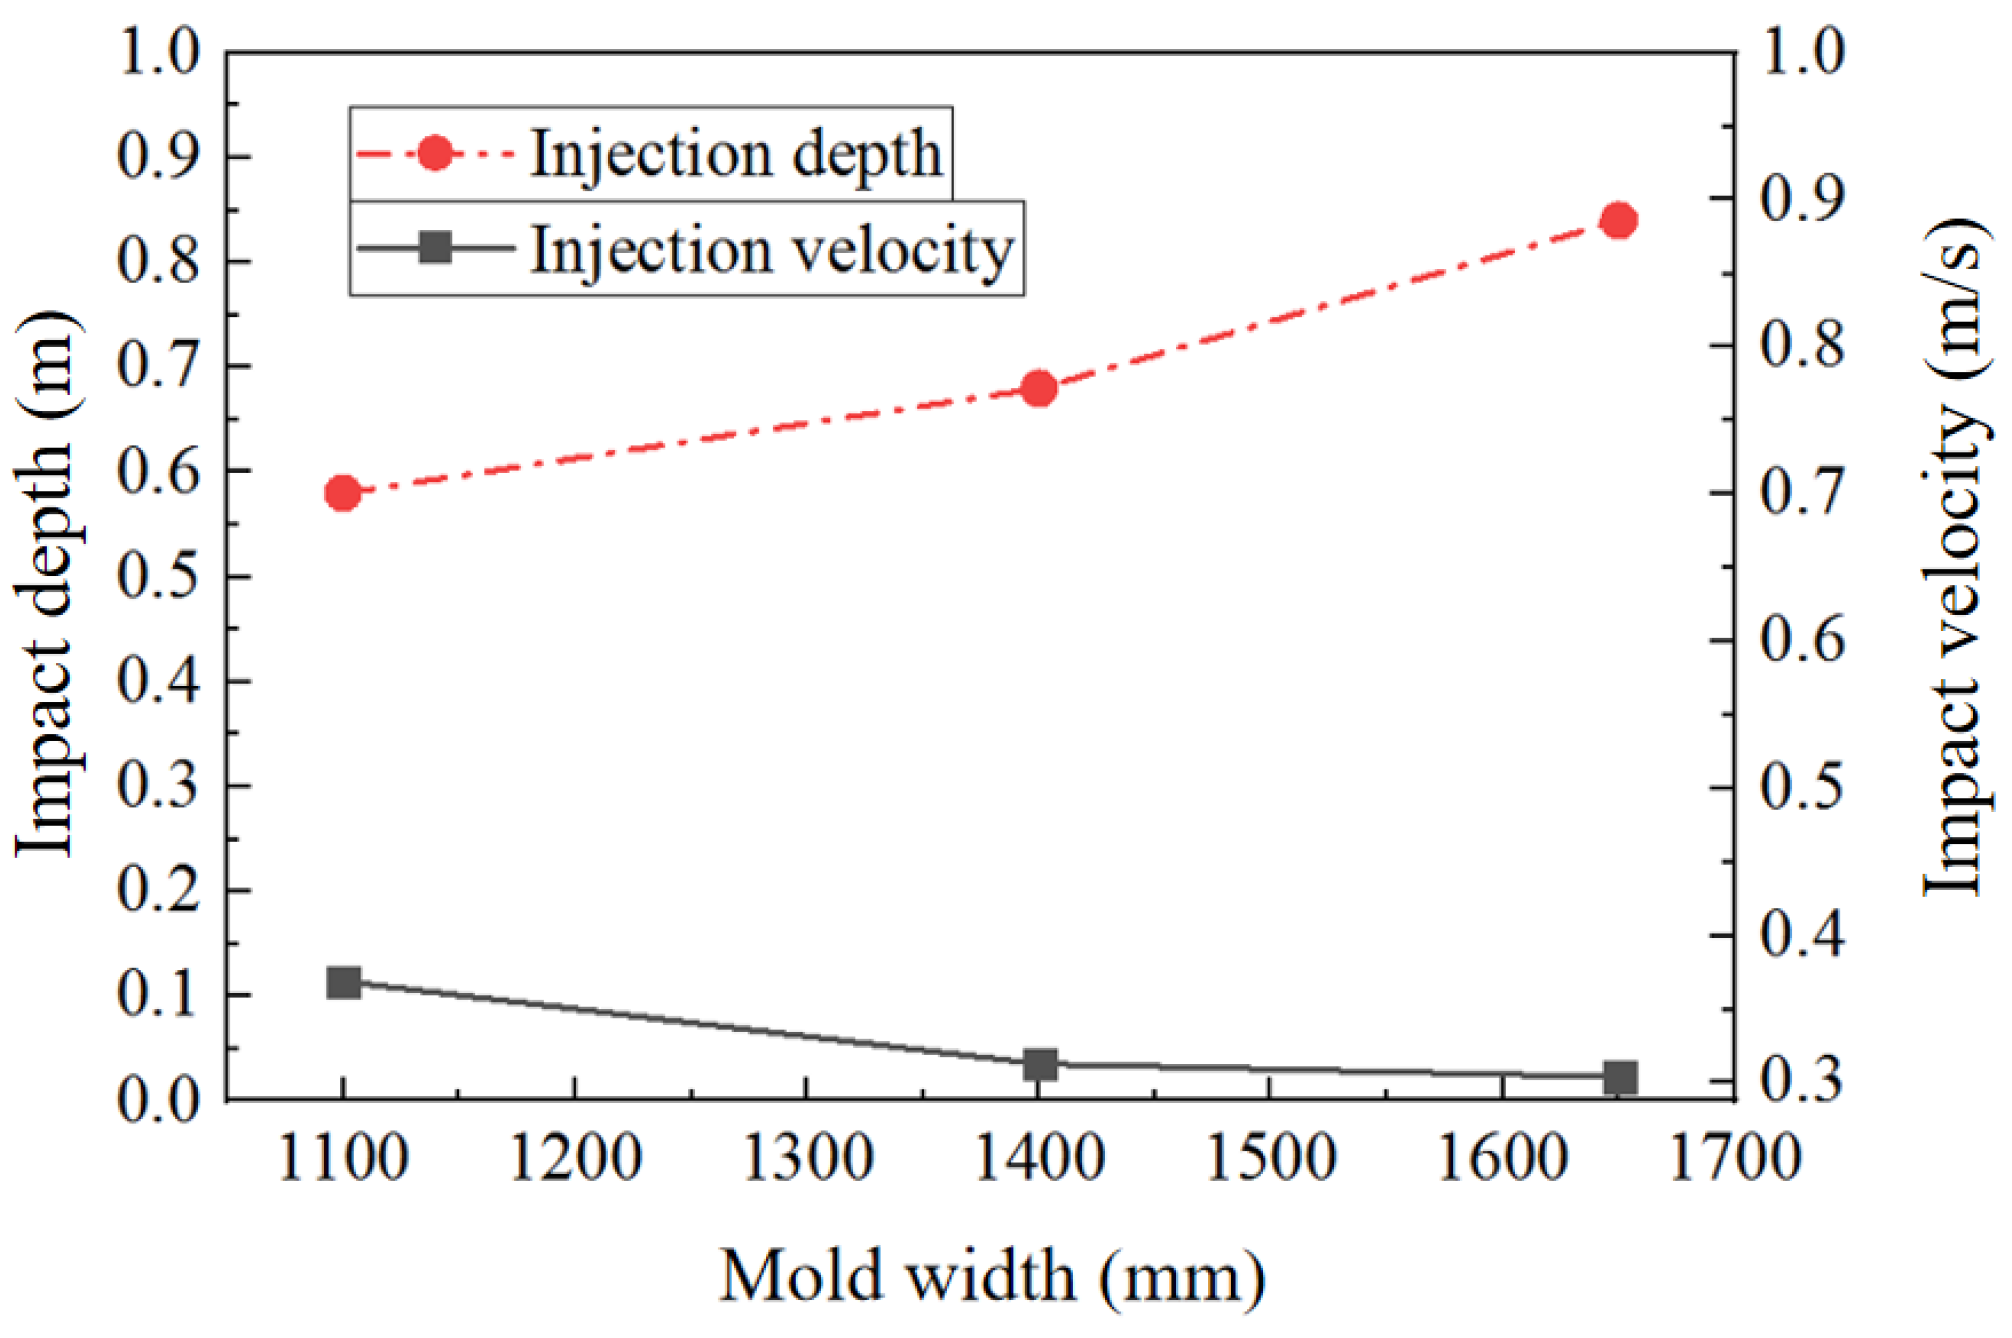
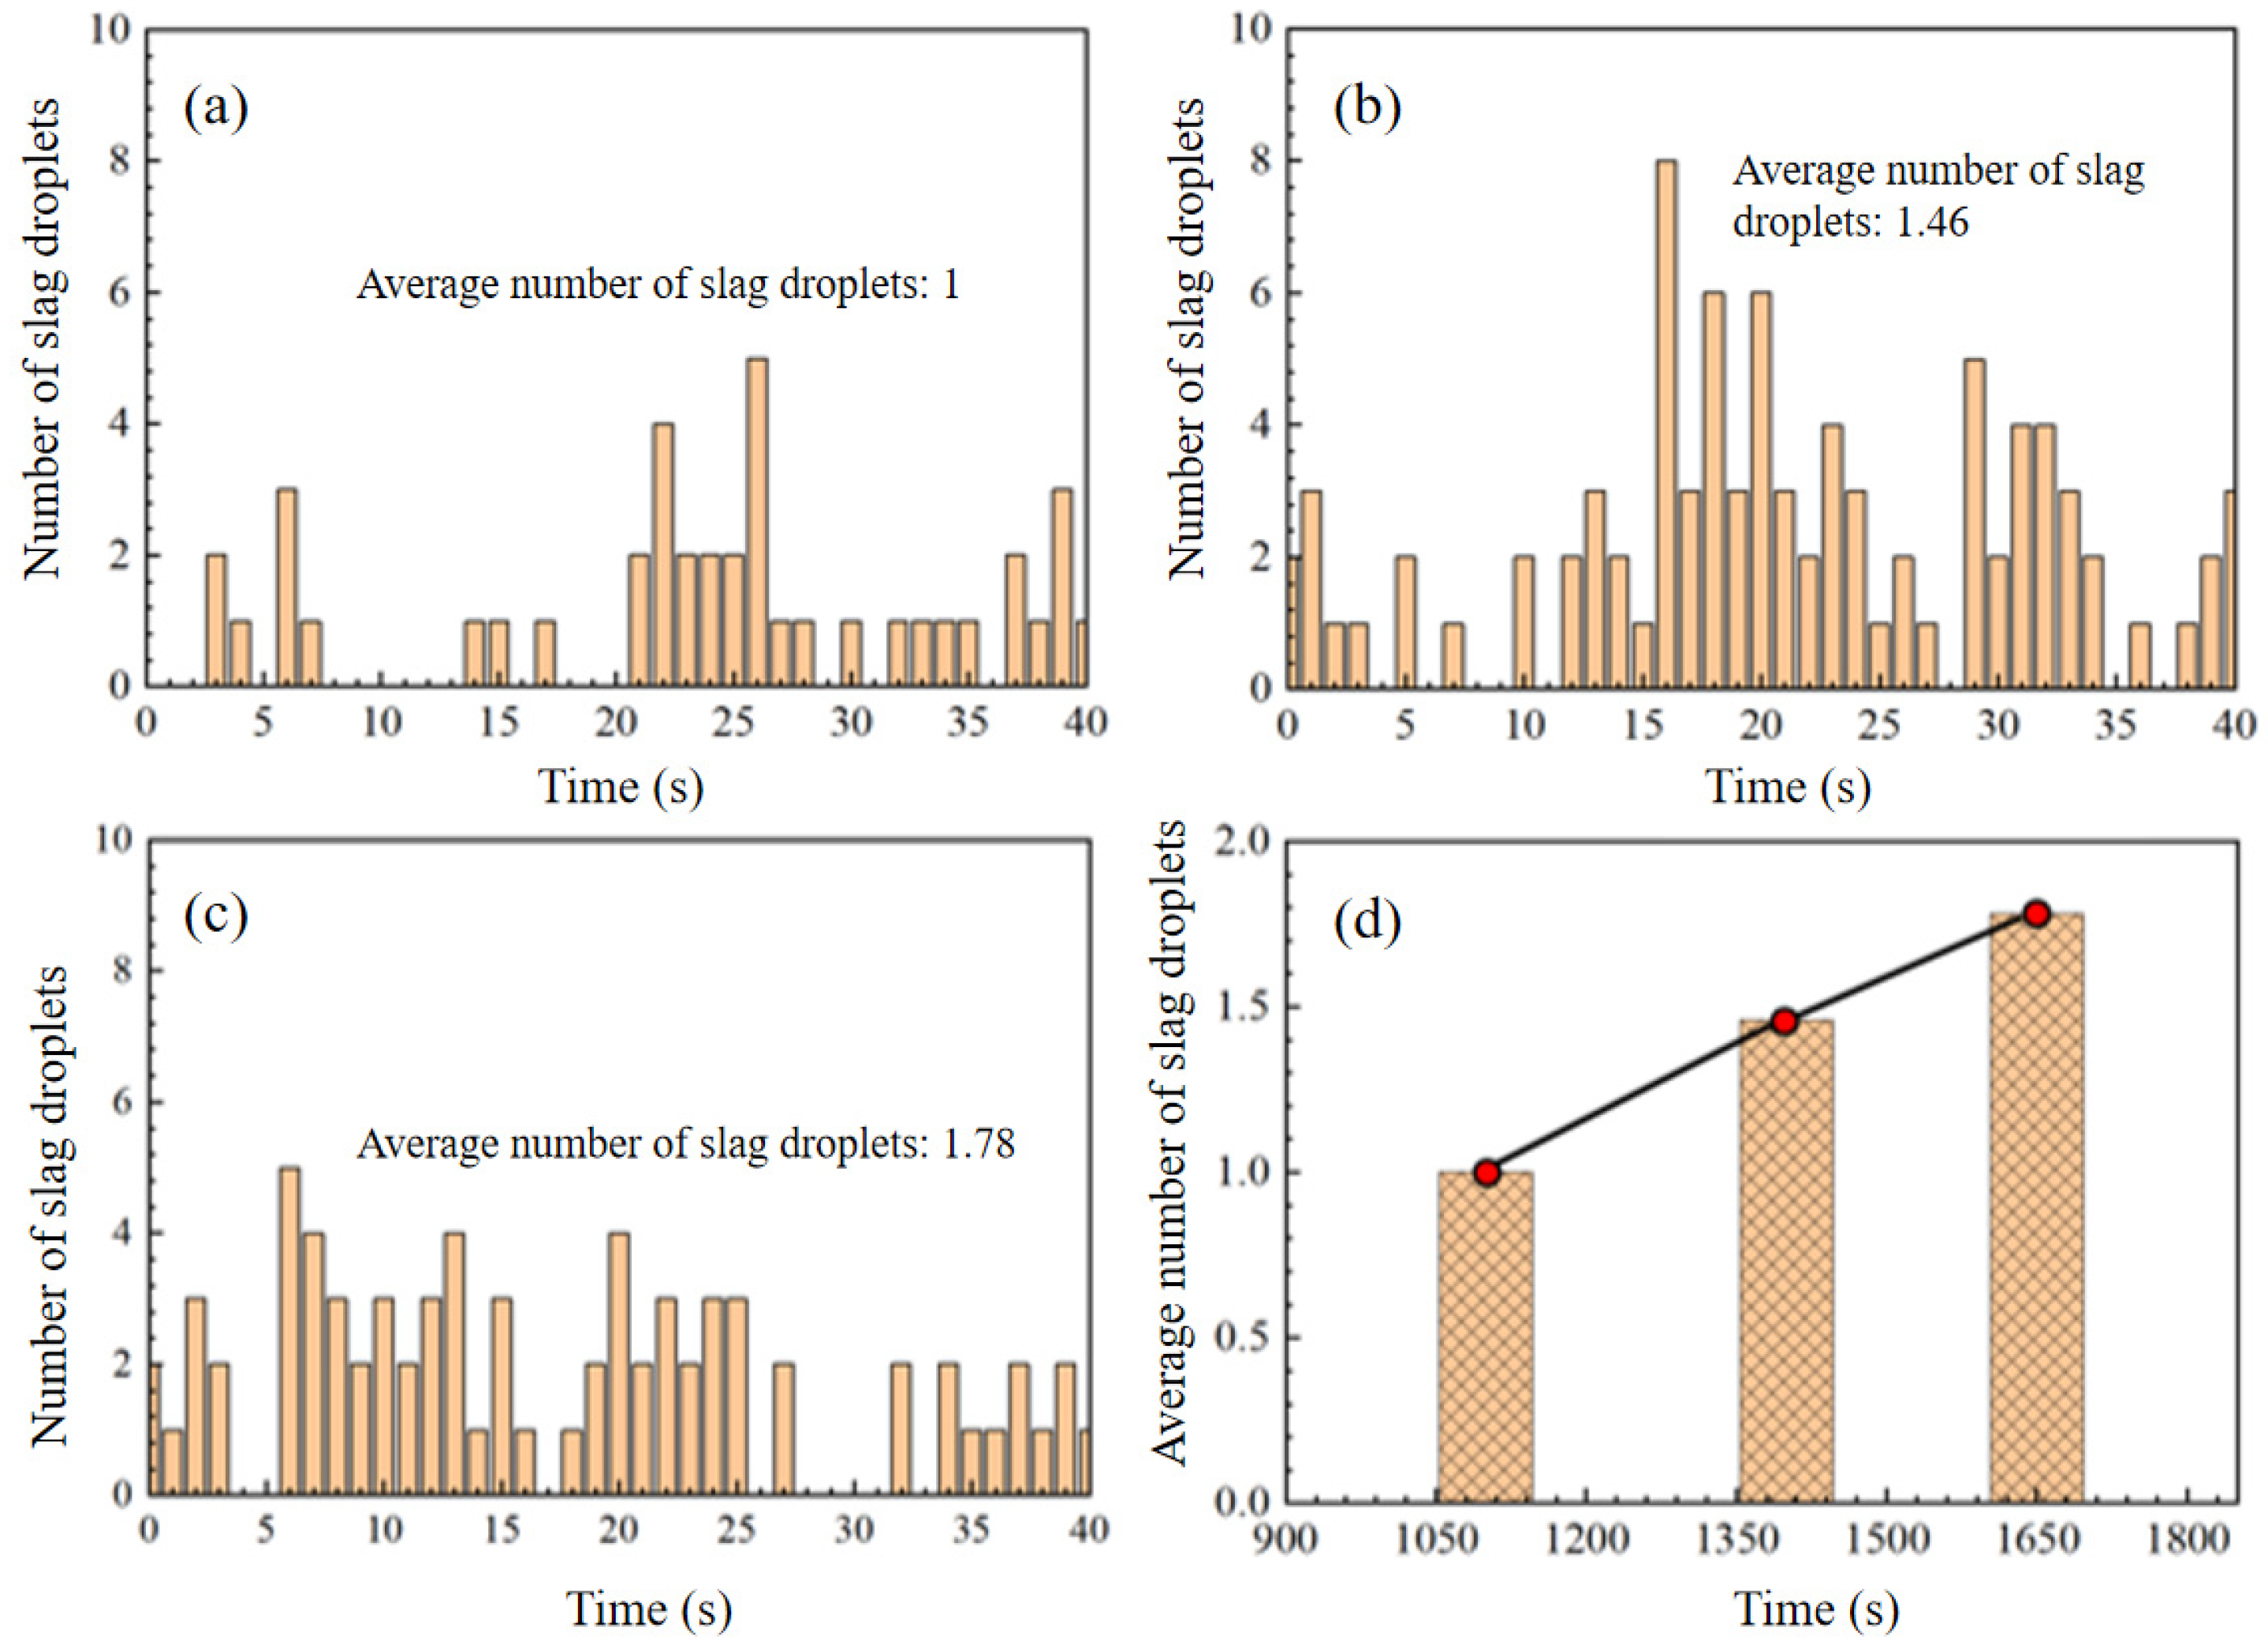
4.4. Prediction of Slag Entrapment in Mold

Figure 14 reveals the number of slag drops in molds of different widths. It can be seen that the number of slag drops increases with the mold width. The reason for this phenomenon is related to argon blowing, that is, a more considerable amount of argon gas retained in the wide-faced mold and a longer floating time lead to more argon bubbles retained in the slag layer, accompanied by the enhanced emulsification effect. The velocity of bubbles is so high that they may significantly increase the velocity of the steel around them. Therefore, a large mold is more likely to cause slag entrapment.

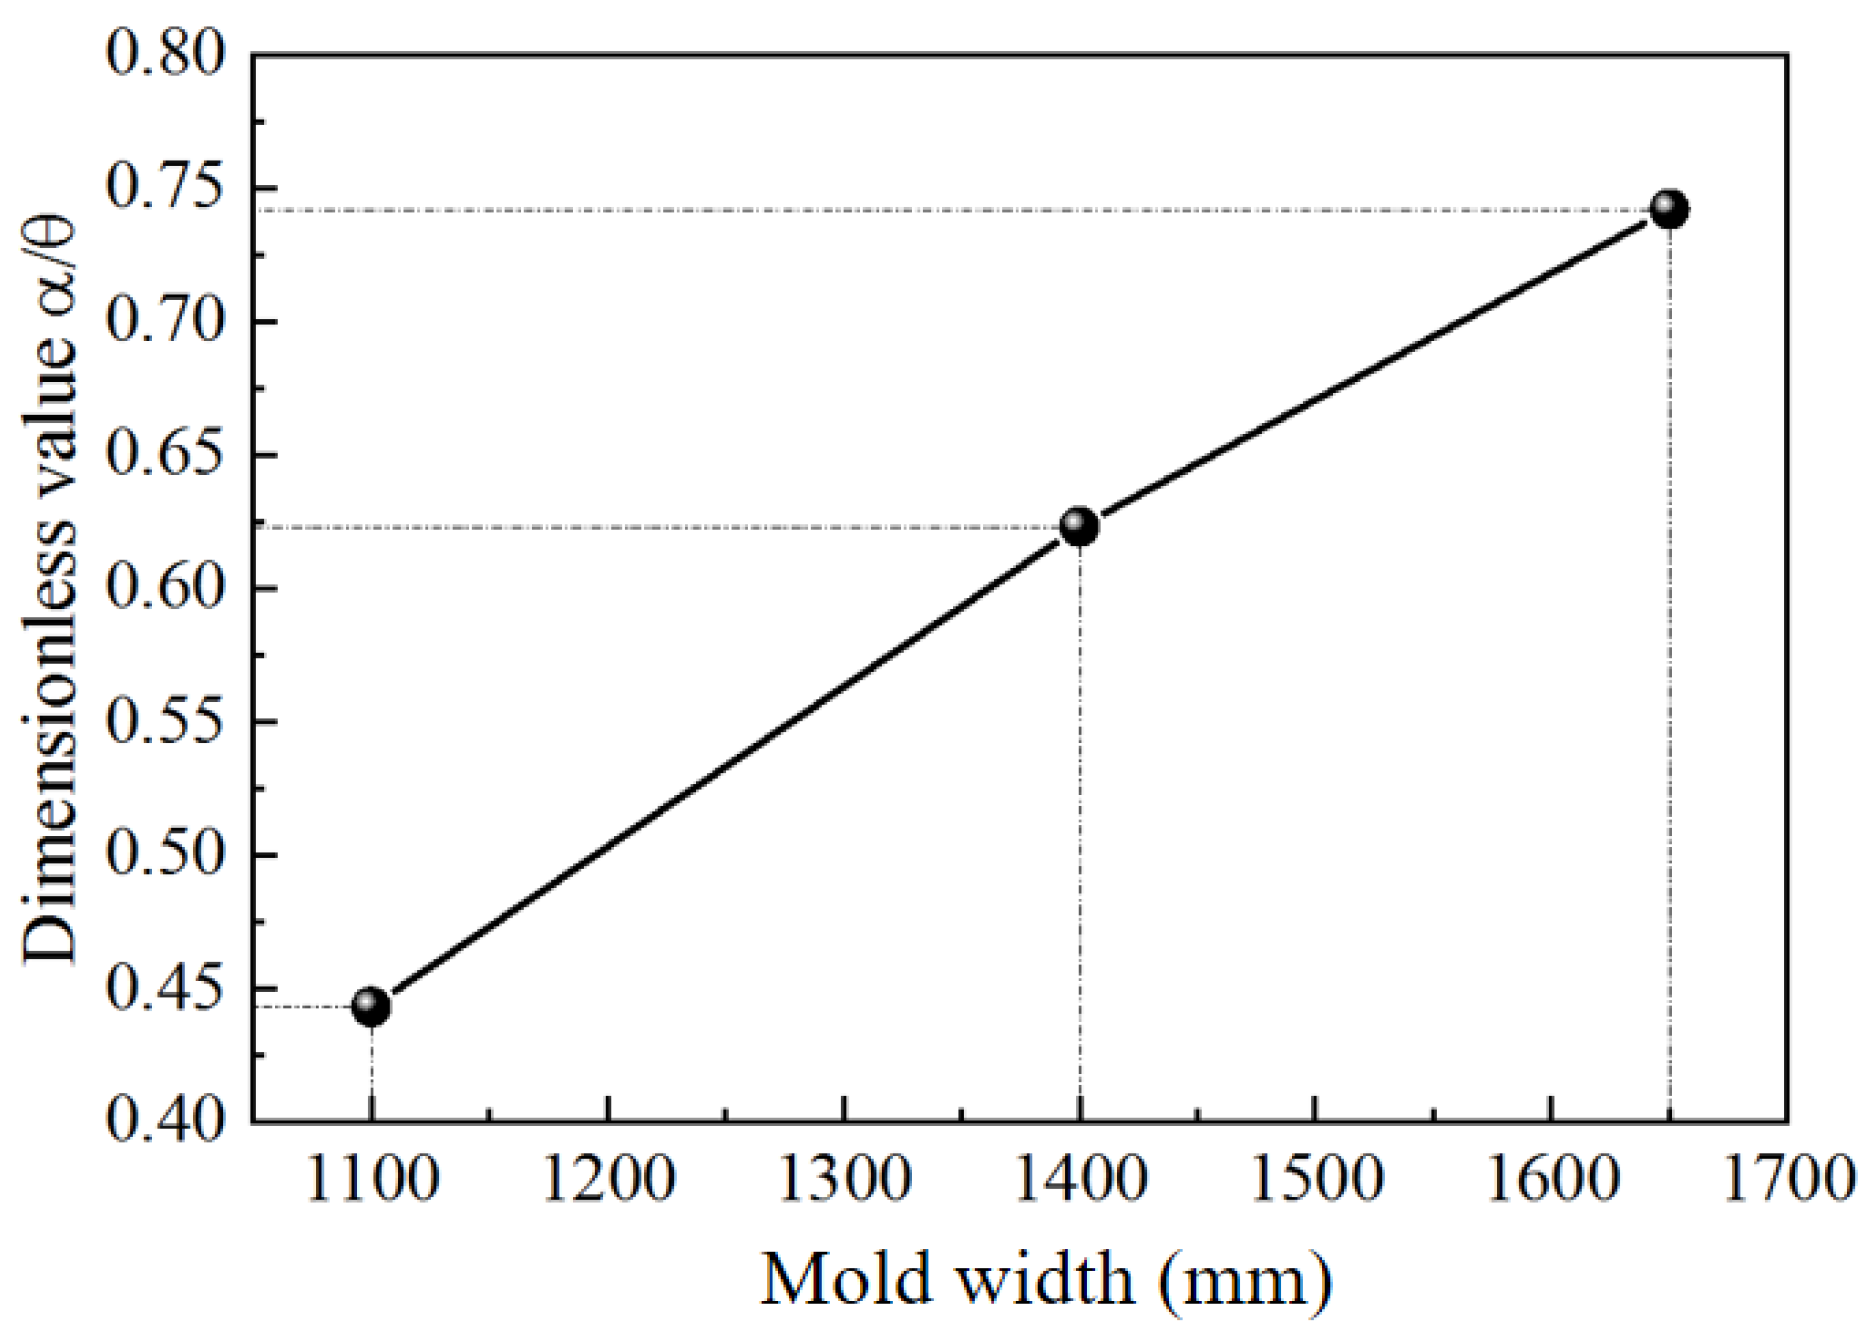
5. Slag Entrapment Evaluation Criteria

The floatation of bubbles significantly affects the slag–metal interface, and increases the slag entrapment when mold width gets larger. Simultaneously, the floatation of bubbles can also lift the molten steel that is injected from submerged entry nozzle (SEN). Therefore, a dimensionless criterion number can be defined to reflect the effect of jet rigidity on slag entrapment in steel. As shown in Equation (9):
C = α θ
where α is the angle of the jet and θ is the angle of the nozzle (see Figure 2). Therefore, the physical meaning of Equation (9) can be interpreted as the ratio of jet angle to the original nozzle angle. Without bubble injection, the rigid jet is equal to C = 1. Considering the effect of argon, C < 1 when argon floats. Figure 15 shows variations of C value with different mold widths. It can be seen from Figure 15 that the C value increases with mold width. This trend is similar to that of slag drop variations shown in Figure 14, indicating that the C value can be used as a guide to reflect the slag entrapment in molds with different widths.

6. Conclusions

In this work, a three-dimensional model is established to simulate the slag entrapment phenomenon, mainly focusing on the slag entrapment phenomenon in different molds. The large eddy simulation (LES) model is applied for the calculation of the turbulence of molten steel, and the Smagorinsky–Lilly model is used to describe the sub-grid scale vortices. Based on the obtained study results, the following conclusions can be drawn:
(1) The amount of slag entrapment increases with mold width, which is mainly due to the bubble pulsion. There exists a transformation of flow pattern in the mold when mold width increases. The double-roll flow pattern produces less slag entrapment than a single-roll flow pattern.
(2) The impact depth of molten steel decreases with mold width, while the impact velocity increases with mold width. The larger the mold width, the weaker the rigidity of the jet. Thus, the bubble injection significantly affects the flow field in the mold.
(3) Both of the average velocity and horizontal velocity of slag/metal interface cannot reflect the severity of slag entrapment in the mold. By comparison, the maximum velocity at the interface shows good advantages in predicting the severity of slag entrapment in the mold.
(4) A dimensionless criterion number C with the physical meaning of the ratio of jet angle to nozzle angle is successfully established to predict slag entrapment in different molds.

Author Contributions

X.Z. contributed to writing the original draft and compiled the manuscript and the data collection; X.L. contributed to the outline of the paper, writing, drawing and validation; J.Z. contributed to the conceptualization, reviewing and editing the manuscript. All authors have read and agreed to the published version of the manuscript.

Funding

This work is financially supported by the Baoshan Iron&Steel Company (Grant No. R17ECP0310), and Special funding from Jiangyan district in Taizhou City (No. SDXCL(2020)-12).

Institutional Review Board Statement

Not applicable.

Informed Consent Statement

Not applicable.

Data Availability Statement

The data presented in this study are available on request from the corresponding author. The data are not publicly available due to privacy.

Conflicts of Interest

The authors declare no conflict of interest.

References

  1. Gupta, D.; Lahiri, A.K. Water-modeling study of the surface disturbances in continuous slab caster. Metall. Mater. Trans. B 1994, 25, 227–233. [Google Scholar] [CrossRef]
  2. Li, B.K.; Li, D.H. Water model observation and numerical simulation of vortexing flow at molten steel surface in continuous casting mold. Acta Metall. Sin. 2002, 38, 315–320. [Google Scholar] [CrossRef]
  3. Iguchi, M.; Yoshida, J.; Shimizu, T.; Mizuno, Y. Model study on the entrapment of mold powder into molten steel. ISIJ Int. 2000, 40, 685–691. [Google Scholar] [CrossRef] [Green Version]
  4. Watanabe, T.; Iguchi, M. Water model experiments on the effect of an argon bubble on the meniscus near the immersion nozzle. ISIJ Int. 2009, 49, 182–188. [Google Scholar] [CrossRef] [Green Version]
  5. Yamashita, S.; Iguchi, M. Mechanism of mold powder entrapment caused by large argon bubble in continuous casting mold. ISIJ Int. 2001, 41, 1529–1531. [Google Scholar] [CrossRef]
  6. Savolainen, J.; Fabritius, T.; Mattila, O. Effect of fluid physical properties on the emulsification. ISIJ Int. 2009, 49, 29–36. [Google Scholar] [CrossRef] [Green Version]
  7. Yamada, W.; Kiyose, A.; Fukuda, J.; Tanaka, H.; Nakashima, J.I. Simulation of coagulation of non-metallic inclusions in tundish and their trapping into solidified shell in continuous casting mould. Ironmak. Steelmak. 2003, 30, 151–157. [Google Scholar] [CrossRef]
  8. Jonsson, L.; Jönsson, P. Modeling of fluid flow conditions around the slag/metal interface in a gas-stirred ladle. ISIJ Int. 1996, 36, 1127–1134. [Google Scholar] [CrossRef] [Green Version]
  9. Gupta, D.; Lahiri, A.K. Cold model study of the surface profile in a continuous slab casting mold: Effect of second phase. Metall. Mater. Trans. B 1996, 27, 695. [Google Scholar] [CrossRef]
  10. Funada, T.; Joseph, D.D. Viscous potential flow analysis of Kelvin-Helmholtz instability in a channel. J. Fluid Mech. 2001, 445, 263–283. [Google Scholar] [CrossRef] [Green Version]
  11. Lei, H.; Zhu, M.Y.; He, J.C. Mathematical modeling of slag entrapment in continuous casting mould. Acta Metall. Sin. 2000, 36, 1113–1117. [Google Scholar] [CrossRef]
  12. Chung, Y.; Cramb, A.W. Dynamic and equilibrium interfacial phenomena in liquid steel-slag systems. Metall. Mater. Trans. B 2000, 31, 957–971. [Google Scholar] [CrossRef]
  13. Harman, J.M.; Cramb, A.W. A study of the effect of fluid physical properties upon droplet emulsification. In Proceedings of the 79th Steelmaking Conference, Pittsburgh, PA, USA, 24–27 March 1996; pp. 773–784. [Google Scholar]
  14. Saeedipour, M.; Puttinger, S.; Doppelhammer, N.; Pirker, S. Modelling slag entrainment in the continuous casting mold with LES-VOF simulations and comparison to a water/oil benchmark experiment. In Proceedings of the 9th European Continuous Casting Conference, Vienna, Austria, 26–29 June 2017; pp. 26–29. [Google Scholar]
  15. Liu, Z.Q.; Sun, Z.B.; Li, B.K. Modeling of quasi-four-phase flow in continuous casting mold using hybrid Eulerian and Lagrangian approach. Metall. Mater. Trans. B 2017, 48, 1248–1267. [Google Scholar] [CrossRef]
  16. Li, X.L.; Li, B.K.; Liu, Z.Q.; Niu, R.; Liu, Y.Q.; Zhao, C.L.; Huang, C.D.; Qiao, H.S.; Yuan, T.X. Large Eddy simulation of multi-phase flow and slag entrapment in a continuous casting mold. Metals 2019, 9, 7. [Google Scholar] [CrossRef] [Green Version]
  17. Li, X.L.; Li, B.K.; Liu, Z.Q.; Niu, R.; Liu, Q.; Huang, X.C.; Xu, G.D.; Ruan, X.M. Detection and numerical simulation of non-metallic inclusions in continuous casting slab. Steel Res. Int. 2019, 90, 1800423. [Google Scholar] [CrossRef]
  18. Li, X.L.; Li, B.K.; Liu, Z.Q.; Niu, R. Large Eddy simulation of electromagnetic three-phase flow in a round bloom considering solidified shell. Steel Res. Int. 2019, 90, 1800133. [Google Scholar] [CrossRef]
  19. Sun, M.J.; Li, B.K.; Li, L.M. A multi-scale mathematical model of growth and coalescence of bubbles beneath the anode in an aluminum reduction cell. Metall. Mater. Trans. B 2018, 49, 2821–2834. [Google Scholar] [CrossRef]
  20. Huang, X.C.; Li, B.K.; Liu, Z.Q.; Li, X.L.; Sun, M.J. Numerical investigation and experimental validation of motion and distribution of nonmetallic inclusions in argon protection electroslag remelting process. Metals 2018, 8, 392. [Google Scholar] [CrossRef] [Green Version]
Figure 1. Three-dimensional model and boundary conditions. (a) Submerged-entry nozzle and (b) continuous casting slab.
Metals 11 00374 g001
Figure 2. Motion of bubbles in continuous phases.
Metals 11 00374 g002
Figure 3. “Black line” defects of hot-rolled sheets of automobile steel with: (a) 1100 mm width, (b) 1650 mm width.
Metals 11 00374 g003
Figure 4. Morphology and compositions of “black lines” in hot-rolled sheets: (a) Position A in Figure 3a; (b) position B in Figure 3b.
Metals 11 00374 g004aMetals 11 00374 g004b
Figure 5. The slag entrapment ratio of slabs with different widths.
Metals 11 00374 g005
Figure 6. Schematic diagram for (a) the application of current sensor and (b) comparison of distance from mold top to the slag-metal interface through simulation and industrial measurements.
Metals 11 00374 g006
Figure 7. Transient flow of molten steel in slabs with different cross sections of (a) 1100 mm × 250 mm; (b) 1400 mm × 250 mm; (c) 1650 mm × 250 mm.
Metals 11 00374 g007
Figure 8. Velocity of slag–metal interfaces in molds with different cross sections of: (a) 1100 mm × 250 mm; (b) 1400 mm × 250 mm; (c) 1650 mm × 250 mm.
Metals 11 00374 g008
Figure 9. The distributions of (a) bubbles in mold and (b) velocity distribution in the slag–metal interface.
Metals 11 00374 g009
Figure 10. Impact depth and velocity of molten steel under different mold widths.
Metals 11 00374 g010
Figure 11. Average velocity fluctuations of slag–metal interface under different sections: (a) 1100 mm × 250 mm; (b) 1400 mm × 250 mm; (c) 1650 mm × 250 mm.
Metals 11 00374 g011
Figure 12. Horizontal shear velocity fluctuation of slag/metal interface under different cross sections: (a) 1100 mm × 250 mm; (b) 1400 mm × 250 mm; (c) 1650 mm × 250 mm.
Metals 11 00374 g012
Figure 13. Maximum velocity distribution of slag/metal interface under different cross sections of: (a) 1100 mm × 250 mm; (b) 1400 mm × 250 mm; (c) 1650 mm × 250 mm.
Metals 11 00374 g013
Figure 14. Monitoring of slag droplets in molds with different widths of (a) 1100 mm × 250 mm; (b) 1400 mm × 250 mm; (c) 1650 mm × 250 mm; (d) average value.
Metals 11 00374 g014
Figure 15. Prediction of slag severity through dimensionless value.
Metals 11 00374 g015
Table 1. Forces acting on argon bubbles.
Source TermFormulaAnnotations
Buoyancy force plus gravity force, F b + F g ( ρ p ρ m ) π d p 3 6 g The net effect acts on the difference between particle and fluid densities. The variable g is gravity acceleration, d p is particle diameter.
Drag force F d 1 8 π d p 2 ρ C D | u ¯ m u ¯ p | ( u ¯ m u ¯ p ) Where drag coefficient C D = 24 Re p ( 1 + 0.15 Re p 0.687 ) ,   Re p = | u ¯ m u ¯ p | d p u ¯ p ,and u ¯ p is particle velocity, Rep is particle Reynolds number.
Pressure gradient force F p ( ρ m / ρ p ) u ¯ p u ¯ m Pressure gradient force is significant when ρ / ρ p 0.1 .
Lift force F l 9 4 π μ ¯ m d p 2 U s sgn ( G ) [ | G | u ¯ p ] 1 / 2 J ( ε ) Where variable G = d u ¯ m d z , ε = sgn ( G ) | G | u p u ¯ m u p , l , U s = u ¯ m , l u ¯ p , l J ( ε ) = 0.6765 ( 1 + tanh ( 2.5 log 10 ε + 0.191 ) ) ( 0.667 + tanh ( 6 ε 1.92 ) ) u ¯ m , 1 is stream-wise liquid velocity.
Virtual mass force F v m C v m ρ p π   d p 3 12 ( d u ¯ m d t d u ¯ p d t ) Where the virtual mass force coefficient C v m = 0.5 .
Table 2. Basic model parameters.
ParametersData
Casting speed (m·min−1)1.10, 0.86, 0.73
Slab size/mm × mm1100 × 250, 1400 × 250, 1650 × 250
Argon blowing rate (L·min−1)49.2 (1800 K)
Submerged depth of nozzle (mm)166.5
Mold height (mm)900
Air layer thickness (mm)50
Thickness of slag layer (mm)40
Nozzle angle (°)15°, downward
Dynamic viscosity of molten steel, slag, and air (kg·m−1·s−1)0.0051, 0.39, 1.7894 × 10⁻⁵
Density of molten steel, slag, and argon (1809.15 K) (kg·m−3)7100, 3000, 0.266
Interfacial tension between slag and liquid metal (N·m−1)1.2
Interfacial tension between slag and air (N·m−1)0.31
Publisher’s Note: MDPI stays neutral with regard to jurisdictional claims in published maps and institutional affiliations.

