Article

GPU-Accelerated Cellular Automaton Model for Grain Growth during Directional Solidification of Nickel-Based Superalloy

State Key Laboratory of Material Processing and Die & Mould Technology, Huazhong University of Science and Technology, Wuhan 430074, China
*
Authors to whom correspondence should be addressed.
Metals 2021, 11(2), 298; https://doi.org/10.3390/met11020298
Submission received: 30 December 2020 / Revised: 4 February 2021 / Accepted: 4 February 2021 / Published: 9 February 2021
(This article belongs to the Section Metal Casting, Forming and Heat Treatment)

Abstract

:
To accelerate the large-scale cellular automaton (CA) simulation for grain growth, a parallel CA model for grain growth was developed. The model was implemented based on the compute unified device architecture (CUDA) parallel computing platform. The model was verified by the grain growth of a single crystal and the columnar-to-equiaxed transition (CET) of an Al-7wt% Si specimen of uniform undercooling with a constant cooling rate. The grid independence of the model was verified. The grain growth of a plate-like casting of nickel-based superalloy during directional solidification process was simulated and the obtained results of grain density at each section with different heights were compared with the experimental data. The CET transition of directional solidified Al-7wt% Si cylindrical ingot was simulated. The grain texture and cooling curves were in good agreement with experimental results from the literature. Finally, high parallel performance of the CA model was obtained and evaluated.

1. Introduction

Nickel-based superalloy has been widely used to produce blades which are used in aero engines and industrial gas turbines. To improve the high-temperature mechanical properties of blades, the directional solidification (DS) technique has been used to fabricate superalloy blades. The high-temperature performance of blades is closely related to the microstructure, grain size and crystallographic orientation. Therefore, the grain growth during solidification process has been widely investigated over the last two decades.
Many numerical models have been proposed to simulate the grain growth process during DS process. Models for grain growth during solidification process were originally investigated by Rappaz and Thévoz [1,2]. Then, the decentered cellular automaton (CA) algorithm was proposed by Gandin et al. [3] and it was widely accepted to predict the dendritic grain growth. Based on the analytical predictions of dendritic grain envelopes, the cellular automaton finite element (CAFE) model [4] was developed to predict grain structure, such as growth of equiaxed dendritic grains and columnar dendritic grains. Nastac et al. [5] proposed a stochastic modeling of microstructure formation to predict the grain structure in castings and the influences of various neighborhood configurations on nucleation and grain growth were evaluated. Wang et al. [6] proposed a modified decentered CA method to study the influence of perturbing the withdrawal velocity upon the stability of the primary dendrite spacing. Zhang et al. [7] developed a cellular automaton finite difference (CAFD) model to simulate the grain growth coupled with the temperature evolution of turbine blades during DS process. Then, Zhang et al. [8] investigated the grain growth and grain selection behavior in a spiral selector for nickel-based superalloy based on the developed CAFD model. Viardin et al. [9] developed a mesoscopic model for equiaxed and columnar dendritic growth and the solidification of Ti-45 at% Al with the effect of flow was simulated.
The CA model has been widely accepted to investigate the columnar-to-equiaxed transition (CET) during the grain growth process [10,11]. Dong et al. [12] simulated the CET during the directional solidification of Al-Cu alloys using a CAFD model. Satbhai et al. [13] studied the effect of interfacial heat transfer coefficient, superheat, and nucleation site density on the grain structure using a coupled finite-volume-method-cellular-automaton model, where the CET and the equiaxed-to-columnar transition (ECT) were predicted. Ahmadein et al. [14] analyzed the macrosegregation formation and the CET during solidification of Al-4wt% Cu ingot using a 5-phase model. Geng et al. [15] investigated the CET in full-penetration laser welding of thin 5083 aluminum sheet using a three-dimensional multi-physical numerical model. The CET in directional solidification of Inconel 718 alloy was investigated by Nabavizadeh et al. [16] and Lenart et al. [17] using a phase field-lattice Boltzmann (LB) model. A CET solidification map for Inconel 718 alloy was developed for different temperature gradients and growth rates in reference [16]. In addition, effect of magnetic field on the CET during solidification of superalloy and steel was investigated in References [18,19]. Effect of gravity on CET and columnar dendritic growth was studied in references [20,21].
Although the CA model has been widely used in the simulation of dendritic growth and grain structure prediction, the high requirement for computational resources still makes it a challenge for the grain growth simulation of an industrial casting when high prediction accuracy is needed. Therefore, a parallel computational model for CA method with high efficiency and scalability is necessary to accelerate the simulation.
Recently, several parallel computation methods have been implemented to the CA model. Jelinek et al. [22] developed a parallel two-dimensional LB-CA model for the simulation of dendrite growth under forced convection. The model was parallelized using the Message Passing Interface (MPI) technique and showed good scalability up to centimeter-size domains. Eshraghi et al. [23] proposed a parallel LB-CA model using the MPI with spatial domain decomposition. Columnar dendrite growth in a 1-mm3 region was simulated at a microscale. The scale-up performance on up to 4000 computing cores was evaluated. Kao et al. [24] developed a parallel CA model for convection-driven solidification. By conducting several simulations with the domain size varying from O (200 million to 1 billion) cells, the parallel efficiency is about 70% using MPI technique. Dobraveca et al. [25] developed a two-dimensional CA model using an adaptive mesh refinement which reduced the requirement for computational resources.
Although much progress has been made to accelerate the CA method, most of these studies are focused on the parallelization of CA model at the scale of dendritic growth. The progress on the parallelization of CA model at the scale of grain growth mainly comes from Gandin’s group [26,27]. The parallel computational method for the CA model at the mesoscopic scale, like the grain envelope, is much helpful to expedite the simulation of DS process of superalloy blades. For the widely used CAFE model, a dynamic allocation algorithm has been proposed by Gandin et al. [4] to save the memory size for computation. Then Gandin et al. [27] implemented direct modeling of structures and segregations during industrial casting processes and discussed the difficulties for applications of the 3D CAFE model in an industrial casting process. Carozzani et al. [26] further implemented an optimized parallel computation method for the CAFE model and discussed several algorithm modifications and strategies to maximize parallel efficiency. The MPI technique was utilized by Lian et al. [28] to accelerate the mesoscopic CA model for the grain growth during additive manufacturing and the scaling test indicated that the parallel efficiency can reach 80% for the simulation consisting of about half a billion cells.
Recently, GPU-based parallel computing technology has been widely accepted in dendrite growth simulation using phase field model, due to massive computation capacity and high memory bandwidth, where high efficiency and scalability were demonstrated [29,30,31].
In this work, a parallel algorithm was proposed for both 2D and 3D CA model of grain growth using the graphic processing unit (GPU). A mapping strategy between the CA cells and threads on GPU was illustrated. The parallel performance of the developed algorithm was evaluated by the comparison with the program parallelized with Open Multi-Processing (OpenMP) technique. Then, the CET of Al-7wt% Si specimen was simulated. The grain growth was simulated during DS process for a plate-like casting of nickel-based superalloy and the obtained results of grain density with different heights were compared with the experimental data. Finally, the parallel performance of the developed CA model was evaluated.

2. A Cellular Automaton Model

2.1. Nucleation Model and Grain Growth Algorithm

To simulate grain growth in superalloy solidification, a CA model [32] was adopted. A continuous nucleation model proposed by Rappaz and Gandin et al. [33] was used to describe the heterogeneous nucleation. The total nucleation density n ( Δ T ) is calculated as
n ( Δ T ) = n max 2 π Δ T σ 0 Δ T exp [ - 1 2 ( Δ T Δ T N Δ T σ ) 2 ] d ( Δ T )
where Δ T is the undercooling; n max is the maximum nucleation site density; Δ T σ is the standard deviation of undercooling; Δ T N is the mean nucleation undercooling. The relation between the tip growth velocity with the given undercooling is given by the polynomial formulation.
υ ( Δ T ) = a 2 Δ T 2 + a 3 Δ T 3
The kinetic coefficients a2 and a3 are fitted on the predictions of Kurz-Giovanola-Trivedi (KGT) model [34]. The CA model is restricted to the face center cubic (FCC) crystal. In Figure 1, three orthogonal axes, which are the half-diagonals of the octahedron represent the growth directions of the primary dendritic, which are labeled as the crystallographic directions ([100]/[010]/[001]). The orientation of the [100] direction with respect to the global coordinate ( X ,   Y ,   Z ) was characterized by a set of Euler angles ( ϕ 1 ,   ϕ 2 ,   ϕ 3 ) .
The growth of the dendrite tip follows the rule above. Then, the grain envelope is determined by the crystallographic orientation and the dendrite tip length. For 2D CA model, the envelope is square shape. The capture rule can be seen in Figure 2. The grain envelope associated with cell A (smaller blue square) grow large enough to cover the center of cell B, which means that cell B is captured and will become interface cell at the next time step. Moore neighborhoods of cell A were considered for cell capture. The extension of the capture rule to 3D is straightforward, which can be referred to [32].

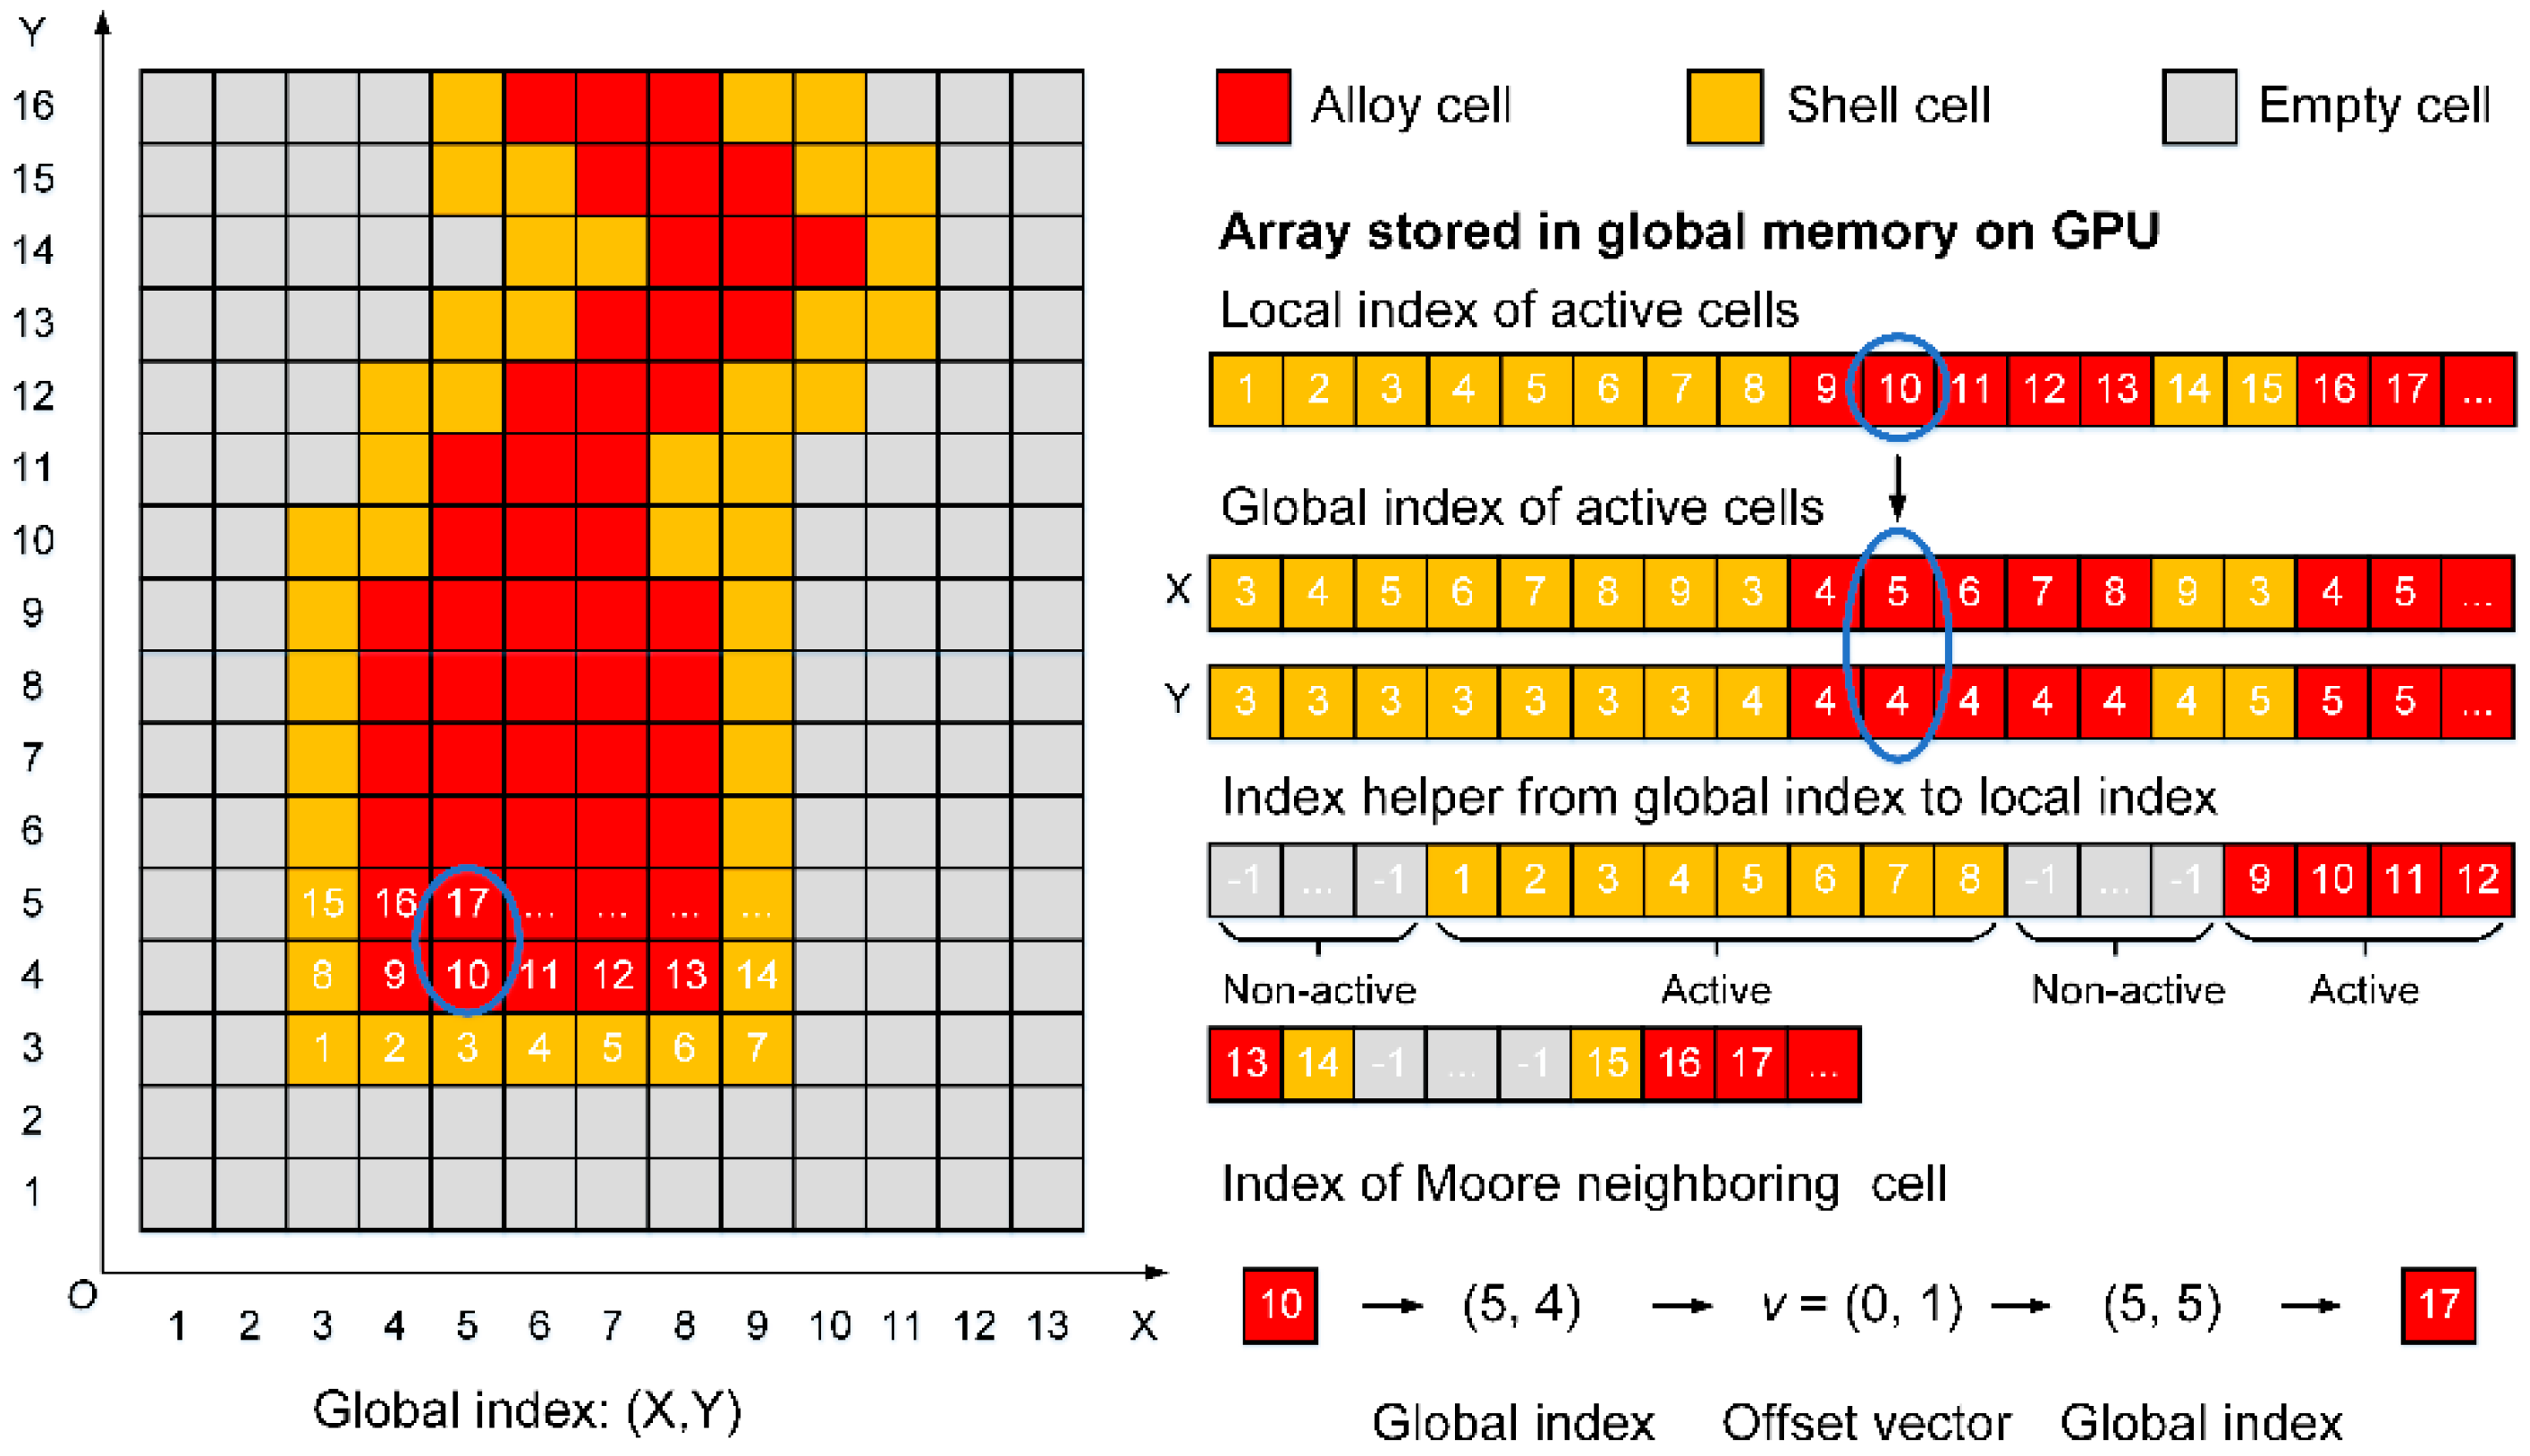
2.2. Algorithm Implementation on GPU

To accelerate the CA model, we developed a program based on the compute unified device architecture (CUDA) parallel computing platform using a GPU. GPU is more suitable for compute-intensive computation compared with CPU, because there are several thousand cores on a single GPU.
In our model, the finite difference method (FDM) was used to solve the temperature field with coarse grids and the CA model was used for grain growth calculation with fine grids. One FDM grid consists of several CA cells depending on the grid size ratio. Due to the locality of computation of both FDM and CA model, the calculation performed on each cell can be easily mapped to the thread on GPU. Considering only the domain designated as alloy attribute needs the memory used for CA model, the memory for computation of CA model was allocated for these areas. A global index array was used as the indicator of the neighboring configuration of each CA cell. Hence, memory requirement was reduced in the simulation of casting with complex shape. The memory arrangement of CA cells stored on GPU is shown in Figure 3. The memory is only allocated for active cells, which are alloy cells and shell cells. In CA model, the computation requires the index of Moore neighboring cells. In Figure 3, it shows the step to search the index of the neighboring cell at (0, 1) direction for the 10th active cell. Firstly, the global index (5, 4) was obtained by the global index of active cells. With the direction (0, 1) of the Moore neighboring cell, the global index of the neighboring cell is calculated as (5, 5). Then, the local index of neighboring cell can be obtained by the value of index helper in global index, as shown in the left side of Figure 3.
The subroutine for each module, such as grain nucleation, cell capture process, grain growth, is defined in the kernel function. These kernel functions, invoked by CPU, run by threads on GPU. The index of each thread is labeled by the built-in variables on GPU, which help to find the index of each cell. Therefore, data stored on each cell, such as temperature, cell status, are accessible to the kernel functions.
In CUDA programming, data can be stored in the global memory and the shared memory. The global memory is large, usually several gigabytes, while the shared memory, a low-latency memory near the processor core, is only 64 kilobytes for most GPU. The shared memory is expected to be much faster than the global memory. However, using the shared memory in a kernel function will increase the number of occupied registers, which reduces the number of cores that can be launched on GPU. The efficiency of the program is usually affected by the utilization of the shared memory. Therefore, only the global memory is used in the program. In addition, the constants such as the process parameters, and variables related to the index offset of Moore neighborhood’s configuration are stored in the constant memory, which is a low-latency memory with the size of 64 kilobytes for frequent access.
The implementation of the model on GPU is given as following. Firstly, the initialization of the CA model was performed on CPU, then the data for the CA model and FDM calculation were transferred to GPU. Each thread on GPU performs a group of computation based on the kernel function after the thread configuration was set. During the calculation process, the data of grain orientation and temperature were transferred from GPU to CPU with a given interval of time step. Since no other extra data transfer between CPU and GPU, the consumed time mainly comes from the iteration calculation and the computation efficiency was ensured by the locality of computation. Different time steps can be used for the calculation of temperature field and CA model to reduce the total iteration times.
The algorithm of the heat transfer and grain growth process can be briefly summarized as follows.
(1)
Heat transfer calculation on grids by FDM.
(2)
Temperature interpolation from FDM grids to CA cells.
(3)
Check nucleation of each liquid cell by the continuous nucleation model in Equation (1).
(4)
Grain growth by updating the dendrite tip length of each interface cell according to Equation (2).
(5)
Cell capture by searching the Moore neighborhoods of the interface cells following the rule shown in Figure 2.
(6)
Status transition of the interface cells and the corresponding captured liquid cells.

3. Model Verification

3.1. Single Grain Growth

The predictions of a single grain growth with a given orientation under different temperature gradients are shown in Figure 4. The corresponding Euler angle is (10°, 20°, 30°) and the growth kinetics is given by the dendrite tip growth velocity υ = A Δ T 2 , with A = 1.0 × 10 4   m s 1 K 2 .
In order to verify the accuracy of model, the tip growth velocity of the envelope was analyzed by comparison between the numerical results and the theoretical results.
The error caused by grid anisotropy is an expected defect of the CA model [35], which is associated with the corresponding transition rule of cell state and time step used in the numerical calculation. Hence, the error should be suppressed to ensure the accuracy of numerical calculation. The effects of orientation angle of the grain envelope and time step on the tip growth velocity were investigated in this section.
For simplicity, a two-dimensional case was performed. The computation domain is 300 × 300 with a cell size of 15 µm. A nucleation site was positioned in the center of the domain with a given orientation angle. A uniform undercooling of 3 K was kept during the whole simulation. The growth kinetics of Al-7 wt% Si alloy is given by the dendrite tip growth velocity υ = A Δ T n with n = 2.7 and A = 2.9 × 10 6 m s 1 K 2 . 7 [36]. In order to determine the time step with a given condition, a parameter λ is defined as λ = V m Δ t / Δ x , where Vm is the maximum tip growth velocity at the whole domain, Δt is the time step and Δx is the cell size. Cases with envelope orientation angles from 0° to 45° (due to the four-fold symmetry) with an interval of 5° and the parameter λ of 0.1, 0.01, and 0.001 were simulated. To ensure the same reference tip length of the envelope at the end time, the calculation was finished while the solid fraction of the growing envelope reaches 0.4 in the computation domain. The error of the tip length ε is defined as ε = | L c L t | / L t , where Lc is the tip length obtained by simulation, and Lt is the theoretical value. The error of tip length with different orientation angles and parameter λ is shown in Figure 5. The results indicated that the error of tip length decreases with the decrease of the time step (the parameter λ ) when orientation angle is small (less than 20° approximately). The error of tip length is small when the parameter λ is smaller than 0.01, which is an acceptable accuracy for grain growth simulation, as a single grain usually will not grow too large in a given thermal condition. The effect of orientation angle on the tip length is not large, which indicates that the developed CA model is applicable to the grain growth with arbitrary orientation angle.

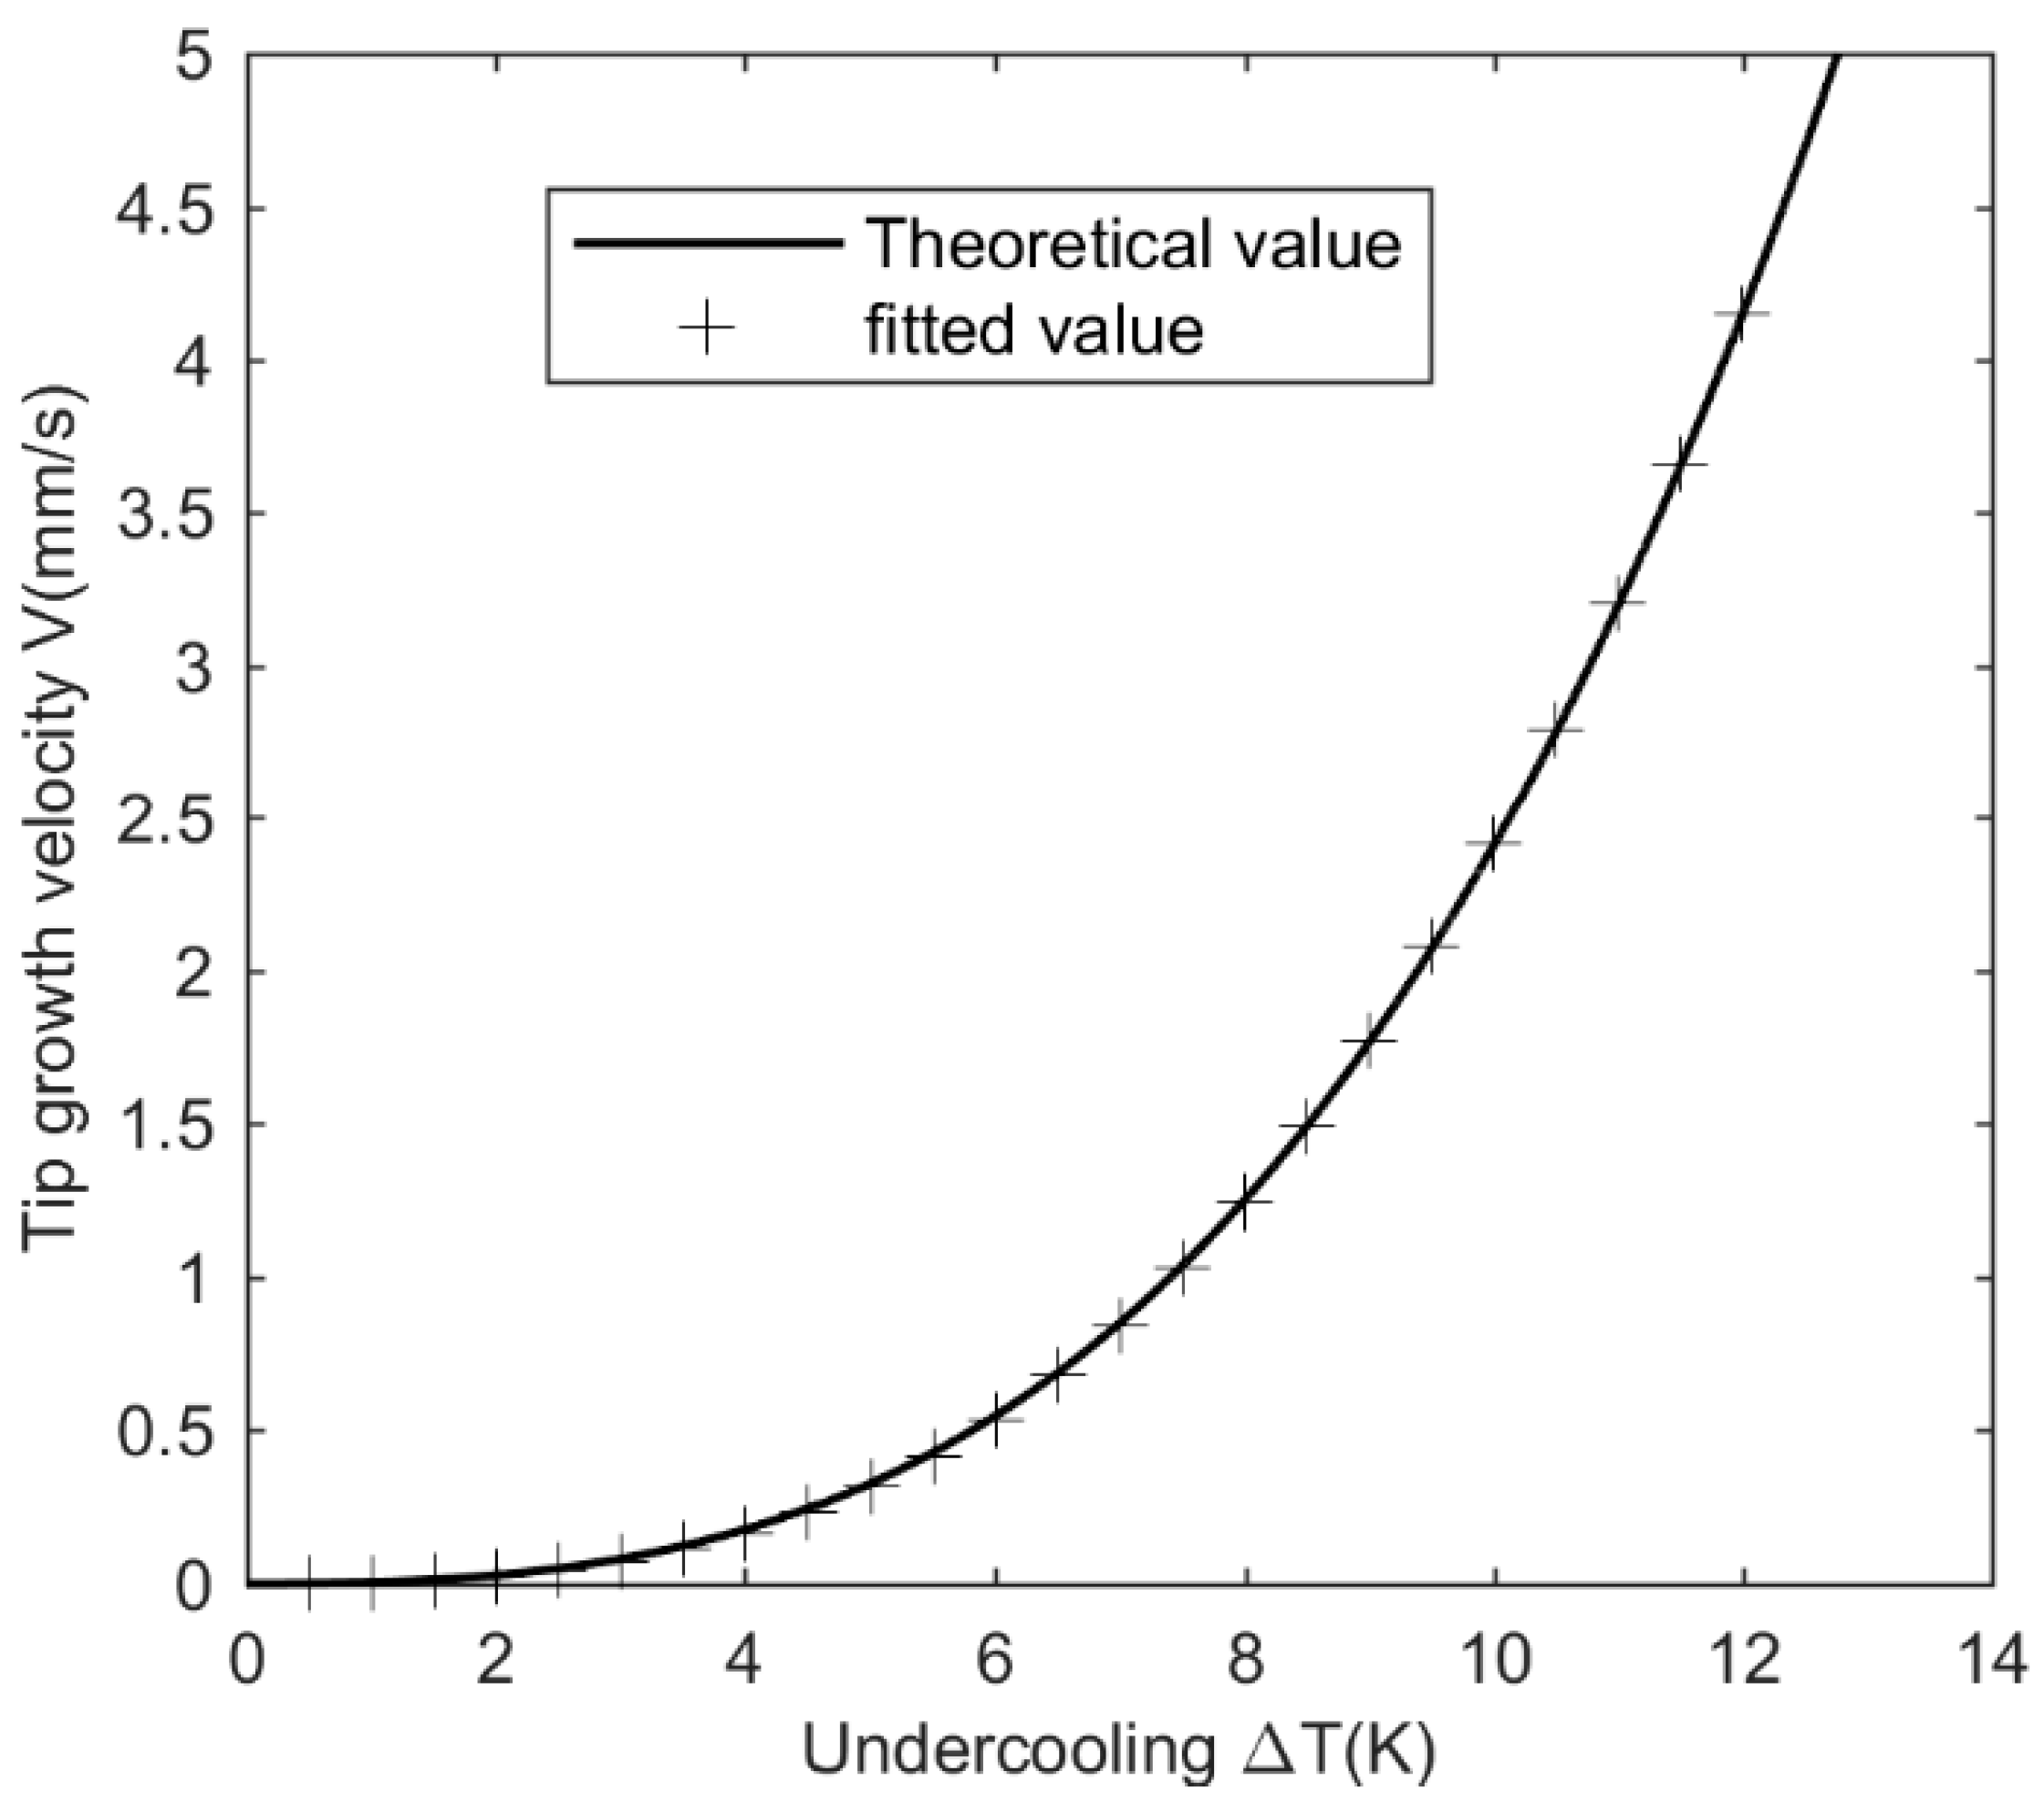
3.2. Grain Growth with a Uniform Undercooling

Then, the grain growth of Al-7 wt% Si specimen was simulated by 2D simulation. The computation domain is 300 × 300 with a cell size of 15 µm. The simulation started with a uniform undercooling and the cooling rate was −2.3 K/s. The growth kinetics of the alloy is the same as that of aforementioned parameters. The cell size is 15 µm, which is suitable for the description of dendrite growth. The volumetric nucleation site density nv is 5.5 × 10¹⁰ m−3 and the surface nucleation site density ns is 2.5 × 10⁸ m−2. The corresponding parameters used in 2D simulation can be obtained by the stereological relationships in the Reference [33]. The standard deviations of volumetric nucleation undercooling Δ T s , σ and surface nucleation undercooling Δ T v , σ are both 0.1 K. The mean surface nucleation undercooling Δ T s , m is 0.5 K. Cases with different mean volumetric nucleation undercooling Δ T v , m were simulated. The CA model is used to describe the final grain structure or the grain texture after solidification, hence only the primary FCC aluminum dendrite is considered in the model. The formation of diamond silicon facet phase is not considered in the CA model. The grain structures after the whole domain solidified are shown in Figure 6. Grains with crystallographic orientation aligned with the normal to mold surface were selected corresponding to the grains with orientation angle close to 0° and 90°. The columnar grains formed at the mold surface grow up to the center of the specimen as shown in Figure 6a. As the mean volumetric nucleation undercooling decreases, equiaxed grains nucleated before the columnar grains grow up to the center domain as shown in Figure 6b,c. The CET occurs as the mean volumetric nucleation undercooling becomes small.
To verify the grid independence of the CA model, a domain with a size of 24 × 24 mm2 was used for simulation. The mean volumetric nucleation undercooling was 4 K to ensure large ratio of equiaxed grains’ nucleation. The cell size of 15 µm, 20 µm and 25 µm were selected. Other parameters are the same as the aforementioned condition. The grain area size distribution of each case is shown in Figure 7a. The cumulative grain area size distribution of each case is shown in Figure 7b for comparison. In Figure 7a, results of the three cases show that the grain area size mainly ranges from 0.2 × 105 µm2 to 1.0 × 105 µm2. The cumulative grain size distributions of the cases were consistent with each other and Figure 7b clearly shows that the grain size distributions of cases with cell size of 15 µm and 20 µm are almost the same.

4. Simulation and Discussion

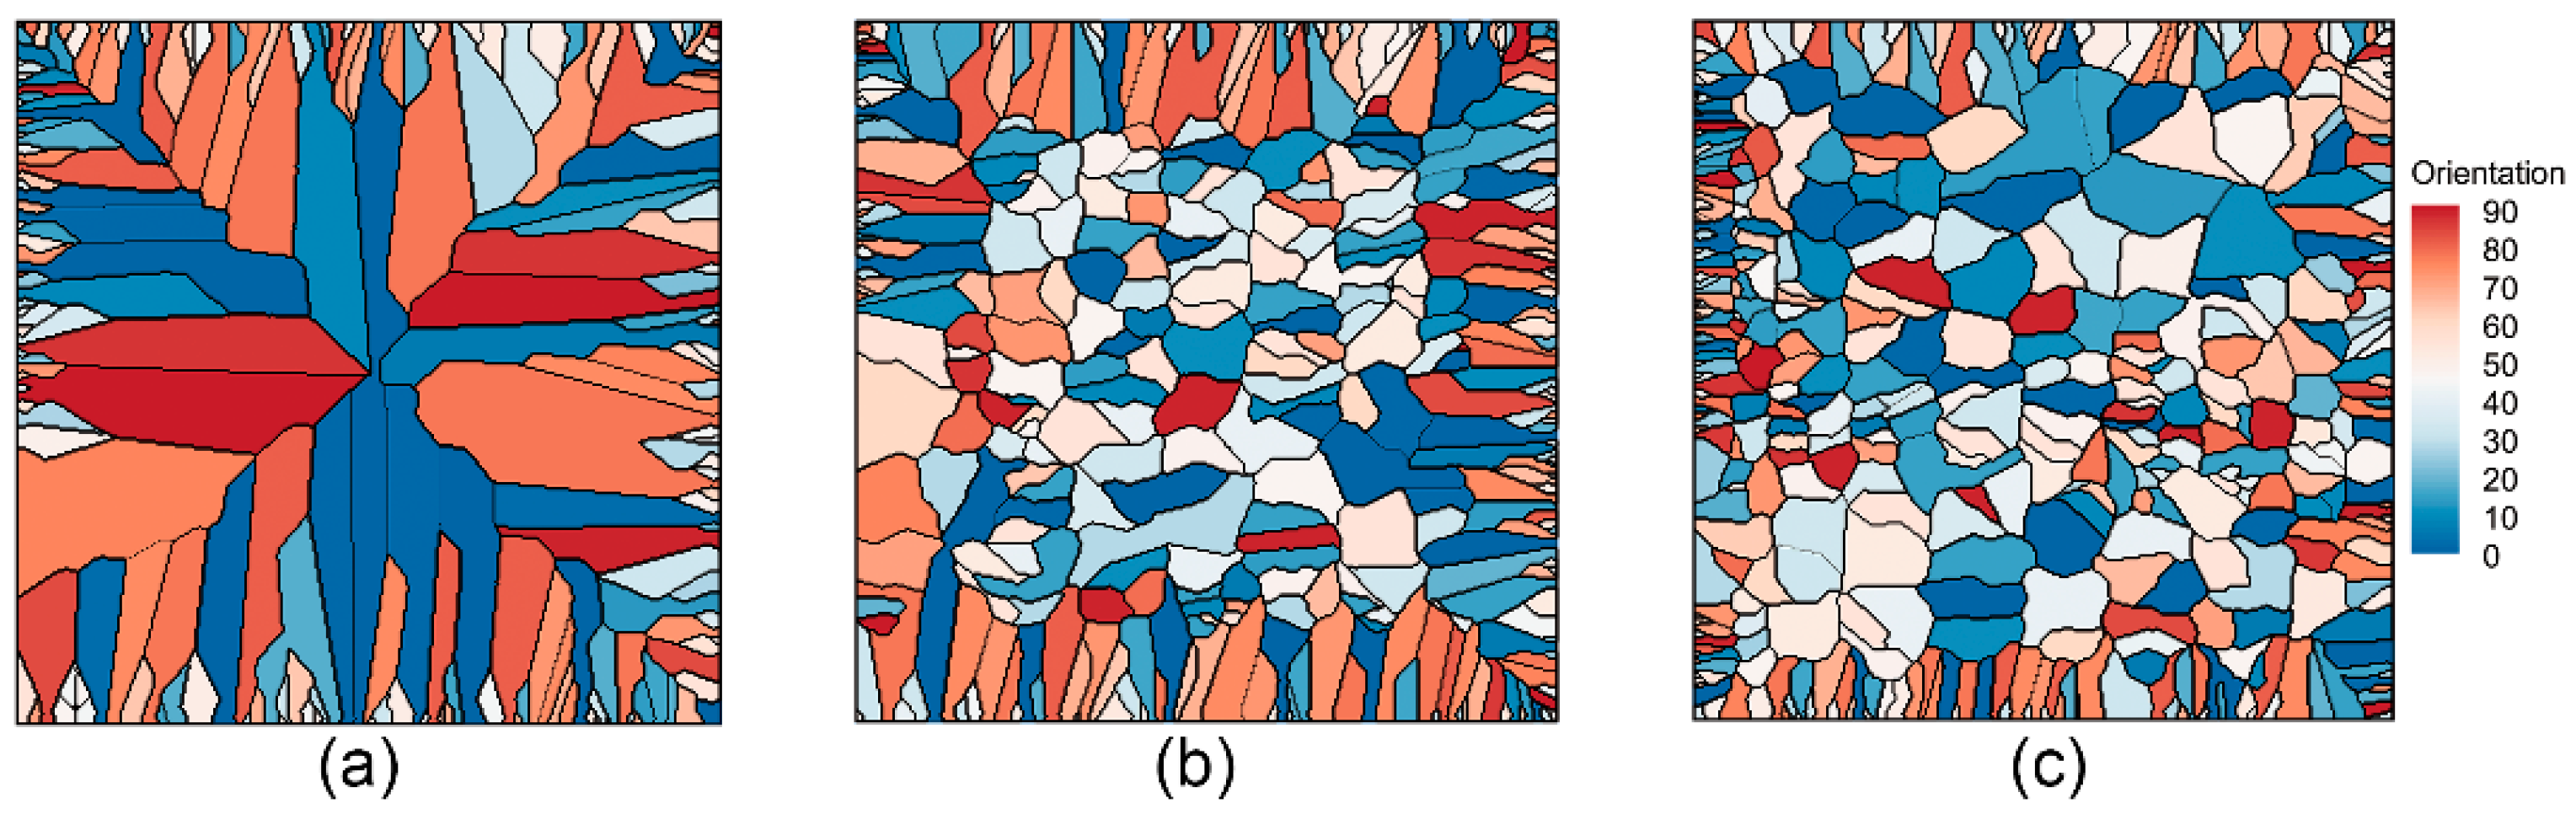
4.1. Grain Growth during Directional Solidification

The model was applied to simulate grain growth of a plate-like casting of nickel-based superalloy during DS process. The directional solidification experiment of the plate-like casting was carried out in the ALD furnace with a withdraw rate of 6 mm/min. A plate-like casting with dimension of 25 × 7 × 160 mm was used. The chemical composition of the superalloy is Ni-7.82Cr-5.34Co-2.25Mo-4.88W-6.02Al-1.94Ti-3.49Ta (wt%). A multicomponent pseudo-binary alloy method [37] was used to obtain the physical parameters of this superalloy. Then, the coefficients of growth kinetics were fitted by the results according to the Lipton-Glicksman-Kurz (LGK) growth model [34,38], as shown in Figure 8. The values of a2 and a3 are 9.478 × 10⁻⁷ m s−1 K−2 and 2.323 × 10⁻⁶ m s−1 K−3.
The grid size for the temperature field calculation was 0.5 mm. In the CA model, the cell size was 250 µm. To satisfy the numerical stability, the time step Δt was determined as
Δ t = min ( ρ C p ( Δ x T ) 2 6 k , ( Δ x C A ) 2 6 D l , λ Δ x C A V m )
where ρ is alloy density, C p is the specific heat, Δ x T is the grid size used for the temperature field, k is the thermal conductivity, D l is the liquid diffusion coefficient, Δ x C A is the grid size used for CA model and V m is the maximum speed of grain growth. The parameter λ is set as 0.01 to ensure acceptable accuracy.
The grain structure of the specimen and grain structure at each section with different heights are shown in Figure 9a,b. Grain density decreases as the height increases due to the competitive growth as indicated in Figure 9b. The grain density obtained by simulation was compared with the experimental data and the simulation results were in good agreement with the experimental data as shown in Figure 9c.

4.2. Grain Growth in Directional Solidified Al-7 wt% Si Ingot

The developed CA model was applied to the solidification process of an Al-7 wt% Si cylindrical ingot which has a detailed description in [36] and [39]. Both 2D and 3D simulation were conducted to demonstrate the capability of the model. The size of the ingot was ϕ 70 × 170 mm. The bottom of the ingot was cooled by a copper chill. The other face was adiabatic boundary condition. Temperature curves of the points at the center line with the height of 20, 40, 600, 80, 100, 120 and 140 mm were recorded by the corresponding thermal couples. Temperature at the bottom of the ingot was deduced by the extrapolation of the temperature curves of the 20, 40, 60 and 80 mm thermal couples, which was imposed as the boundary condition of the bottom surface as indicated in literature [40]. The detailed parameters used in simulation can be found in [36]. The cell size was 100 µm and the grid size for the temperature field was 0.5 mm for 2D simulation. In the 3D simulation, a cell size of 250 µm and a grid size of 1.0 mm for the temperature field were used due to memory restriction of the GPU. A good agreement was observed between the grain texture from experiment [39] and 2D simulation as shown in Figure 10. The simulated temperature curves were compared with the experimental data; the temperature curves obtained by simulation were consistent with the experimental data except a little deviation during the mushy zone as shown in Figure 11. As the release of latent heat for eutectic reaction is not considered in the current model, the difference of the temperature curve is acceptable. The columnar grains grow from the bottom to the height of 110 mm and then the equiaxed grains formed on the top zone of the ingot. The height where the CET transition happens is consistent with the experimental grain texture. Similar 3D simulation results at different times are shown in Figure 12.

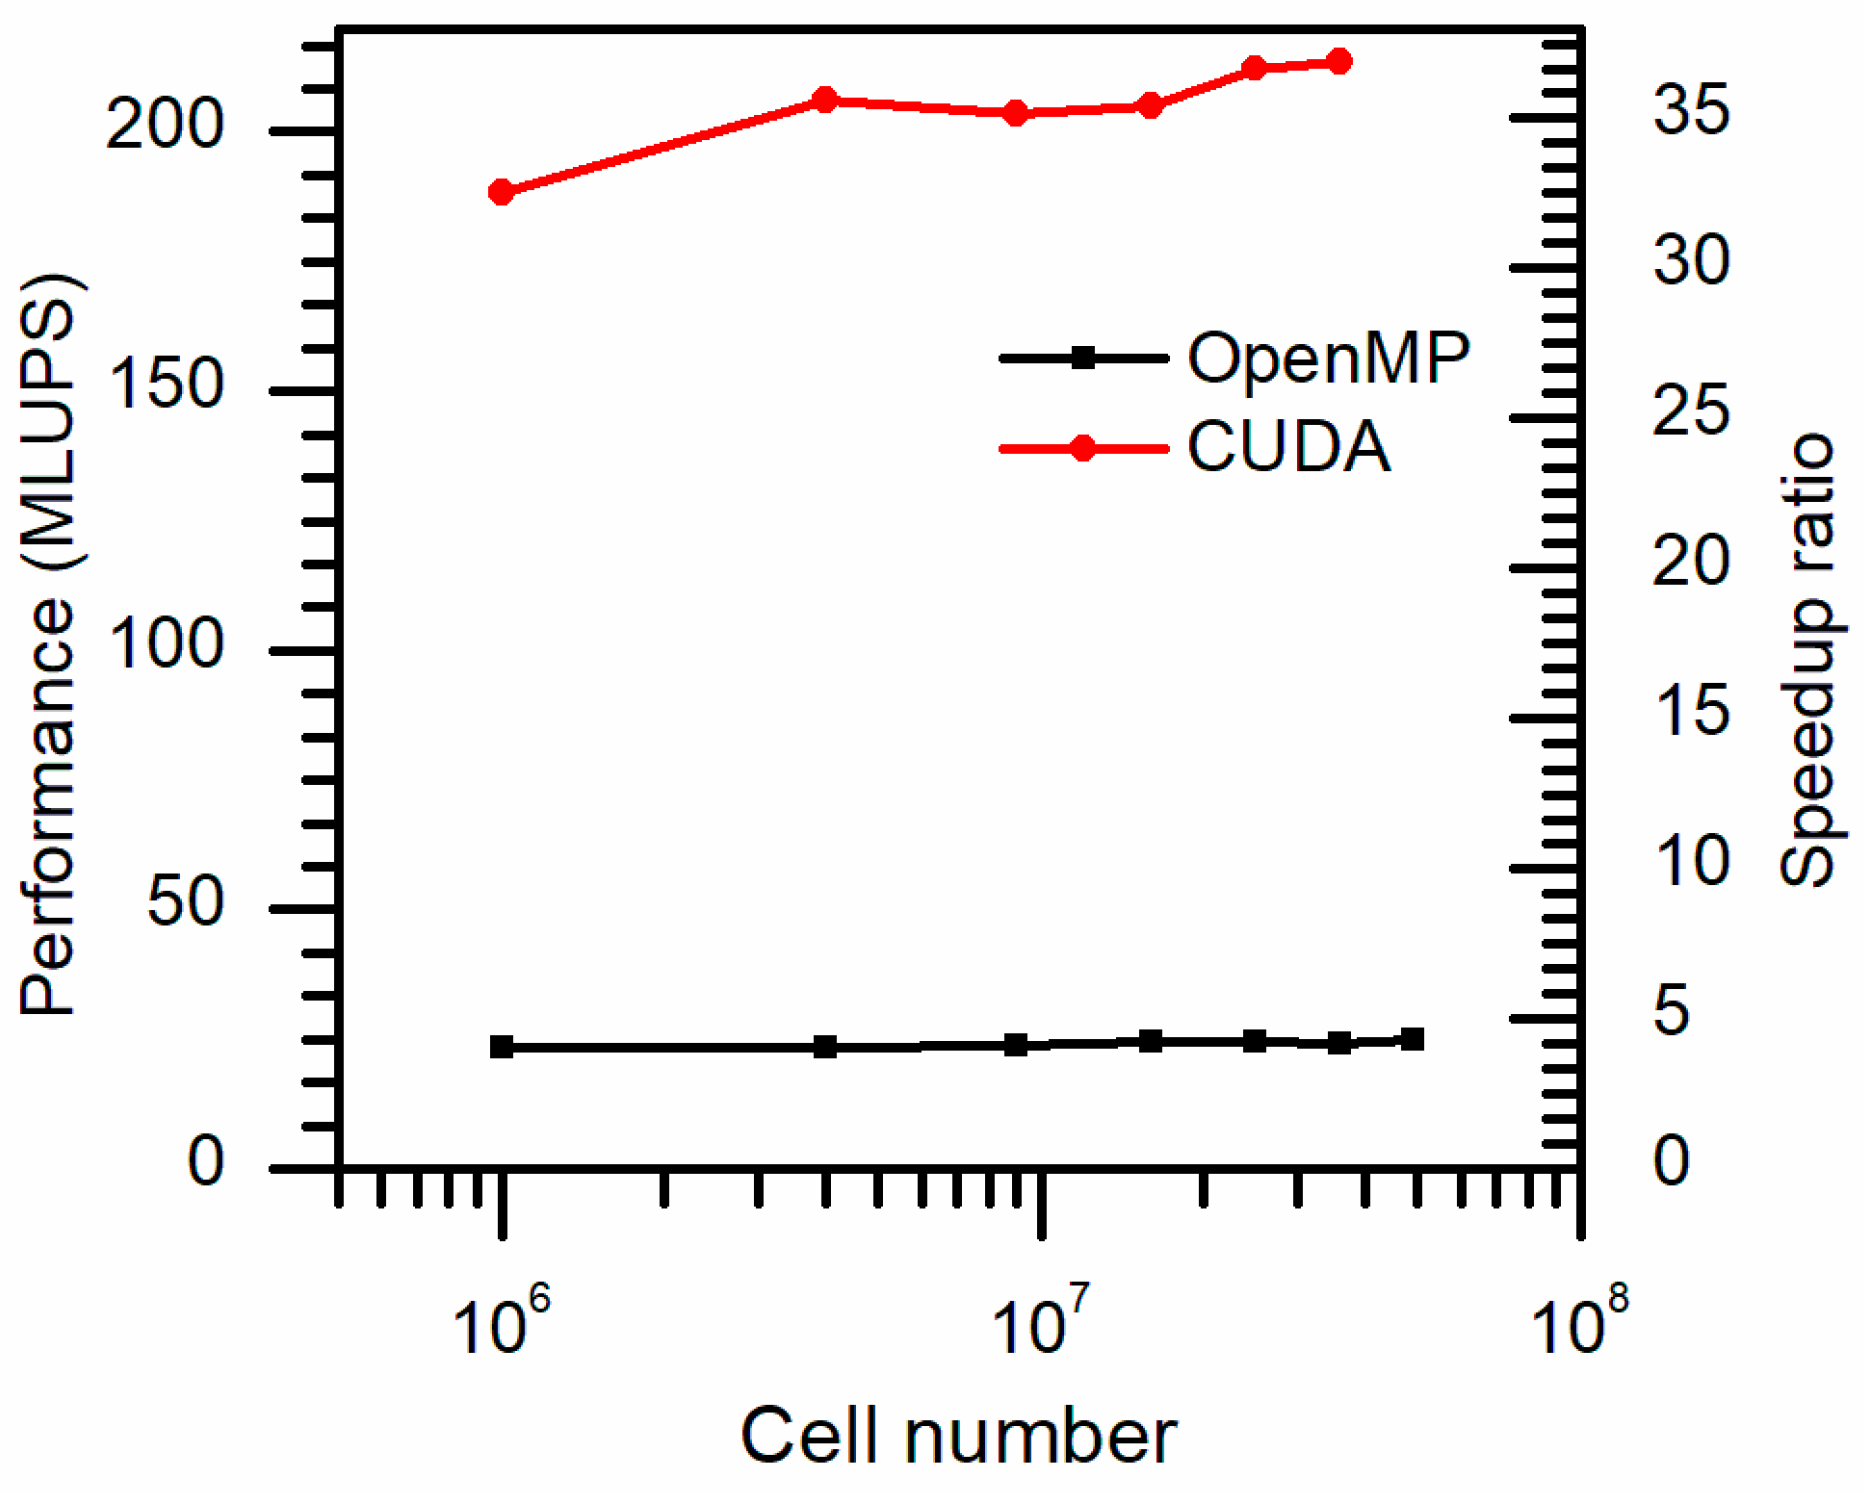
4.3. Parallel Performance Evaluation

The parallel performance was evaluated in detail by 2D CA model, where the grain growth of Al-7 wt% Si specimen with imposed temperature field of constant cooling rate was simulated. The million lattice unit per second (MLUPS) was adopted to evaluate both CPU- and GPU-based computing performance. The parallelization on CPU-based calculation was implemented with the Open Multi-Processing (OpenMP) technique. The parallelization method on GPU was CUDA. The tested CPU was Intel Core i7-7700 (3.6 GHz, Intel Corporation, Santa Clara, CA, USA) with eight cores, and a single NVIDIA RTX 2070 GPU (NVIDIA Corporation, Santa Clara, CA, USA) and 8 gigabyte memory was used for testing. The speedup ratio was computed based on the reference of a serial CPU code on the same CPU. The cell number for performance evaluation ranges from 1.0 × 10⁶ to 4.9 × 10⁷ and the largest cell number tested in GPU-based parallelization is limited to 3.6 × 10⁷ due to the memory restriction of the used GPU. The parallel performance and speedup ratio are shown in Figure 13. The CPU-based parallelization shows approximately 4 times speedup ratio compared with the use of a single CPU core. The maximum parallel performance of the GPU-based parallelization reaches 213.45 MLUPS and the corresponding speedup ratio is 37, approximately. The maximum speedup ratio obtained on a single GPU card is higher compared with the performance of Lian’s work [28], where a maximum speedup ratio of 29.3 was obtained using 64 CPU processors with an efficiency of 45.85%. In MPI-based parallelization models, the efficiency of each processor usually decreases as the process number increases, due to the difficulty in load balance and the cost of communication between processors. These restrictions were avoided by the computation based on GPU, where the global memory in GPU card was continuous. By utilizing the GPU card with larger memory, large-scale simulation can be performed based on the proposed model. The GPU-based CA model shows high speedup ratio and stable performance over a wide range of cell number compared with the CPU-based parallelization. In addition, the performance does not decrease significantly as the cell number increases due to the computational locality of the CA model.

5. Conclusions

In this work, a GPU-based parallel CA model for grain growth was developed to accelerate the grain growth simulation. The accuracy of the developed model was verified by detailed comparison of the grain texture, grain size distribution and the CET phenomenon during grain growth for both 2D and 3D simulation. The testing demonstrated that a maximum performance of 213.45 MLUPS and a speedup ratio of 37 can be obtained by utilization of a single GPU. The proposed GPU-based parallelization of the CA model can be extended to CA model for dendritic growth.

Author Contributions

Conceptualization, J.Z. and Y.Y.; methodology, X.S. and X.J.; software, Y.Z.; writing—original draft, Y.Z.; writing—review and editing, T.A.S. All authors have read and agreed to the published version of the manuscript.

Funding

This research was funded by the National Natural Science Foundation of China, grant number 51775205.

Data Availability Statement

Not applicable.

Conflicts of Interest

The authors declare no conflict of interest.

References

  1. Rappaz, M. Modelling of microstructure formation in solidification processes. Int. Mater. Rev. 1989, 34, 93–124. [Google Scholar] [CrossRef]
  2. Thévoz, P.; Desbiolles, J.L.; Rappaz, M. Modeling of equiaxed microstructure formation in casting. Metall. Mater. Trans. A 1989, 20, 311. [Google Scholar] [CrossRef]
  3. Gandin, C.A.; Rappaz, M. A 3D cellular automaton algorithm for the prediction of dendritic grain growth. Acta Mater. 1997, 45, 2187. [Google Scholar] [CrossRef]
  4. Gandin, C.A.; Desbiolles, J.L.; Rappaz, M.; Thevoz, P. A three-dimensional cellular automation-finite element model for the prediction of solidification grain structures. Metall. Mater. Trans. A 1999, 30, 3153. [Google Scholar] [CrossRef]
  5. Nastac, L.; Stefanescu, D.M. Stochastic modelling of microstructure formation in solidification processes. Model. Simul. Mater. Sci. 1997, 5, 391. [Google Scholar] [CrossRef]
  6. Wang, W.; Lee, P.D.; McLean, M. A model of solidification microstructures in nickel-based superalloys: Predicting primary dendrite spacing selection. Acta Mater. 2003, 51, 2971. [Google Scholar] [CrossRef]
  7. Zhang, H.; Xu, Q.; Tang, N.; Pan, D.; Liu, B. Numerical simulation of microstructure evolution during directional solidification process in directional solidified (DS) turbine blades. Sci. China Technol. Sci. 2011, 54, 3191. [Google Scholar] [CrossRef]
  8. Zhang, H.; Xu, Q. Simulation and experimental studies on grain selection and structure design of the spiral selector for casting single crystal Ni-based superalloy. Materials 2017, 10, 1236. [Google Scholar] [CrossRef] [Green Version]
  9. Viardin, A.; Souhar, Y.; Fernández, M.C.; Apel, M.; Založnik, M. Mesoscopic modeling of equiaxed and columnar solidification microstructures under forced flow and buoyancy-driven flow in hypergravity: Envelope versus phase-field model. Acta Mater. 2020, 199, 680. [Google Scholar] [CrossRef]
  10. Spittle, J.A. Columnar to equiaxed grain transition in as solidified alloys. Int. Mater. Rev. 2006, 51, 247. [Google Scholar] [CrossRef]
  11. Kurz, W.; Rappaz, M.; Trivedi, R. Progress in modelling solidification microstructures in metals and alloys. Part II: Dendrites from 2001 to 2018. Int. Mater. Rev. 2020, 66, 30. [Google Scholar] [CrossRef]
  12. Dong, H.B.; Lee, P.D. Simulation of the columnar-to-equiaxed transition in directionally solidified Al–Cu alloys. Acta Mater. 2005, 53, 659. [Google Scholar] [CrossRef]
  13. Satbhai, O.; Roy, S.; Ghosh, S. A parametric multi-scale.; multiphysics numerical investigation in a casting process for Al-Si alloy and a macroscopic approach for prediction of ECT and CET events. Appl. Therm. Eng. 2017, 113, 386. [Google Scholar] [CrossRef]
  14. Ahmadein, M.; Wu, M.; Ludwig, A. Analysis of macrosegregation formation and columnar-to-equiaxed transition during solidification of Al-4wt.%Cu ingot using a 5-phase model. J. Cryst. Growth 2015, 417, 65. [Google Scholar] [CrossRef] [PubMed] [Green Version]
  15. Geng, S.; Jiang, P.; Shao, X.; Guo, L.; Gao, X. Heat transfer and fluid flow and their effects on the solidification microstructure in full-penetration laser welding of aluminum sheet. J. Mater. Sci. Technol. 2020, 46, 50. [Google Scholar] [CrossRef]
  16. Nabavizadeh, S.A.; Eshraghi, M.; Felicelli, S.D. Three-dimensional phase field modeling of columnar to equiaxed transition in directional solidification of Inconel 718 alloy. J. Cryst. Growth 2020, 549, 125879. [Google Scholar] [CrossRef]
  17. Lenart, R.; Eshraghi, M. Modeling columnar to equiaxed transition in directional solidification of Inconel 718 alloy. Comput. Mater. Sci. 2020, 172, 109374. [Google Scholar] [CrossRef]
  18. Zhang, K.; Li, Y.; Yang, Y. Influence of the low voltage pulsed magnetic field on the columnar-to-equiaxed transition during directional solidification of superalloy K4169. J. Mater. Sci. Technol. 2020, 48, 9. [Google Scholar] [CrossRef]
  19. Hou, Y.; Ren, Z.; Zhang, Z.; Ren, X. Columnar to equiaxed transition during directionally solidifying GCr18Mo steel affected by thermoelectric magnetic force under an axial static magnetic field. ISIJ Int. 2019, 59, 60. [Google Scholar] [CrossRef]
  20. Li, Y.Z.; Mangelinck-Noël, N.; Zimmermann, G.; Sturz, L.; Nguyen-Thi, H. Comparative study of directional solidification of Al-7wt% Si alloys in Space and on Earth: Effects of gravity on dendrite growth and Columnar-to-equiaxed transition. J. Cryst. Growth 2019, 513, 20. [Google Scholar] [CrossRef]
  21. Zimmermann, G.; Hamacher, M.; Sturz, L. Effect of zero.; normal and hyper-gravity on columnar dendritic solidification and the columnar-to-equiaxed transition in Neopentylglycol-(D)Camphor alloy. J. Cryst. Growth 2019, 512, 47. [Google Scholar] [CrossRef]
  22. Jelinek, B.; Eshraghi, M.; Felicelli, S.; Peters, J.F. Large-scale parallel lattice Boltzmann–cellular automaton model of two-dimensional dendritic growth. Comput. Phys. Commun. 2014, 185, 939. [Google Scholar] [CrossRef]
  23. Eshraghi, M.; Jelinek, B.; Felicelli, S.D. Large-scale three-dimensional simulation of dendritic solidification using lattice Boltzmann method. Jom 2015, 67, 1786. [Google Scholar] [CrossRef]
  24. Kao, A.; Krastins, I.; Alexandrakis, M.; Shevchenko, N.; Eckert, S.; Pericleous, K. A parallel cellular automata lattice Boltzmann method for convection-driven solidification. Jom 2019, 71, 48. [Google Scholar] [CrossRef] [Green Version]
  25. Dobravec, T.; Mavrič, B.; Šarler, B. A cellular automaton-finite volume method for the simulation of dendritic and eutectic growth in binary alloys using an adaptive mesh refinement. J. Comput. Phys. 2017, 349, 351. [Google Scholar] [CrossRef]
  26. Carozzani, T.; Gandin, C.; Digonnet, H. Optimized parallel computing for cellular automaton-finite element modeling of solidification grain structures. Model. Simul. Mater. Sci. 2014, 22, 15012. [Google Scholar] [CrossRef]
  27. Gandin, C.A.; Carozzani, T.; Digonnet, H.; Chen, S.; Guillemot, G. Direct modeling of structures and segregations up to industrial casting scales. Jom 2013, 65, 1122. [Google Scholar] [CrossRef]
  28. Lian, Y.; Lin, S.; Yan, W.; Liu, W.K.; Wagner, G.J. A parallelized three-dimensional cellular automaton model for grain growth during additive manufacturing. Comput. Mech. 2018, 61, 543. [Google Scholar] [CrossRef]
  29. Sakane, S.; Takaki, T.; Rojas, R.; Ohno, M.; Shibuta, Y.; Shimokawabe, T.; Aoki, T. Multi-GPUs parallel computation of dendrite growth in forced convection using the phase-field-lattice Boltzmann model. J. Cryst. Growth 2017, 474, 154. [Google Scholar] [CrossRef]
  30. Yang, C.; Xu, Q.; Liu, B. GPU-accelerated three-dimensional phase-field simulation of dendrite growth in a nickel-based superalloy. Comput. Mater. Sci. 2017, 136, 133. [Google Scholar] [CrossRef]
  31. Sun, W.; Yan, R.; Zhang, Y.; Dong, H.; Jing, T. GPU-accelerated three-dimensional large-scale simulation of dendrite growth for Ti6Al4V alloy based on multi-component phase-field model. Comput. Mater. Sci. 2019, 160, 149. [Google Scholar] [CrossRef]
  32. Guo, Z.; Zhou, J.; Yin, Y.; Shen, X.; Ji, X. Numerical simulation of three-dimensional mesoscopic grain evolution: Model development, vlidation, and application to nickel-based superalloys. Metals 2019, 9, 57. [Google Scholar] [CrossRef] [Green Version]
  33. Rappaz, M.; Gandin, C.A. Probabilistic modelling of microstructure formation in solidification processes. Acta Metall. Mater. 1993, 41, 345. [Google Scholar] [CrossRef]
  34. Kurz, W.; Giovanola, B.; Trivedi, R. Theory of microstructural development during rapid solidification. Acta Metall. 1986, 34, 823. [Google Scholar] [CrossRef]
  35. Marek, M. Grid anisotropy reduction for simulation of growth processes with cellular automaton. Phys. D Nonlinear Phenom. 2013, 253, 73. [Google Scholar] [CrossRef]
  36. Gandin, C.A. From constrained to unconstrained growth during directional solidification. Acta Mater. 2000, 48, 2483. [Google Scholar] [CrossRef]
  37. Raghavan, S.; Singh, G.; Sondhi, S.; Srikanth, S. Construction of a pseudo-binary phase diagram for multi-component Ni-base superalloys. Calphad 2012, 38, 85. [Google Scholar] [CrossRef]
  38. Lipton, J.; Glicksman, M.E.; Kurz, W. Dendritic growth into undercooled alloy metals. Mater. Sci. Eng. 1984, 65, 57. [Google Scholar] [CrossRef]
  39. Gandin, C.A. Experimental study of the transition from constrained to unconstrained growth during directional solidification. ISIJ Int. 2000, 40, 971. [Google Scholar] [CrossRef] [Green Version]
  40. Carozzani, T.; Digonnet, H.; Gandin, C. 3D CAFE modeling of grain structures: Application to primary dendritic and secondary eutectic solidification. Model. Simul. Mater. Sci. 2012, 20, 15010. [Google Scholar] [CrossRef]
Figure 1. Octahedral grain envelope.
Metals 11 00298 g001
Figure 2. Schematic diagram of the capture rule in a time step calculation; cell B was captured by the envelope (the red square) of cell A at the time step.
Metals 11 00298 g002
Figure 3. Memory arrangement of CA cells stored on GPU (graphic processing unit).
Metals 11 00298 g003
Figure 4. Numerical predictions of a single grain envelope 7 s after nucleation with an initial undercooling of 2 K and a constant cooling rate of −0.1 K/s. The temperature gradients are 0 K/m for case (a) and 250 K/m for case (b), respectively. The arrow indicates the direction of the temperature gradient vector G.
Metals 11 00298 g004
Figure 5. (a) Grain shape with orientation angle of 0°, 15°, 30° and 45°; the radius of the red circle is the theoretical tip length; (b) Error of tip length with different orientation angles and parameter λ.
Metals 11 00298 g005
Figure 6. Grain structure of the Al-7 wt% Si specimen with the mean volumetric nucleation undercooling of (a) 10 K; (b) 8 K; (c) 6 K.
Metals 11 00298 g006
Figure 7. Grain area size distribution (a) and the cumulative grain area size distribution (b) with different cell size.
Metals 11 00298 g007
Figure 8. Dendrite tip growth velocity as a function of the undercooling.
Metals 11 00298 g008
Figure 9. (a) Grain structure of the specimen; (b) Grain structure at each section with different heights, starting from bottom with an interval of 10 mm; the height of the section is shown in the left side of each section; (c) Simulated and experimental grain density with different heights.
Metals 11 00298 g009
Figure 10. Comparison of grain texture: (a) Experiment; (b) Simulation.
Metals 11 00298 g010
Figure 11. Experiment curves versus predicted cooling curves at labeled distances started from the bottom of the Al-7wt%Si ingot.
Metals 11 00298 g011
Figure 12. Grain structure in 3D simulation at different times: (a) 250 s; (b) 400 s; (c) 800 s; (d) 1000 s; (e) 1200 s.
Metals 11 00298 g012
Figure 13. Performance and speedup ratio of the CPU-based and GPU-based parallel simulation compared with the use of a single CPU core.
Metals 11 00298 g013
Publisher’s Note: MDPI stays neutral with regard to jurisdictional claims in published maps and institutional affiliations.

