Abstract
The Hollomon-Jaffe parameter is usually used to stablish a equivalence between time and temperature in a tempering treatment, but not to predict the harness of the alloy after the treatment. In this paper this last possibility has been studied. A group of cast iron samples was annealed and cooled at different rates in order to obtain samples with three different hardness values. These samples were tempered using different times and temperatures. The Hollomon-Jaffe parameter was calculated for each case and a relationship based on a logistic function between that parameter and the final hardness was stablished. This relationship was found to depend on the initial hardness and the lowest hardness achievable.
1. Introduction
The heat treatment known as tempering, which consists in heating the hardened material to a temperature below the lower critical temperature, is a common procedure carried out after quenching in order to improve toughness and ductility of an iron alloy with martensitic microstructure, including welds [1,2,3] and the newest generations of steels [4,5]. Although the cost is a hardness reduction, the benefits clearly outweigh the inconveniences as the material properties are adapted to the in-service demands. Furthermore, the combination of a quenching and tempering treatment is technically a lot easier to perform than a quenching where the cooling rate must be accurately controlled or a certain temperature must be maintained during a certain period of time (e.g., austempering).
The two main parameters of the process are the temperature and the time the material is held at that temperature, being those two parameters complementary and interchangeable. This means a lower temperature can be compensated by a longer soaking time and a higher temperature should be accompanied by a lower soaking time if the same hardness reduction is to be obtained. Several equations have been proposed as a means to study the combined effect of time and temperature and other variables [6,7,8], although the most known and used worldwide is the Hollomon-Jaffe equation [9], which is expressed as:
where is the Hollomon-Jaffe parameter (also known as the Larson-Miller [10] or the tempering parameter), T is the temperature in kelvin, t is the soaking time in hours and C is a constant. This equation was derived from the known Arrhenius equation [11], which in turn is the simplest form of the Van’t Hoff equation [12,13]. The importance of Equation (1) lies in the fact that there is a relationship between the value of and the decrease in hardness, which, in turn, relates to the mechanical properties of the material.
The selection of a correct value for constant C in Equation (1) can be important for the use of the Hollomon-Jaffe parameter. Initially, it was proposed a dependence of C with the carbon content of the steel and a mean value of 20 if time was expressed in hours was proposed [14] shortly after. Although this value has been widely used [15,16,17,18] even for new steels [19,20], other values have also been proposed for different alloys, basically through the fit of experimental data [16,21,22,23]. Even a negligible influence of the value of C in the applicability of the tempering parameter has been suggested [24], which could explain the aforementioned wide and appropriate use of a value of 20 for C.
Nevertheless, some authors have stated that the use of the Hollomon-Jaffe parameter is not suitable for all iron alloys [25].
Cast irons are iron alloys with a high carbon content that solidify with an eutectic and are used to manufacture metallic elements using the casting technology. The vast majority of those alloys are characterized by a microstructure of graphite in a ferrous matrix and can be subjected to heat treatments such as quenching, although their high carbon content imposes some limitations and oil quenching is always used except for surface hardening, when water can also be used. As the combination of quenching and annealing is cheaper and more controllable than processes like austempering or martempering, it should be preferred if the mechanical characteristics that provide an austempering are not needed or other problems like cracking during quenching are not a drawback.
The main aim of this work has been to study the applicability of the Hollomon-Jaffe parameter on the tempering of nodular cast iron after quenching, to determine the best value for the constant C and to use to predict the hardness of the samples after a hardening and tempering treatment. The results show this parameter is useful in the study of the tempering process over a wide range of C values and that the final hardness of the cast iron can be estimated from the initial hardness of the alloy and the Hollomon-Jaffe parameter.
2. Materials and Methods
The material used in this investigation was a trapezoidal bar with a section of 3.5 cm2. This bar was made of a GJS-400-15 as-cast nodular iron alloy whose composition can be seen in Table 1. Its microstructure is shown in Figure 1. It contains both nodular and vermicular graphite (G) -around 70% nodular- in a ferritic-pearlitic matrix where pearlite accounts for 26% of the matrix. Its carbon equivalent (CE), calculated using Equation (2) [26] ranges from 3.93 to 4.57.

Table 1.
Cast iron composition.
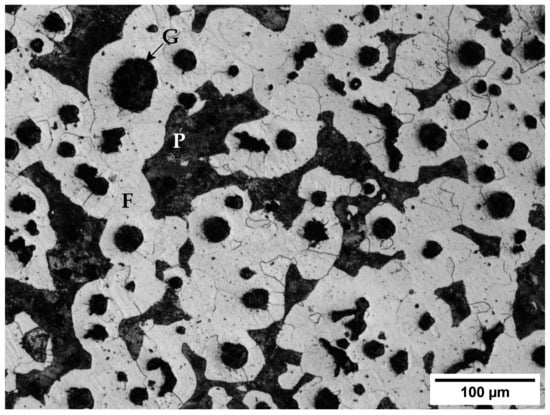
Figure 1.
Microstructure of the alloy before any heat treatment. G: Graphite; F: Ferrite; P: Pearlite.
The hardness of this alloy was 87.6 HRB (181.7 HV), what implies a minimum ultimate tensile strength of 390 MPa and a minimum yield strength of 250 MPa according to the specifications of EN 1563. The minimum elongation for this cast iron is 15%.
The bar was cut into samples of 15 mm width. These samples were separated into three groups of 20 samples each one in order to obtain three different hardness groups after a heat treatment:
- Group 1: Samples were austenized at 880 °C for 15 min and quenched in water. Oil is usually preferred so as to prevent cracking, but the small size of the samples avoided that problem even when quenching in water.
- Group 2: Samples were austenized at 880 °C for 15 min and cooled under air flow (24 m/s approximately) at room temperature. This airflow was obtained using two small air blowers at 100 mm from the samples.
- Group 3: Samples were austenized at 880 °C for 5 h and quenched in water. This long period of treatment leaded to a partial dissolution of the cementite in the pearlitic fraction of the matrix, which becomes graphitized. The resulting lower martensite content of the matrix after quenching implies also a lower hardness than for group 1.
The applied austenizing treatments do not follow the usual recommendations of around 1 h/25 mm of section [27], so a complete austenization was not guaranteed for the whole samples. Nevertheless, some exploratory quenching tests were done at 880 °C and water quenching with soaking times of 10, 15, 20, 25 and 30 min and, except for the 10-min samples, all of them showed the same mean hardness at the surface. As the objective was only to obtain 3 different groups of samples with different hardness at the surface and not to obtain an homogenized or fully austenized microstructure, the lowest soaking time congruent with the objective was selected.
After quenching, the samples were tempered using different combinations of time and temperature. In total, 20 combinations were tested, according to Table 2. In order to calculate the value of the Hollomon-Jaffe parameter, a value of 20 was supposed for C.
Table 2.
Tested combinations of time and temperature. The tempering parameter was calculated using C = 20.
As can be seen in Table 2, the selected values of temperature and time cover a range that goes from 12.3 to 22.6. In this range the values for one temperature partly overlaps with the values of the previous temperature.
Once the tempering treatment was finished, the samples were cooled in water to avoid a further evolution of the microstructure.
The hardness of the quenched and tempered samples was, after grinding using 220 and 500 grit sandpaper, measured using the Rockwell-C or Rockwell-B scales, depending on the hardness of the samples. These values were converted to the Vickers scale to facilitate a better comparability.
Finally, the samples were polished and etched using Nital-3 (3% HNO3 in ethanol) and its microstructure studied using light microscopy.
3. Results
3.1. Microstructure and Hardness after Quenching
The structure of group 1 samples after quenching in water can be seen in Figure 2. Quenching in water generates a mixed matrix microstructure, mainly martensitic (M), but also containing areas of lower bainite (B) and ferrite (F), still present due to an incomplete austenization. Each one of these areas has a different hardness: 801 ± 75 HV0.1 for the martensitic areas, 620 ± 52 HV0.1 for the bainitic areas and 180 ± 34 HV0.05 for the ferrite grains. The mean hardness of the quenched samples was 54 ± 3 HRC (592 HV). This last value averages the effect of the different components of the microstructure as the size of the indentations done on the samples cover all of them.
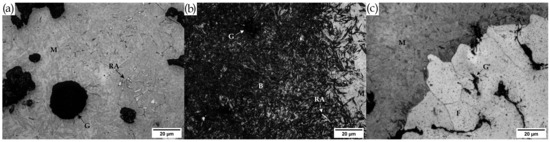
Figure 2.
Microstructure of the samples quenched in water after 15 min of annealing at 880 °C. (a) Martensite with some retained austenite. (b) Bainite next to a martensitic area. (c) Ferrite grains and martensite. G: Graphite; F: Ferrite; M: Martensite; B: Bainite; RA: Retained austenite.
When the sample is quenched under a forced airflow the cooling rate is not high enough to produce a highly hardened microstructure, although an increase of 110 HV units is obtained when compared to the untreated cast iron. In this case the microstructure of the matrix (Figure 3) consists mainly of a mixture of fine pearlite (P) and ferrite (F) with a mean hardness of 28.6 ± 1 HRC (291 HV), although some retained austenite (RA) can still be found.
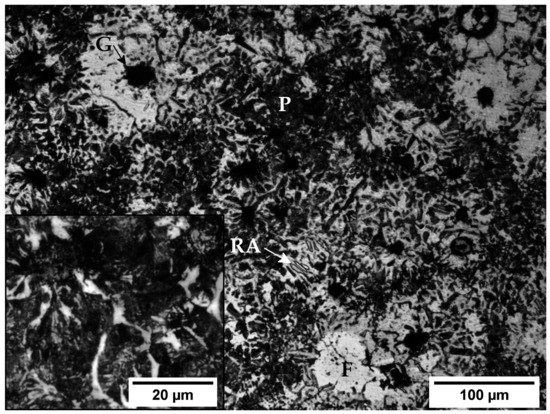
Figure 3.
Microstructure of the samples cooled under forced air flow after 15 min of annealing at 880 °C. G: Graphite; F: Ferrite; P: Pearlite; RA: Retained austenite.
The structure that is obtained after a water quenching if the sample is maintained 5 h at 880 °C in the oven consists of martensite islands in a ferritic matrix (Figure 4). The higher proportion of ferrite in these samples when compared to the original microstructure indicates the 5 h the samples have been soaked at 880 °C had a ferritizing effect, resulting in the partial conversion of the pearlitic cementite to ferrite and graphite. Furthermore, a partial decarburization process took place at the surface of the samples due to the high temperature of the oven [28], as can be seen at the lower-left part of Figure 4 as round areas corresponding to the decarburized graphite nodules (DGN). In this case, the combination of ferrite and martensite gave the quenched samples a hardness of 42 ± 3 HRC (420 HV).

Figure 4.
Microstructure of the samples quenched in water after 5 h of annealing at 880 °C. The fraction of ferrite is much higher than shown in the figure. DGN: Decarburized graphite nodule; F: Ferrite; M: Martensite.
3.2. Hardness Evolution during Tempering
Figure 5 shows the hardness measured for each sample after the quenching and tempering heat treatments as a function of temperature and time. The largest part of the hardness reduction takes place during the first hour, with a higher reduction rate during the first 10 min. After 1 h, the hardness values decrease very slowly or stabilize. This behaviour is expected due to the logarithmical relation between time and hardness in definition of the Hollomon-Jaffe parameter. This logarithmic relationship implies the need of a 10-fold increase of time in order to double the hardness decrease. The dependence with temperature is linear and that linearity can be seen in Figure 5 despite the effect of data dispersion.
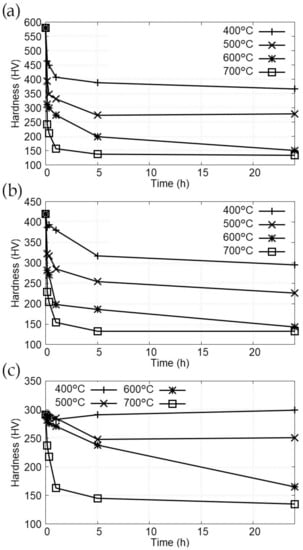
Figure 5.
Evolution of hardness with time and temperature (a) Samples quenched in water. (b) Samples cooled under air flow. (c) Samples quenched in water after 5 h at 880 °C.
4. Discussion
4.1. Hardness and the Tempering Parameter
A better way of correlating time and temperature with hardness is the use of the Hollomon-Jaffe parameter. If hardness is plotted against the tempering parameter using C = 20, Figure 6 is obtained. In that graphic, the initial hardness of the quenched samples is represented by a horizontal line at the Y-axis.
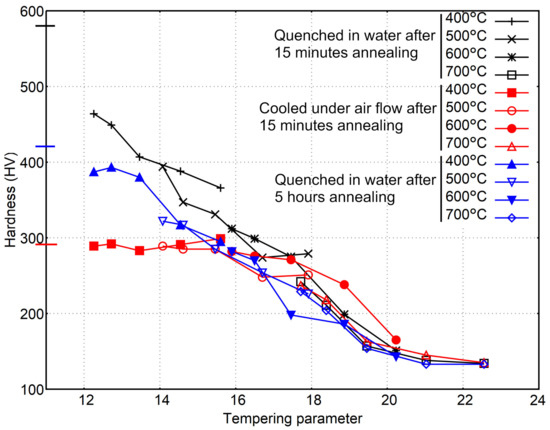
Figure 6.
Evolution of hardness with the tempering parameter.
According to Figure 6, the hardness decrease follows approximately the same curve independently of the initial hardness, but only once the tempering parameter is high enough to produce a noticeable change in the microstructure and the hardness. That point seems to be dependent of the initial hardness value as a tempering parameter equal to 16 is needed to see a reduction in hardness when the initial microstructure is a mixture of ferrite and fine pearlite (291 HV), but the hardness reduction is clear for the more hardened samples (580 HV) with a value of the tempering parameter of 12. The need for a minimum value of in order to obtain noticeable changes is also found in the literature [29,30].
Regarding the value of C, the Hollomon-Jaffe parameter is mainly used on the linear part of the curve that represents the evolution of hardness. To obtain the best fit to the data points, a linear fit was done using all the points of group 1 samples except the one corresponding to the highest as that point no longer follows a linear evolution. The best fit was found with C = 24.57 (R2 = 0.981). Nevertheless, other C values give very good results.
Figure 7 shows the value of R2 when different values of C are used. As that figure shows, the range of values from which C can be chosen and still have a coefficient of determination R2 over 0.95 goes from 17 to 39, what explains the different values proposed by different authors or the aforementioned negligible influence of C in the applicability of the tempering parameter [24]. Evidently, the value of will change with C.
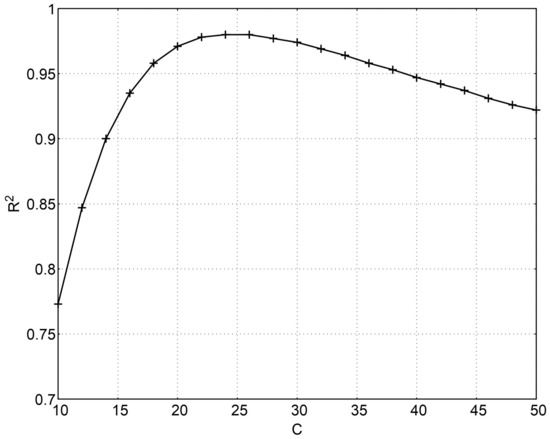
Figure 7.
Coefficient of determination R2 for different values of C.
In this case, as the use of C = 20 gives good results (R2 = 0.971), it was decided to maintain that value in pursuit of a better comparability with bibliographic results.
It’s important to note that the evolution of hardness, and also of the microstructure, depends on three diffusion processes: tempering of martensite, ferritization and decarburization of the outer layer of the samples, but despite the combination of these processes, the tempering parameter remains suitable to study the changes due to tempering.
4.2. Microstructure Evolution
The evolution of the microstructure is shown in Figure 8 for the samples of group 1, the more hardened ones. The microstructure shows tempered martensite until the tempering parameter reaches a value near 18, when the decomposition of martensite has progressed and the microstructure is composed of globular carbides in a ferritic matrix along with nodular and compacted graphite. Thenceforth, the ferritizing process dissolves those carbides to produce, for the highest values of the tempering parameter, a fully ferritic microstructure. Furthermore, decarburization also takes place and nodular and compacted graphite disappear from the outer layers of the samples, leaving footprints [31] that can be seen clearly in Figure 8f.
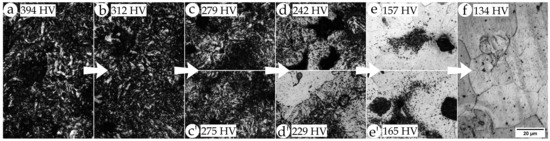
Figure 8.
Evolution of hardness with the tempering parameter (a) = 14.1, group 1, 10 min at 500 °C. (b) = 15.9, group 1, 10 min at 600 °C. (c) = 17.9, group 1, 24 h at 500 °C. (c’) = 17.5, group 1, 1 h at 600 °C. (d) = 17.7, group 1, 10 min at 700 °C. (d’) = 17.7, group 3, 10 min at 700 °C. (e) = 19.5, group 1, 1 h at 700 °C. (e’) = 19.5, group 2, 24 h at 600 °C. (f) = 22.6, group 1, 24 h at 700 °C. All figures at ×400.
Although Figure 8 shows the evolution of the harder group of samples, the microstructure of the other groups follow a similar evolution once the decomposition of the microstructure has begun. In fact, Figure 8d’ and Figure 8e’ correspond to group 3 and group 2 and have been introduced to show the similarity in the microstructure for similar values of and hardness despite having initial different microstructures. Figure 8c,c’ and Figure 8d,d’ have similar values of the tempering parameter, nevertheless, the micrestructure has evolved a bit more on Figure 8d,d’, which have lower hardness, perhaps this behaviour is due to a slight higher influence of temperature than time that is not covered by the formula of the Hollomon-Jaffe parameter. Evidently, that could not be the case, but the different series of points in Figure 6 tend to show that, for similar values, the samples with higher temperatures and lower times tend to have lower hardness than the samples with lower temperatures and higher times.
4.3. Prediction of Hardness Using the Tempering Parameter
Despite minor inconsistencies that could be due to small mistakes during the procedure of tempering and quenching or, simply, to statistical dispersion of the results, the Hollomon-Jaffe parameter fulfils its role and combines the effect of tempering temperature and time for the tested nodular cast iron. In this case has also been use as a means to predict the hardness of a tempered sample. In order to do that, some points were taken into account:
- Low values of the tempering parameter will not produce any change in the microstructure of the samples.
- The curve that represents the evolution of hardness with is limited by the initial hardness and the hardness of the softer microstructure achievable, a fully ferritic matrix in this case.
Considering these restrictions, the chosen function to fit the data as a function of TP was based in the logistic function, which is a sigmoid function:
where A, B, D and E are the fitting variables. Usually, a linear relationship between TP and hardness would be used, but this function has been preferred as a means to extend its validity over all values of HP.
Some considerations must be made now regarding the function:
- Without any tempering ( = 0), the hardness remains unchanged. Mathematically, for the chosen function, this implies that for A equals the initial hardness, H0.
- It can be supposed that for a infinite value of , the hardness will be the lowest of the values obtained after tempering the samples, Hf. This implies, taking into account the previous restriction, that B = H0− Hf.
So, the values of A and B can be directly calculated from the initial and the lowest attainable hardness (133 HV) and the only remaining variables are D and E, both of them needed to fit the width and position of the transition from H0 to Hf.
The fitted functions for each one of the groups are represented in Figure 9. Each group of samples follows a different curve, which is to be expected, but there is some linearity that is shared between the 3 groups and provide an estimation for the hardness values of the quenched samples independently of the initial hardness. The range where this happens is marked in Figure 9. The values of coefficients D and E should also be dependent on H0 and Hf and both decline as H0 − Hf increases (see Figure 10).
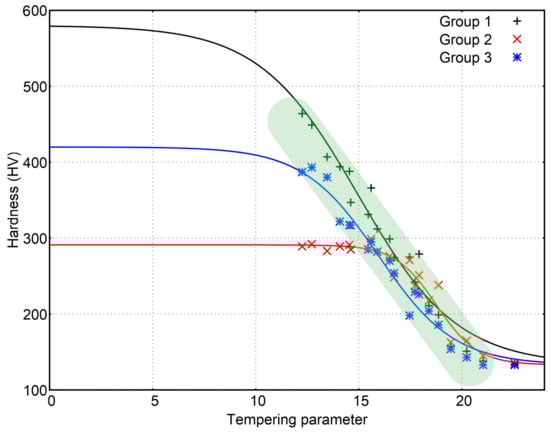
Figure 9.
Mathematical relation between and hardness for the 3 groups of samples. Coefficients D and E are 0.417 and 14.97 for group 1, 1.000 and 18.76 for group 2 and 0.546 and 15.96 for group 3.
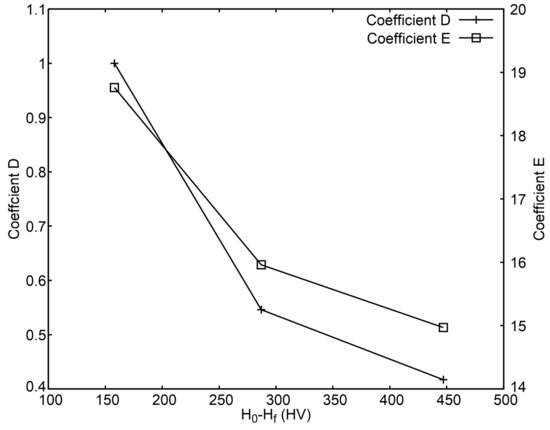
Figure 10.
Coefficients D and E as a function of H0 − Hf.
The fitted functions provide other insights as they show clearly how the onset of the decrease in hardness requires higher values of as the initial hardness lowers. That value of seems to coincide with the point where the curve reaches the area of linearity. This fact could be used to estimate the minimum needed to produce a change in a hardened sample using data obtained from samples with other hardness. If the onset of change is supposed to be related to the loss of 5% of the initial hardness, the following values are obtained for : 8.3, 16.3 and 11.0.
The end of the tempering could be estimated the same way. Supposing it ends when hardness reaches 105% of Hf, the functions give the following values for : 25.05, 22.81 and 21.88.
5. Conclusions
The following conclusions can be extracted from the study of the results:
- The tempering of three groups of hardened nodular cast iron, each one with a different initial harness, has shown the Hollomon-Jaffe is suitable for this alloy even when there are more than one diffusion process (tempering of martensite, ferritization and decarburization).
- The constant C of the Hollomon-Jaffe parameter can be chosen from a wide range of values without affecting noticeably the applicability od . The common choice C = 20 gives, in this case, good results.
- The evolution of hardness relates with that of the microstructure. These changes follow, roughly, the following sequence: tempering of martensite, ferritizing and decarburization.
- The onset of microstructure and hardness changes depends on the initial hardness of the samples. The changes begins at lower values as initial harness increases.
- Once hardness has begun decreasing, the evolution follows approximately the same linear evolution regardless of the initial hardness.
- Hardness evolution can be predicted using a logistic function, which can also be used to predict the onset of hardness changes.
- Coefficients D and E of the mentioned function show a similar dependence on H0 and Hf.
Author Contributions
Conceptualization, F.S.V. and M.P.G.; methodology, F.S.V.; validation, M.P.G.; formal analysis, R.F.A., J.C.F.T. and F.S.V.; investigation, R.F.A. and J.C.F.T.; data curation, R.F.A. and J.C.F.T.; writing—original draft preparation, F.S.V. and R.F.A.; writing—review and editing, F.S.V. and J.C.C. All authors have read and agreed to the published version of the manuscript.
Funding
This research received no external funding.
Data Availability Statement
Data can be obtained from the authors.
Conflicts of Interest
The authors declare no conflict of interest.
References
- Sun, Y.; Obasi, G.; Hamelin, C.; Vasileiou, A.; Flint, T.; Francis, J.; Smith, M. Characterisation and modelling of tempering during multi-pass welding. J. Mater. Process. Technol. 2019, 270, 118–131. [Google Scholar] [CrossRef]
- Dai, T.; Thodla, R.; Kovacs, W., III; Tummala, K.; Lippold, J. Effect of Postweld Heat Treatment on the Sulfide Stress Cracking of Dissimilar Welds of Nickel-Based Alloy 625 on Steels. Corrosion 2019, 75, 641–656. [Google Scholar] [CrossRef]
- Liu, G.; Yang, S.; Han, W.; Zhou, L.; Zhang, M.; Ding, J.; Dong, Y.; Wan, F.; Shang, C.; Misra, R. Microstructural evolution of dissimilar welded joints between reduced-activation ferritic-martensitic steel and 316L stainless steel during the post weld heat treatment. Mater. Sci. Eng. A 2018, 722, 182–196. [Google Scholar] [CrossRef]
- Cheng, G.; Choi, K.S.; Hu, X.; Sun, X. Predicting Deformation Limits of Dual-Phase Steels Under Complex Loading Paths. JOM 2017, 69, 1046–1051. [Google Scholar] [CrossRef]
- Blesi, B.W.; Smith, C.; Matlock, D.K.; De Moor, E. Bake Hardening Behavior of DP, TBF, and PHS Steels with Ultimate Tensile Strengths Exceeding 1 GPa. SAE Int. J. Adv. Curr. Pract. Mobil. 2020, 2, 3203–3218. [Google Scholar]
- Murphy, S.; Woodhead, J.H. An investigation of the validity of certain tempering parameters. Metall. Mater. Trans. B 1972, 3, 727–735. [Google Scholar] [CrossRef]
- Canale, L.C.; Yao, X.; Gu, J.; Totten, G.E. A historical overview of steel tempering parameters. Int. J. Microstruct. Mater. Prop. 2008, 3, 474. [Google Scholar] [CrossRef]
- Gomes, C.; Kaiser, A.L.; Bas, J.P.; Aissaoui, A.; Piette, M. Predicting the mechanical properties of a quenched and tempered steel thanks to a “tempering parameter”. Mater. Trans. 2010, 107, 293–302. [Google Scholar] [CrossRef]
- Hollomon, J. Time-temperature relations in tempering steel. Trans. AIME 1945, 162, 223–249. [Google Scholar]
- Larson, F.R. A time-temperature relationship for rupture and creep stresses. Trans. ASME 1952, 74, 765–775. [Google Scholar]
- Arrhenius, S. Über die Dissociationswärme und den Einfluss der Temperatur auf den Dissociationsgrad der Elektrolyte. Z. Phys. Chem. 1889, 4, 96–116. [Google Scholar] [CrossRef]
- Van’t Hoff, J.H. Etudes de Dynamique Chimique; Muller: Amsterdam, The Netherlands, 1884; Volume 1. [Google Scholar]
- Laidler, K. Chemical kinetics and the origins of physical chemistry. Arch. Hist. Exact Sci. 1985, 32, 43–75. [Google Scholar] [CrossRef]
- Roberts, G.; Grobe, A.; Moersch, C. The tempering of high alloy tool steels. Trans. Am. Soc. Met. 1947, 39, 521–548. [Google Scholar]
- Virtanen, E.; Tyne, C.V.; Levy, B.; Brada, G. The tempering parameter for evaluating softening of hot and warm forging die steels. J. Mater. Process. Technol. 2013, 213, 1364–1369. [Google Scholar] [CrossRef]
- Zikeev, V.; Kornyushchenkova, Y.V.; Izvol’skii, V. Influence of the temperature-time parameter of tempering on the properties of 18Kh1G1MF steel resistant to hydrogen embrittlement. Met. Sci. Heat Treat. 1984, 26, 99–101. [Google Scholar] [CrossRef]
- Revilla, C.; López, B.; Rodriguez-Ibabe, J. Carbide size refinement by controlling the heating rate during induction tempering in a low alloy steel. Mater. Des. (1980–2015) 2014, 62, 296–304. [Google Scholar] [CrossRef]
- Hodgson, D.; Dai, T.; Lippold, J. Transformation and tempering behavior of the heat-affected zone of 2.25 Cr-1Mo steel. Weld. J. 2015, 94, 250–256. [Google Scholar]
- Kamp, A.; Celotto, S.; Hanlon, D. Effects of tempering on the mechanical properties of high strength dual-phase steels. Mater. Sci. Eng. A 2012, 538, 35–41. [Google Scholar] [CrossRef]
- Mahadevan, S.; Manojkumar, R.; Jayakumar, T.; Das, C.R.; Rao, B.P.C. Precipitation-Induced Changes in Microstrain and Its Relation with Hardness and Tempering Parameter in 17-4 PH Stainless Steel. Metall. Mater. Trans. A 2016, 47, 3109–3118. [Google Scholar] [CrossRef]
- Shlyakman, B.M.; Yampolskii, O.N.; Ratushev, D.V. A method for determining constant C in the Hollomon parameter. Met. Sci. Heat Treat. 2010, 52, 451–453. [Google Scholar] [CrossRef]
- Paul, V.T.; Saroja, S.; Albert, S.; Jayakumar, T.; Kumar, E.R. Microstructural characterization of weld joints of 9Cr reduced activation ferritic martensitic steel fabricated by different joining methods. Mater. Charact. 2014, 96, 213–224. [Google Scholar] [CrossRef]
- Shrestha, T.; Alsagabi, S.; Charit, I.; Potirniche, G.; Glazoff, M. Effect of Heat Treatment on Microstructure and Hardness of Grade 91 Steel. Metals 2015, 5, 131–149. [Google Scholar] [CrossRef]
- Janjusevic, Z.; Gulisija, Z.; Mihailovic, M.; Pataric, A. The investigation of applicability of the Hollomon-Jaffe equation on tempering the HSLA steel. Chem. Ind. Chem. Eng. Q. 2009, 15, 131–136. [Google Scholar] [CrossRef]
- Murry, G. évolution de la dureté des aciers de traitement thermique au cours du revenu après trempe incomplète. Rev. Métall. 1977, 74, 665–672. [Google Scholar] [CrossRef]
- Stefanescu, D.; Lacaze, J. ASM Handbook, Volume 1A, Cast Iron Science and Technology; Chapter Thermodynamics Principles as Applied to Cast Iron; ASM International: Materials Park, OH, USA, 2017; pp. 31–45. [Google Scholar]
- ASM Handbook, Volume 4—Heat Treating; ASM International: Materials Park, OH, USA, 1991.
- Yamada, S.; Goto, S.; Aso, S.; Komatsu, Y.; Konno, T. Growth mechanism of decarburized layer in spheroidal cast iron. J. Jpn. Foundry Eng. Soc. 2001, 73, 219–224. [Google Scholar]
- Dai, T.; Lippold, J. Tempering behavior of the fusion boundary region of an F22/625 weld overlay. Weld. J. 2017, 96, 467–480. [Google Scholar]
- Hoja, S.; Hoffmann, F.; Steinbacher, M.; Zoch, H.W. Investigation of the Tempering Effect during Nitriding. HTM J. Heat Treat. Mater. 2018, 73, 335–343. [Google Scholar] [CrossRef]
- Yamaguchi, Y.; Kiguchi, S.; Sumimoto, H.; Nakamura, K. Effect of graphite morphology on decarburized cast iron. Int. J. Cast Met. Res. 2003, 16, 137–142. [Google Scholar] [CrossRef]


Publisher’s Note: MDPI stays neutral with regard to jurisdictional claims in published maps and institutional affiliations. |
© 2021 by the authors. Licensee MDPI, Basel, Switzerland. This article is an open access article distributed under the terms and conditions of the Creative Commons Attribution (CC BY) license (http://creativecommons.org/licenses/by/4.0/).