Abstract
The ball valve is an essential piece of equipment in an oil and gas pipeline. The sand particles transported through the pipeline can cause erosion and wear to the ball valve, thus causing it to fail, leading to serious safety hazards. In this paper, the self-designed erosion experiment method was combined with computational fluid dynamics (CFD), while the Euler-Lagrange method was also introduced to optimize the Oka erosion model and Ford particle-wall rebound model. The erosion mechanism and characteristics of the ball valve sealing surface in gas-solid two-phase flow were simulated, while the erosion condition of the specimen was analyzed and compared when exposed to different factors, such as different particle velocities, impact angle, particle size, and specimen materials. The experimental data conformed well to the CFD erosion simulation data, verifying the accuracy of the CFD simulation analysis. The results indicated that the worn surface was caused by various wear mechanisms, while a “stagnation zone” was identified at the center of the specimen. The maximum erosion area, which was U-shaped, was also located at the center. The erosion rate increased in conjunction with an increase in the particle velocity and size, both of which failed to affect the erosion pattern. The erosion rate initially increased, after which it decreased with the impact angle, reaching the maximum value at an impact angle of 30°. This paper summarizes the erosion failure mechanism and characteristics in gas–solid two-phase flow and provides both technical support and a theoretical basis for the on-site maintenance of essential vulnerable parts in the pipeline, such as ball valves.
1. Introduction
The ball valve is responsible for cutting off, distributing, and changing the medium in oil and gas pipelines and is an essential regulating component presenting several advantages, such as low fluid resistance, convenient and rapid switching, an extended service life, and high reliability. However, during the operational process, there may be leakage or even failure of the ball valve, causing serious safety hazards due to the erosion and wear of the sealing surface of the ball valve by the sand and abrasive particles in the pipeline [1]. As a phenomenon of surface material loss caused by the repeated collision between the wall surface and the sand particles carried by the fluid, erosion wear occurs extensively in production, transmission, and processing equipment [2]. Therefore, erosion wear can directly lead to the failure, damage, and scrapping of equipment and its parts. According to a British scholar, Eyre [3], erosion wear accounts for 8% of the total wear and tear damage during industrial production. Therefore, it is necessary to study the erosion characteristics and mechanism of the sealing surface of the ball valve to reveal its specific erosion law, while improving its service life and ensuring the safe operation of oil and gas pipelines.
The erosion problem is exceptionally complicated and can be affected by a variety of factors, such as particle velocity, particle diameter, particle material, impact angle, and the material properties of the eroded parts [4]. Therefore, a substantial number of simulations and experimental analyses have been performed to reveal the influence of these elements on the erosion results, which include research regarding the role of particles in erosion during the oil and gas production process, storage, and transportation. At present, the most common erosion wear includes liquid-solid particle slurry erosion and gas–solid erosion, while gas-liquid-solid three-phase erosion wear is relatively rare.
The most common experimental form used for examining liquid-solid erosion involves the immersed plate specimen impact test. Some results show the presence of a “W” shaped erosion pattern in the cross-section of the eroded surface [5,6]. In additional studies involving liquid sand erosion, Liu et al. [7] revealed the migration path of the severe corrosion area of a hydraulic slide valve, as well as the mechanism of local corrosion. Nguyen et al. [8] found that the corrosion rate became higher in conjunction with an increase in impact velocity, while the surface roughness increased when the test time or impact velocity was increased. Sun et al. [9] proposed two corrosion mechanisms in different flow fields based on the observation of the corrosion morphology of samples cut from abrasive tools and the analysis of flow characteristics using scanning electron microscopy (SEM) and computational fluid dynamics (CFD). Liu et al. [10] indicated that the mass flow rate, wall shear stress, turbulence intensity, and particle erosion displayed a decline in conjunction with a decrease in the valve opening.
Several impact experiments were performed on flat plate specimens in a dry environment to examine gas-solid erosion. Divakar et al. [11] showed that the erosion rate increased with higher particle impact velocity, while the higher the hardness of the target material, the lower the erosion rate. Using 316 stainless steel as the impact target material, Vieira et al. [12] illustrated that a higher particle impact velocity increases the erosion rate, thereby eliminating more mass loss of the target material regardless of the changes in the impact angle. Furthermore, the erosion rate reaches the maximum value when the impact angle is 30°. A study by Vieira et al. [12], Mazdak et al. [13], and Siaw KhurWee et al. [14] indicated the presence of a “retention area” and an almost circular erosion area on the target when exposed to different velocities. The velocity and erosion nephograms of the target surface subjected to different velocities and target angles were analyzed using CFD. Evstifeev et al. [15] studied mass loss and surface degradation while evaluating the approximate threshold velocity of particles. By conducting a dry erosion test using a sandblasting machine, Okonkwo et al. [16] found that the plowing mechanism is dominant at a higher speed and extended test duration. Okonkwo et al. [17] found that at a 90° impact angle, a ploughing mechanism occurs on the tested specimens, while material removal through low-angle cutting is the dominant mechanism at lower impact angles.
Current research involving the erosion failure mechanism of vulnerable parts during the gathering and transportation of natural gas focuses on the pipeline elbow. However, no studies are available regarding the erosion failure mechanisms of all-welded ball valves in natural gas pipelines. Although the degree of damage to the sealing surface of the ball valve in a natural gas pipeline is readily visible, the damage quantification mechanism and corrosion resistance characteristics have not been revealed until now. Very few studies have developed a complete set of abrasive wear test devices to assess the welded ball valves in natural gas pipelines, while no systematic analysis or comparison of erosion wear characteristics are available regarding the exposure of welded ball valves to various influencing factors, such as different openings, different angles, and different erosion mediums.
Many scholars have performed unilateral in-depth research on erosion theory, simulations, and experiments. Finnie [18] proposed the earliest micro-cutting wear theory in 1958, Bitter [19,20] presented deformation wear theory in 1963, Mansouri et al. [5,21] improved the theoretical erosion model involving liquid–solid erosion, Oka et al. [22,23] carried out extensive experiments and proposed a more applicable erosion prediction model, while Zhang et al. [24] verified the accuracy of Oka et al.’s erosion prediction model through experiments. However, not many researchers have provided a comprehensive comparative analysis involving theory, simulations, and experiments. Therefore, it is necessary to study the erosion mechanism of the ball valve core and the sealing surface in natural gas pipelines via simulations and experimental comparisons. Since a natural gas pipeline contains no liquid, this paper focuses on gas–solid erosion, while completely disregarding liquid-solid erosion.
This paper is mainly designed to analyze the erosion mechanism of the ball valve sealing surface and reveal its erosion characteristics. The scope of this work is to characterize the erosive behavior of the materials of the ball valve sealing through the well-established method of the direct impact test at the laboratory scale, as a preliminary step toward the analysis of a real ball valve geometry. The numerical erosion model is selected as a theoretical basis to simulate the cross-section of the ball valve in a natural gas pipeline using a plane specimen. The change in the erosion rate, the erosion characteristics, and the erosion mechanism when exposed to different conditions are clarified by assessing the impact of the sand-carrying gas on the specimen. The commonly used CFD software package (ANSYS Fluent 18.0) is employed to simulate and predict the erosion mode and study the flow field. The experimental data were highly consistent with the CFD simulation results and theoretical model, verifying the erosion failure process of the ball valve cross-section, presenting the erosion law, and providing theoretical guidance regarding the failure mechanism of the ball valve in natural gas pipelines.
2. Experimental Details
2.1. Experimental Principle
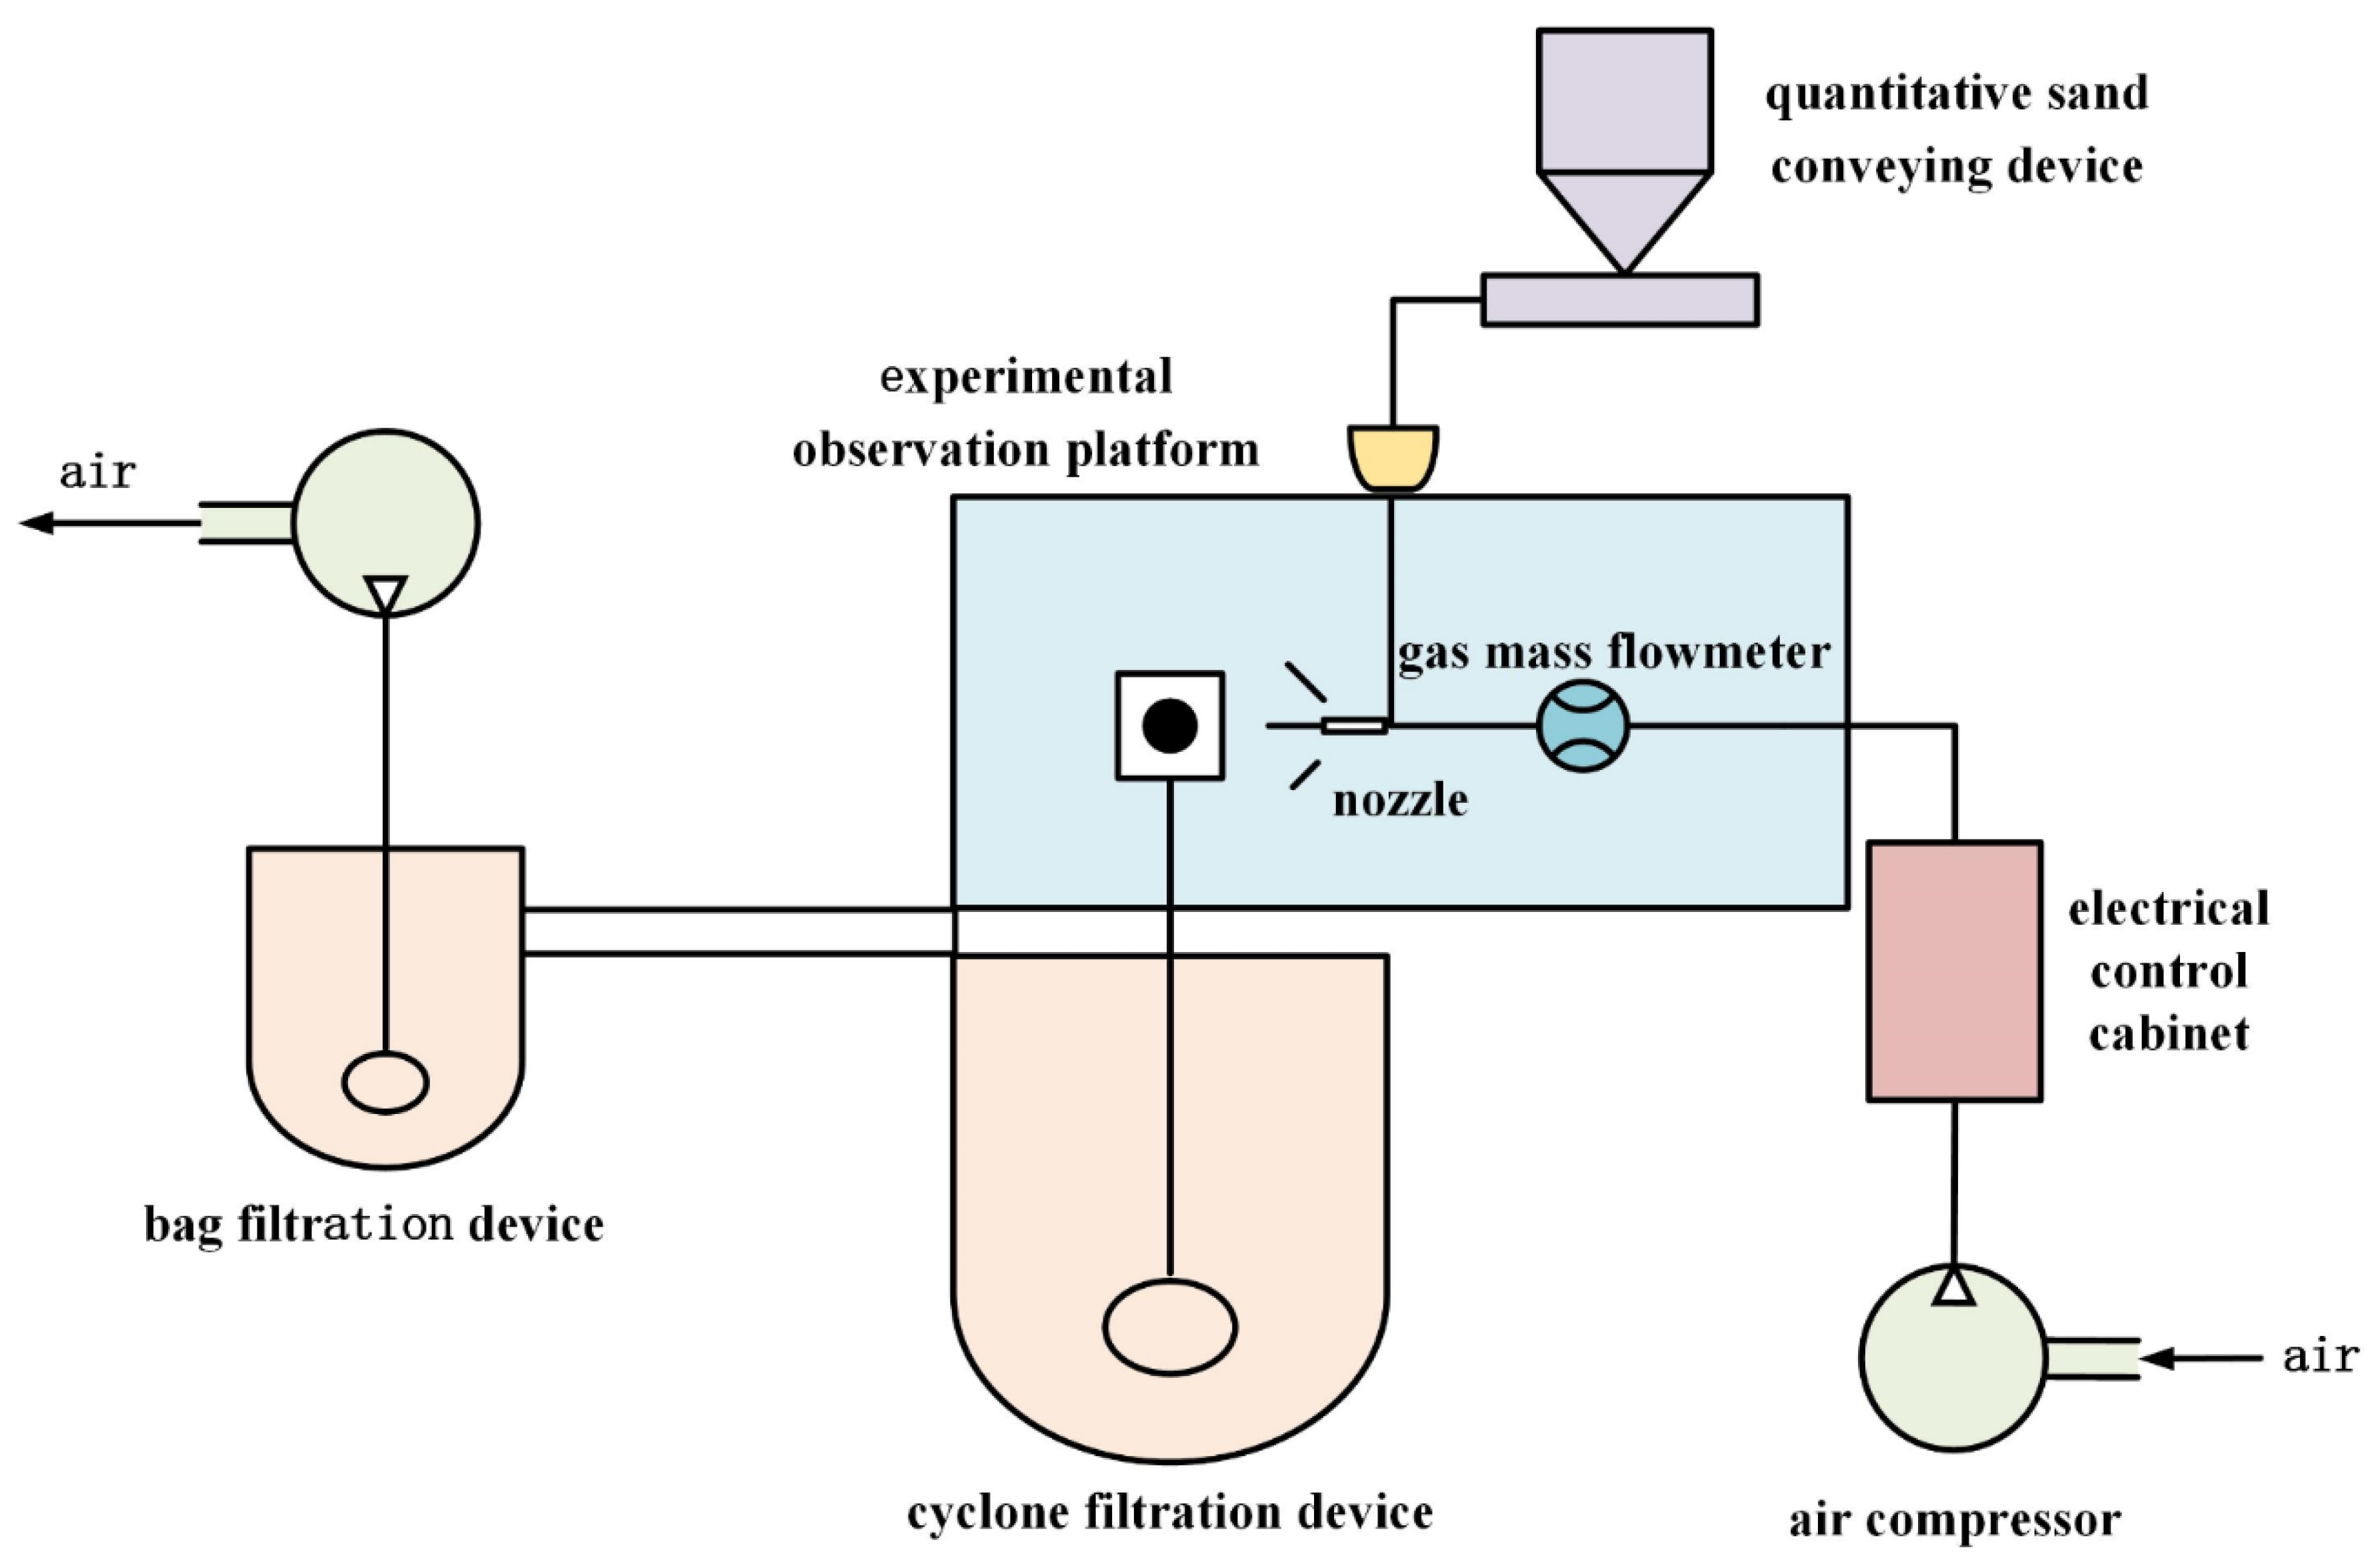
Figure 1 and Figure 2 show that the experimental erosion device based on gas–solid two-phase flow in a dry environment consisted of an air compressor (OUTSTANDING 750W-30L, Taizhou, China), a gas mass flowmeter (MF5712-N-200 with a flow range of 0–200 L/min, and maximum working pressure of 0.8 MPa), a quantitative sand-conveying device, a pressure gauge (WIKA, 233.50.100, Frankfurt, Germany), a nozzle (Lockheed, RM82W/NW14, Tianjing, China), an experimental observation platform, a cyclone filtration device, a bag filtration device, and an induced draft fan.
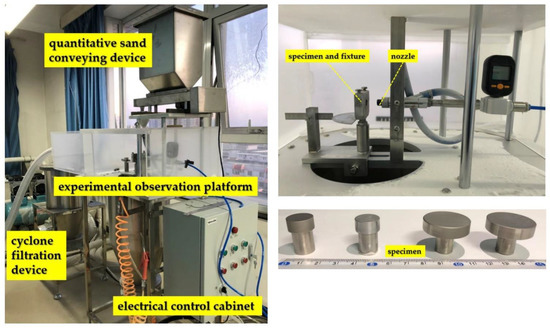
Figure 1.
Partial diagram of the gas-solid two-phase flow erosion test device, nozzle, and specimen.
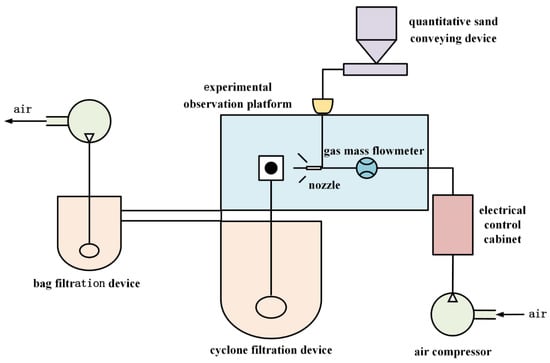
Figure 2.
Schematic diagram of the experimental device for the gas-solid two-phase flow erosion specimen.
The air compressor provided airflow, while the airspeed was regulated by a valve between the compressor and the nozzle. The sand slowly flowed into the nozzle via the sand conveyor, impacting the specimen from the nozzle outlet to generate material loss when reaching a certain airspeed. The cylindrically shaped specimen, φ30 mm × 4 mm in size, was installed on the base. The initial angle between the specimen and the centerline of the nozzle was 90° and could be adjusted by bending it. When changing the inclination angle of the specimen, the distance from its center point to the nozzle outlet was not adjusted but kept at a fixed value.
2.2. Experimental Materials
The materials used in this study included Q235 carbon steel, A304 stainless steel, and 6061 aluminum alloy materials, which are commonly used in the ball valve section of an oil and gas pipeline. The characteristics of these materials are shown in Table 1.

Table 1.
Characteristic parameters of the specimen materials.
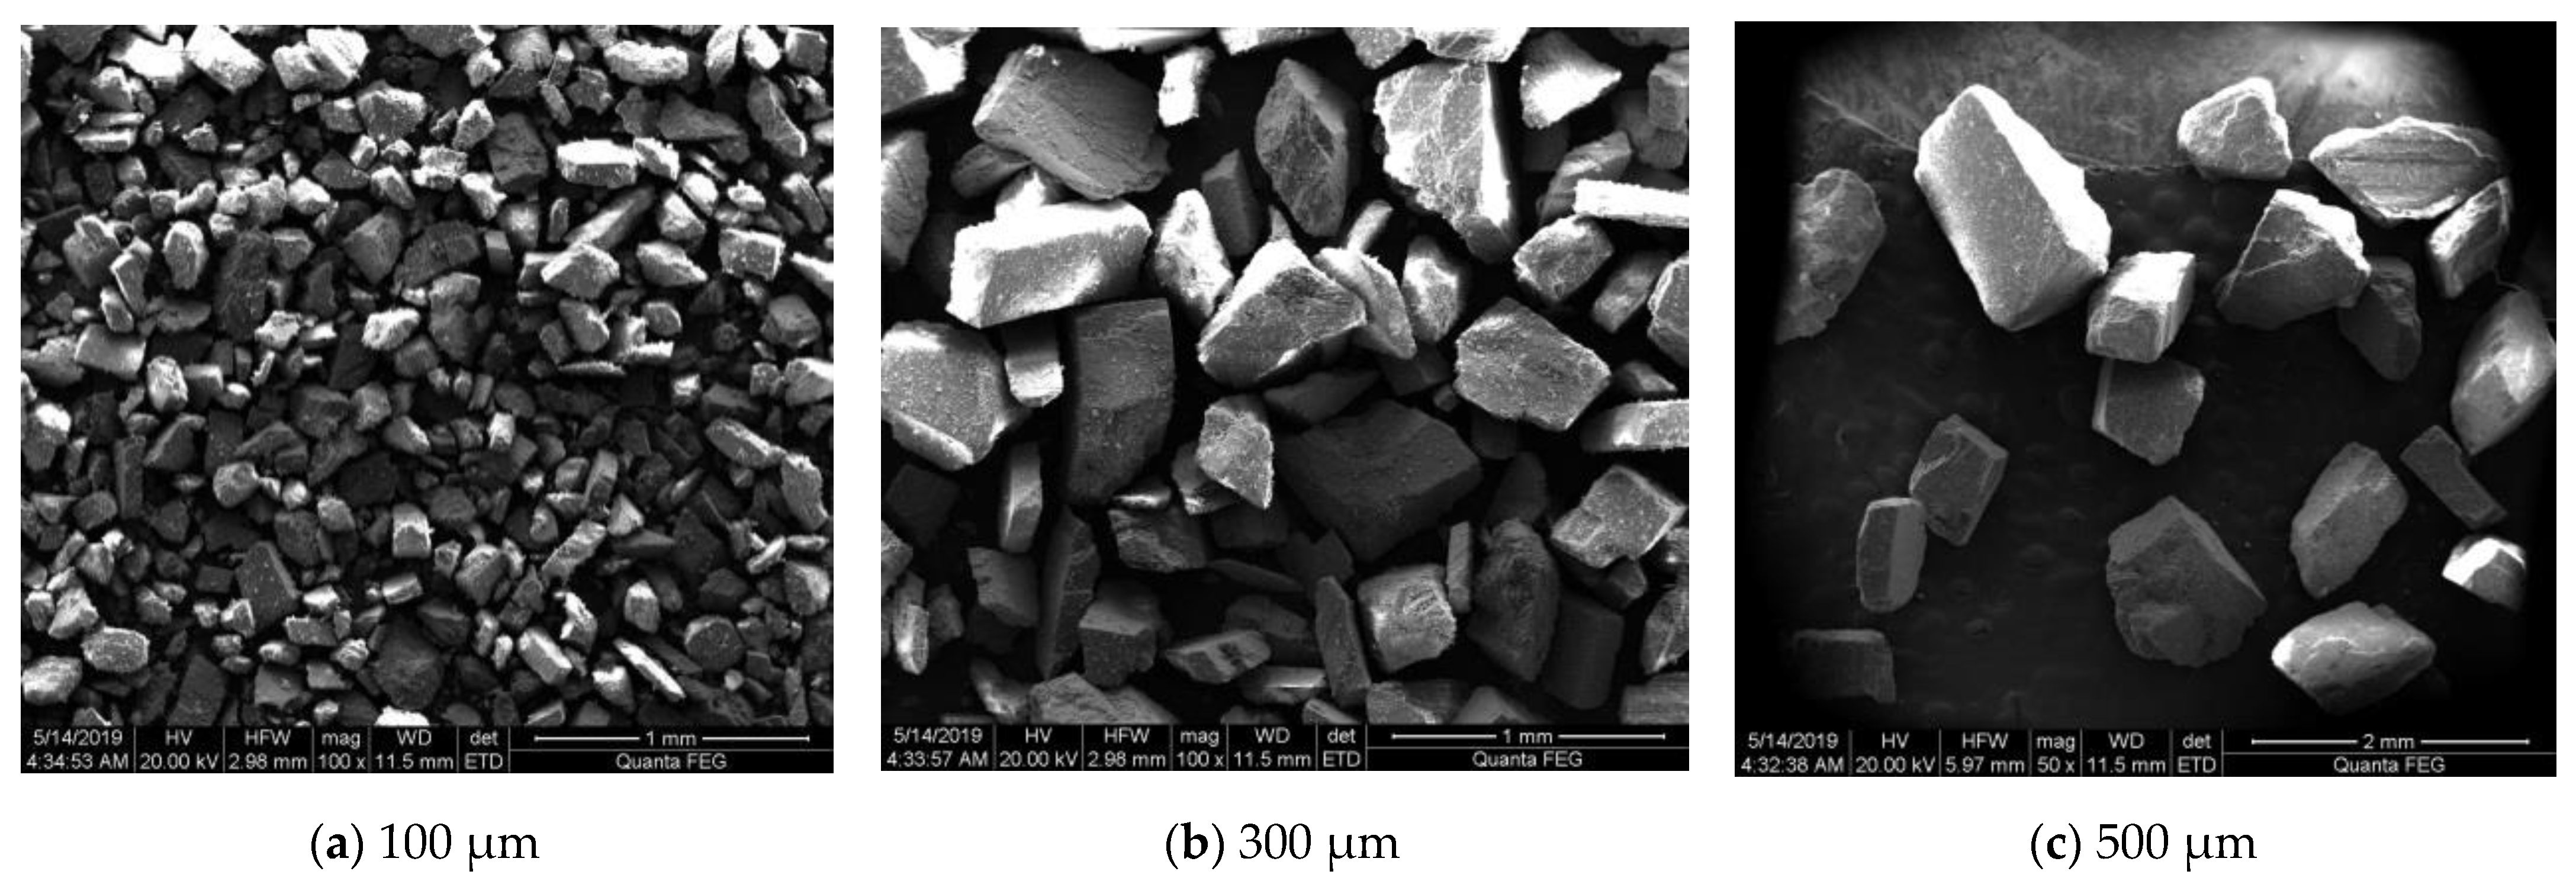
Considering the influence of particle size on erosion, quartz sand with different particle sizes was selected to facilitate the experimental erosion process. The SEM equipment (FEI Quanta 200F, Waltham, MA, USA) was used to observe the surface morphology of three sand particle sizes. The mirror image is shown in Figure 3.

Figure 3.
The scanning electron microscopy (SEM) images of different particle sizes. (a) Quartz sand with a particle diameter of 100 μm. (b) Quartz sand with a particle diameter of 300 μm. (c) Quartz sand with a particle diameter of 500 μm.
2.3. Experimental Procedures
Before the experiments, all parts of the equipment were checked to ensure that the experimental conditions were met. At the same time, the specimen surface was polished before each experiment to avoid the surface roughness influencing the erosion results. Before and after the erosion process, the mass loss of the specimen was recorded several times using an electronic microgram analytical balance, and the average value was calculated. During each group of experiments, the comparative tests were carried out repeatedly by the particle sizes, specimen materials, inlet velocities, impact angles, and various other parameters. The three groups of comparative tests were performed as follows:
- (1)
- The Q235 carbon steel specimen and sand with a particle size of 300 μm were selected to be used at nozzle inlet velocities of 45 m/s, 55 m/s, and 60 m/s during the erosion process, while the angle between the nozzle and the specimen was changed to 20°, 30°, 45°, 60°, 75°, and 90°, respectively.
- (2)
- A constant angle of 90° between the specimen and the nozzle, an air inlet velocity of 60 m/s, and average sand particle sizes of 100 μm, 200 μm, 300 μm, 400 μm, and 500 μm, respectively, were selected for the erosion process.
- (3)
- Test pieces, including Q235 carbon steel, A304 stainless steel, and 6061 aluminum alloy, as well as sand with a particle size of 300 μm, were selected to be used at a nozzle inlet velocity of 60 m/s for the erosion process, while the angle between nozzle and the specimen was changed to 20°, 30°, 45°, 60°, 75°, and 90° respectively.
2.4. SEM Image Results
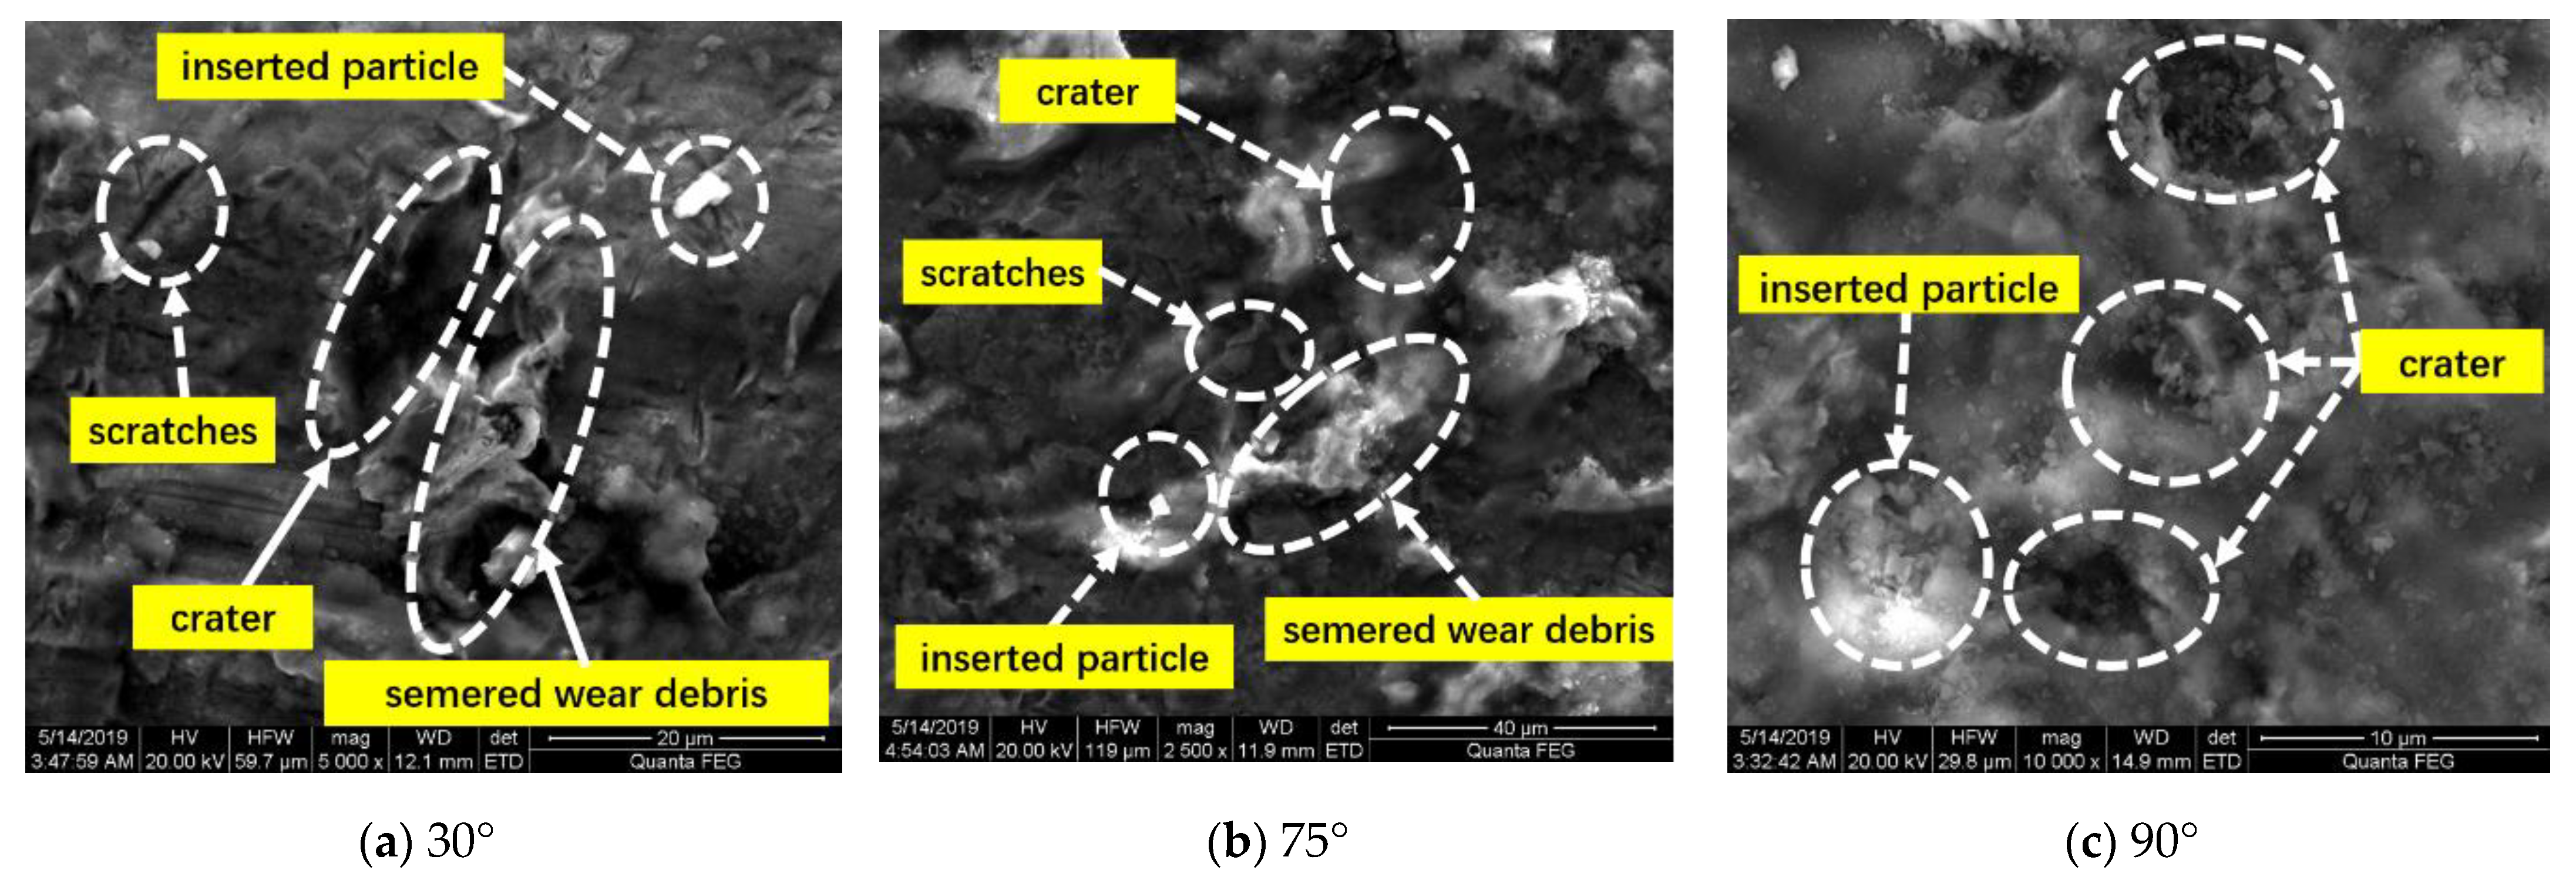
SEM was used to analyze the micro image of the sample surfaces after erosion to study the erosion mechanism further. Figure 4 shows the SEM images the erosion of the A304 stainless steel specimen using sand particles of 300 μm in size at a speed of 55 m/s, and three respective impact angles of 30°, 75°, and 90°.

Figure 4.
SEM images of samples at different impact angles. (a) 30° impact specimen appearance. (b) 75° impact specimen appearance. (c) 90° impact specimen appearance.
Figure 4 shows that when the impact angle was 30°, the erosion characteristics included pits, wear debris, and scratches, while the erosion mechanism involved micro-cutting. As the impact time increased, the debris was transferred to the pit boundary, leaving the specimen surface as the subsequent particles made contact. When the impact angle was 75°, the erosion characteristics included pits, scratches, and wear debris. The erosion mechanism involved both micro-cutting and impact extrusion deformation. When the angle was 90°, the erosion characteristics presented mainly pits. The erosion mechanism involved impact extrusion deformation since the particles made vertical contact with the center of the specimen center that caused the formation of pits, while the repeated impact led to the presence of deformation debris on the specimen surface.
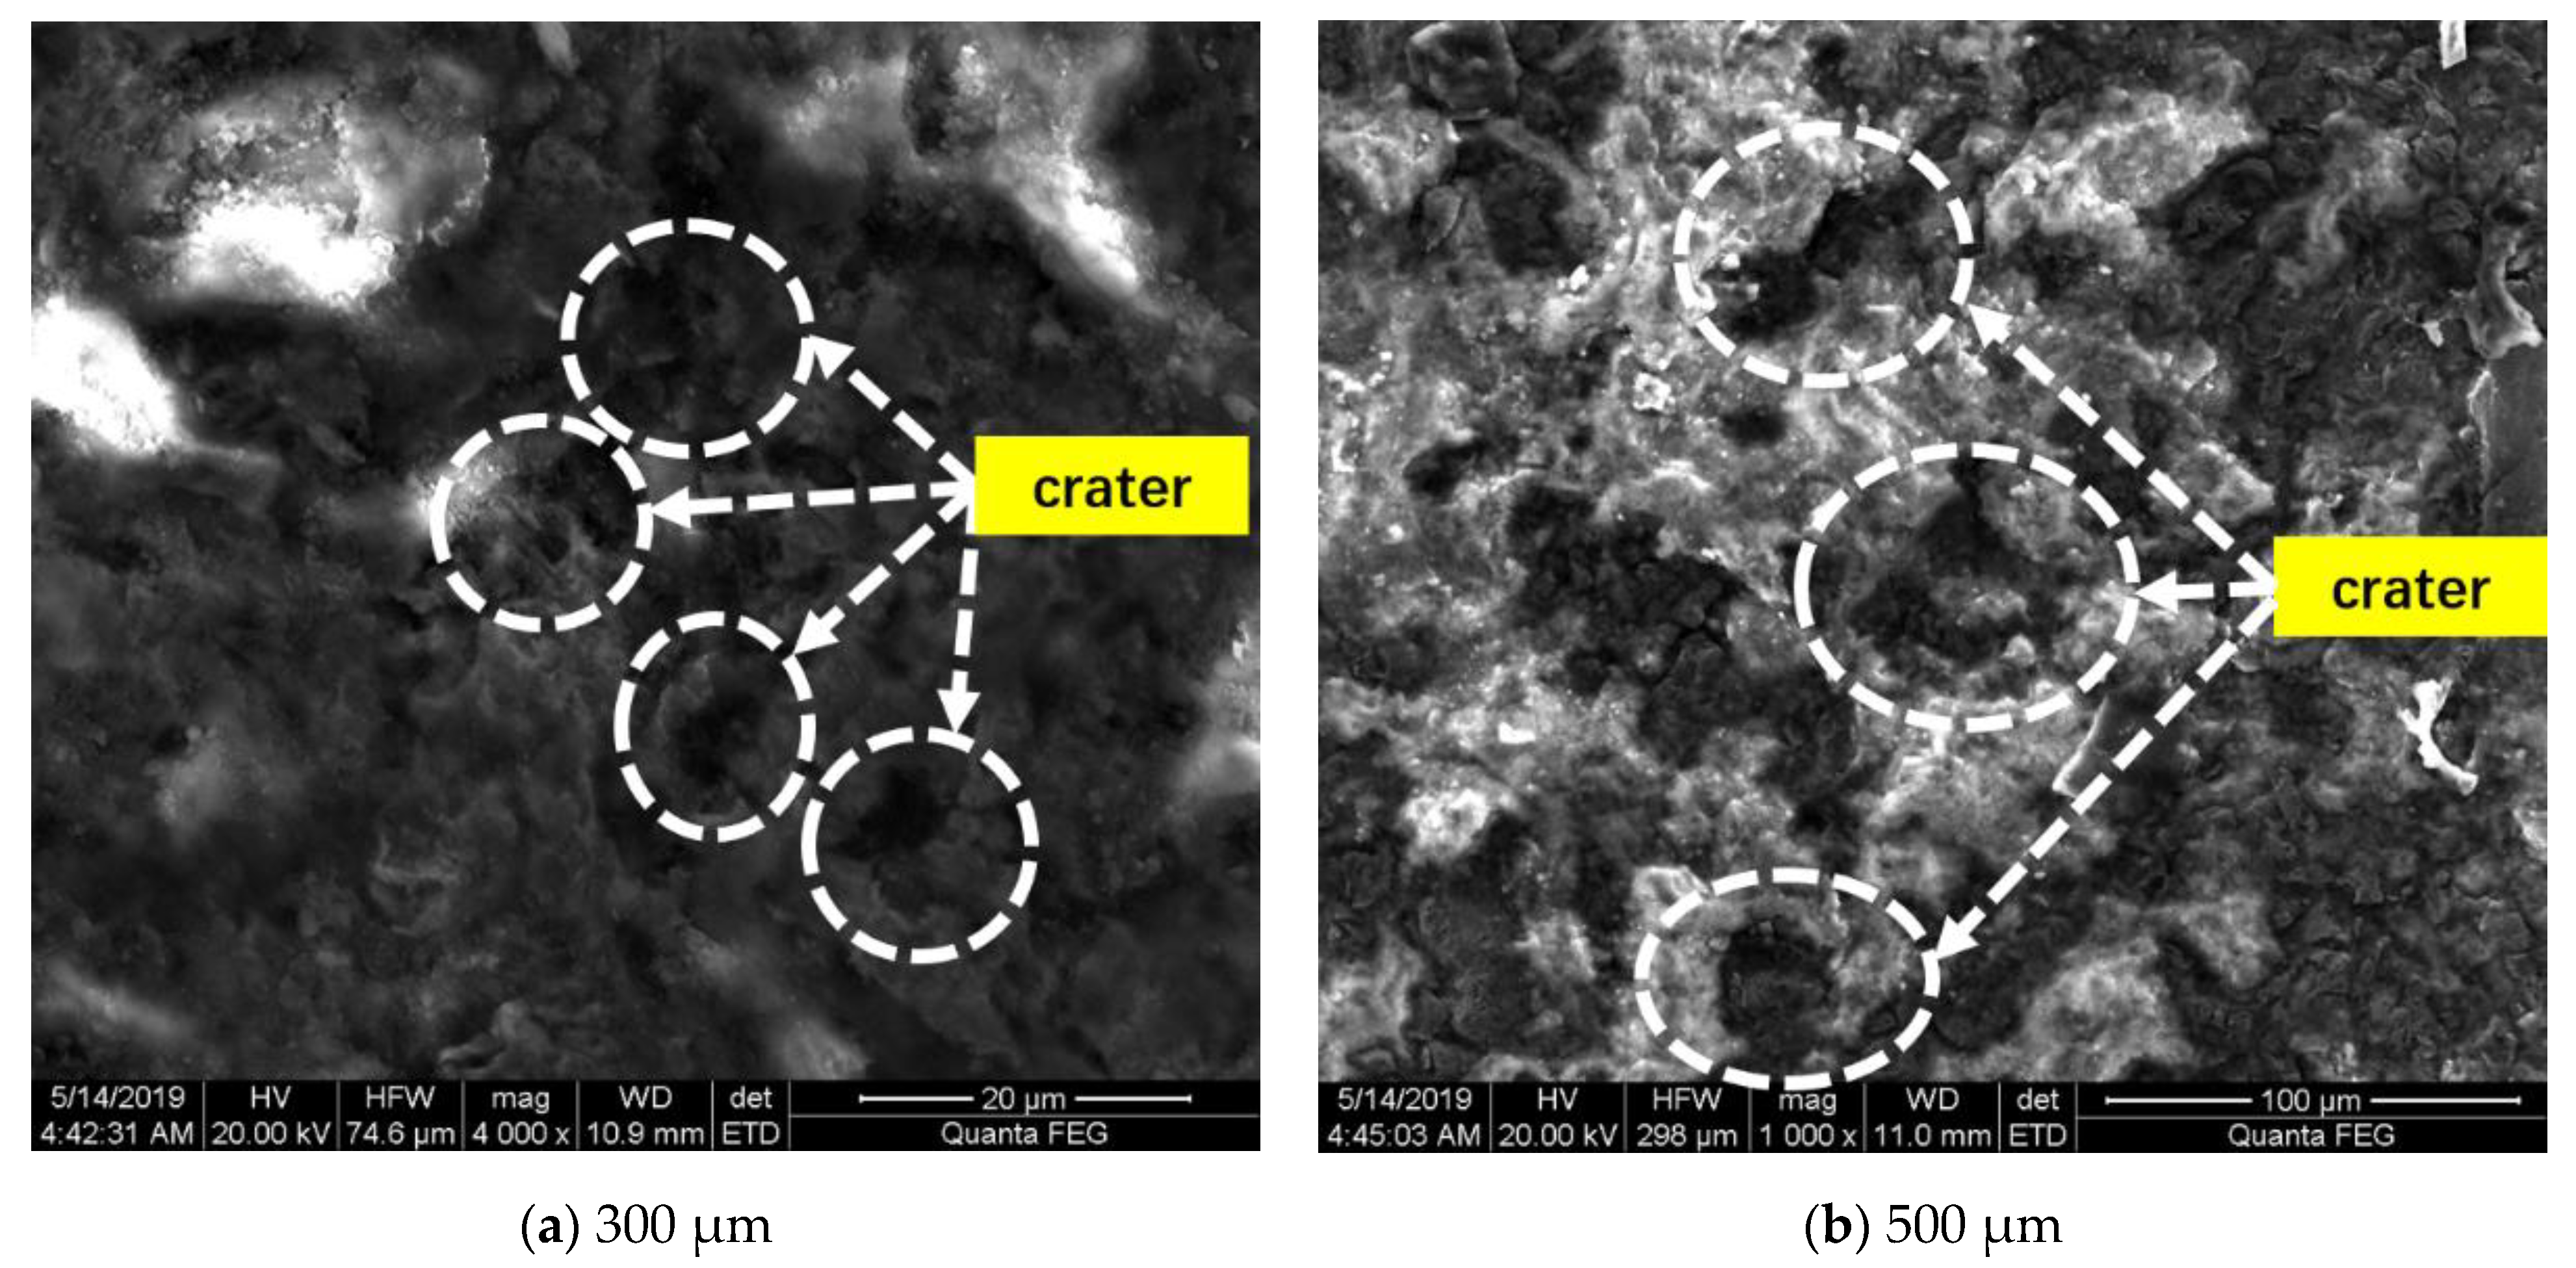
Figure 5 shows the SEM images of the erosion involving sand particles of 300 μm and 500 μm in size at a speed of 45 m/s and an impact angle of 90°. The sizes of pits on the specimen surface increased in conjunction with an increase in the particle sizes, indicating that the larger the particle size, the higher the erosion rate.

Figure 5.
SEM images of erosion specimen surface exposed to different particle sizes. (a) The appearance of 300 μm particle impact specimen (b) The appearance of 500 μm particle impact specimen.
3. CFD Simulation and Analysis
To fully verify the reliability of the test data, CFD was used to simulate similar erosion behavior and comparatively analyze the test results. The CFD simulation method assesses the flow field distribution law by introducing the basic conservation equation, as well as the initial and boundary conditions. In this paper, the ANSYS Fluent [25] software (Version 18.0, Ansys, Pittsburgh, PA, USA) was used to simulate the erosion behavior of the gas–solid two-phase flow impact specimen.
This study regarded gas as the continuous phase and solid particles as the discrete phase using the Euler-Lagrange method [26]. In the Euler coordinate system, considering a shear stress transfer (SST) k-ω turbulence model, the motion of the continuous phase is obtained [27]. In the Lagrange coordinate system, the discrete phase motion is tracked using the discrete particle model (DPM) and Newton’s second law. Without considering the influence of particle motion on fluid motion, the unidirectional coupling method was used in this paper to obtain the flow field, velocity, and angle of particles impacting the specimen plane via CFD and particle tracking. Then, the Oka erosion model and Forder et al. [28] particle–wall rebound model were used to predict the erosion wear of the specimen [29].
3.1. Numerical Model and Boundary Condition Settings
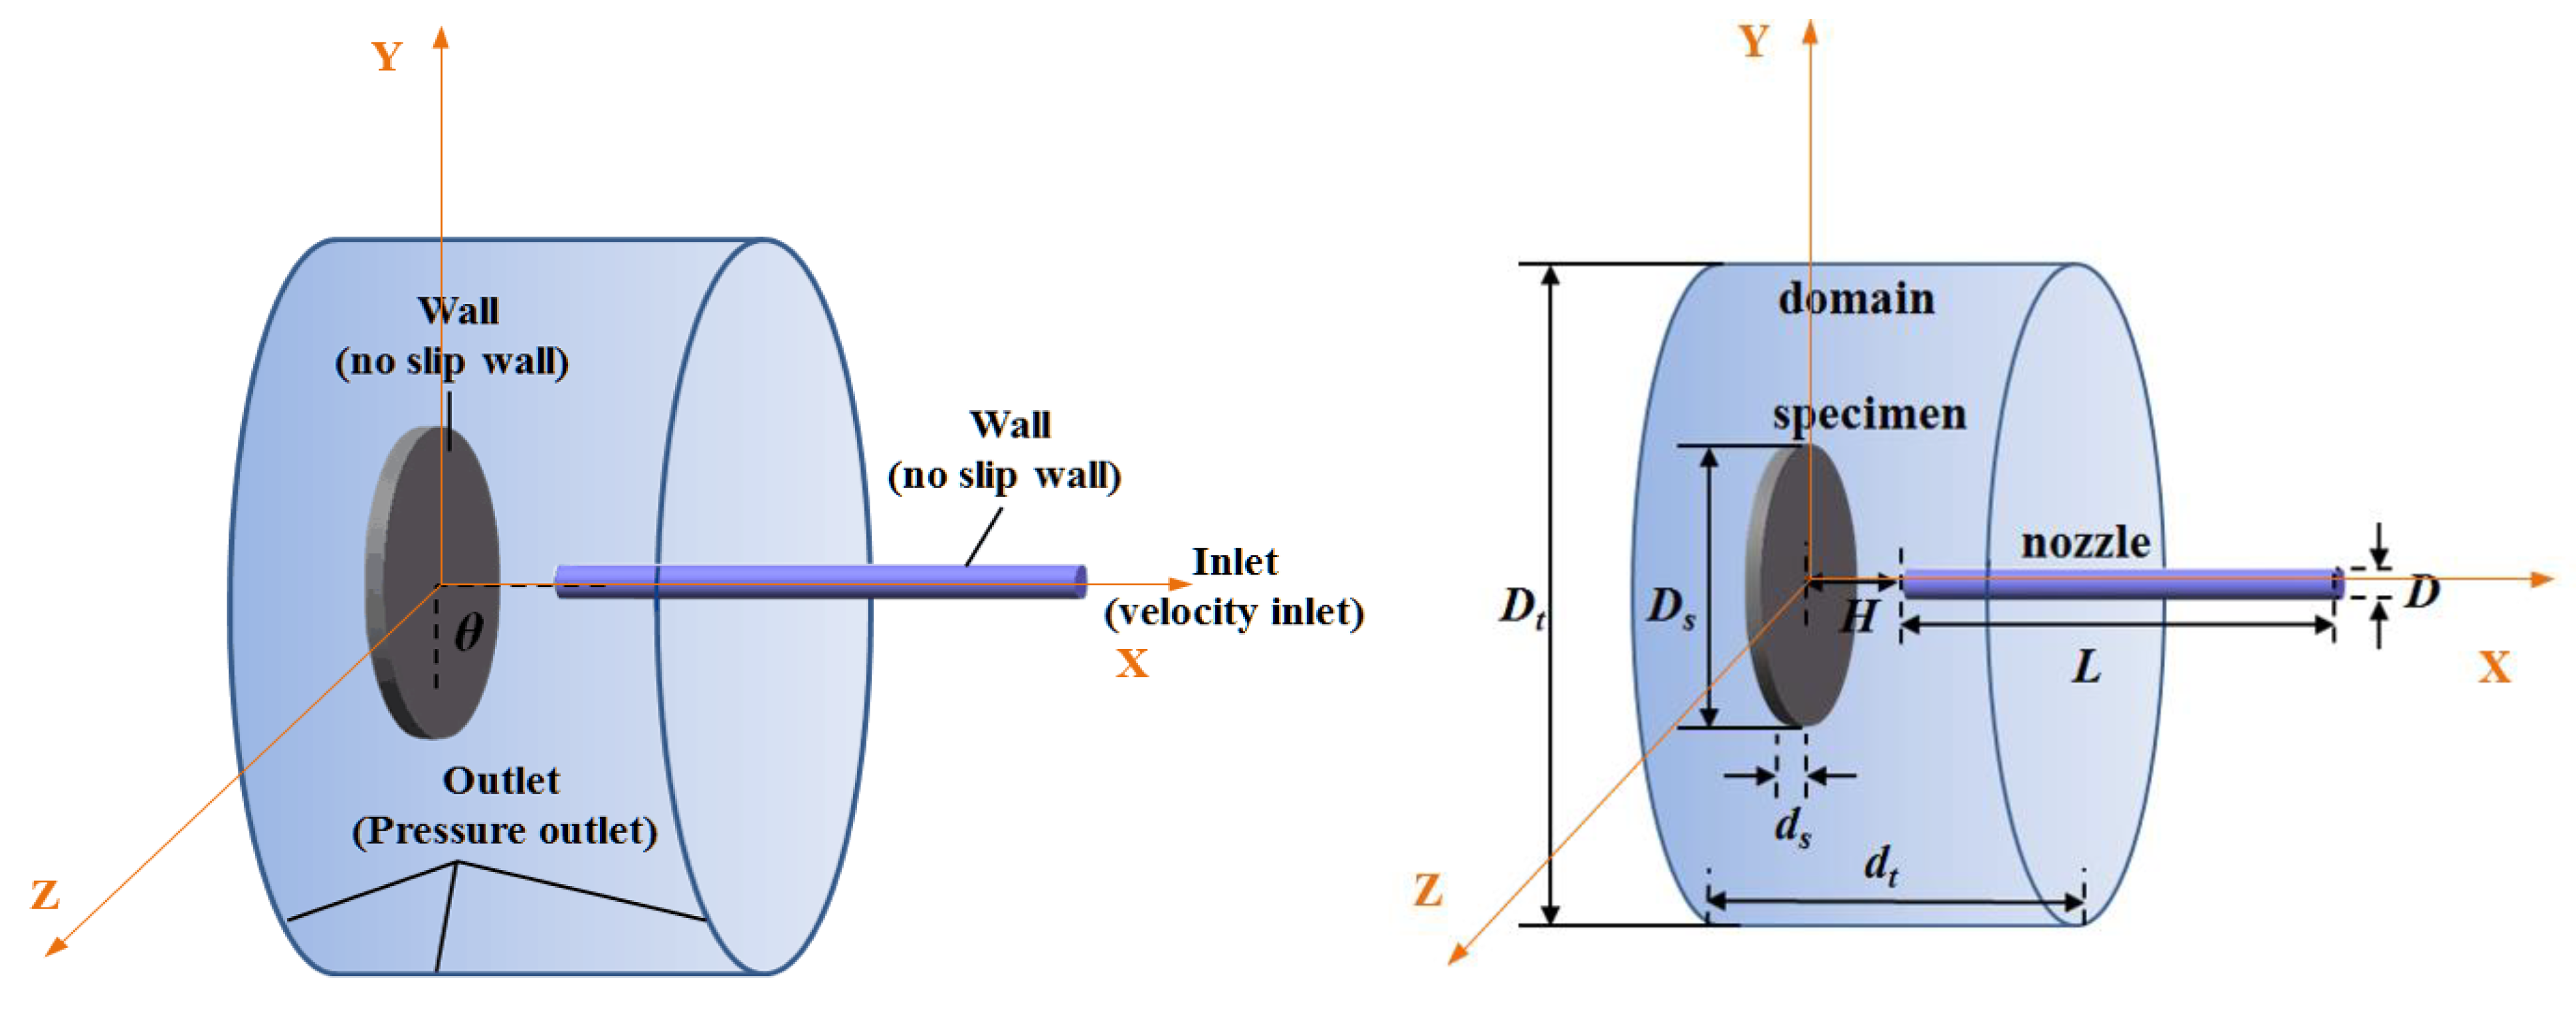
The numerical CFD simulation model corresponding to the follow-up experiments was established (Figure 6) with the following parameters: the nozzle diameter was D = 7 mm with a pipe wall thickness of 2 mm and a length of Ln. The distance from the nozzle to the specimen center line was H = 12.7 mm, with a specimen diameter of DS = 30 mm, and thickness of ds = 4 mm. The shape of the external computational fluid domain was cylindrical, in which the diameter of the external flow field was Dt = 100 mm, and the length was dt = 60 mm. The specimen center was in the positive center of the external flow field, while the angle between the specimen plane and the nozzle centerline was about 30° to 90°, and H did not change in conjunction with θ.
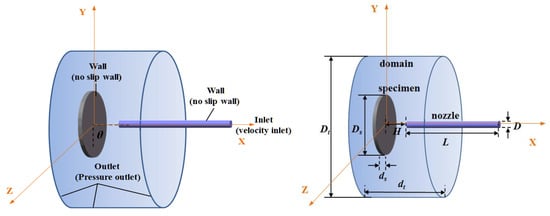
Figure 6.
Numerical model and boundary condition diagram of the gas-solid two-phase flow impact specimen test.
The detailed geometry features, numerical schemes, and boundary conditions in the CFD simulation are listed in Table 2. To avoid the influence of the number of particles on the final erosion result, this paper refines the nozzle entrance grid size to increase the number of particles incident from the nozzle, and sets the entrance grid size to 0.06 mm, making the number of entrance grids reach 12,520.
Table 2.
Geometry features, numerical schemes, and boundary conditions in computational fluid dynamics (CFD).
3.2. Grid Independence Test
To ensure that the fluid formed a steady flow at the nozzle outlet and did not affect the analysis results under the boundary outlet conditions while reaching the maximum calculation accuracy, it was necessary to determine the optimal nozzle length.
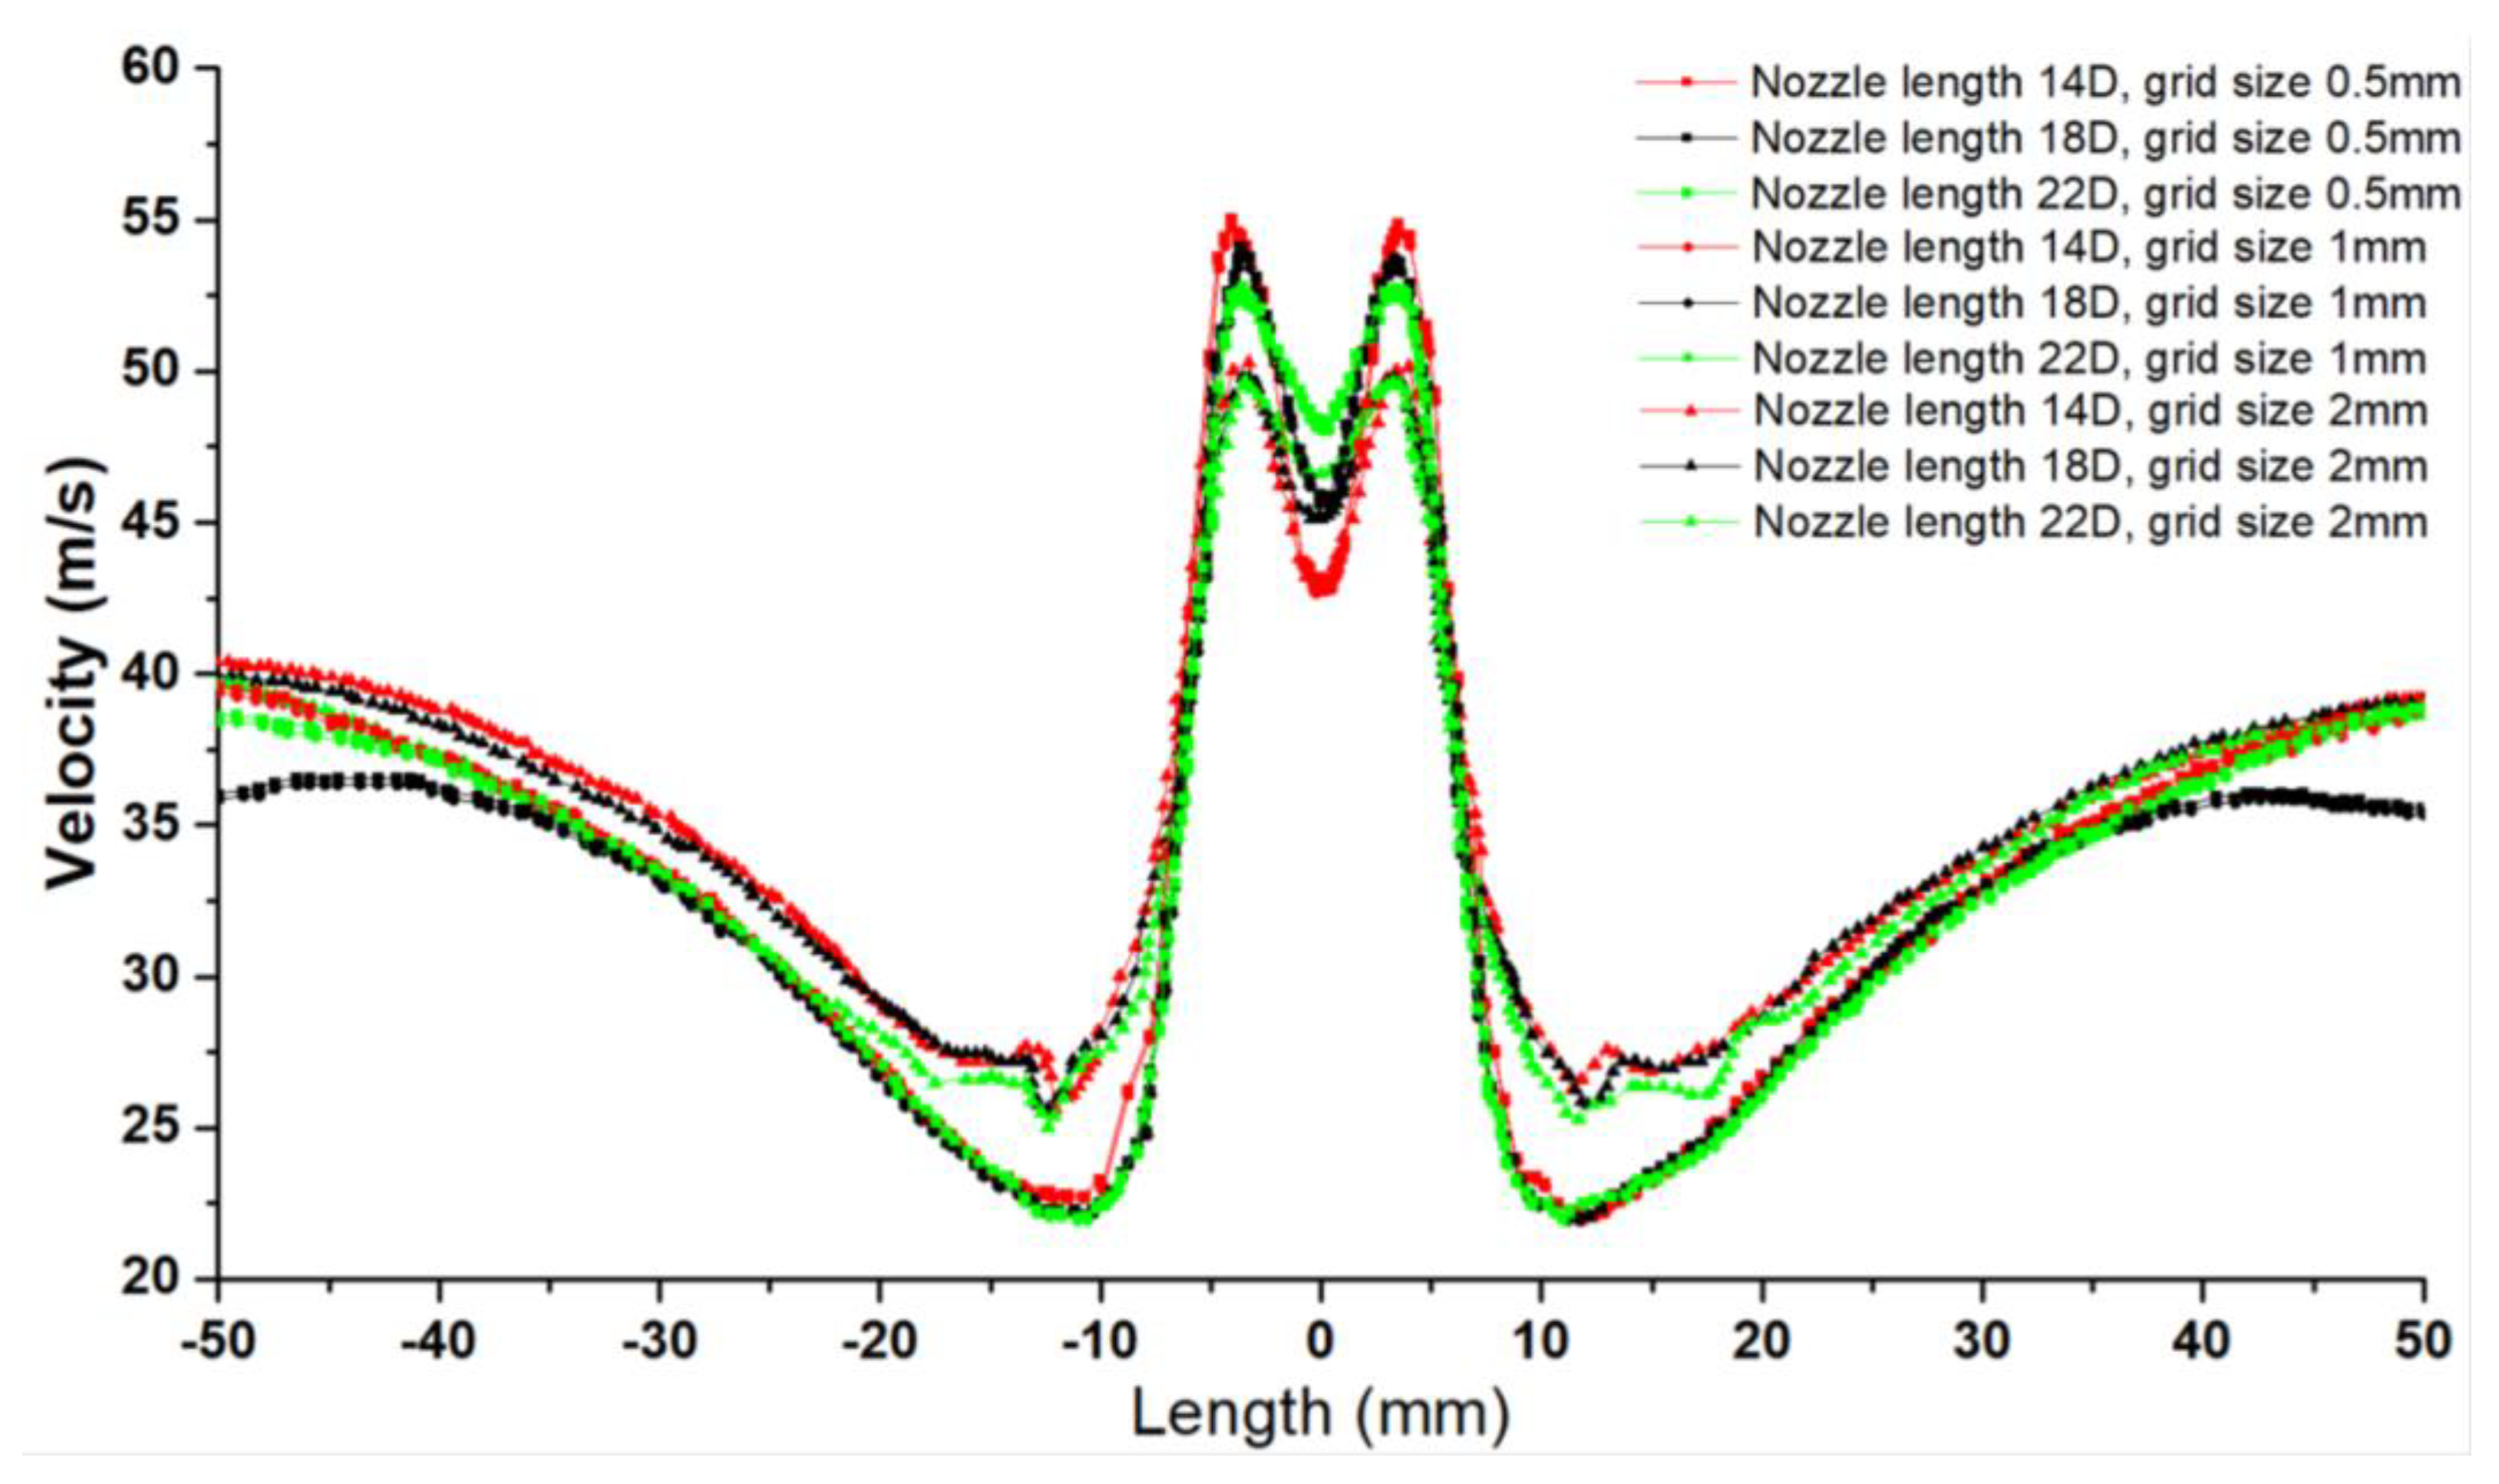
At an inlet fluid velocity of 60 m/s, a particle velocity of 19 m/s, a particle mass flow rate of 5e × 10−5 kg/s, and a particle size of 300 μm, the velocity distribution of the flow field at the H/3 position of the XOY plane in different working conditions was compared at nozzle lengths of 14 D, 18 D, and 22 D, and grid densities of 1 mm and 2 mm, respectively.
From Figure 7, it is evident that the maximum velocity occurred within 5 mm around the center of the specimen. In addition, the maximum velocity was located at a point 1.5 times that of the nozzle radius from the specimen center. Furthermore, the velocity at the point directly opposite to the specimen center was relatively small, mainly because a high-pressure zone in this location led to the maximum velocity at a certain distance away from itself. Therefore, the overall velocity curve at H/3 on the specimen surface presented a W shape. Based on the result, the average variation of the velocity achieved by the 1 mm and 2 mm grid was about 4.9 pct. For the 0.5 mm and 1 mm gird, their axial velocity variation was about 0.6 pct. Therefore, the simulation model was not sensitive to the gird number, using the 0.5 mm and 1 mm grid. The computational time required by the 0.5 grid was 2.3 times than by the 1 mm grid. Furthermore, computational time required by the nozzle lengths of 22 D was 1.13 times than that of 14 D. This paper analyzed the 1 mm grid size and the 14 D nozzle length.

Figure 7.
Velocity distributions at H/3 on the specimen surface at different nozzle lengths and grid sizes.
3.3. CFD Simulation Results
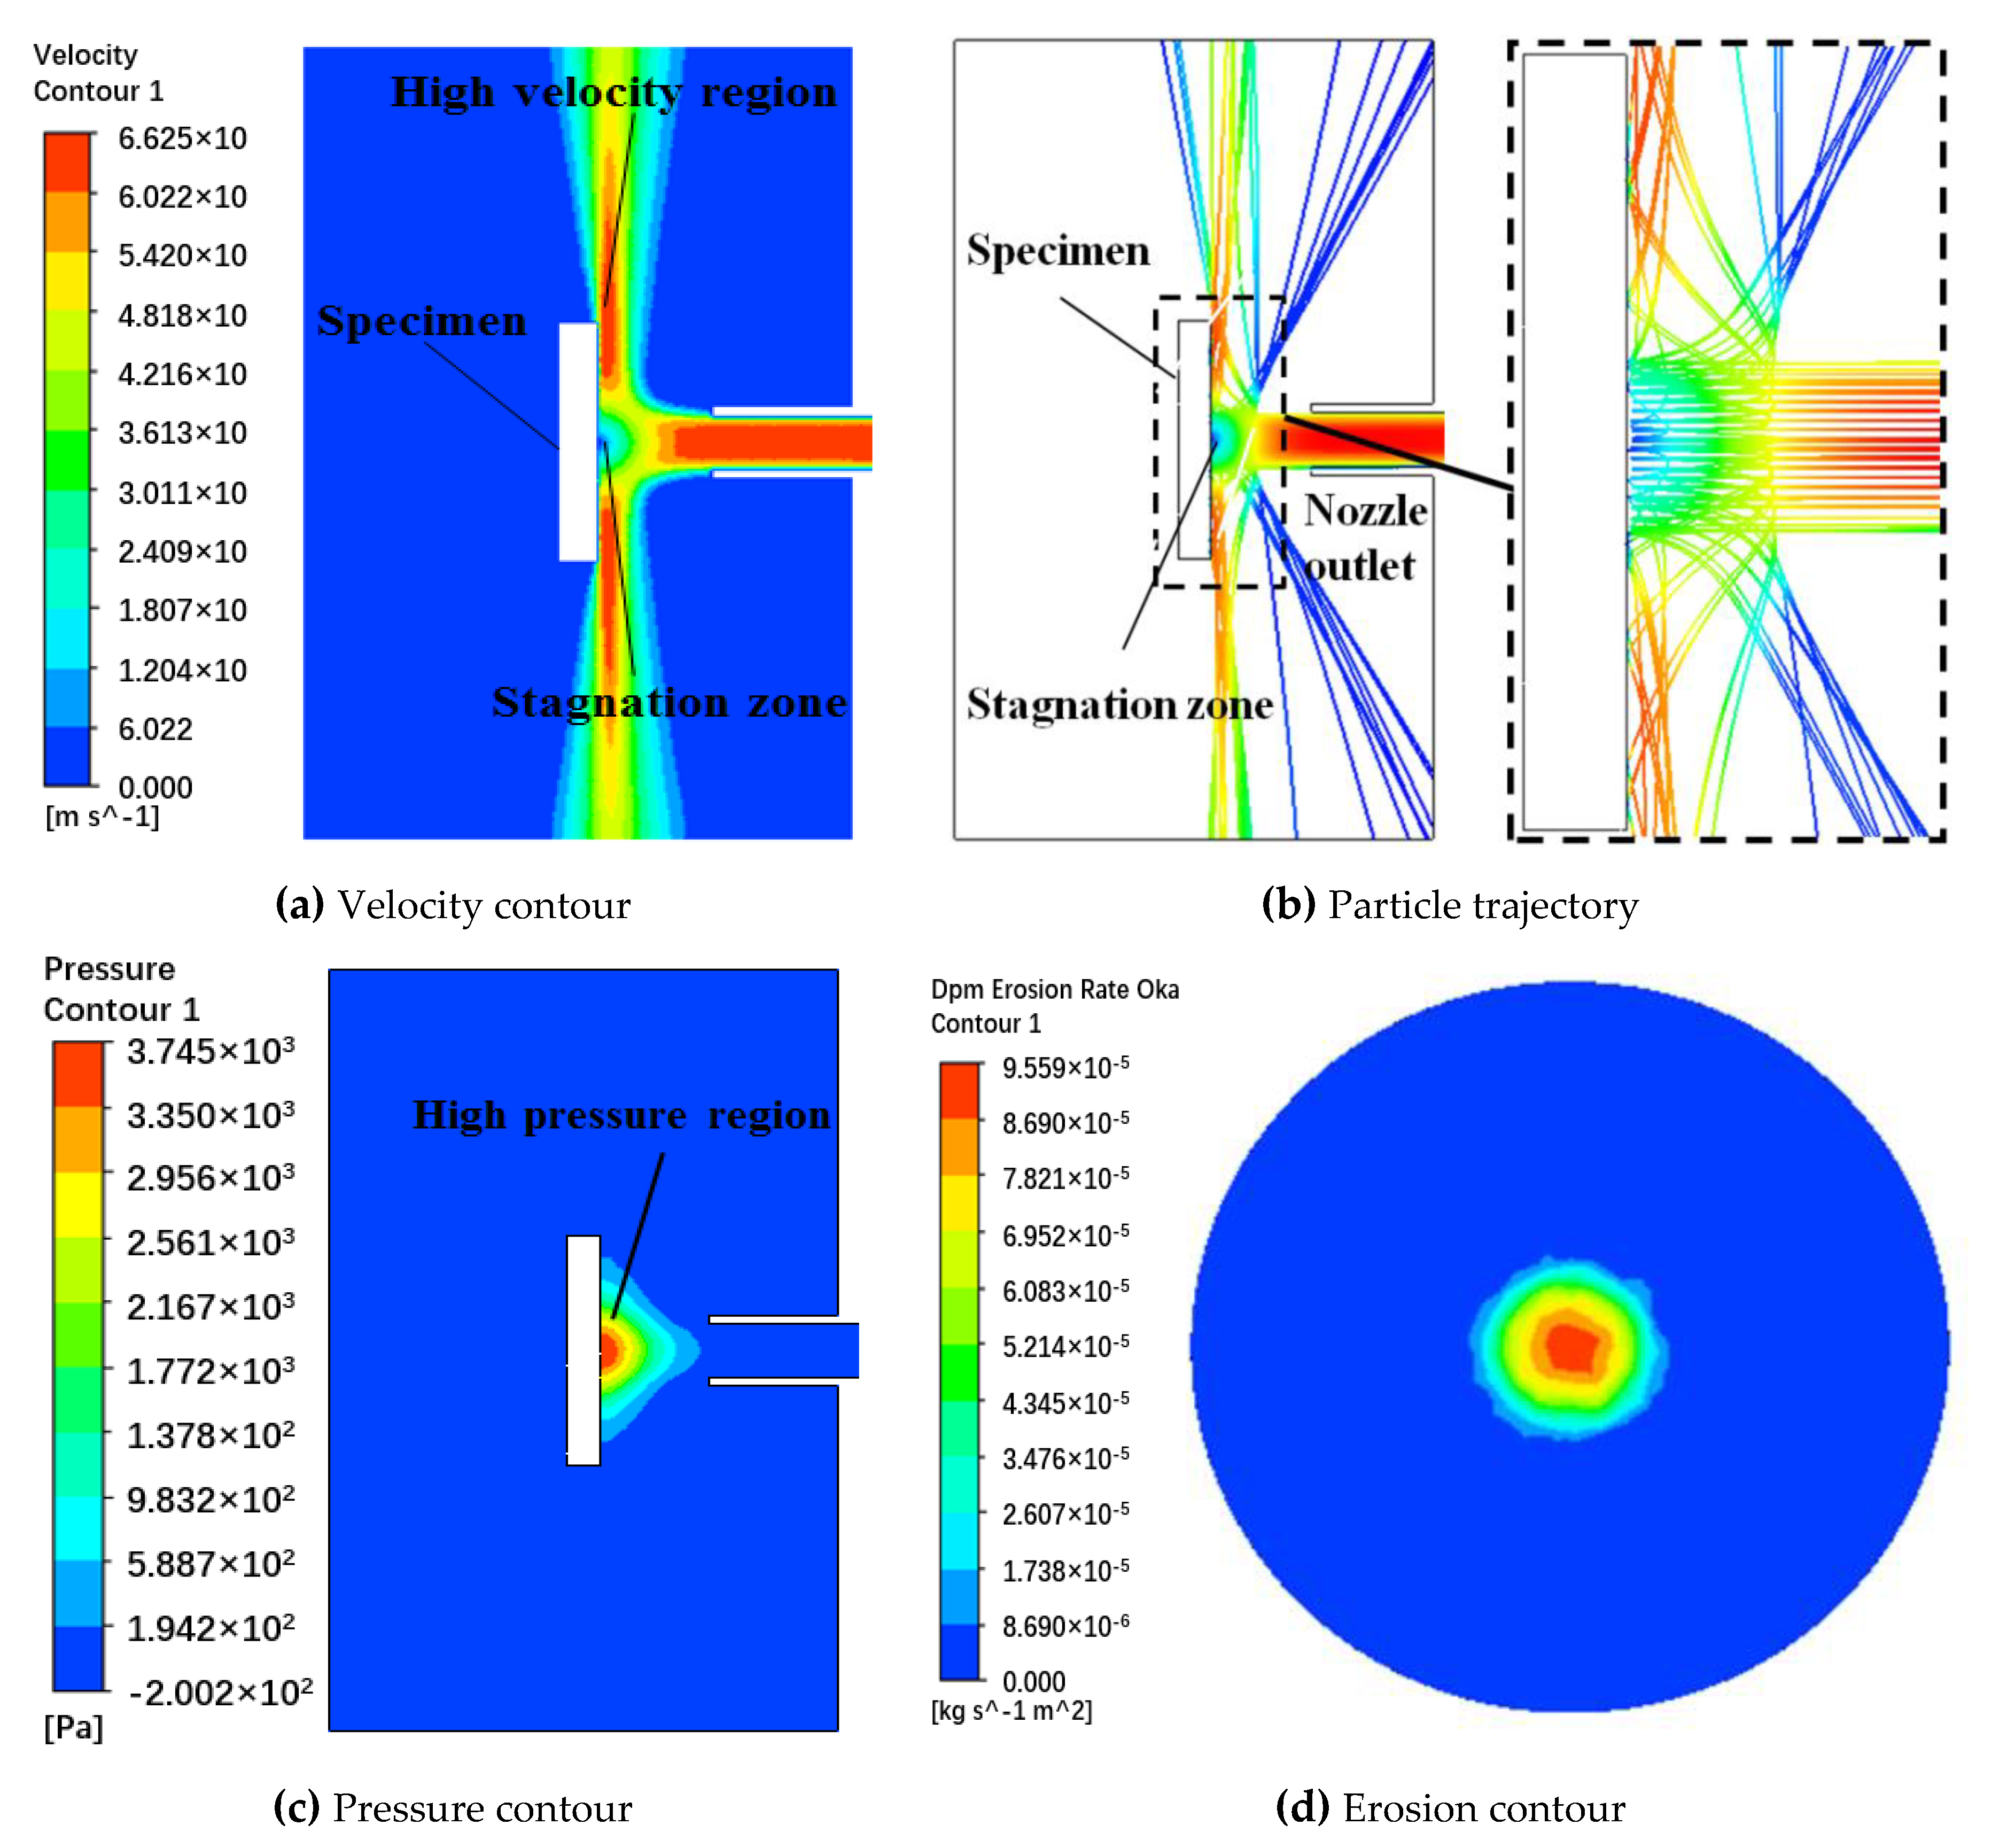
Figure 8 shows the impact simulation results obtained using CFD at a 60 m/s gas velocity at the nozzle inlet, as well as a particle velocity of 19 m/s, and a particle size of 300 μm, while illustrating the velocity nephogram, the particle trajectory map, the pressure nephogram, and the erosion nephogram.

Figure 8.
CFD analysis results. (a) Particle velocity contour. (b) Particle trajectory. (c) Specimen pressure contour. (d) Specimen erosion contour.
Figure 8a indicates that the maximum velocity in the flow field was located at the centerline of the nozzle. When the gas–solid mixture reached the specimen center (i.e., the stagnation zone), the velocity decreased to 0 m/s, and the diameter of the stagnation zone was approximately the same as that of the nozzle. Additionally, Figure 8b shows that the particles ejected from the nozzle rebounded after directly impacting the specimen surface. The gas–solid two-phase flow exhibited a larger Stokes number, and the momentum transfer between the gas and sand particles was lower. Moreover, the particles continued to move according to the original trajectory when exposed to the action of inertial force until they impacted the specimen surface, forming a circular erosion zone. The particles that collide with the specimen surface might be involved in a secondary collision at a higher speed, rebounding into the outer fluid domain. Figure 8c shows the formation of a static pressure zone at the specimen center, while the gas velocity near the center of the specimen decreased continuously. The maximum velocity region on the surface of the specimen was located at a nozzle radius of 2–2.5 times from the specimen center and decreased in a radial direction. According to Figure 8d, the diameter of the erosion area was basically the same as that of the nozzle, while the maximum erosion position was located in the center of the specimen center, indicating that the erosion rate became lower further away from the specimen center. Furthermore, it was evident that the interface was U-shaped due to erosion.
3.4. Comparative Analysis of the Different Parameters
In an experiment, Vieira [12] measured the particle velocity using particle image velocimetry (PIV) and found the presence of a slip velocity between the particles and the gas at the nozzle outlet. The particle velocity was 0.317 times lower than the gas velocity. When the gas velocity was 45 m/s, 55 m/s, and 60 m/s, the particle velocity was 14 m/s, 17 m/s, and 19 m/s.
3.4.1. Simulation Analysis at Different Impact Angles
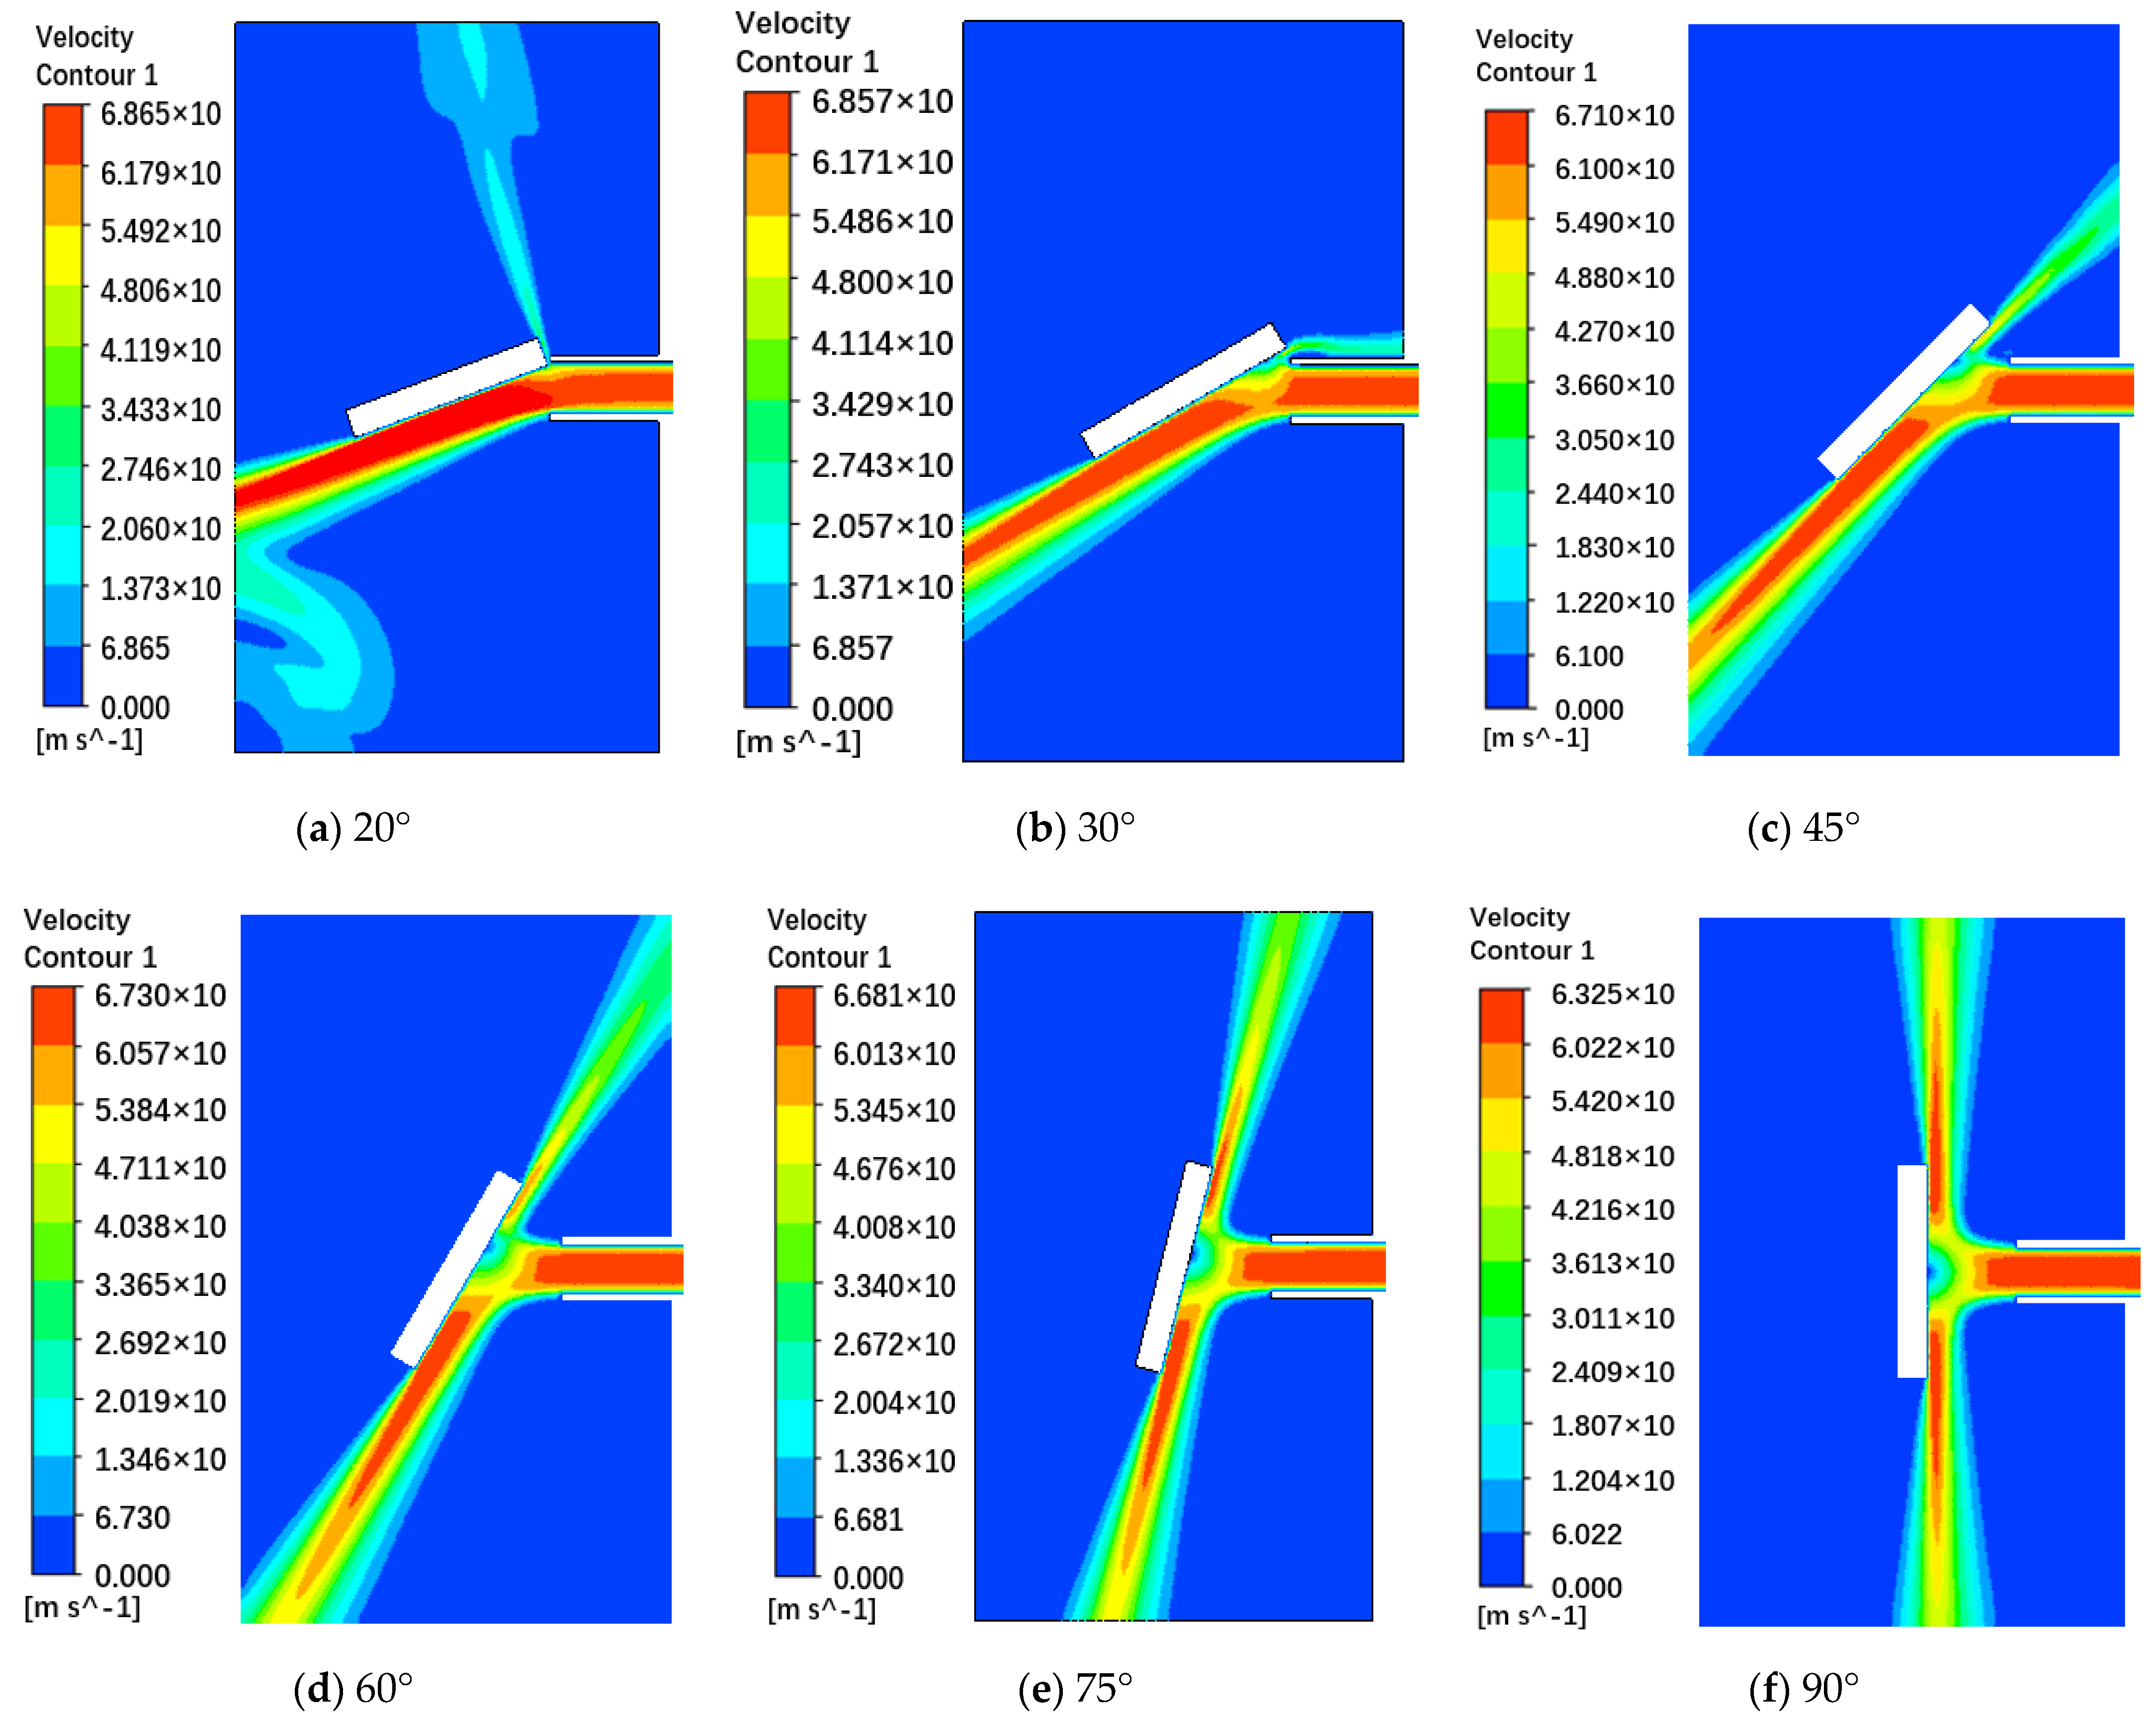
A Q235 carbon steel specimen and sand particles of 300 μm in size were selected for the experiment. The air velocity at the nozzle inlet was altered to 45 m/s, 55 m/s, and 60 m/s, while the impact angle between nozzle and specimen was adjusted to 20°, 30°, 45°, 60°, 75°, and 90°, respectively. Considering a nozzle inlet velocity of 60 m/s as an example, the velocity nephogram of the XOY plane at different angles is shown in Figure 9, the particle trajectory is shown in Figure 10, and the erosion nephogram is shown in Figure 11.
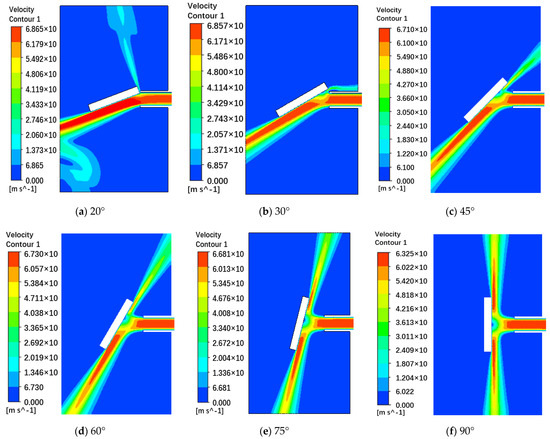
Figure 9.
A comparison of the velocity nephogram results at different impact angles (vg = 60 m/s, vp = 19 m/s, and dp = 300 μm). (a) 20° impact velocity nephogram. (b) 30° impact velocity nephogram. (c) 45° impact velocity nephogram. (d) 60° impact velocity nephogram. (e) 75° impact velocity nephogram. (f) 90° impact velocity nephogram.
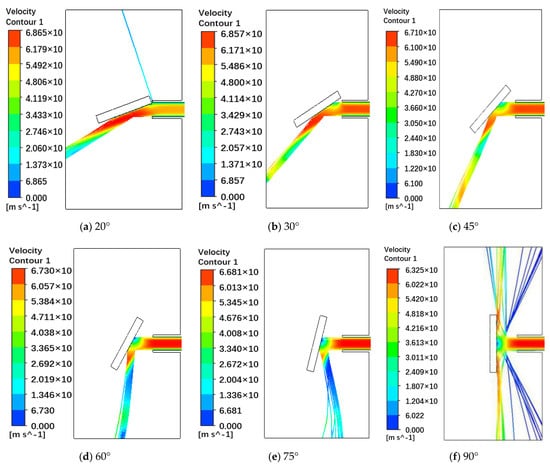
Figure 10.
A comparison of particle trajectory at different impact angles (vg = 60 m/s, vp = 19 m/s, and dp = 300 μm). (a) Particle trajectories after 20° collision. (b) Particle trajectories after 30° collision. (c) Particle trajectories after 45° collision. (d) Particle trajectories after 60° collision. (e) Particle trajectories after 75° collision. (f) Particle trajectories after 90° collision.

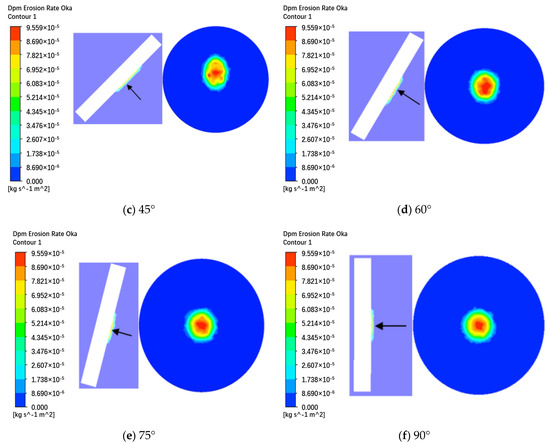
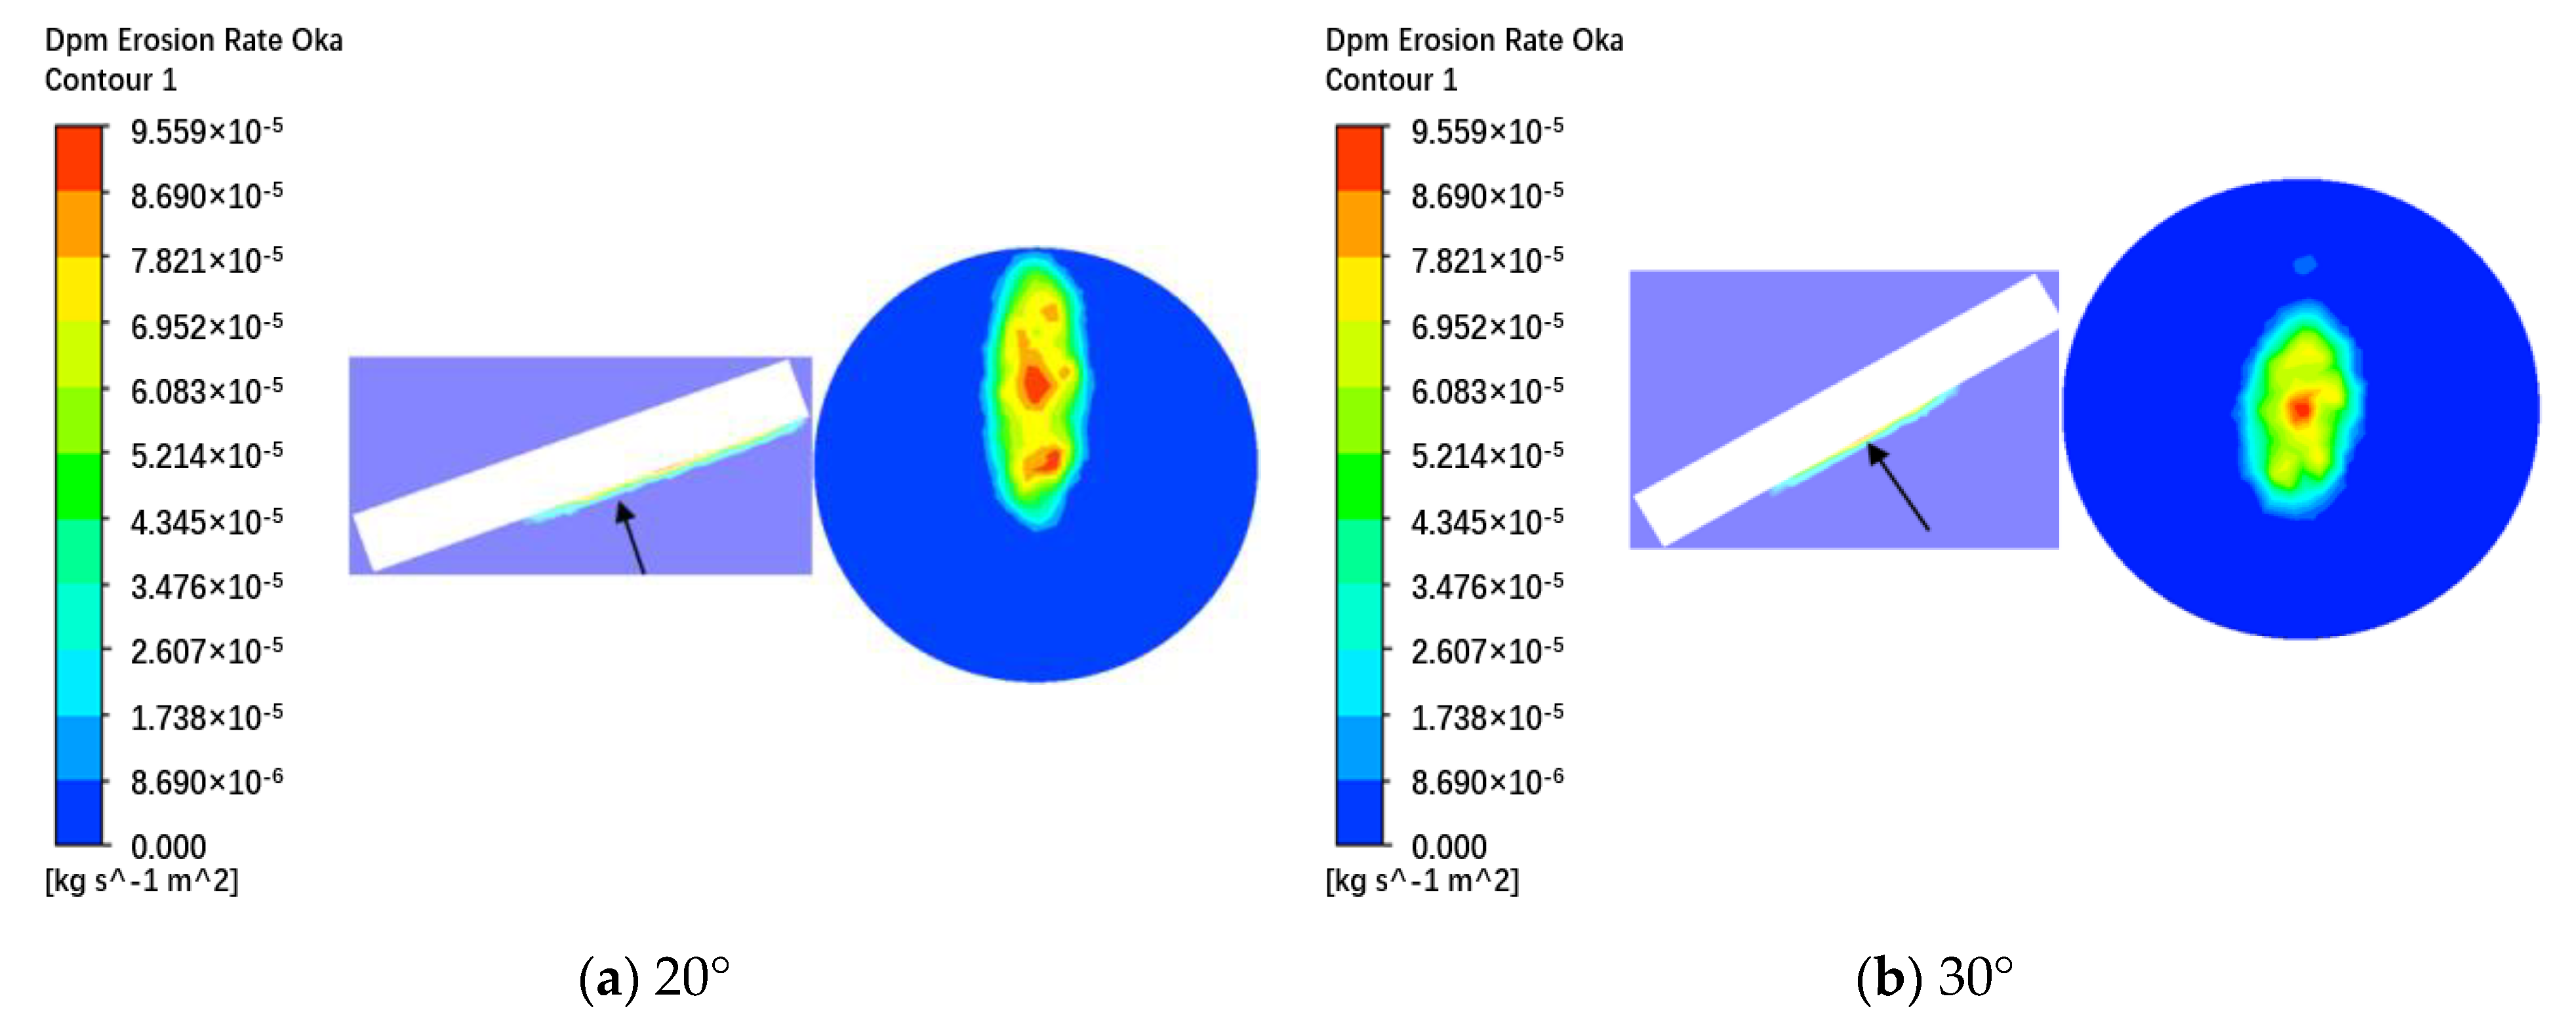
Figure 11.
A comparison of the erosion nephogram results at different impact angles (vg = 60 m/s, vp = 19 m/s, and dp = 300 μm). (a) 20° impact erosion nephogram. (b) 20° impact erosion nephogram. (c) 20° impact erosion nephogram. (d) 20° impact erosion nephogram. (e) 20° impact erosion nephogram. (f) 20° impact erosion nephogram.
According to Figure 9, when the impact angle is below 90°, the fluid flows from the nozzle and to the side at a larger angle. Furthermore, “retention zones” are evident on the specimen surface at different angles. However, when the angle between the specimen and the nozzle decreases, the location of the retention zone gradually moves from the center of the specimen to its upper side.
As shown in Figure 10, when the angle between the specimen and the nozzle is lower than 90°, the particles collide with the specimen surface and rebound to the side at a larger angle between the specimen and the nozzle, while the air does not affect the particle movement.
According to Figure 11, the maximum erosion positions at different impact angles are located in the central area of the specimen. When the angle is 20° and 30°, the erosion area is elliptical. Increasing the angle between the specimen and the nozzle causes the erosion area to gradually change from elliptical to circular. The length of the cloud image in the direction perpendicular to the screen is basically the same, while the length along the surface direction of the specimen on the XOY section increases and a decrease in the erosion position occurs at the center of the specimen at different angles. When the inclination angles of the specimens are 20°, 30°, 45 °, 60°, 75°, and 90°, the lengths of the angle decrease.
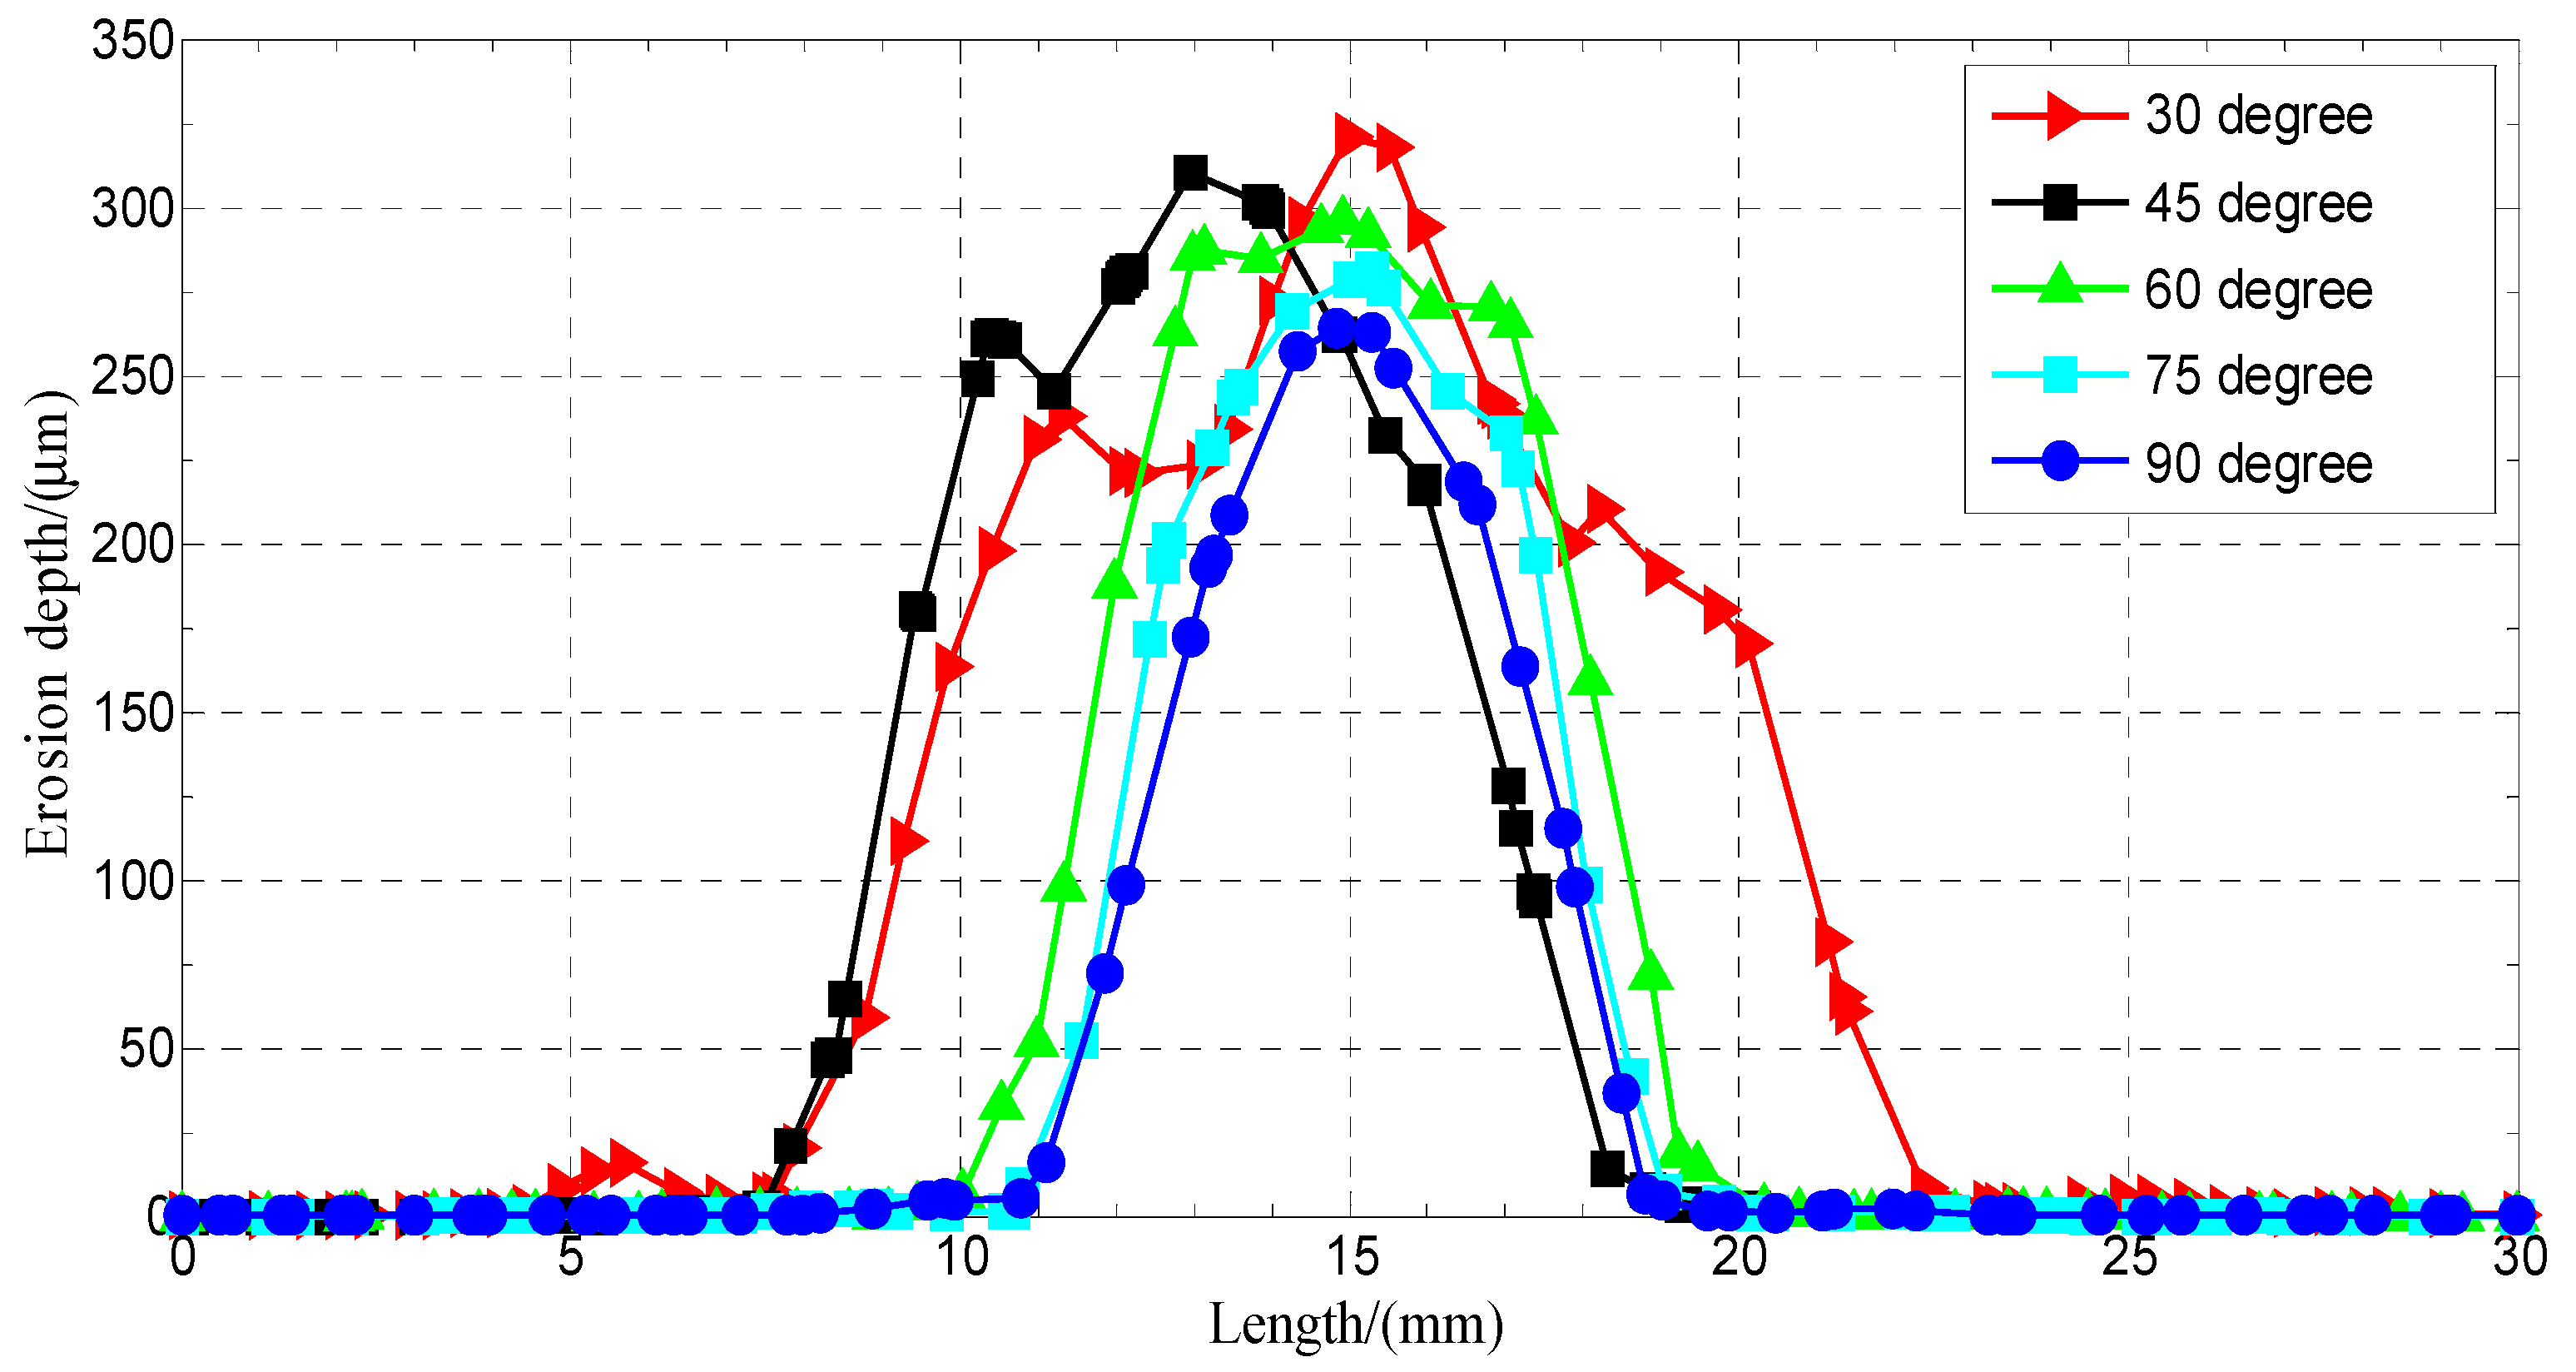
In engineering practices, the failure of equipment is mainly related to erosion depth. The greater the erosion depth, the higher the failure risk. Figure 12 shows the variations in erosion depth on the intersecting line formed by the XOY plane and the right surface of the specimen. The abscissa denotes the distance from the upper point to the lower point of the intersecting line formed by the XOY plane and the inner surface of the specimen, while the ordinate is the erosion depth. Therefore, the maximum erosion areas are 17 mm, 15 mm, 12.5 mm, 10 mm, 8.5 mm, and 8 mm, respectively, while the maximum erosion area is located in the center of the specimen at different impact angles.
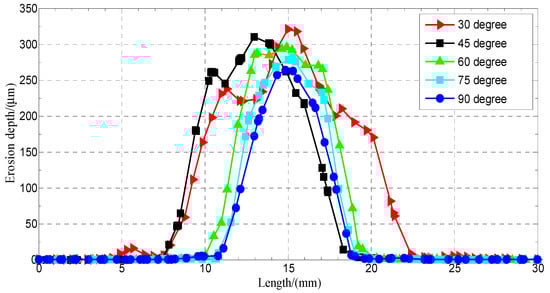
Figure 12.
The erosion depth distribution on the specimen surface at different impact angles (vg = 60 m/s, vp = 19 m/s, and dp = 300 μm).
3.4.2. Comparative Analysis of the Erosion Simulation at Different Velocities and Particle Sizes
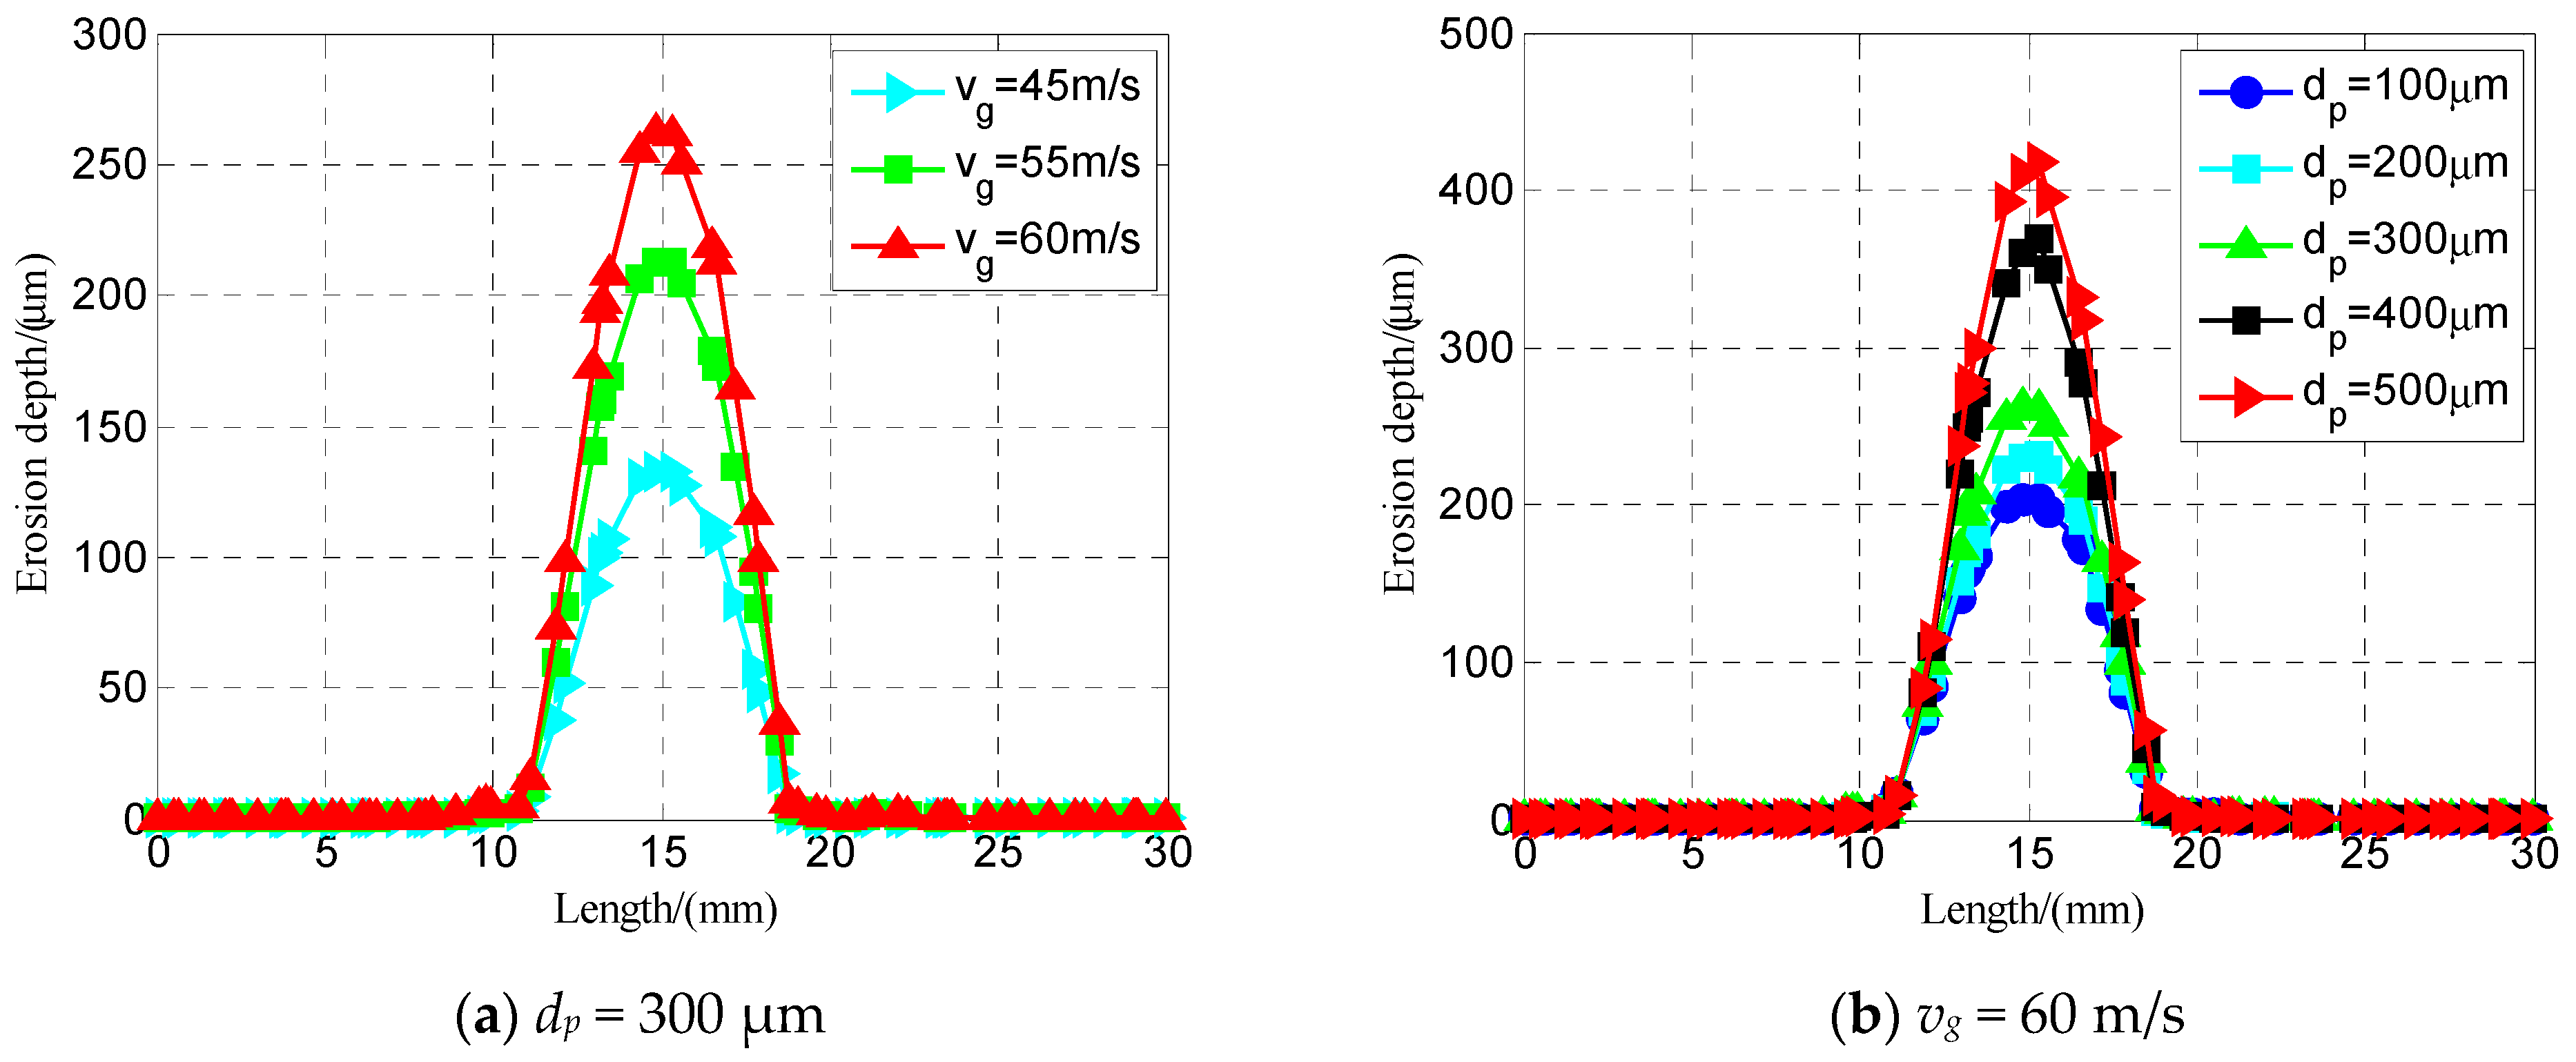
Figure 13a,b compares the effect of gas velocity and particle size on erosion depth at the intersecting line between the XOY plane and the specimen surface. The erosion area was within 4 mm from the specimen center, while the maximum erosion area was located in the center of the specimen surface. When the Q235 carbon steel specimen with a particle size of 300 μm was selected with a consistently maintained 90° angle between the specimen and the nozzle, and respective gas velocities set at 45 m/s, 55 m/s, and 60 m/s, the corresponding erosion depths were 102.9 μm, 175.5 μm, and 264.5 μm, respectively. When the angle between the specimen and the nozzle was kept at 90°, with an air velocity of 60 m/s, and particle sizes of 100 μm, 200 μm, 300 μm, 400 μm, and 500 μm, the corresponding erosion depths were 204.2 μm, 231.4 μm, 263.5 μm, 368.1 μm, and 418.4 μm, respectively. Therefore, it is evident that the erosion depth increases with an increase in the gas velocity and particle size. These results indicated that the gas velocity and particle size might be related to higher kinetic energy, leading to an increase in the material removal rate. In addition, the change in gas velocity and particle size did not affect the erosion mode.
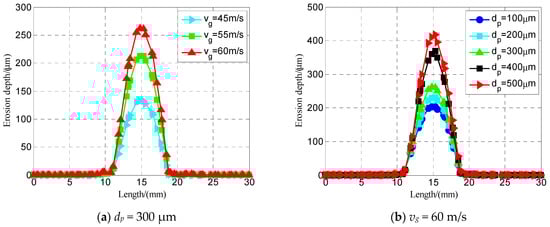
Figure 13.
A comparison of the erosion depth at different velocities and particle sizes (θ = 90°). (a) Depth erosion at different air velocities (dp= 300 μm). (b) Erosion depth at different particle diameters (vg = 60m/s).
4. Results and Discussion
4.1. A Comparative Analysis of the Simulation Results and Erosion Models
4.1.1. Analysis of the Erosion Law at Different Velocities and Specimen Angles
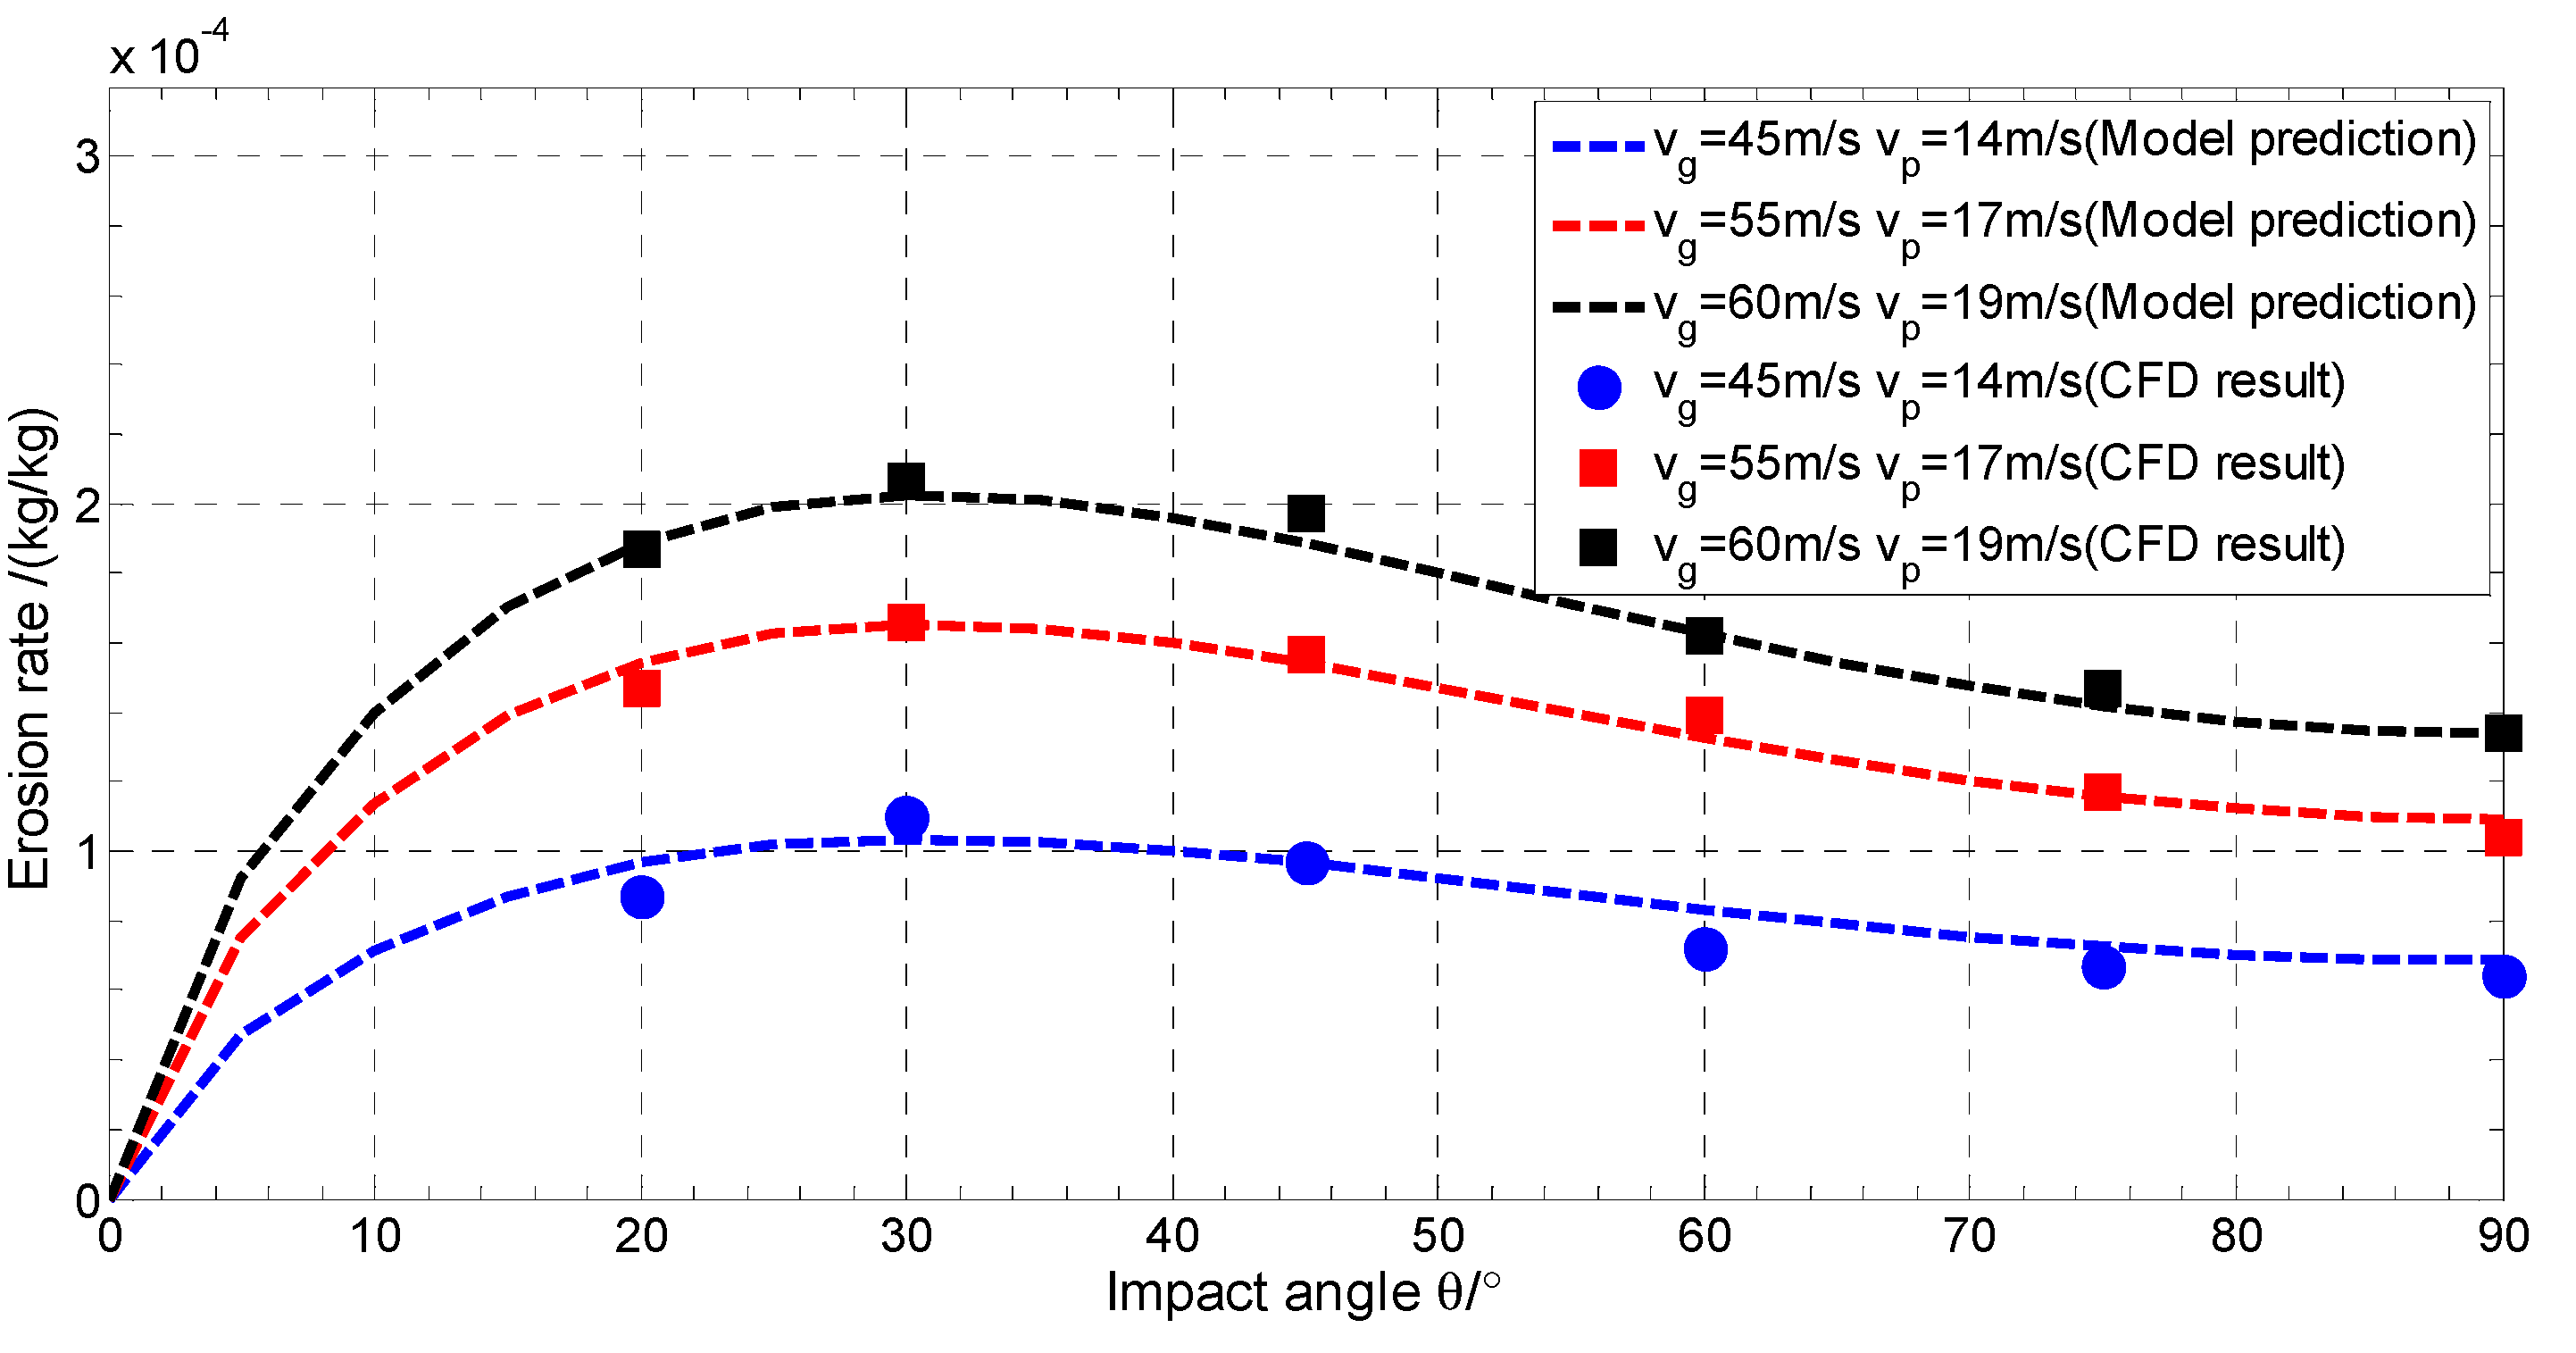
At a particle size of 300 μm, as well as adjusted impact angles (20°, 30°, 45°, 60°, 75°, and 90°) and gas velocities (45 m/s, 55 m/s, and 60 m/s), the comparison diagrams denoting the CFD simulation results and erosion model results of the different specimen materials (Q235 carbon steel, A304 stainless steel, and 6061 aluminum alloy) are shown in Figure 14, Figure 15 and Figure 16:

Figure 14.
A comparison between the simulation and erosion models of the Q235 carbon steel specimen (vg = ~45–60 m/s, vp = ~14–19 m/s, dp = 300 μm, and θ = ~20°–90°).
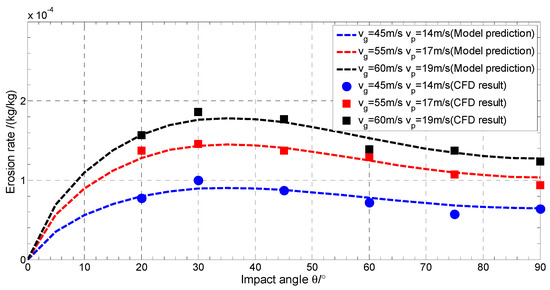
Figure 15.
A comparison between the simulation and erosion models of the A304 stainless steel specimen (vg = ~45–60 m/s, vp = ~14–19 m/s, dp = 300 μm, and θ = ~20°–90°).
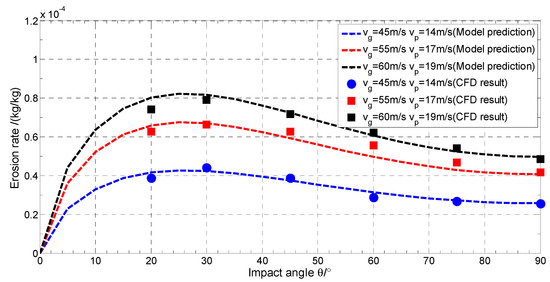
Figure 16.
A comparison between the simulation and erosion models of the 6061 aluminum alloy specimen (vg = ~45–60 m/s, vp = ~14–19 m/s, dp = 300 μm, and θ = ~20°–90°).
According to these images, the simulation results of the different materials at different angles, gas velocities, and particle velocities were close to the theoretical predictions. Due to the difference in hardness between the three specimens, the erosion rate of the Q235 carbon steel was slightly higher than that of the A304 stainless steel, while the erosion rates of both these materials were about 2.5 times that of the 6061 aluminum alloy. In addition, the erosion rate could be used to characterize the mass-loss rate. Given that the material density of the 6061 aluminum alloy was approximately one third of Q235 carbon steel and A304 stainless steel, it can be stated that the volume loss of these three materials was similar.
4.1.2. A Comparison of the Erosion Results at Different Angles and Particle Sizes
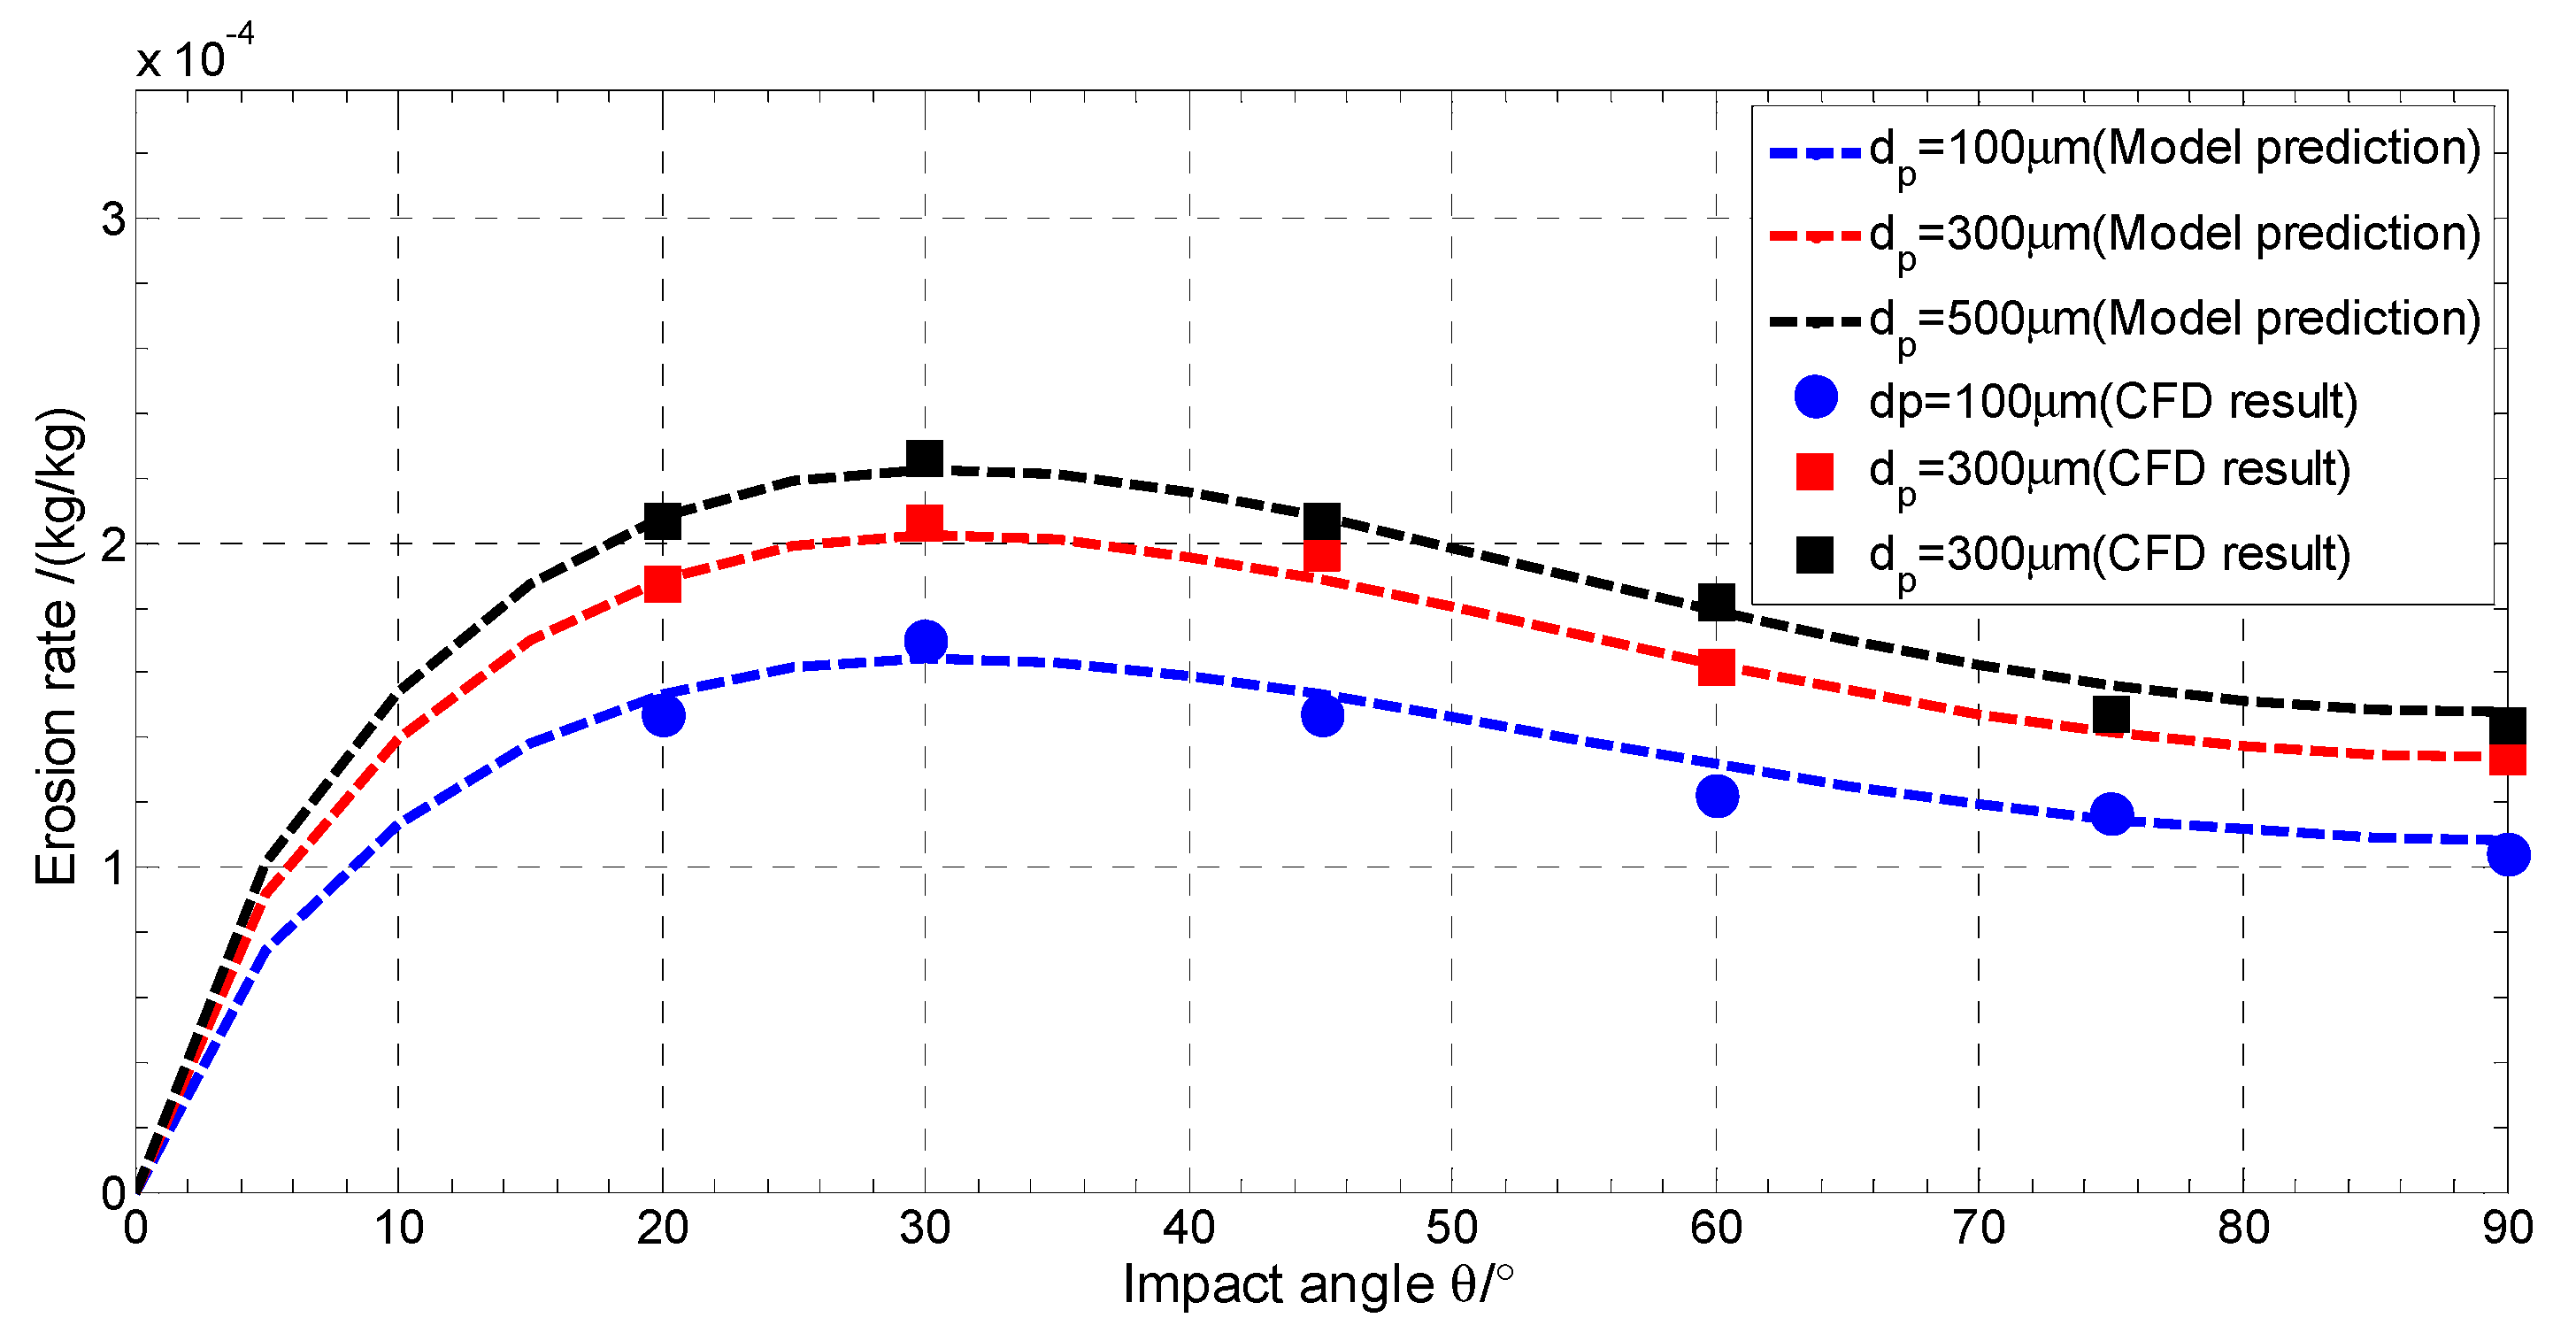
When the same material (Q235 carbon steel) specimen was selected, with adjusted impact angles of 20°, 30°, 45°, 60°, 75°, and 90°, and particle sizes of 100 μm, 300 μm, and 500 μm, respectively, the contrast diagram denoting the CFD erosion simulation results and erosion model is represented by Figure 17.
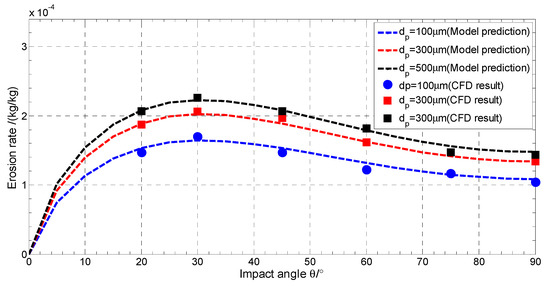
Figure 17.
A comparison diagram of the erosion rate at different impact angles and particle sizes (using Q235 carbon steel and a gas velocity of vg = 60 m/s).
According to the image, the simulation results were generally similar to the theoretical prediction. The erosion rate increased in conjunction with an increase in the particle size, but the erosion effect caused by the particle velocity exceeded that of the particle diameter.
4.2. Analysis of the Simulation Results and Experimental Data
4.2.1. A Comparative Analysis of the Different Gas Velocities and Impact Angles
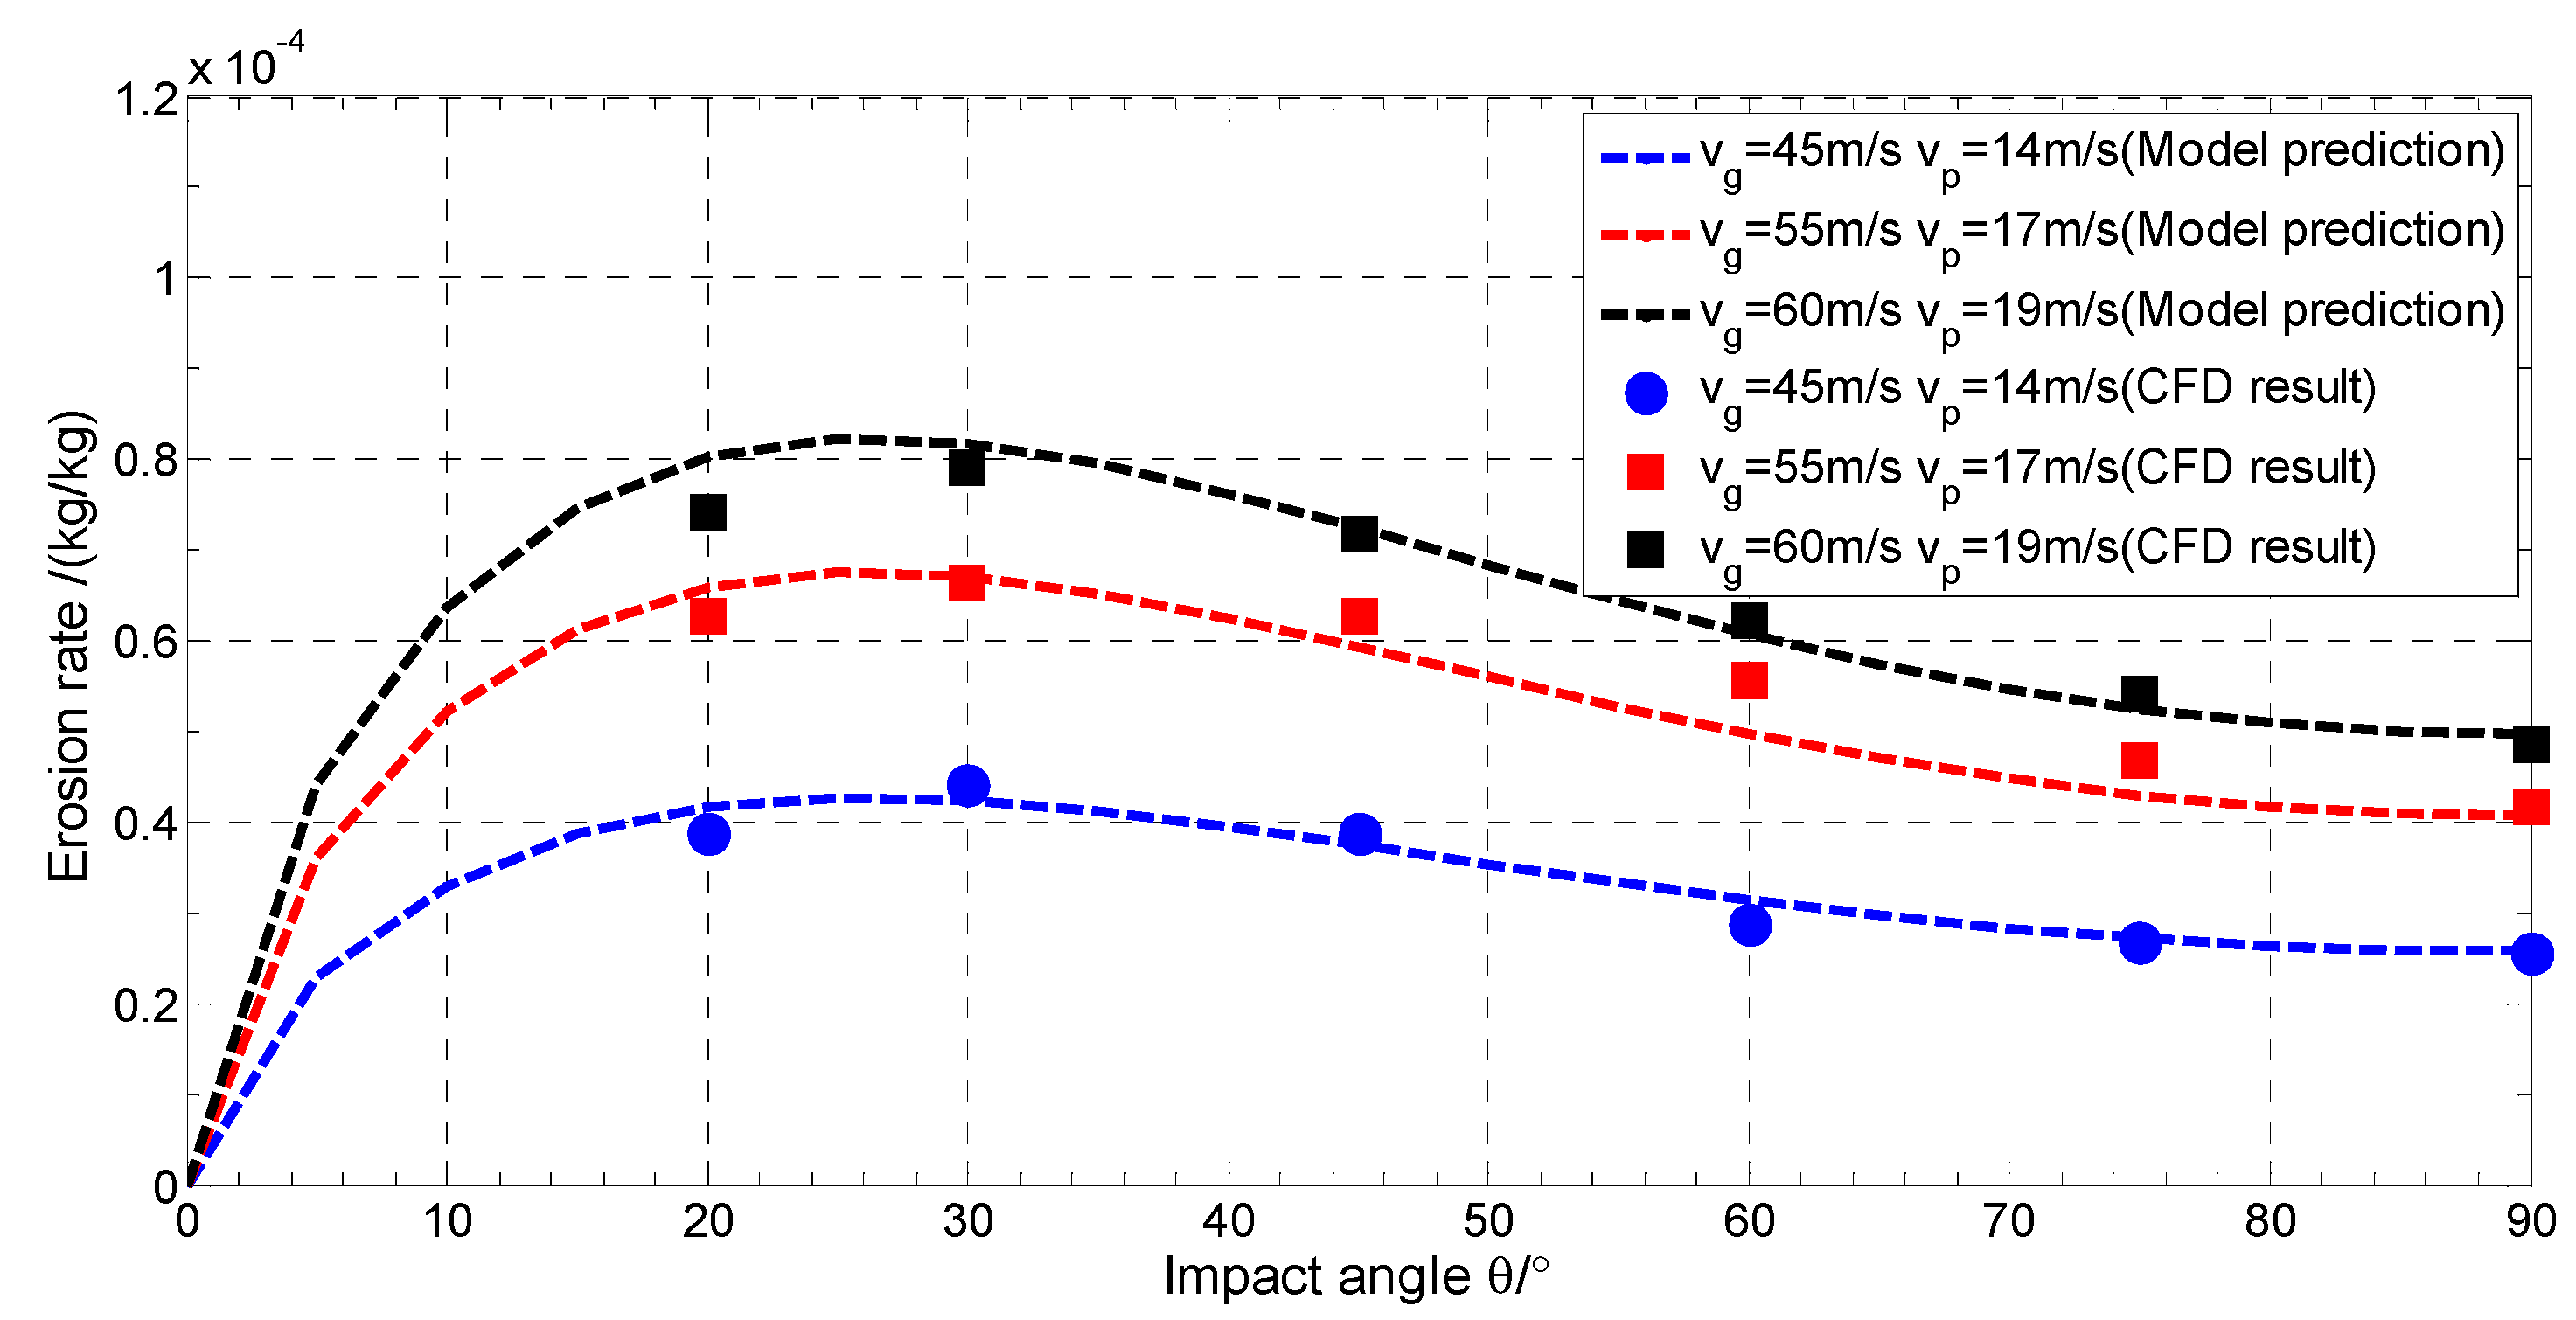
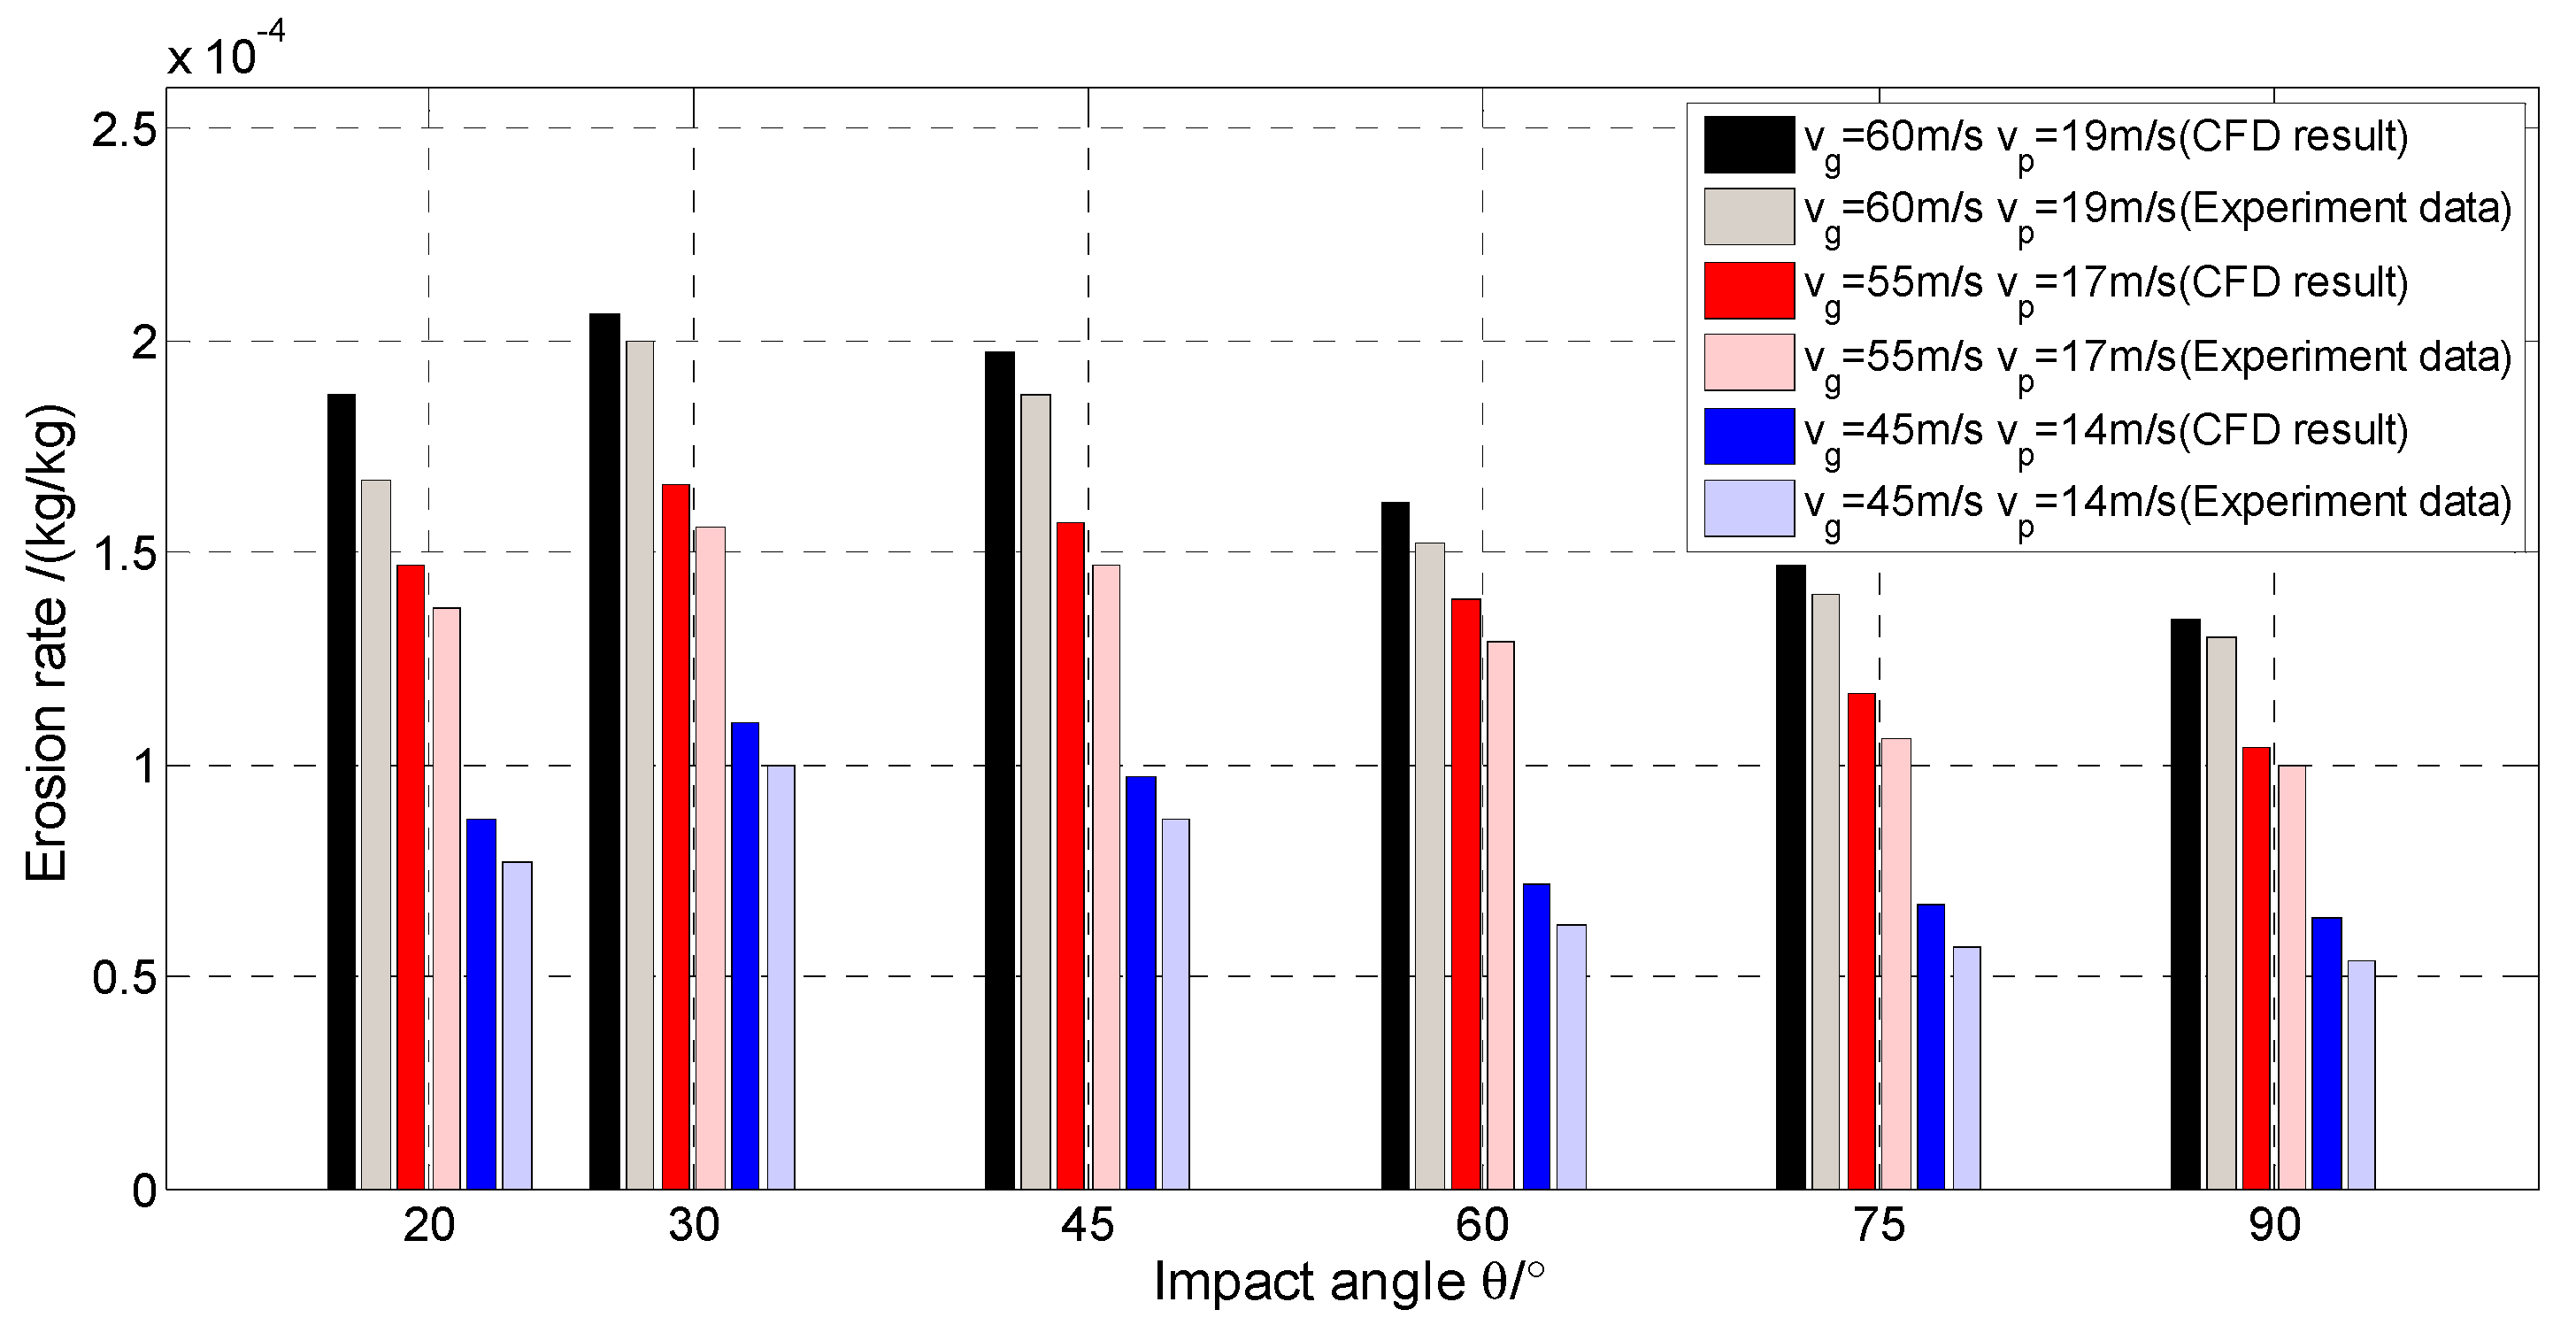
Figure 18 shows the comparison diagram denoting the erosion rates of the simulation and experimental data of the Q235 carbon steel specimen at different gas velocities and impact angles, indicating that the erosion rate of the simulation and test increases at a higher velocity. In addition, the maximum error between the simulation data and the experimental data was about 15.6%, which can be ascribed to two reasons. First, the particle size cannot be accurate and uniform during the experimental process, and some particles form a circle, resulting in more severe erosion. Second, the interaction between the particles and the rebound particles is ignored during the CFD simulation process.

Figure 18.
The comparison diagram denoting the erosion rates of the CFD simulation and experimental data at different particle velocities (Q235 carbon steel and particle size dp = 300 μm).
4.2.2. The Comparative Analysis of Different Materials at Different Impact Angles
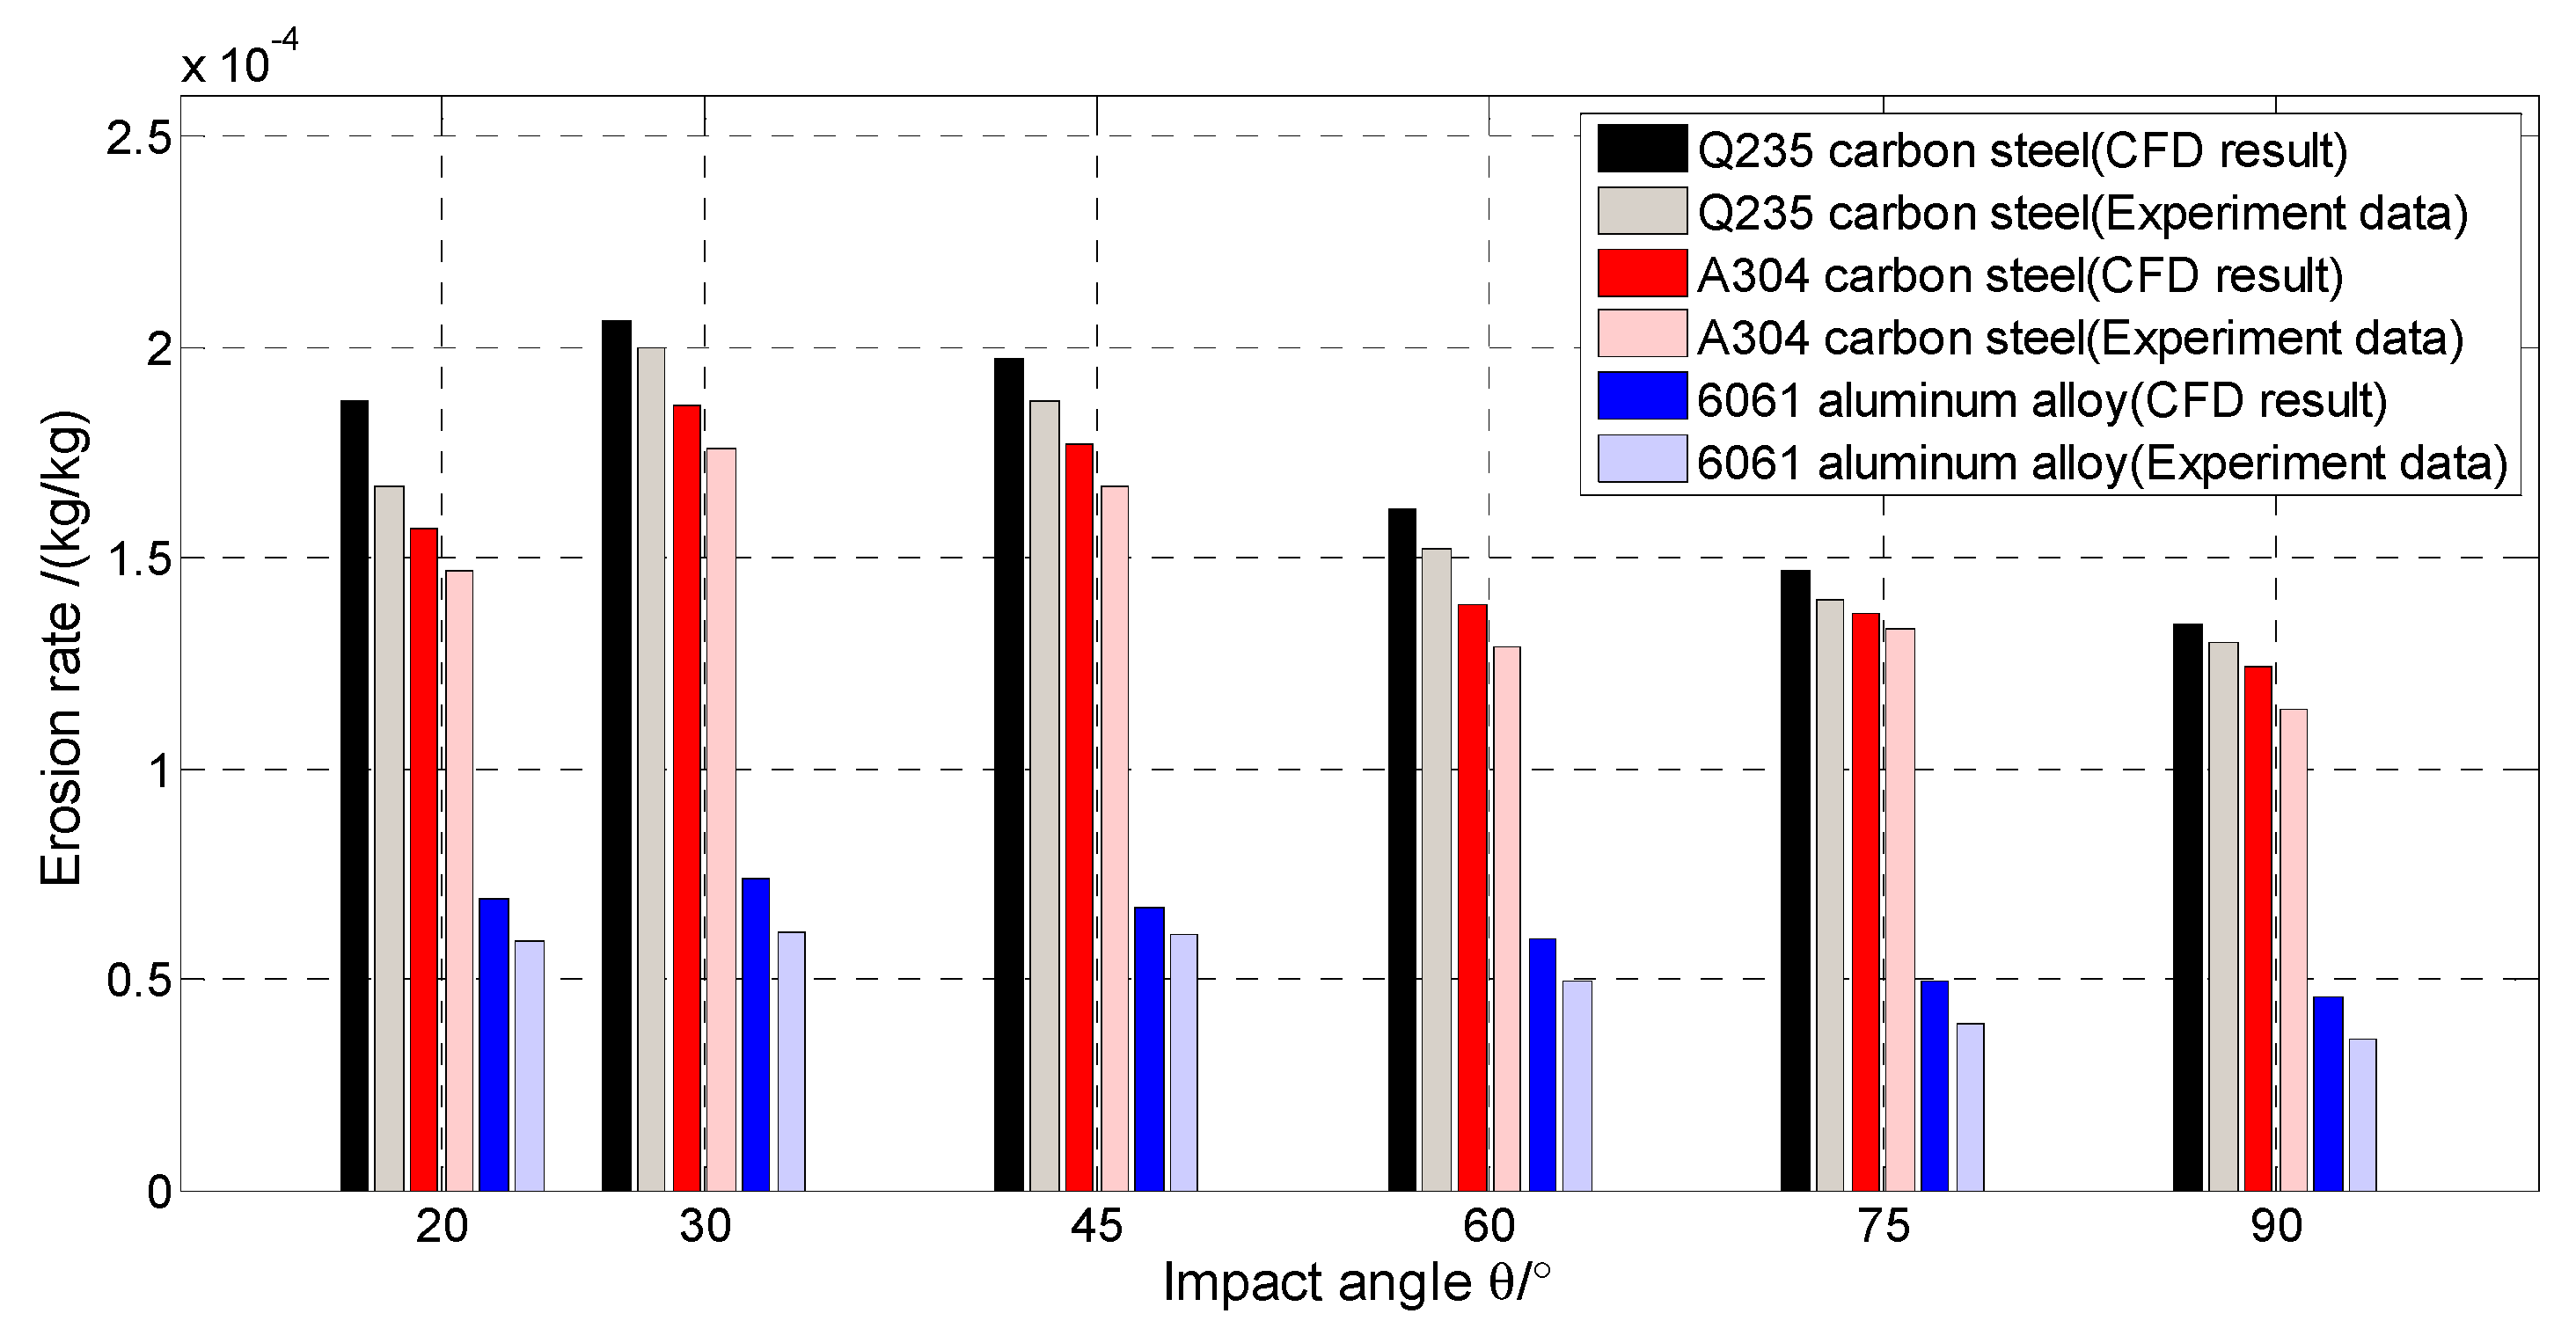
Figure 19 shows the comparison diagram denoting the erosion rates of the simulation and experimental data of three different materials (Q235 carbon steel, A304 stainless steel, and 6061 aluminum alloy) at different impact angles.

Figure 19.
The comparison diagram denoting the erosion rates of the CFD simulation and experimental data of different materials (gas velocity vg = 60 m/s and particle size dp = 300 μm).
The maximum error between the simulation data and experimental data was about 21.7%, which is within a reasonable error range. In addition, the erosion rate of the Q235 carbon steel was slightly higher than that of the A304 stainless steel, both of which exceeded that of the 6061 aluminum alloy, verifying the accuracy of the CFD simulation and erosion models.
5. Conclusions
This paper employs experimental and CFD simulation methods to simulate the sealing surface of the ball valve in natural gas pipelines using a specimen. Based on the steady-state model [30], the erosion wear law of the specimens exposed to various influencing factors is studied, and the erosion wear mechanism is verified. The study results are as follows:
- A set of jet erosion experimental devices is developed based on gas–solid two-phase flow. In the same conditions as those of the simulation, the erosion experiment verification study is completed by changing the influencing factors, such as gas velocity, particle size, impact angle, and specimen material. By observing the surface morphology mechanism of the specimen with SEM, the erosion mechanism and characteristics at different impact angles and different particle sizes are proposed, including micro-cutting, impact extrusion deformation and pits, craters, scratches, and wear debris.
- The simulation results show that the erosion rate increases with an increase in particle size and erosion velocity. Furthermore, it is concluded that the maximum erosion area is located in the center of the specimen surface and presents a U shape under different conditions. At the same time, the surface pits of the eroded specimen increase with an increase in the particle size and velocity, while the service life of the specimen is reduced. In addition, when the impact angle is 30°, the erosion rate reaches the peak value, exhibiting a prominent “stagnation area” at different impact angles.
- The difference between the CFD simulation and erosion model and the experimental data are compared, and the accuracy of the Euler–Lagrange method is verified. Furthermore, the applicability and accuracy of the SST k–ω turbulence model and Oka erosion prediction model are verified and found to be in good agreement with the experimental data.
Author Contributions
Conceptualization, D.P., S.D., D.W.; methodology, D.P., S.D., D.W.; software, Z.W.; validation, D.P., Z.W., Y.C.; formal analysis, D.P.; investigation, D.P., S.D., Z.W.; resources, S.D. and L.Z.; data curation, D.P. and Z.W.; writing—original draft preparation, D.P.; writing—review and editing, D.P.; visualization, Z.W. and Y.C.; supervision, S.D. and L.Z.; project administration, D.P., S.D., L.Z.; funding acquisition, S.D. and L.Z. All authors have read and agreed to the published version of the manuscript
Funding
This study is jointly supported by National Key R&D Program of China (2017YFC0805800), the National Natural Science Foundation of China (51874322), and the Strategic Cooperation Technology Projects of CNPC and CUPB (ZLZX2020-05).
Institutional Review Board Statement
Not applicable.
Informed Consent Statement
Not applicable.
Data Availability Statement
Data available on request due to restrictions, as the research is ongoing.
Acknowledgments
The authors would like to thank Hang Zhang of China University of Petroleum-Beijing for the helpful discussions related to this work. Also thank Hua Qin and Siqi Yang for their help with the software and writing in this paper.
Conflicts of Interest
The authors declare no conflict of interest.
References
- Zheng, S.; Luo, M.; Xu, K.; Li, X.; Bie, Q.; Liu, Y.; Yang, H.; Liu, Z. Case study: Erosion of an axial flow regulating valve in a solid-gas pipe flow. Wear 2019, 434, 202952. [Google Scholar] [CrossRef]
- Moses, D.; Haider, G.; Henshaw, J. An investigation of the failure of a 1/4′′ ball valve. Eng. Fail. Anal. 2019, 100, 393–405. [Google Scholar] [CrossRef]
- Waterman, N.A. Treatise on materials science and technology volume 13 wear: Edited by D. Scott. Tribol. Int. 1979, 12, 281. [Google Scholar] [CrossRef]
- Stachowiak, G.; Batchelor, A.; Stolarski, T. Engineering tribology. Tribol. Int. 1994, 27, 371–372. [Google Scholar] [CrossRef]
- Mansouri, A.; Arabnejad, H.; Shirazi, S.A.; McLaury, B.S. A combined CFD/experimental methodology for erosion prediction. Wear 2015, 332, 1090–1097. [Google Scholar] [CrossRef]
- Alam, T.; Farhat, Z.N. Slurry erosion surface damage under normal impact for pipeline steels. Eng. Fail. Anal. 2018, 90, 116–118. [Google Scholar] [CrossRef]
- Liu, X.; Ji, H.; Min, W.; Zheng, Z.; Wang, J. Erosion behavior and influence of solid particles in hydraulic spool valve without notches. Eng. Fail. Anal. 2019, 108, 104262. [Google Scholar] [CrossRef]
- Nguyen, Q.B.; Lim, C.Y.H.; Nguyen, V.B.; Wan, Y.M.; Nai, B.; Zhang, Y.W.; Gupta, M. Slurry erosion characteristics and erosion mechanisms of stainless steel. Tribol. Int. 2014, 79, 1–7. [Google Scholar] [CrossRef]
- Sun, B.; Wang, H.; Liu, Y.; Lan, W.; Chen, S.; Lv, X.; Cheng, M. Experimental and numerical analysis of solid particle erosion on grinding tool in polymer-flooding wastewater treatment. Eng. Fail. Anal. 2019, 108, 104270. [Google Scholar] [CrossRef]
- Liu, B.; Zhao, J.; Qian, J. Numerical analysis of cavitation erosion and particle erosion in butterfly valve. Eng. Fail. Anal. 2017, 80, 312–324. [Google Scholar] [CrossRef]
- Divakar, M.; Agarwal, V.K.; Singh, S.N. Effect of the material surface hardness on the erosion of AISI 316. Wear 2005, 259, 110–117. [Google Scholar] [CrossRef]
- Vieira, R.E.; Mansouri, A.; McLaury, B.S.; Shirazi, S.A. Experimental and computational study of erosion in elbows due to sand particles in air flow. Powder Technol. 2016, 288, 339–353. [Google Scholar] [CrossRef]
- Parsi, M.; Kara, M.; Sharma, P.; McLaury, B.S.; Shirazi, S.A. Comparative study of different erosion model predictions for single-phase and multiphase flow conditions. In Proceedings of the Offshore Technology Conference, Houston, TX, USA, 2–5 May 2016. [Google Scholar]
- Wee, S.K.; Yap, Y.J. CFD study of sand erosion in pipeline. J. Pet. Sci. Eng. 2019, 176, 269–278. [Google Scholar] [CrossRef]
- Evstifeev, A.; Kazarinov, N.; Petrov, Y.; Witek, L.; Bednarz, A. Experimental and theoretical analysis of solid particle ero-sion of a steel compressor blade based on incubation time concept. Eng. Fail. Anal. 2018, 87, 15–21. [Google Scholar] [CrossRef]
- Okonkwo, P.C.; Shakoor, R.A.; Ahmed, E.; Mohamed, A.M.A. Erosive wear performance of API X42 pipeline steel. Eng. Fail. Anal. 2016, 60, 86–95. [Google Scholar] [CrossRef]
- Okonkwo, P.C.; Shakoor, R.A.; Zagho, M.M.; Mohamed, A.M.A. Erosion behaviour of API X100 pipeline steel at various impact angles and particle speeds. Metals 2016, 6, 232. [Google Scholar] [CrossRef]
- Finnie, I. Erosion of surfaces by solid particles. Wear 1960, 3, 87–103. [Google Scholar] [CrossRef]
- Bitter, J.G.A. A study of erosion phenomena part I. Wear 1963, 6, 5–21. [Google Scholar] [CrossRef]
- Bitter, J.G.A. A study of erosion phenomena: Part II. Wear 1963, 6, 169–190. [Google Scholar] [CrossRef]
- Mansouri, A. Development of Erosion Equation for Slurry Flows; Advisory Board Report; Erosion/Corrosion Research Center, The University of Tulsa: Tulsa, OK, USA, 2014. [Google Scholar]
- Oka, Y.I.; Okamura, K.; Yoshida, T. Practical estimation of erosion damage caused by solid particle impact. Part 1: Effects of impact parameters on a predictive equation. Wear 2005, 259, 95–101. [Google Scholar] [CrossRef]
- Oka, Y.I.; Yoshida, T. Practical estimation of erosion damage caused by solid particle impact: Part 2: Mechanical properties of materials directly associated with erosion damage. Wear 2005, 259, 102–109. [Google Scholar] [CrossRef]
- Zhang, Y.; Reuterfors, E.P.; Mclaury, B.S.; Shirazi, S.A.; Rybicki, E.F. Comparison of computed and measured particle velocities and erosion in water and air flows. Wear 2007, 263, 330–338. [Google Scholar] [CrossRef]
- ANSYS. ANSYS Users Guide, Release 18.0; ANSYS, Inc.: Canonsburg, PA, USA, 2017. [Google Scholar]
- Fernandes, C.; Semyonov, D.; Ferrás, L.L.; Miguel Nóbrega, J. Validation of the CFD-DPM solver DPMFoam in OpenFOAM® through analytical, numerical and experimental comparison. Granul. Matter 2018, 20, 64. [Google Scholar] [CrossRef]
- Meng, H.C.; Ludema, K.C. Wear models and predictive equations: Their form and content. Wear 1995, 181, 443–457. [Google Scholar] [CrossRef]
- Forder, A.; Thew, M.; Harrison, D. A numerical investigation of solid particle erosion experienced within oilfield control valves. Wear 1998, 2, 184–193. [Google Scholar] [CrossRef]
- Messa, G.V.; Malavasi, S. The effect of sub-models and parameterizations in the simulation of abrasive jet impingement tests. Wear 2017, 370–371, 59–72. [Google Scholar] [CrossRef]
- Messa, G.V.; Malavasi, S. A CFD-based method for slurry erosion prediction. Wear 2018, 398–399, 127–145. [Google Scholar] [CrossRef]


Publisher’s Note: MDPI stays neutral with regard to jurisdictional claims in published maps and institutional affiliations. |
© 2021 by the authors. Licensee MDPI, Basel, Switzerland. This article is an open access article distributed under the terms and conditions of the Creative Commons Attribution (CC BY) license (http://creativecommons.org/licenses/by/4.0/).