Article

Numerical Simulation of Wire Rod Cooling in Eutectoid Steel under Forced-Convection

by
Monserrat Sofía López-Cornejo
1,
Héctor Javier Vergara-Hernández
1,*,
Sixtos Antonio Arreola-Villa
2,
Octavio Vázquez-Gómez
1,3 and
Martín Herrejón-Escutia
4
1
Tecnológico Nacional de México/I.T.Morelia, Av. Tecnológico 1500, Col. Lomas de Santiaguito, Morelia 58120, Mexico
2
Facultad de Ingeniería Mecánica y Eléctrica, Barranquilla S/N Col. Guadalupe, Monclova 25280, Mexico
3
Consejo Nacional de Ciencias y Tecnología, Av. Insurgentes Sur 1582, Crédito Constructor, Ciudad de México 03940, Mexico
4
Facultad de Ingeniería Mecánica, Universidad Michoacana de San Nicolás de Hidalgo, Av. Francisco J. Múgica S/N, Morelia 58030, Mexico
*
Author to whom correspondence should be addressed.
Metals 2021, 11(2), 224; https://doi.org/10.3390/met11020224
Submission received: 29 December 2020 / Revised: 20 January 2021 / Accepted: 21 January 2021 / Published: 28 January 2021
(This article belongs to the Section Metal Casting, Forming and Heat Treatment)

Abstract

:
A coupled thermal-microstructural simulation model was developed to estimate the thermal history in a eutectoid steel wire rod under continuous cooling and forced-convection. The model coupled the phenomena of heat transfer, phase transformation and estimation of the cooling boundary condition. The thermal histories were analyzed at different cooling rates to emulate the forced-convection conditions by air-jet as in the controlled cooling conveyor. The thermal histories were acquired and used to calculate the forced-convection heat transfer coefficients through the solution of the Inverse Heat Conduction Problem, while the phase transformation was approximated with the Johnson–Mehl–Avrami–Kolmogorov (JMAK) kinetic model. From the heat transfer coefficients and the kinetic parameters, a user-defined function (UDF) was coded and employed in the ANSYS Fluent® software. The model results were compared and validated with the experimental histories, obtaining a good agreement between both responses, while the microstructural evolution of the pearlite was validated using Scanning Electron Microscopy (SEM) and Vickers microhardness. It was found that specimen diameter and air velocity are the main variables to modify the undercooling and therefore the pearlite interlamellar spacing.

1. Introduction

Fully pearlitic high carbon steels are employed in applications that demand high tensile strength and ductility such as tire reinforcements, saw cables, prestressed concrete, and piano wires [1,2]. These mechanical properties are closely related to the interlamellar spacing between the ferrite and cementite which compose the pearlite; as this parameter decreases, the plastic limit and the maximum yield stress increase [3,4,5,6].
The continuous cooling that takes place in the controlled cooling conveyor is one of the most complex processes for the industrial production of high carbon steel wire rod. This process starts in the laying head, where the rod from hot rolling is looped continuously into coils and placed on the line where temperatures between 850 and 950 °C are measured. Subsequently, the coil is then cooled using forced air through fans installed in the lower part of the cooling bed, where transformation temperatures between 770 and 600 °C are reached to conclude in a temperature lower than 500 °C for handling purposes [7].
The air is supplied into the lower part of the conveyor, and its purpose is to control the coil cooling velocity according to the diameter of the wire rod and the steel composition [8]. The geometry of the coil as well as the cooling air flow pattern generate a variation in the heat transfer coefficient in the different areas of the conveyor, which is governed by convection and radiation heat transfer [9,10,11,12,13].
Previous works focused in establishing a mathematical model that takes into account heat transfer of high carbon steel wire rod in the loop conveyor and the phase transformation from austenite to pearlite, using numerical methods such as finite differences to evaluate the effect of the wire rod diameter, type of steel and cooling medium on the phase fraction of pearlite and the global heat transfer coefficient by convection and radiation [9,10,11,13,14,15].
Recent works for the controlled cooling conveyor modeling [16,17] are 3D models which can predict the temperature paths in the wire rod through different airflow patterns and use the calculated thermal distribution to determine the phase transformation in the coil. A disadvantage for these models is the need to generate a large number of volumes to represent the fluid dynamics of the air cooling.
Due to the above, the aim of this work is to develop a coupled simulation model to determine the thermal and microstructural evolution of a eutectoid steel subjected to continuous cooling by forced air. The model is then validated with the construction of an instrumented model and a simulation analysis in ANSYS Fluent® (ANSYS Inc., Canonsburg, PA, USA), considering the heat transfer by convection and radiation, as well as the Johnson–Mehl–Avrami–Kolmogorov (JMAK) kinetic model.

2. Materials and Methods

2.1. Material

A section of a high-carbon steel wire rod before the coil forming with a diameter of 0.21 m was analyzed, with the chemical composition is shown in Table 1 (AISI/SAE 1080, according to Bringas [18]). The composition was determined by optical emission spectrometry with SPECTROMAX LMM14 (Spectro, Kleve, Germany). The wire rod section was machined to obtain cylindrical specimens of 0.01 and 0.015 m in diameter, typical diameters for high-carbon steel wire rod produced in industrial scale [1], with a length of 0.040 and 0.060 m, respectively, to maintain the length/diameter ratio equal to four and ensure the heat transfer in the radial direction [19]. The specimens were instrumented with a 1/16” type K thermocouple, placed on the surface of the specimen to measure thermal history with a TempScan/1100 data logger and an acquisition rate of 10 data per second.

2.2. Physical Model

To validate the simulation model, an experimental device was set up to emulate the forced convection cooling condition. Figure 1a shows the experimental set up used to cool the specimens and the thermocouple position in each specimen, which were austenitized at 860 °C at an average heating rate of 0.3 °C s−1 and then cooled under forced convection using air until room temperature was reached. The determination of austenitization temperature was carried out through dilatometry test for the steel under study. The furnace employed maintains at average heating rate of 0.3 °C s−1, so this condition was reproduced in a Linseis L75–V vertical dilatometer (Linseis Messgerate GmbH, Selb, Germany) in cylindrical samples of 0.005 m diameter and 0.015 m of length.
The supplied air velocity Va, was characterized with an HER-440 digital flow and velocity meter, using cooling conditions close to the velocities found in the controlled cooling conveyor, while the average cooling rate was calculated from the experimental thermal history. The air velocity and cooling rate values are indicated in Table 2.
After the heat treatment, metallographic preparation of the specimens was performed to reveal microstructure. The specimens were mounted on Bakelite and grinded using SiC sandpaper, coarse to fine (8.5–78 µm), and polished with 0.5 µm grain size alumina to a mirror finish. The specimens were then etched with Nital 3, a solution of 3% vol. nitric acid (Merck KGaA, Darmstadt, Germany) in ethyl alcohol solution (Merck KGaA, Darmstadt, Germany). The pearlite interlamellar spacing was measured by Scanning Electron Microscopy (SEM) using JSM-5900LV (JEOL Tokyo, Japan). Transversal and longitudinal Vickers microhardness measurements were carried out with an MVK-HVL (Mitutoyo, Kawasaki, Japan), with a force of 0.98 N (100 gf) for 15 s, recording measurements in Vickers and Rockwell C scale.

3. Mathematical Model

The simulation model couples heat transfer with phase transformation to predict the thermal history and microstructural evolution of pearlite on the surface of a cylindrical specimen during continuous cooling by air forced convection. The model calculates the thermal response in the specimen and the transformed volume fraction for each time step using a user-defined function (UDF) coupled to the ANSYS Fluent® solver. The simulation model considers the following assumptions:
  • The problem is solved in a transitory state;
  • The model considers a cartesian coordinate system in 3D;
  • The thermophysical properties for steel are found as a function of temperature through polynomial functions for a eutectoid steel [20];
  • The thermal condition at the boundary was determined from the thermal response on the specimen surface and the solution of the Inverse Heat Conduction Problem;
  • The heat accumulation term was calculated from the transformation of austenite into pearlite through the JMAK model and the proposed UDF;
  • Once the phase transformation starts, the cooling in the specimen followed a Newtonian behavior.
The geometric dimensions of the specimen were used in the simulation model to maintain the problem dimensional similarity. The mesh used in the model was built in 3D with a total of 13,524 nodes and 12,060 cubic elements in a hybrid mesh.

3.1. Thermal Model

The General Heat Conduction Equation in terms of enthalpy, governs the heat transfer in the wire rod section under conditions of forced convection and phase transformation [21],
ρ E t + x ( ν x ( ρ E + p ) ) + y ( ν y ( ρ E + p ) ) + z ( ν z ( ρ E + p ) ) = x ( k T x ) + y ( k T y ) + z ( k T z ) + S
where
E = h p ρ
h is the enthalpy, ρ the density, k the material thermal conductivity and S is the source term associated with the phase transformation, which is expressed as
S = ρ Δ H p ( d f p d t )
Δ H p is the heat transformation and d f p d t is the transformation rate of austenite into pearlite. According to Kramer et al. [22], the enthalpy transformation value can be considered as a function of the transformation temperature in Kelvin,
Δ H p = 1.59 × 10 4 15 × 10 6 ( T )

3.2. Thermal Boundary Conditions

The thermal boundary condition on the specimen surface was characterized from the global heat transfer coefficient, h g , which takes into consideration the contribution of the heat transfer coefficient by convection h c and radiation h r , both mechanisms govern the heat transfer in the specimen-cooling medium interface.
To calculate the radiation contribution, the heat transfer coefficient proposed by Campbell et al. [11] was used,
h r = σ F ( T w 4 T 4 T w T )
where F is the thermal emissivity constant for AISI/SAE 1080 steel, σ is the Stefan–Boltzmann constant in W m−2 K−4, T w the cylinder surface temperature and T the temperature of the medium (air at 25 °C).
With the results of the Inverse Heat Conduction Problem, a heat transfer coefficient was obtained for each cooling condition, as a function of the diameter and air velocity. In turn, a polynomial regression was performed on the coefficient values to obtain a specific function of the cooling conditions as a function of the temperature.
The values obtained through Equation (5) and the polynomial regression for each cooling condition were coded within the UDF and implemented in the numerical simulation model in ANSYS Fluent® to be solved simultaneously with the heat transfer model.
h g = h c + h r

3.3. Microstructural Model

To couple the austenite decomposition during the wire rod cooling, it was considered that the pearlitic transformation is possible in the air velocity range proposed [14]. Therefore, the phase transformation can be described by the JMAK model through the Avrami equation [17,23,24].
f P = 1 exp ( k × t n )
where f P is the transformed pearlite fraction, t transformation time, k and n the kinetics parameters. In general, the k parameter is associated with the transformation rate, while the n parameter is related to the rate and nucleation mode of the new phase [25]. Both parameters depend on the temperature under isothermal transformation conditions and can be calculated from the data provided by the IT diagrams, (start and finish times and volume fractions of transformation) for a specific steel from the proposed relationships [15,26,27,28,29],
b ( T ) = ln ( 1 f s P ) t i n ( T )
n ( T ) = ln [ ln ( 1 f s P ) ln ( 1 f f P ) ] ln ( t s t f )
where f s and f f are the transformation volume fractions of start to finish and t s and t f the associated times for said fractions [20]. In this case, the IT diagram for an AISI/SAE 1080 steel [30] was employed due to the similarity in the chemical composition with the steel studied in this work. The IT diagram was coupled with the simulation analysis through the JMAK model and Equations (7)–(9). The solution to the microstructural problem depends on the additivity rule to predict the onset transformation under non isothermal conditions [15,27,28,29]. The additivity rule considers the fraction of the nucleation time as the relation between the elapsed time Δ t j and the incubation time τ i at the same temperature; once the sum of the fractions reaches unity, it is considered that the transformation phase has begun.
j = 1 n Δ t j τ j = 1 0 t d t τ ( T ) = 1
In this sense, the additivity principle extends from the beginning of the incubation time to the full extent of the transformation defined by the volume fraction from 0 to 1.
To calculate the isothermal transformation time, it is necessary to obtain the virtual transformation time t j , that is, the time required for a certain pearlite volume fraction to transform to a certain temperature during the time interval Δ t , which is defined as
t j = t j 1 + Δ t
where t j 1 is the dwell time to reach the previous transformed fraction, given by the expression,
t j 1 = [ ln ( 1 1 F j 1 ) _ b ( T ) ] 1 / n ( T )

3.4. Solution Method Considerations

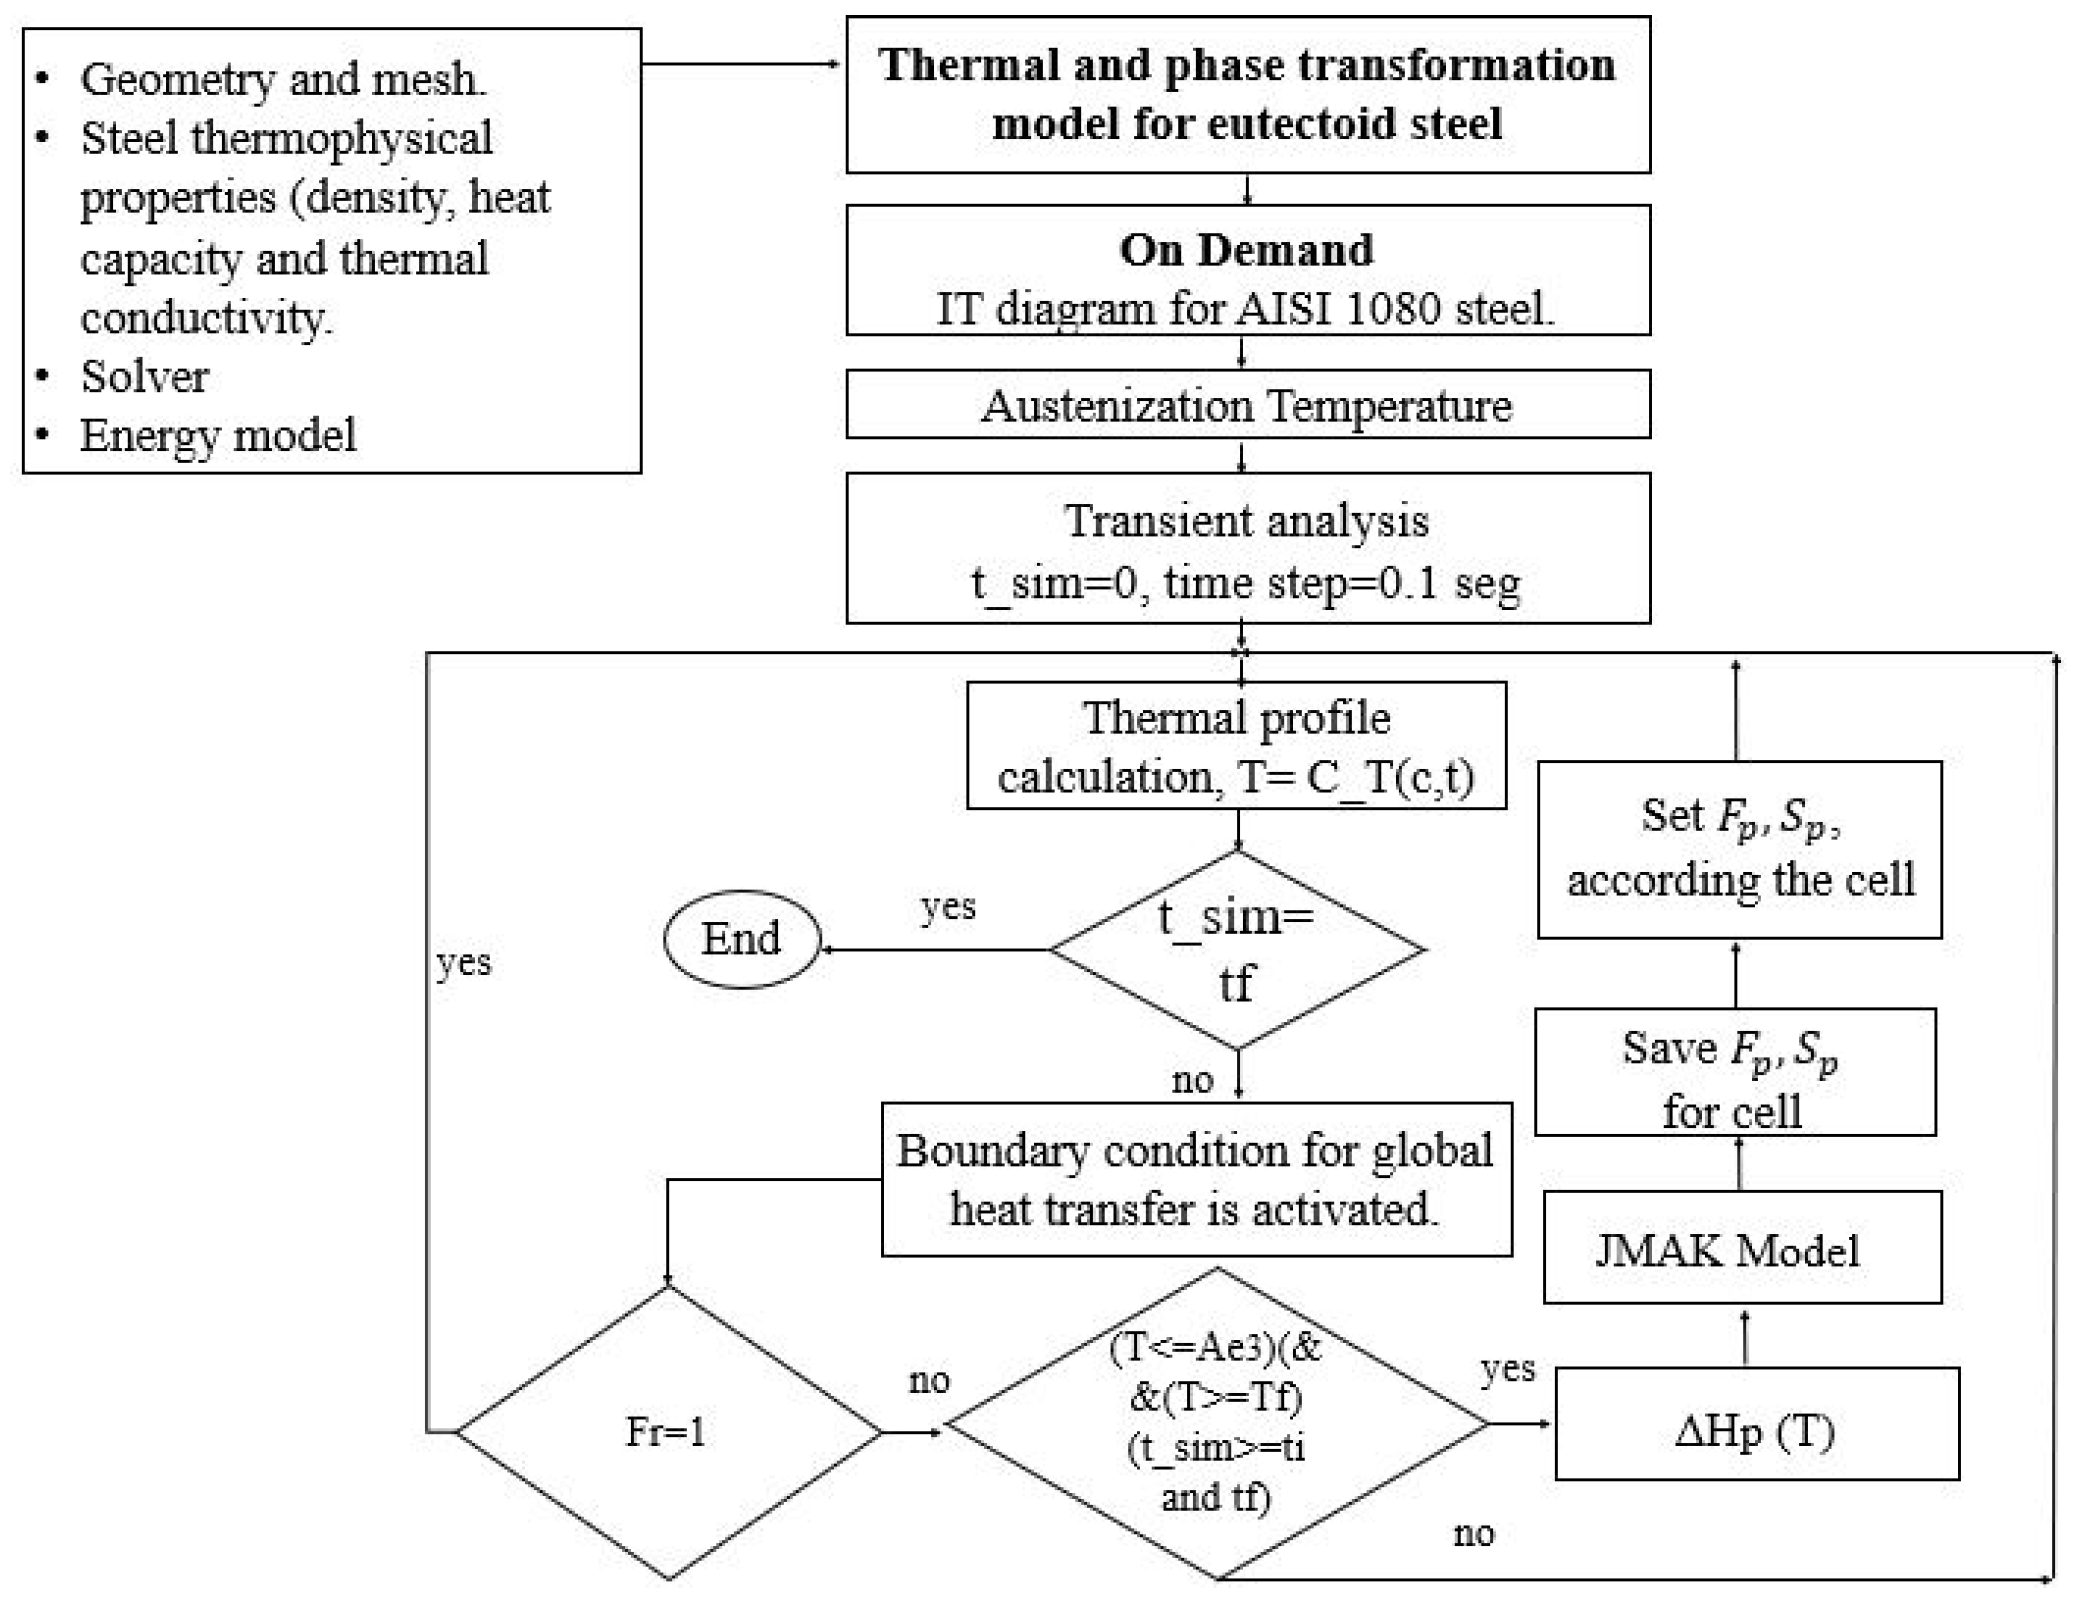
The thermal transformation parameters (times and temperatures) were calculated at each time step in a coupled way with the simulated thermal histories. The IT diagram for a eutectoid steel was coded as a set of points adjusted in pairs in the ANSYS Fluent® solver, using a general-purpose macro called On Demand, which executes whenever the user indicates it, unlike conventional macros that automatically activate during the calculation process, and does not need conditionals to run. Each IT diagram “C” curve was assigned from a pointer to a memory (UDM-s), activating the On-Demand macro only once at the beginning of the calculation. On the other hand, when the thermal fields are calculated in parallel with the temperature value found in each cell during the simulation, the transformation values interpolate from beginning to end, using the IT diagram information. Finally, the solution for the microstructural problem starts if (1) the current temperature interval is located within the pearlitic transformation and (2) the transformation time from start to finish calculated by the IT diagram are less than the simulation time. During the transformation period, the model also calculates the transformed pearlite fraction and the heat generated by the phase transformation through the Equations (7) and (3), respectively, until the transformation time finishes. Figure 2 shows the solution algorithm for the coupled simulation model.

4. Results and Discussion

4.1. Thermal Boundary Condition

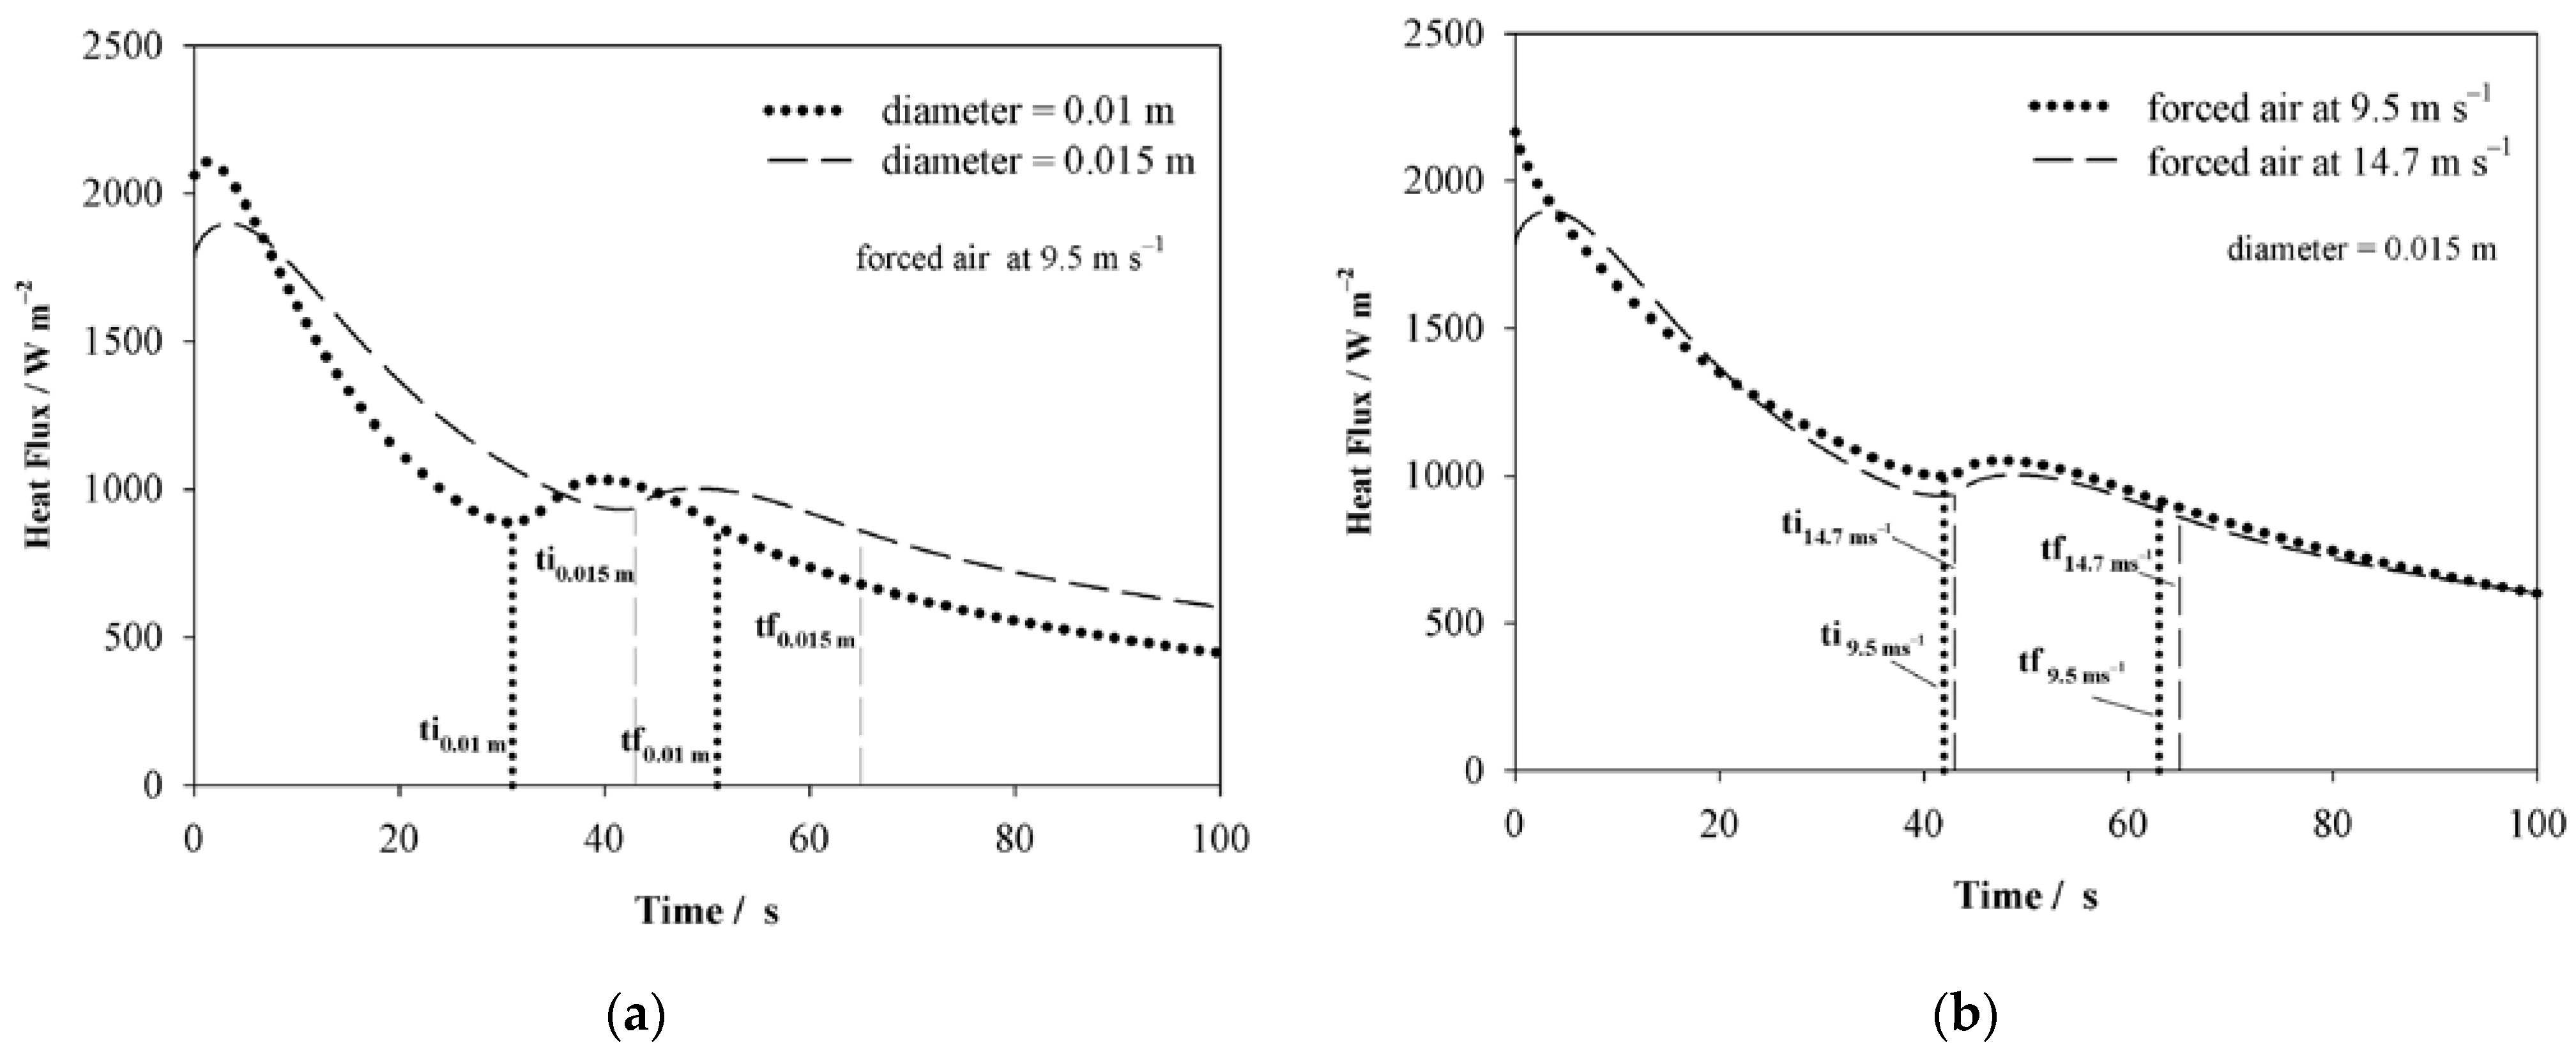
The polynomial regression obtained through the resolution of the inverse heat conduction problem was introduced into the mathematical model through a UDF to estimate the heat flux at the surface as a function of temperature, as shown in Figure 3a,b. The diameter influence in the heat extraction is indicated in Figure 3a where for the specimen cooled at an air velocity of 9.5 m s−1 and a diameter of 0.010 m, the maximum heat extraction occurs in the first 5 s after the cooling starts; after this time, the heat flux decreases progressively to the point where the pearlitic transformation starts and due to the effect of recalescence, there is an increase in the heat flux during a period of 20 s. Once the transformation is completed, the heat extraction continues with the previous trend. For a specimen of 0.015 m in diameter cooled with the same forced air condition, a behavior similar to the one described above is observed, with a difference in the heat flow magnitude, since the diameter increase generates less heat extraction, and this is associated with an increase in internal energy per unit of volume. The air velocity effect on the heat flux is shown in Figure 3b for the specimens with 0.015 m in diameter which were cooled at different air velocities. It is observed that the heat flux occurs in very similar magnitudes for both cases with a minimal difference in the transformation time. The highest difference at this condition is at the beginning of the cooling for the specimen cooled with an air velocity of 14.7 m s−1 since the maximum heat extraction occurs at the beginning of the cooling, while for the specimen cooled at 9.5 m s−1, this condition of maximum extraction occurs within the first 5 s, similar to that observed with the 0.010 m diameter specimens. These differences can be attributed to the air jet that forms with a higher velocity, which in turn, generates a faster cooling rate when it impacts the specimen. The behavior observed in Figure 3a,b determines that the diameter is the dependent variable since it is the greatest difference in the heat flux, by increasing the specimen diameter.

4.2. Thermal History Estimation

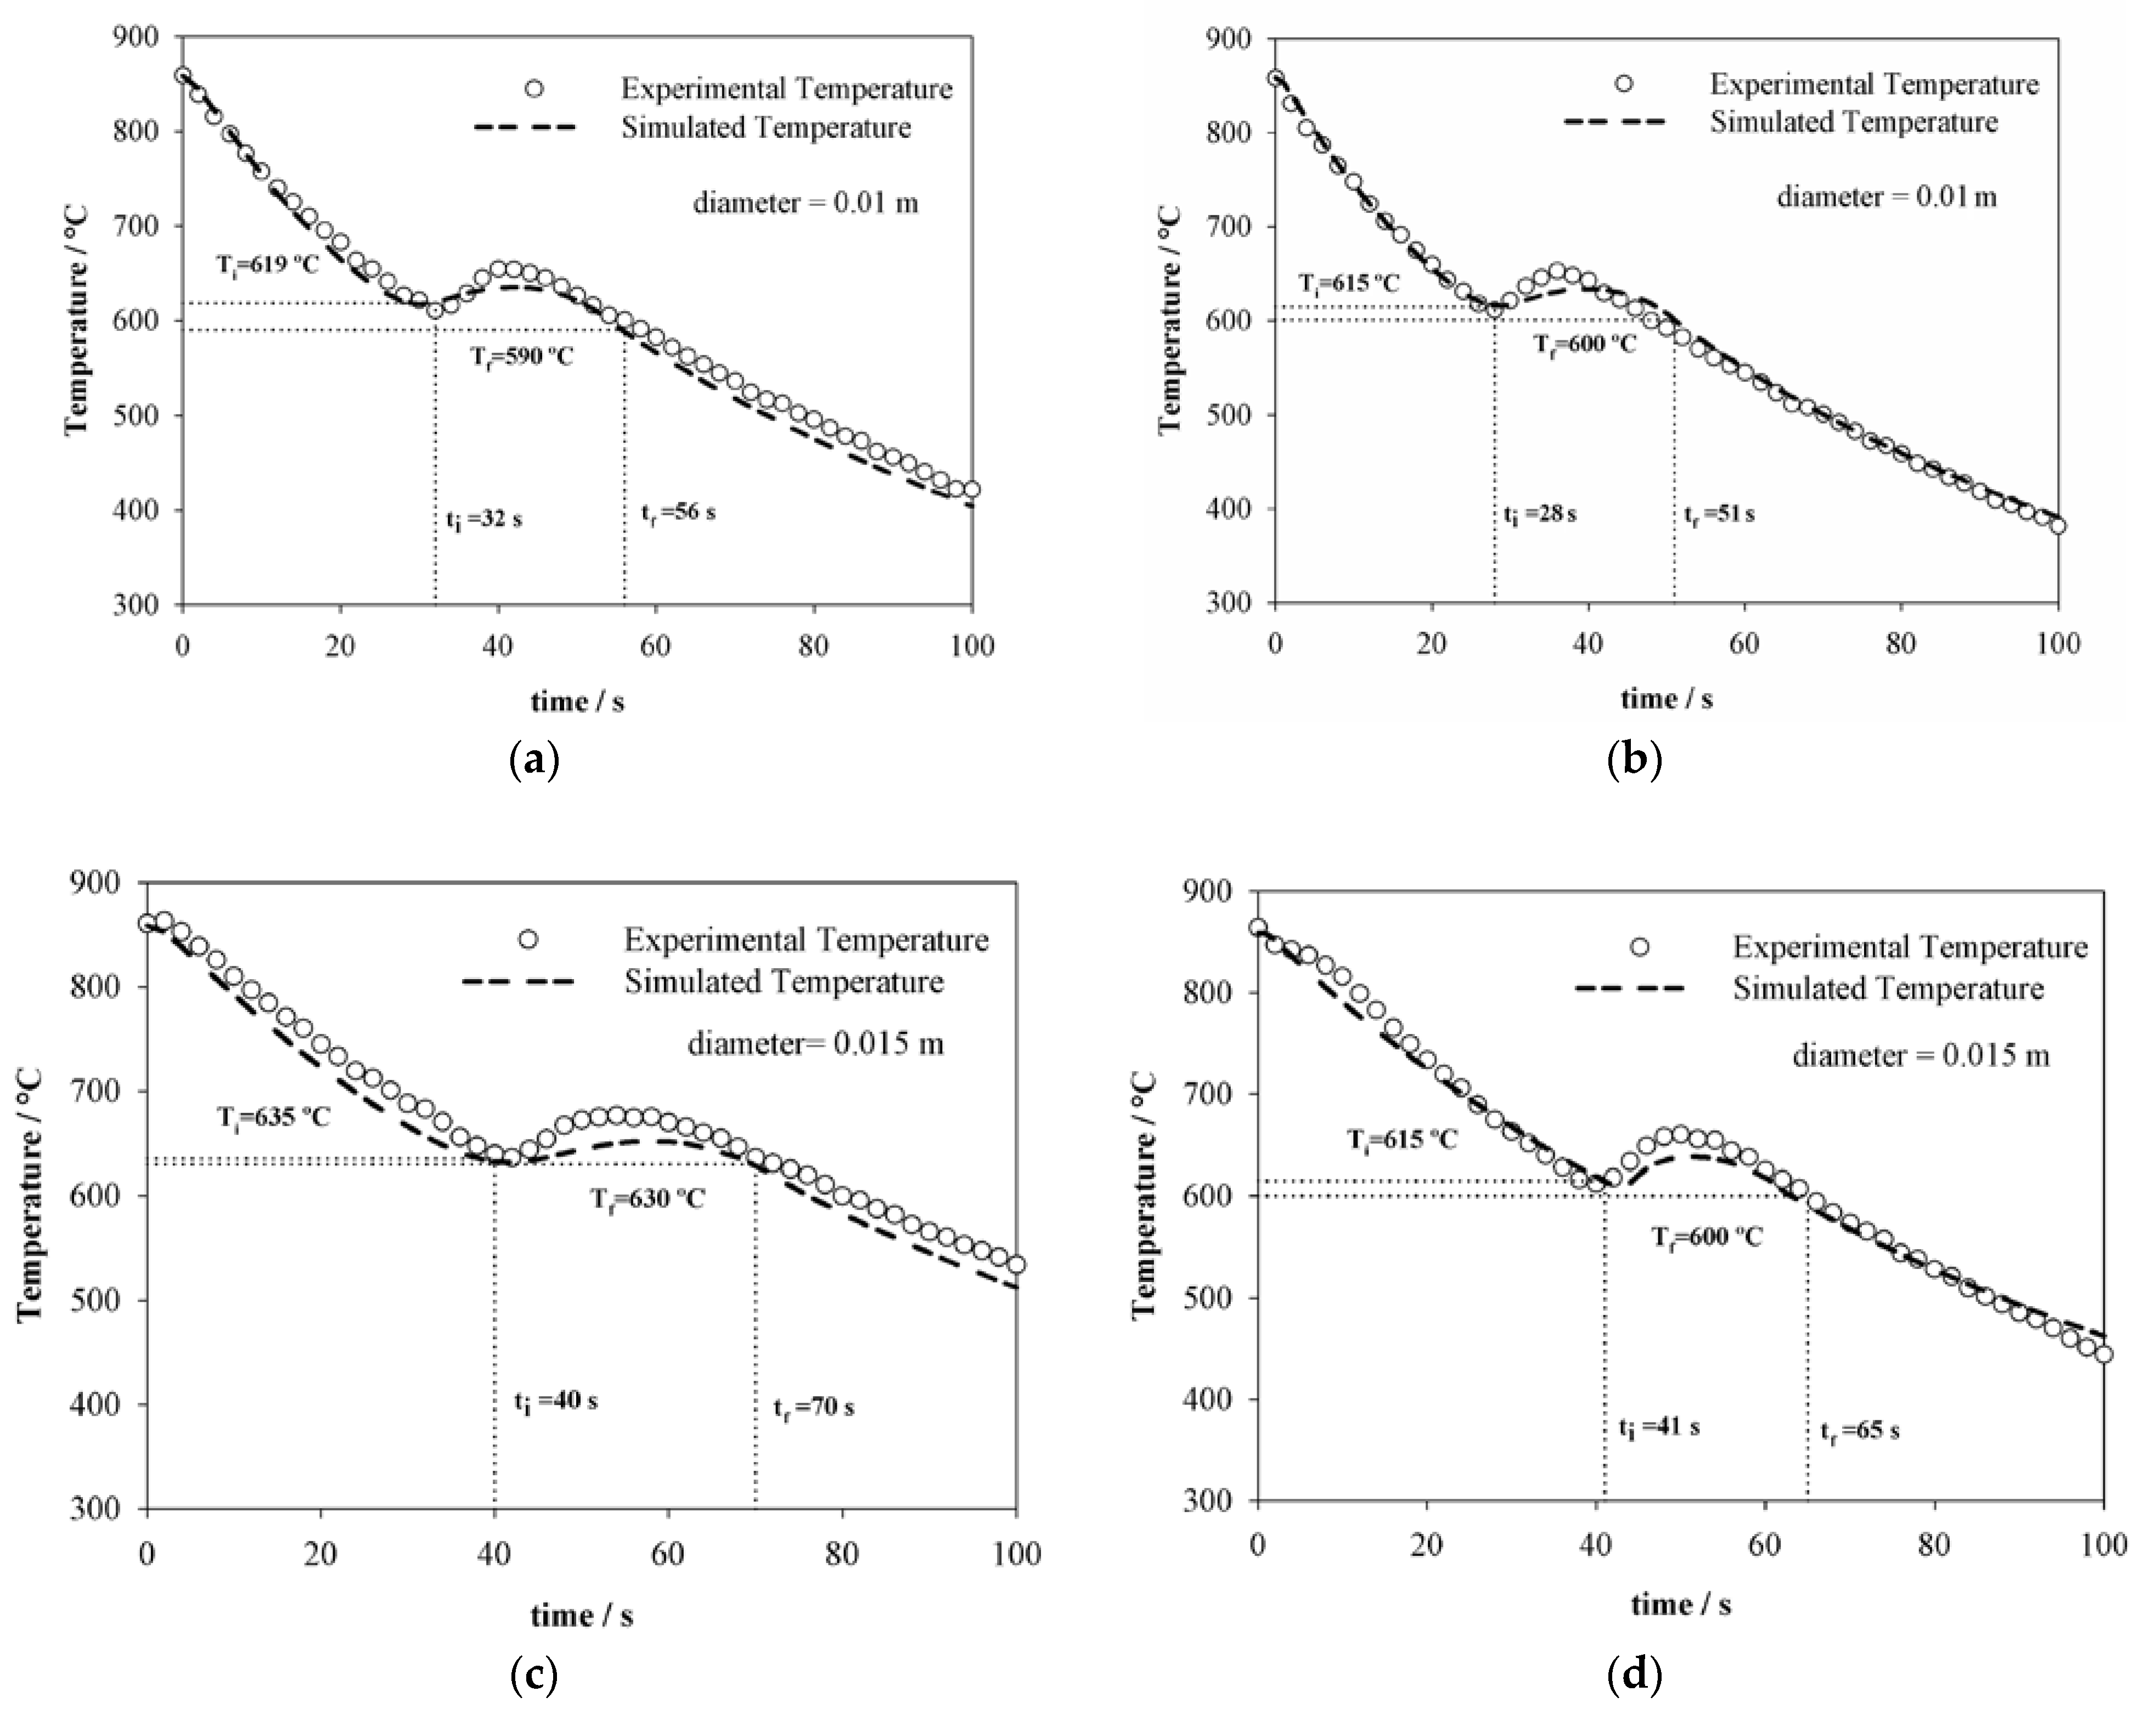
In Figure 4a–d, the experimental thermal history of each analyzed specimen is observed, as well as the thermal history predicted by the simulation model. As seen in Figure 3a,b, the model allows to calculate the heat flux increase (recalescence) due to the austenite transformation into pearlite, which can be seen as a positive change in the curve slope and is represented as an increase in the temperature. The maximum temperature reached in the recalescence period is lower in the experimental thermal history than in the one predicted with the model. This difference lies in the calculation of the global heat transfer coefficient through the forced convection boundary condition, since it also considers the radiation heat losses calculated from Equation (5) [11]. However, the initial transformation temperature estimated by the model agrees with the experimental one, therefore, it is shown that the model can be used to estimate the thermal histories under forced convection conditions. The initial and ending transformation temperature calculated by the model can be observed in Figure 4a–d determined by comparing the thermal histories with the sigmoid curves of the volume fraction of the transformed pearlite calculated by the kinetic model, considering that the starting temperature is when the percentage of pearlite fraction is 0.01, and it finishes at 0.99.

4.3. Pearlite Evolution Estimation

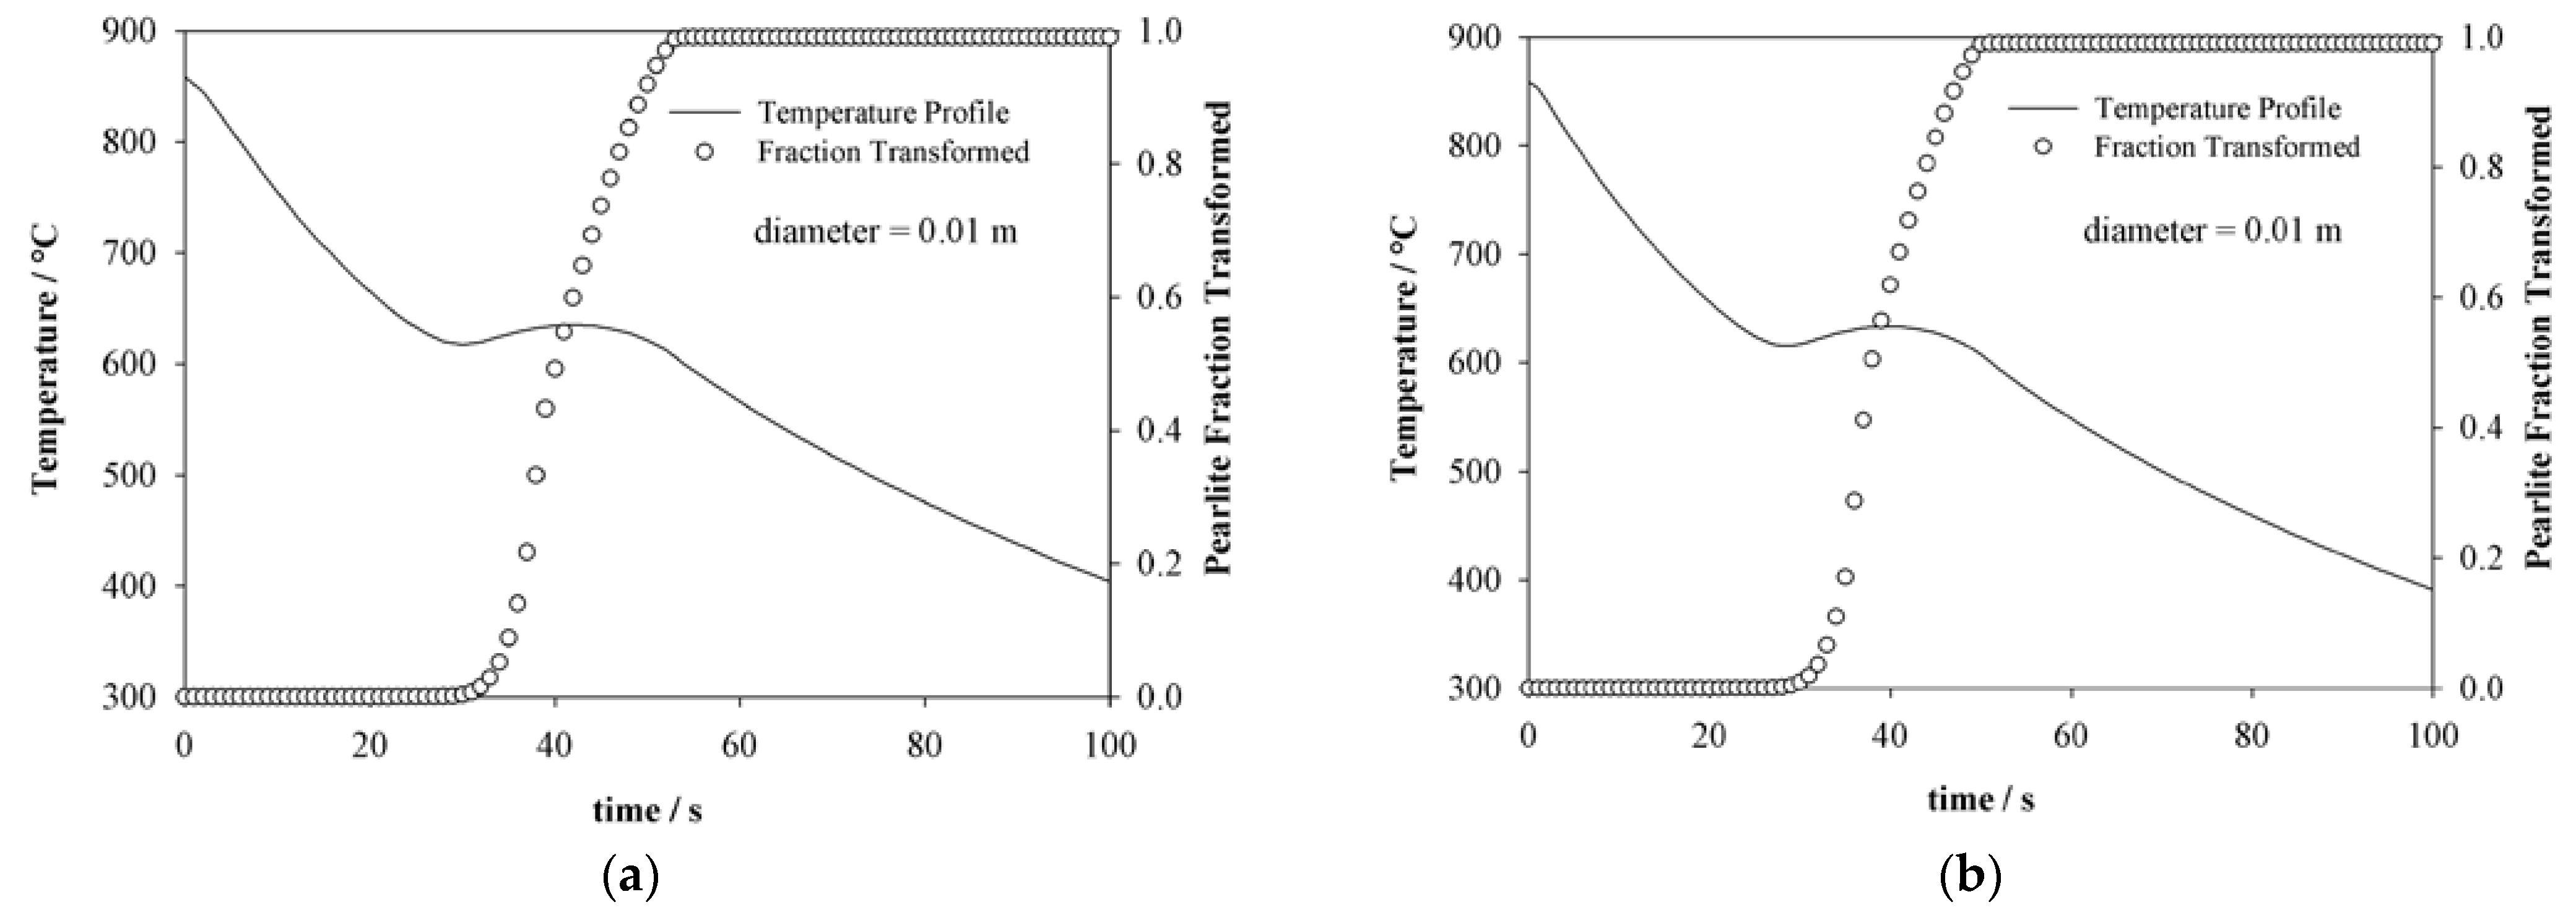
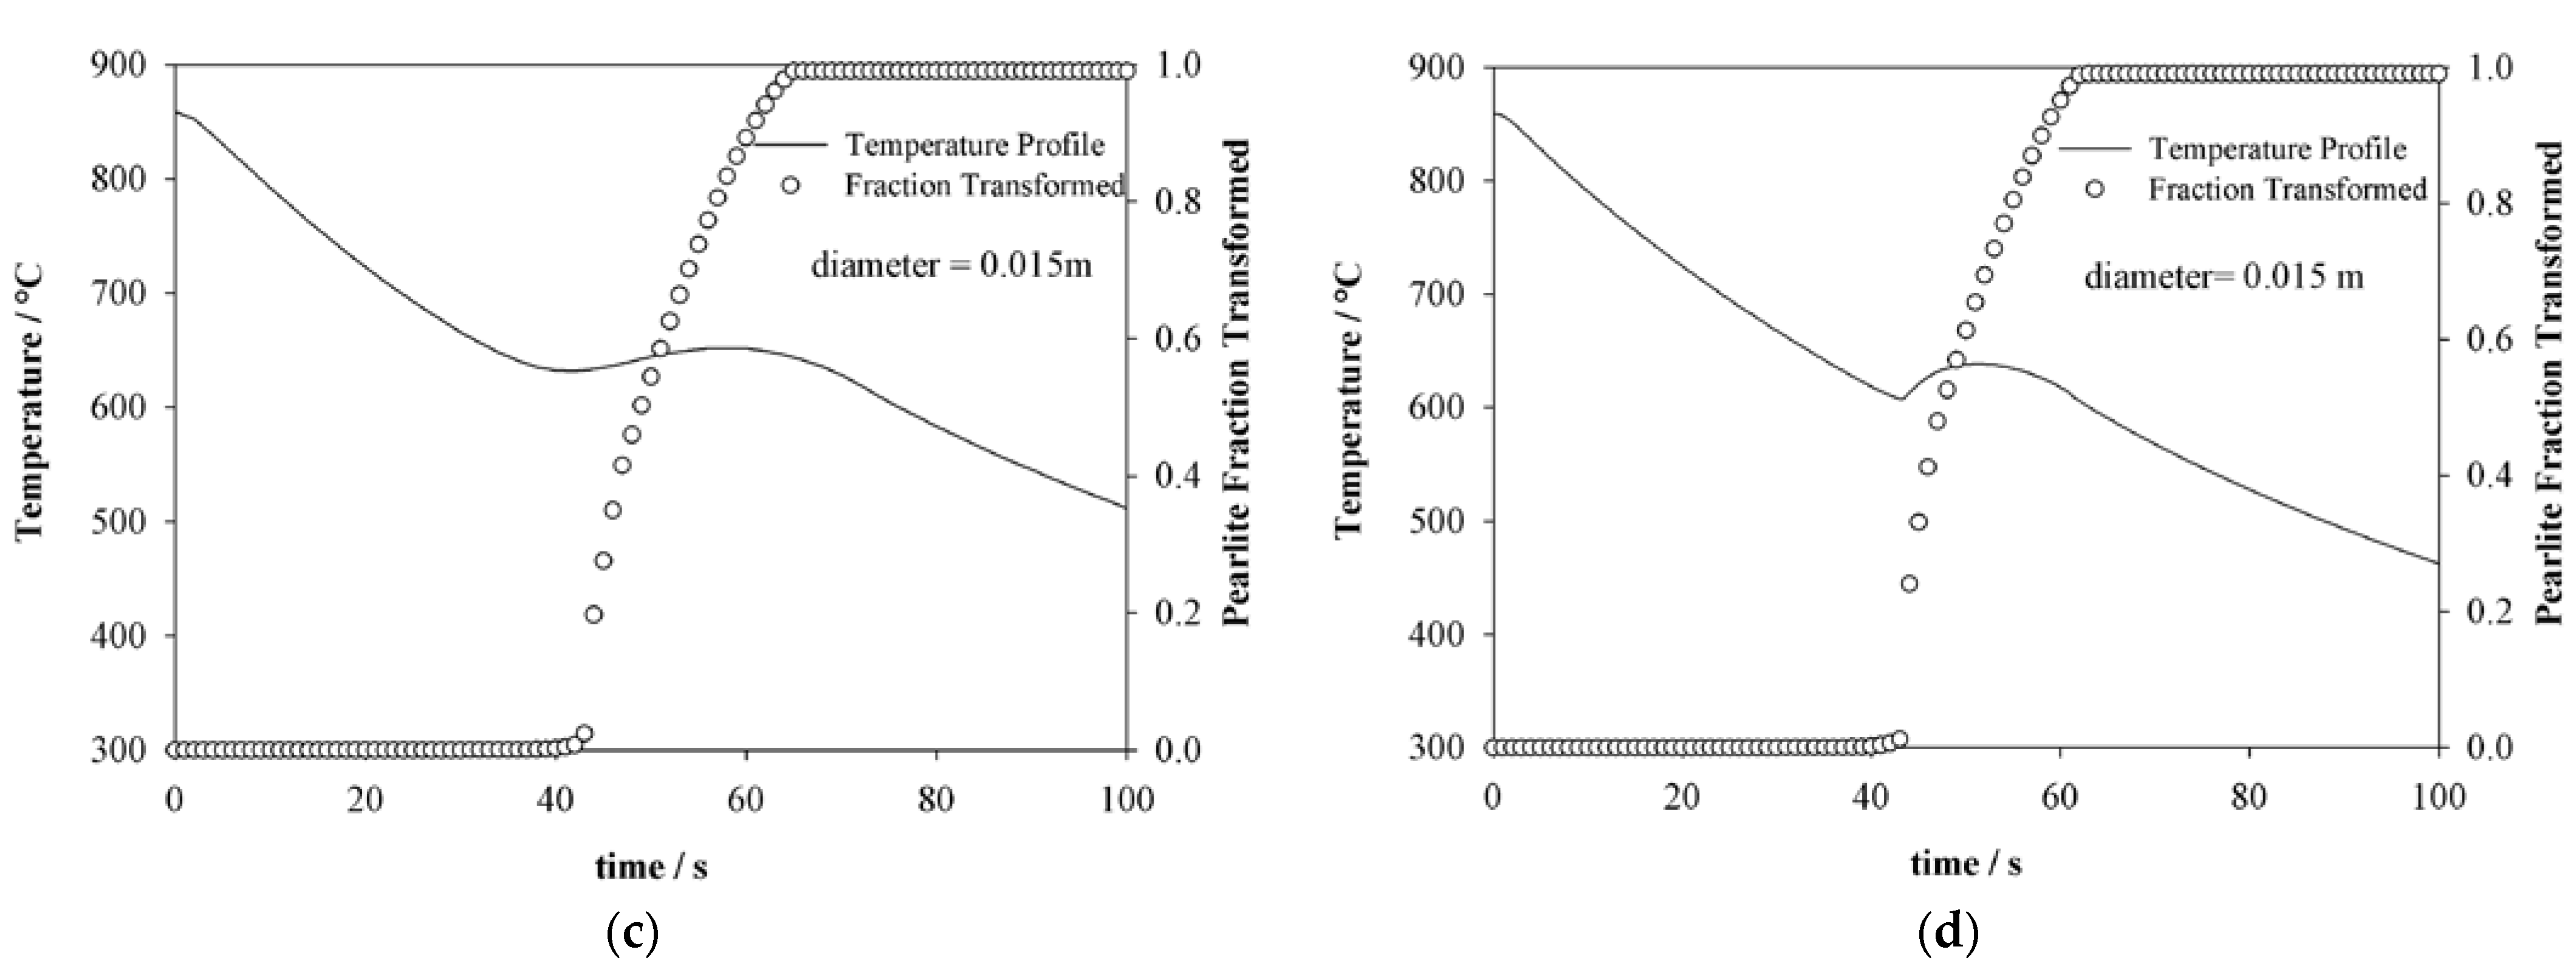
The thermal history estimated with the simulation model and the sigmoid curve that describes the pearlite transformation grade are observed in Figure 5a,b as a function of the steel specimen diameter. For the specimen with 0.010 m in diameter cooled with an air velocity of 7.8 m s−1, the transformation starts after the first 32 s of the cooling, reaching 100% of the transformation at 56 s; now, the specimen with the same diameter cooled at 9.5 m s−1, the transformation starts after the first 28 s of cooling, completing at 51 s, for the specimen with 0.015 m in diameter; at the same cooling condition, the transformation starts at 40 s, completing its transformation at 70 s from the start of the cooling. The specimen diameter effect observed as an increase in the simulated initial transformation time t i s , and consequently, the total transformation time Δ t T , which is defined as the difference between the final transformation t f s time and the initial transformation time t i s . The total transformation time Δ t T , was from 23 to 30 s as the diameter increased by 0.005 m, and the undercooling Δ T calculated with respect to the equilibrium temperature A e 3 = 727 °C (using the semi-empirical correlation of Kirkaldy and Barganis [31]) decreased from 112 to 92 °C. This indicates that, as the diameter of the specimen increases, the amount of heat per unit volume is greater compared to the 0.010 m specimen; therefore, the total transformation time increases as the cooling rate decreases. The above is confirmed with the required undercooling value, that is, as the specimen cooling rate decreases, the Δ T decreases because there is a greater amount of heat for the austenite transformation into pearlite.
The air velocity effect on the times to reach 100% of the pearlitic transformation is observed in Figure 5c,d for the specimens of 0.015 m in diameter cooled at different air velocity. For the specimen cooled to 14.7 m s−1, the Δ t T is less as the velocity increases, observing a greater recalescence in the specimen as illustrated in Figure 5d, compared to the specimen with the same diameter indicated in Figure 5c. On the other hand, the initial transformation temperature A r 3 s decreases as the air velocity is increased, mainly due to the faster cooling rate. This indicates that, as the air velocity increases, the transformation initiates at lower temperatures and shorter times, as shown in Table 3. It is observed that despite the air velocity increasing to 14.7 m s−1, the transformation is completed after the first 60 s of cooling, as can be seen in the volume fraction of transformed pearlite, so the diameter is the controlling variable, since independently of increasing the heat extraction capacity through air velocity and the transformation area of the same specimen, the pearlite transformation is delayed.

4.4. Material

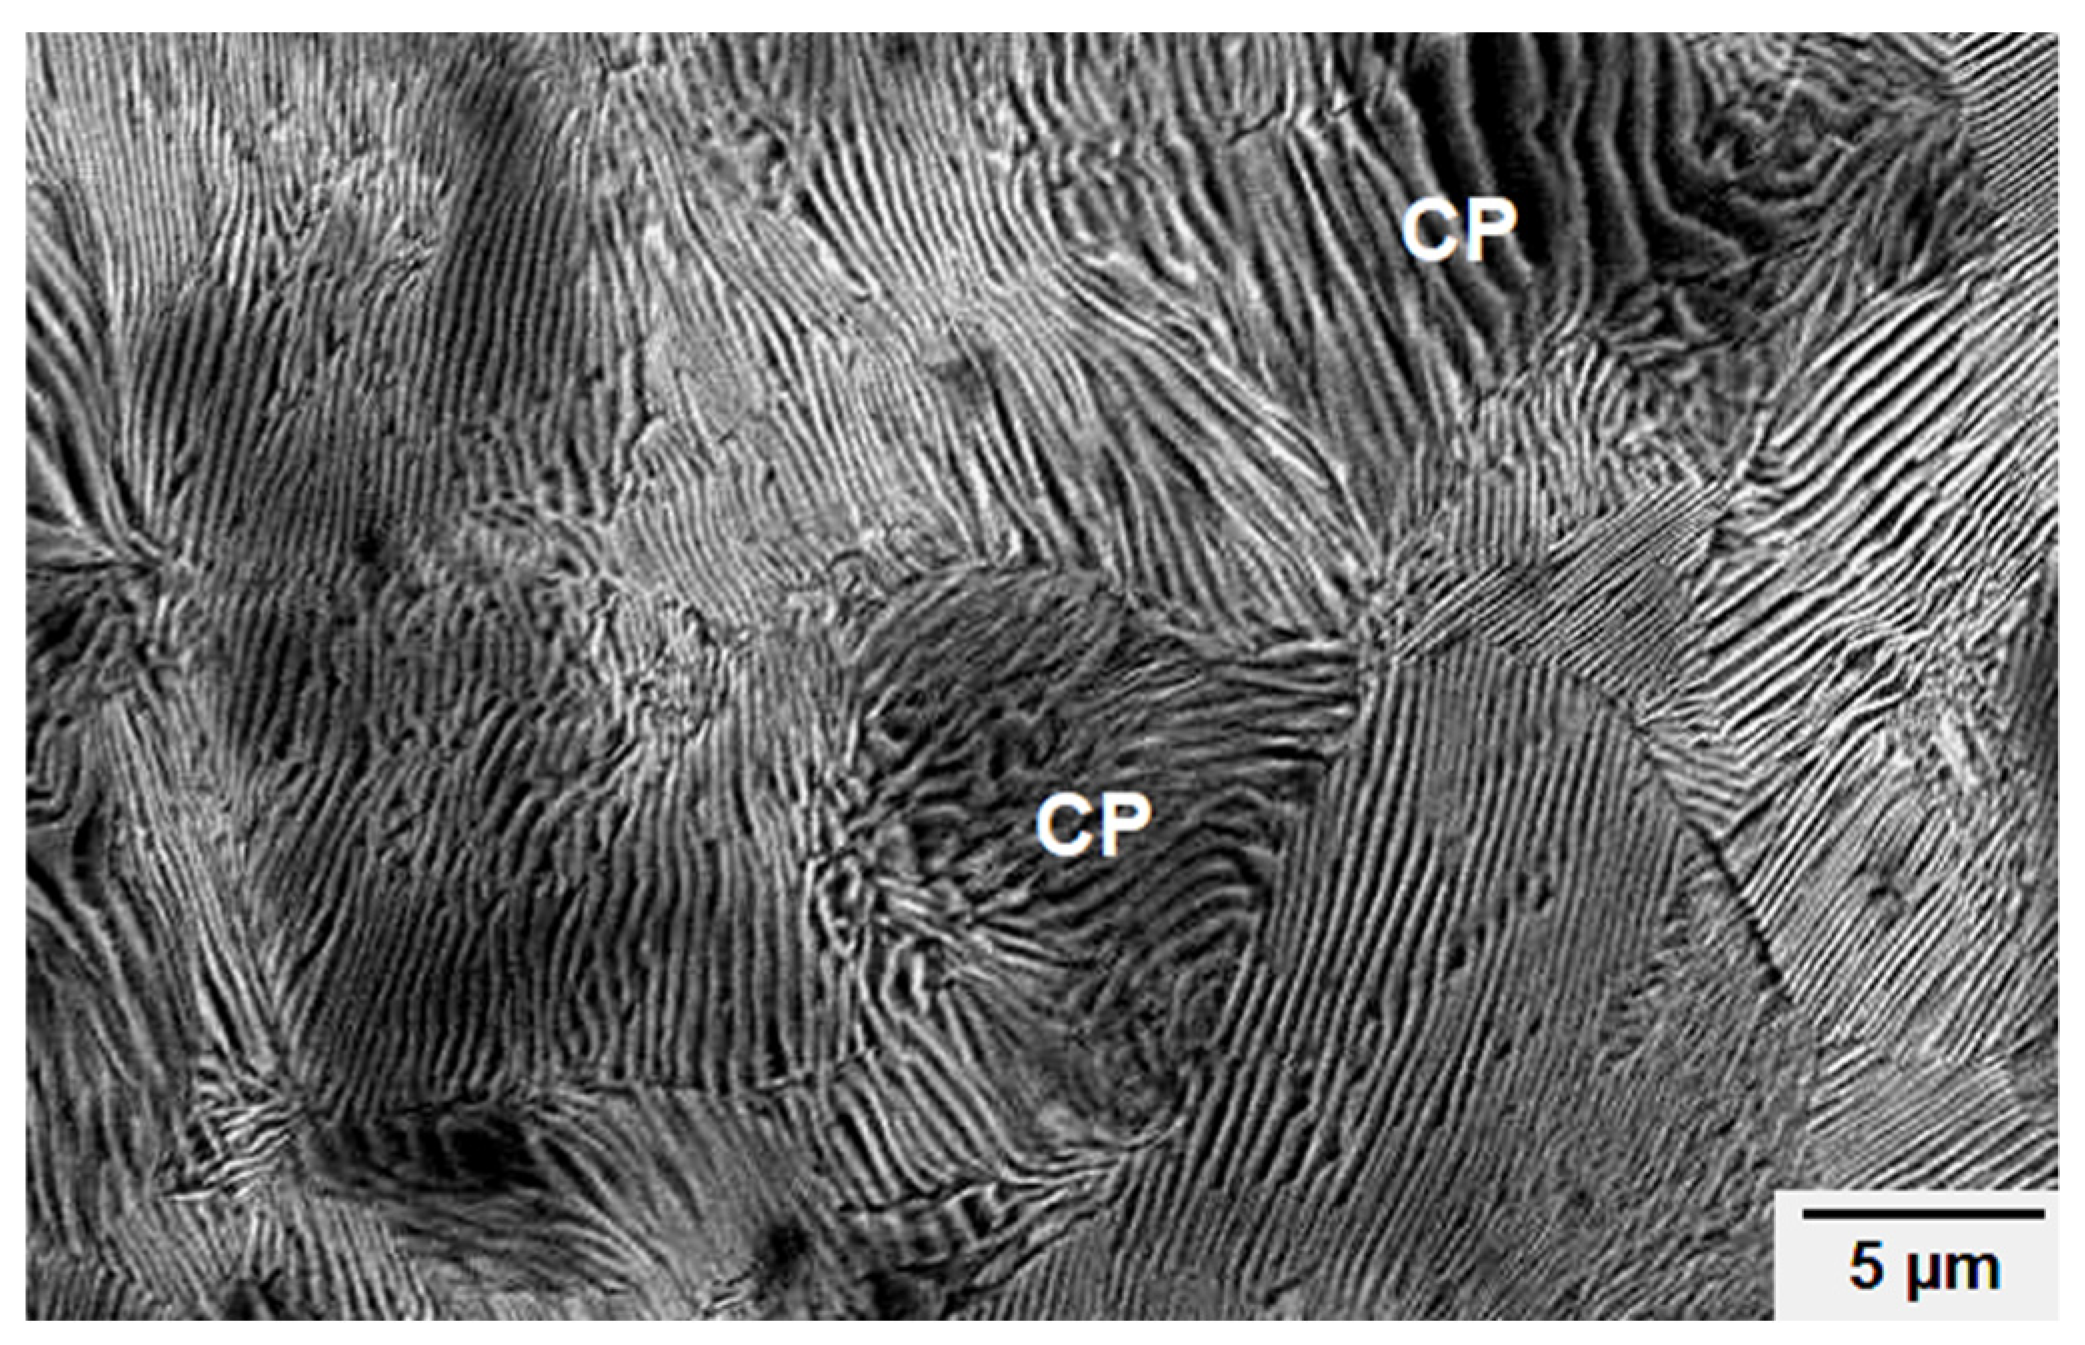
Figure 6 shows the initial microstructure for the high-carbon steel wire rod in as-rolled condition. The microstructure is mainly consisted of coarse pearlite with an average interlamellar spacing of 325 nm.
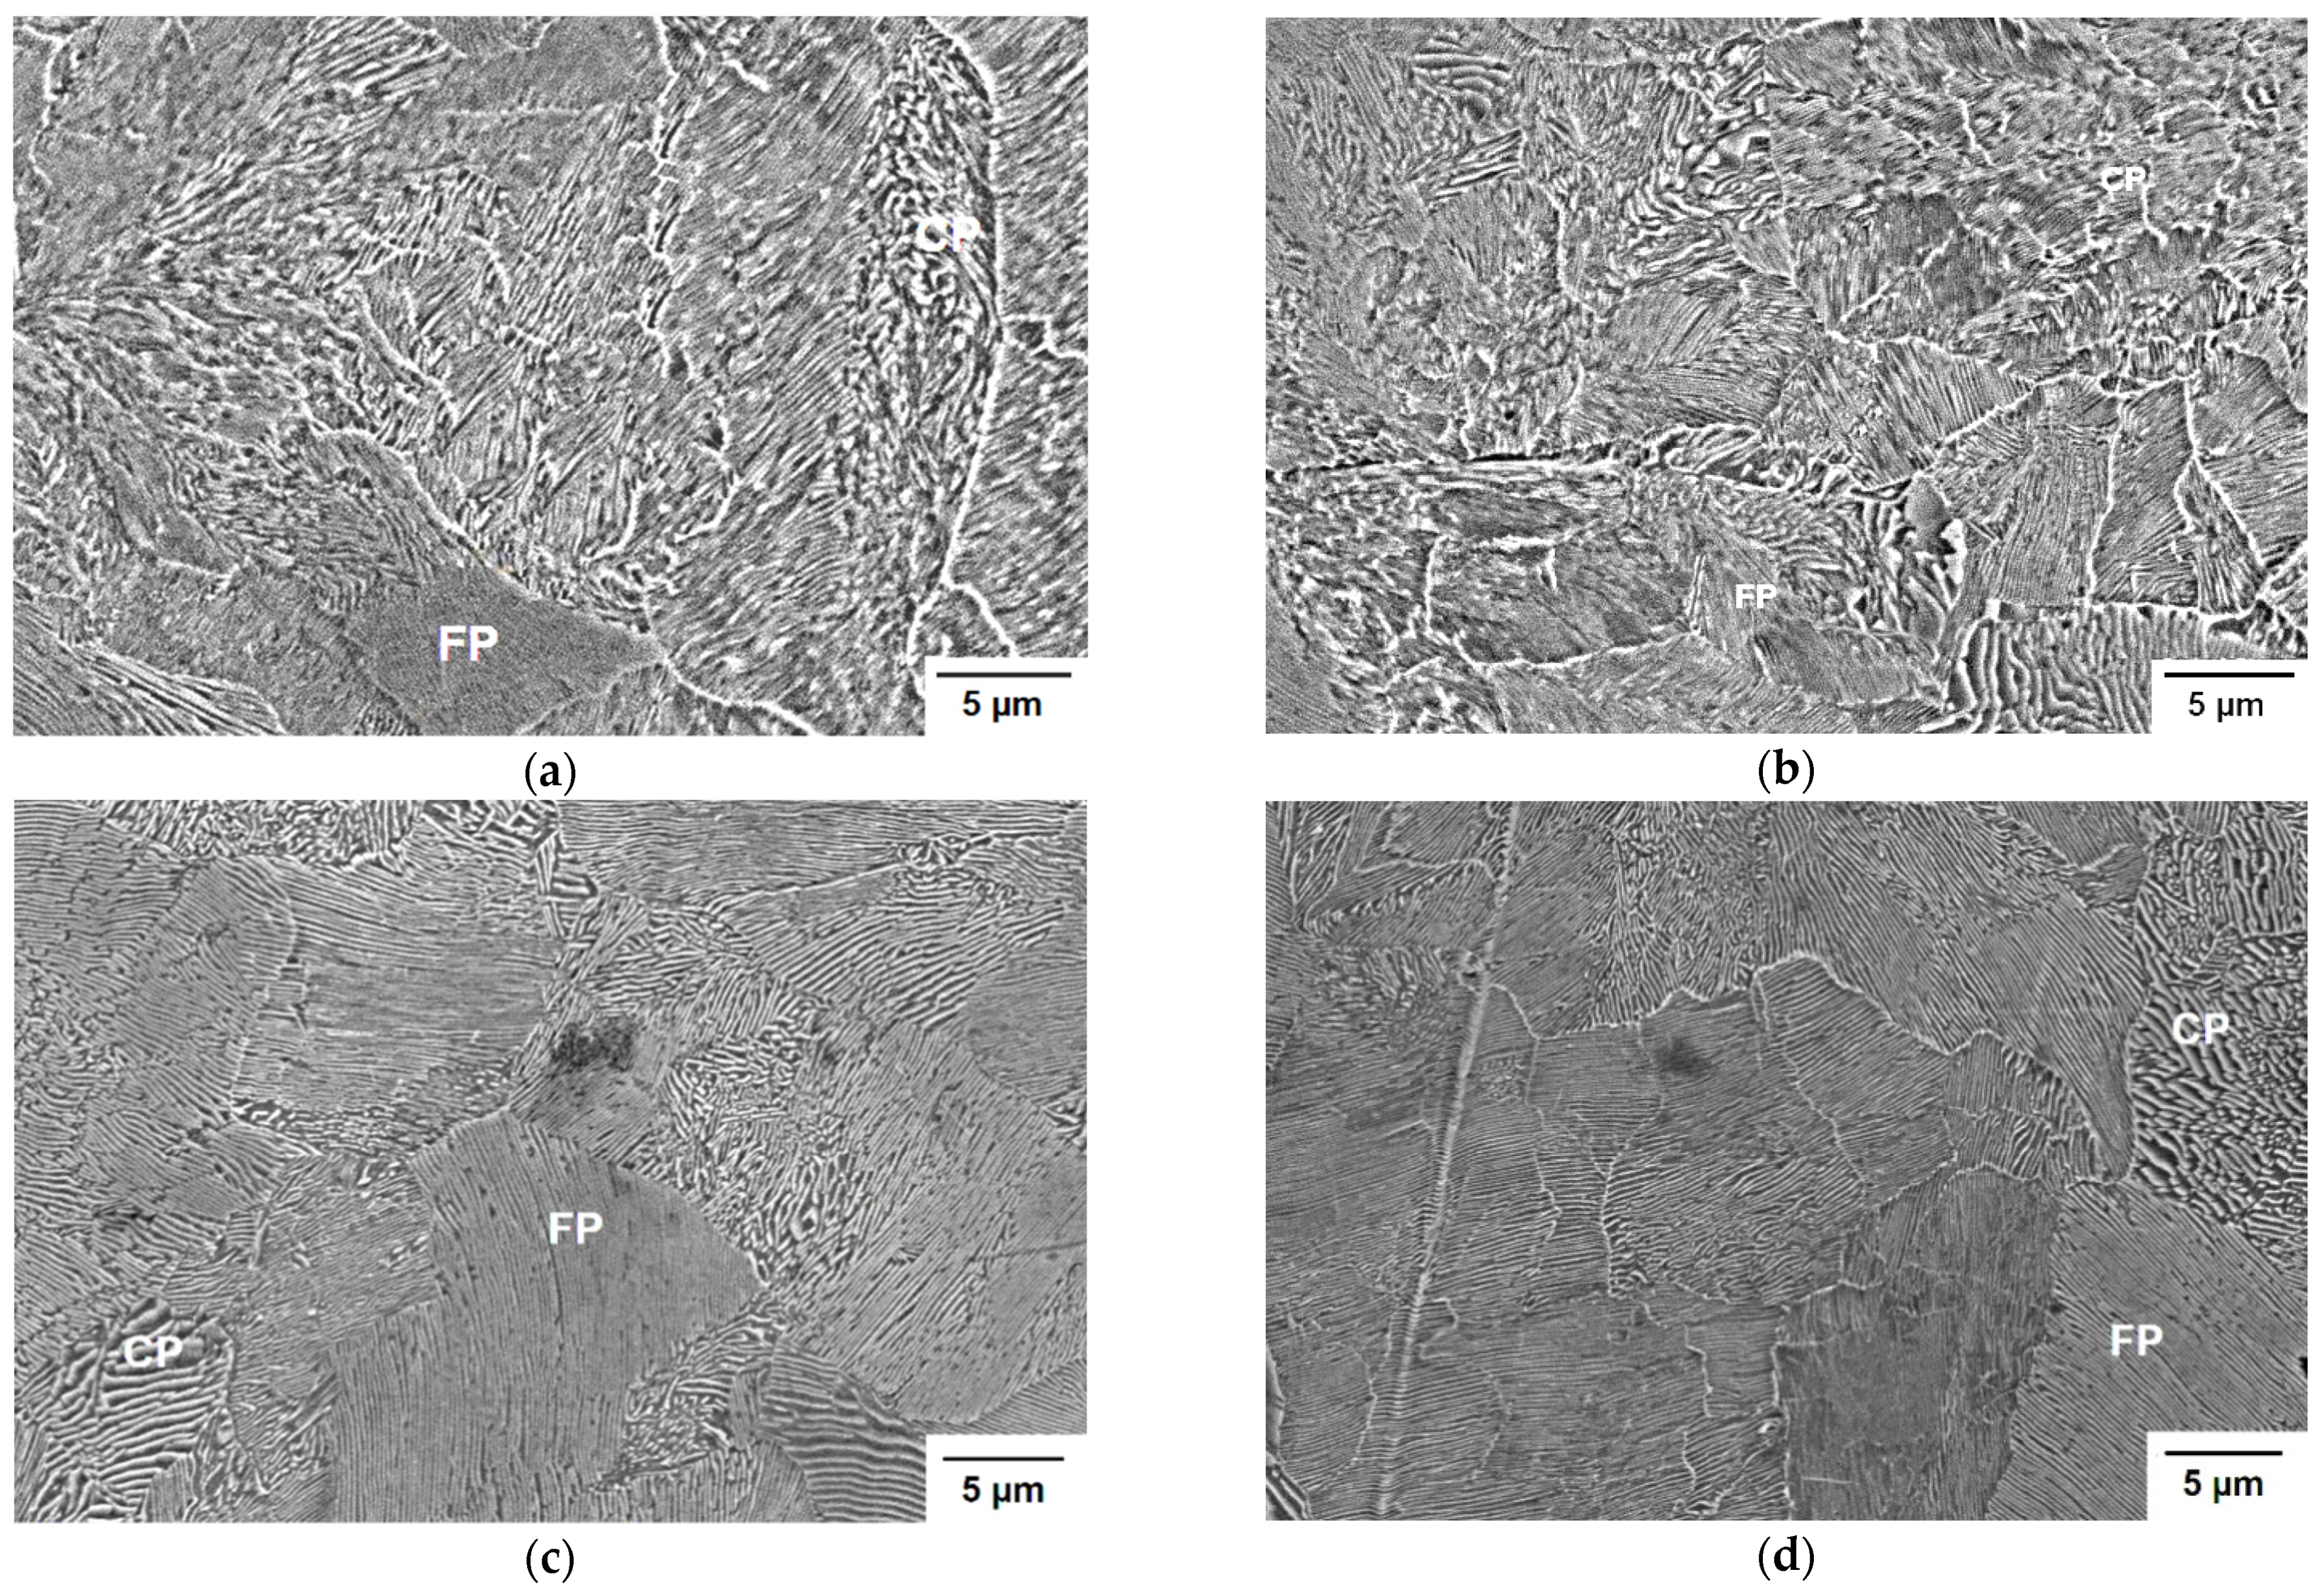
Figure 7a–d indicates the microstructural evidences obtained by SEM of the center of the specimens, analyzed after the heat treatment, with the objective of indirectly validate the results of the simulation with the interlamellar spacing measurements for each cooling condition. The microstructure in the specimens reveals the presence of pearlite colonies of different size, as well as the complete transformation of pearlite under the analyzed conditions. Table 3 shows the results of the interlamellar spacing and average microhardness, HV0.1/15, and their relation with the calculated microstructural parameters from the proposed model. The difference between each specimen interlamellar spacing is determined by the cooling rate V a and the undercooling Δ T ; both parameters are governed by the air velocity and the specimen diameter. An increasing air velocity leads to a higher cooling rate and undercooling, decreasing the pearlite interlamellar spacing [32], as can be seen in the specimens 1 and 2, both with a 0.010 m diameter and with the lowest values pearlite interlamellar spacing at the cooling conditions analyzed. Nevertheless, for the specimen 3 and 4, an increase in the diameter, increases the pearlite interlamellar spacing, even at the higher air velocity studied in this work, 14.7 m s−1. The average microhardness has a linear correlation with the undercooling degree; as the latter increases, higher values are obtained, which can be seen by comparing specimens 3 and 4. The specimen 3 showed the lowest value for average microhardness related to a decrease in the undercooling, an effect of the specimen diameter.

5. Conclusions

The continuous cooling of eutectoid steel wire rod under forced convection was analyzed in this work; the specimen diameter took an important factor in the cooling rate since increase in the diameter promotes to a lower heat extraction associated with an increase in internal energy for unit of volume. Moreover, this behavior displaces the initial and final transformation time, increasing with the specimen diameter.
The initial transformation temperature decreases as the air velocity in increased, mainly due to the faster cooling rate. This indicates that, as the air velocity increases, the pearlite transformation initiates at lower temperatures and shorter times, resulting in a higher undercooling.
The effect of the cooling rate on undercooling and microhardness was correlated with the pearlite interlamellar spacing; as both variables increase, the pearlite interlamellar spacing decreases, and the microhardness increases. The increase in the diameter leads to the lowest values of microhardness, due to a decrease in the undercooling. In order to reduce the pearlite interlamellar spacing, it is necessary to increase the air velocity and consequently, the undercooling.

Author Contributions

Conceptualization, M.S.L.-C. and H.J.V.-H.; methodology, M.S.L.-C.; software, S.A.A.-V. and M.H.-E.; validation, M.S.L.-C., S.A.A.-V. and M.H.-E.; formal analysis, M.S.L.-C. and S.A.A.-V.; investigation, M.S.L.-C.; resources, M.S.L.-C.; data curation, M.S.L.-C. and S.A.A.-V.; writing—original draft preparation, M.S.L.-C.; writing—review and editing, O.V.-G., M.S.L.-C. and S.A.A.-V.; visualization, H.J.V.-H.; supervision, H.J.V.-H.; project administration, H.J.V.-H.; funding acquisition, H.J.V.-H. All authors have read and agreed to the published version of the manuscript.

Funding

This research received no external funding.

Institutional Review Board Statement

Not applicable.

Informed Consent Statement

Not applicable.

Data Availability Statement

The manuscript “Numerical Simulation of Wire Rod Cooling in Eutectoid Steel under Forced-Convection” is an original work and has not been sent elsewhere. All the results are part of the research of the PhD student (M.S. López-Cornejo). This work is an example of microstructural engineering application in steels, and the improvement of mechanical properties through the control of heat treatment variables. These data will be the basis for future works in the authors’ field of research.

Acknowledgments

M.S. López–Cornejo would like to thank the National Council of Science and Technology of Mexico (CONACYT) for the PhD scholarship No. 226984 received for her doctoral studies. The authors are grateful to CONACYT for the use of equipment acquired with support for projects No. 235780, 271878 and 282357 of the National Laboratory SEDEAM.

Conflicts of Interest

The authors declare no conflict of interest.

References

  1. Jain, I.; Lenka, S.; Ajmani, S.K.; Kundu, S. An approach to heat transfer analysis of wire loops over the stelmor conveyor to predict the microstructural and mechanical attributes of steel rods. J. Therm. Sci. Eng. Appl. 2016, 8, 1–11. [Google Scholar] [CrossRef]
  2. Goto, S.; Kirchheim, R.; Al-Kassab, T.; Borchers, C. Application of cold drawn lamellar microstructure for developing ultra-high strength wires. Trans. Nonferrous Met. Soc. China 2007, 17, 1129–1138. [Google Scholar] [CrossRef]
  3. Hyzak, J.M.; Bernstein, I.M. The role of microstructure on the strength and toughness of fully pearlitic steels. Metall. Mater. Trans. A 1976, 7, 1217–1224. [Google Scholar] [CrossRef]
  4. Bhadeshia, H.; Honeycombe, R. Steels: Microstructure and Properties; Butterworth-Heinemann: Oxford, UK, 1981; pp. 65–67. [Google Scholar]
  5. Rastegari, H.; Kermanpur, A.; Najafizadeh, A. Investigating the effects of short time austenitizing and cooling rate on pearlitic microstructure and mechanical properties of a hot rolled plain eutectoid carbon steel. Mater. Des. 2015, 67, 217–223. [Google Scholar] [CrossRef]
  6. Toribio, J.; González, B.; Matos, J.; Ayaso, F. Influence of microstructure on strength and ductility in fully pearlitic steels. Metals 2016, 6, 318. [Google Scholar] [CrossRef] [Green Version]
  7. Yu, W.H.; Chen, S.H.; Kuang, Y.H.; Cao, K.C. Development and application of online stelmor controlled cooling system. Appl. Therm. Eng. 2009, 29, 2949–2953. [Google Scholar]
  8. Kazeminezhad, M.; Karimi Taheri, A. The effect of controlled cooling after hot rolling on the mechanical properties of a commercial high carbon steel wire rod. Mater. Des. 2003, 24, 415–421. [Google Scholar] [CrossRef]
  9. Campbell, P.C.; Hawbolt, E.B.; Brimacombe, J.K. Microstructural engineering applied to the controlled cooling of steel wire rod: Part II. Microstructural evolution and mechanical properties correlations. Metall. Mater. Trans. A 1991, 22, 2779–2790. [Google Scholar] [CrossRef]
  10. Campbell, P.C.; Hawbolt, E.B.; Brimacombe, J.K. Microstructural engineering applied to the controlled cooling of steel wire rod: Part III. Mathematical model-formulation and predictions. Mettal. Mater. Trans. A 1991, 22, 2791–2805. [Google Scholar] [CrossRef] [Green Version]
  11. Campbell, P.C.; Hawbolt, E.B.; Brimacombe, J.K. Microstructural engineering applied to the controlled cooling of steel wire rod: Part I. Experimental design and heat transfer. Metall. Mater. Trans. A 1991, 22, 2769–2778. [Google Scholar] [CrossRef] [Green Version]
  12. Lindemann, A.; Schmidt, J. ACMOD-2D—A heat transfer model for the simulation of the cooling of wire rod. J. Mater. Process. Technol. 2005, 169, 466–475. [Google Scholar] [CrossRef]
  13. Morales, R.D.; Lopéz, A.G.; Olivares, M. Mathematical simulation of stelmor process. Iron Steelmak. 1991, 18, 128–138. [Google Scholar]
  14. Agarwal, P.K.; Brimacombe, J.K. Mathematical model of heat flow and austenite-pearlite transformation in eutectoid carbon steel rods for wire. Metall. Mater. Trans. B 1981, 12, 121–133. [Google Scholar] [CrossRef]
  15. Pham, T.T.; Hawbolt, E.B.; Brimacombe, J.K. Predicting the onset of transformation under noncontinuous cooling conditions: Part II. Application to the austenite pearlite transformation. Metall. Mater. Trans. A 1995, 26, 1993–2000. [Google Scholar] [CrossRef]
  16. Hong, L.; Wang, B.; Feng, S.; Yang, Z.; Yu, Y.; Peng, W.; Zhang, J. A three-dimensional mathematical model to predict air-cooling flow and temperature distribution of wire loops in the stelmor air-cooling system. Appl. Therm. Eng. 2017, 116, 766–776. [Google Scholar] [CrossRef]
  17. Huang, J.; Wang, B.; Xue, F.; Liu, S.; Hong, L.; Yu, Y.; Zhang, J. Effect of controlled cold air distribution on temperature profile and phase transformation of wire loops in the stelmor air-cooling process. Appl. Therm. Eng. 2018, 143, 340–349. [Google Scholar] [CrossRef]
  18. Bringas, J. Handbook of Comparative World Steel Standards, 3rd ed.; ASTM International: West Conshohocken, PA, USA, 2004; p. 33. [Google Scholar]
  19. Quarmby, A.; Al-Farhri, A.A.M. Effect of finite length on forced convection heat transfer from cylinders. Int. J. Heat Mass Transf. 1980, 23, 463–469. [Google Scholar] [CrossRef]
  20. Fernandes, F.M.B.; Denis, S.; Simon, A. Mathematical model coupling phase transformation and temperature evolution during quenching of steels. Mater. Sci. Technol. 1985, 1, 838–844. [Google Scholar] [CrossRef]
  21. Pletcher, R.H.; Tannehill, J.C.; Anderson, D.A. Computational Fluid Mechanics and Heat Transfer, 3rd ed.; CRC Press: Boca Raton, FL, USA, 2013; pp. 66–68. [Google Scholar]
  22. Kramer, J.J.; Pound, G.M.; Mehl, R.F. The free energy of formation and the interfacial enthalpy in pearlite. Acta Met. 1958, 6, 763–771. [Google Scholar] [CrossRef]
  23. Serajzadeh, S. Modelling of temperature history and phase transformations during cooling of steel. J. Mater. Process. Technol. 2004, 146, 311–317. [Google Scholar] [CrossRef]
  24. Carlone, P.; Palazzo, G.S.; Pasquino, R. Finite element analysis of the steel quenching process: Temperature field and solid-solid phase change. Comput. Math. Appl. 2010, 59, 585–594. [Google Scholar] [CrossRef] [Green Version]
  25. Puls, M.P.; Kirkaldy, J.S. The pearlite reaction. Metall. Mater. Trans. B. 1972, 7, 2777–2796. [Google Scholar] [CrossRef]
  26. Vázquez-Gómez, O.; Barrera-Godínez, J.; Hernández-Morales, B.; Vergara-Hernández, H.; López-Martínez, E. Mathematical model of thermal and microstructural evolution during austempering of ductile iron. Mater. Perform. Charact. 2012, 1, 1–14. [Google Scholar] [CrossRef]
  27. Li, M.V.; Niebuhr, D.V.; Meekisho, L.L.; Atteridge, D.G. A computational model for the prediction of steel hardenability. Metall. Mater. Trans. B. 1998, 29, 661–672. [Google Scholar] [CrossRef]
  28. Hawbolt, E.B.; Chau, B.; Brimacombe, J.K. Kinetics of austenite-pearlite transformation in eutectoid carbon steel. Metall. Mater. Trans. A 1983, 14, 1803–1815. [Google Scholar] [CrossRef]
  29. Umemoto, M.; Horoichi, K.; Tamura, I. Transformation kinetics of bainite during isothermal holding and continuous cooling. J. Iron Steel Inst. Jpn. 1982, 68, 461–470. [Google Scholar] [CrossRef]
  30. ASM International. Atlas of Isothermal Transformation and Cooling Transformation Diagrams; American Society for Metals: Cleveland, OH, USA, 1977; p. 28. [Google Scholar]
  31. Kirkaldy, J.S.; Baganis, E.A. Thermodynamic prediction of the Ae3 temperature of steels with additions of Mn,Si, Ni, Cr, Mo, Cu. Metall. Mater. Trans. A 1978, 9, 495–501. [Google Scholar] [CrossRef]
  32. Zener, C. Kinetics of the decomposition of austenite. Trans. Am. Inst. Min. Metall. Eng. 1946, 167, 550–595. [Google Scholar]
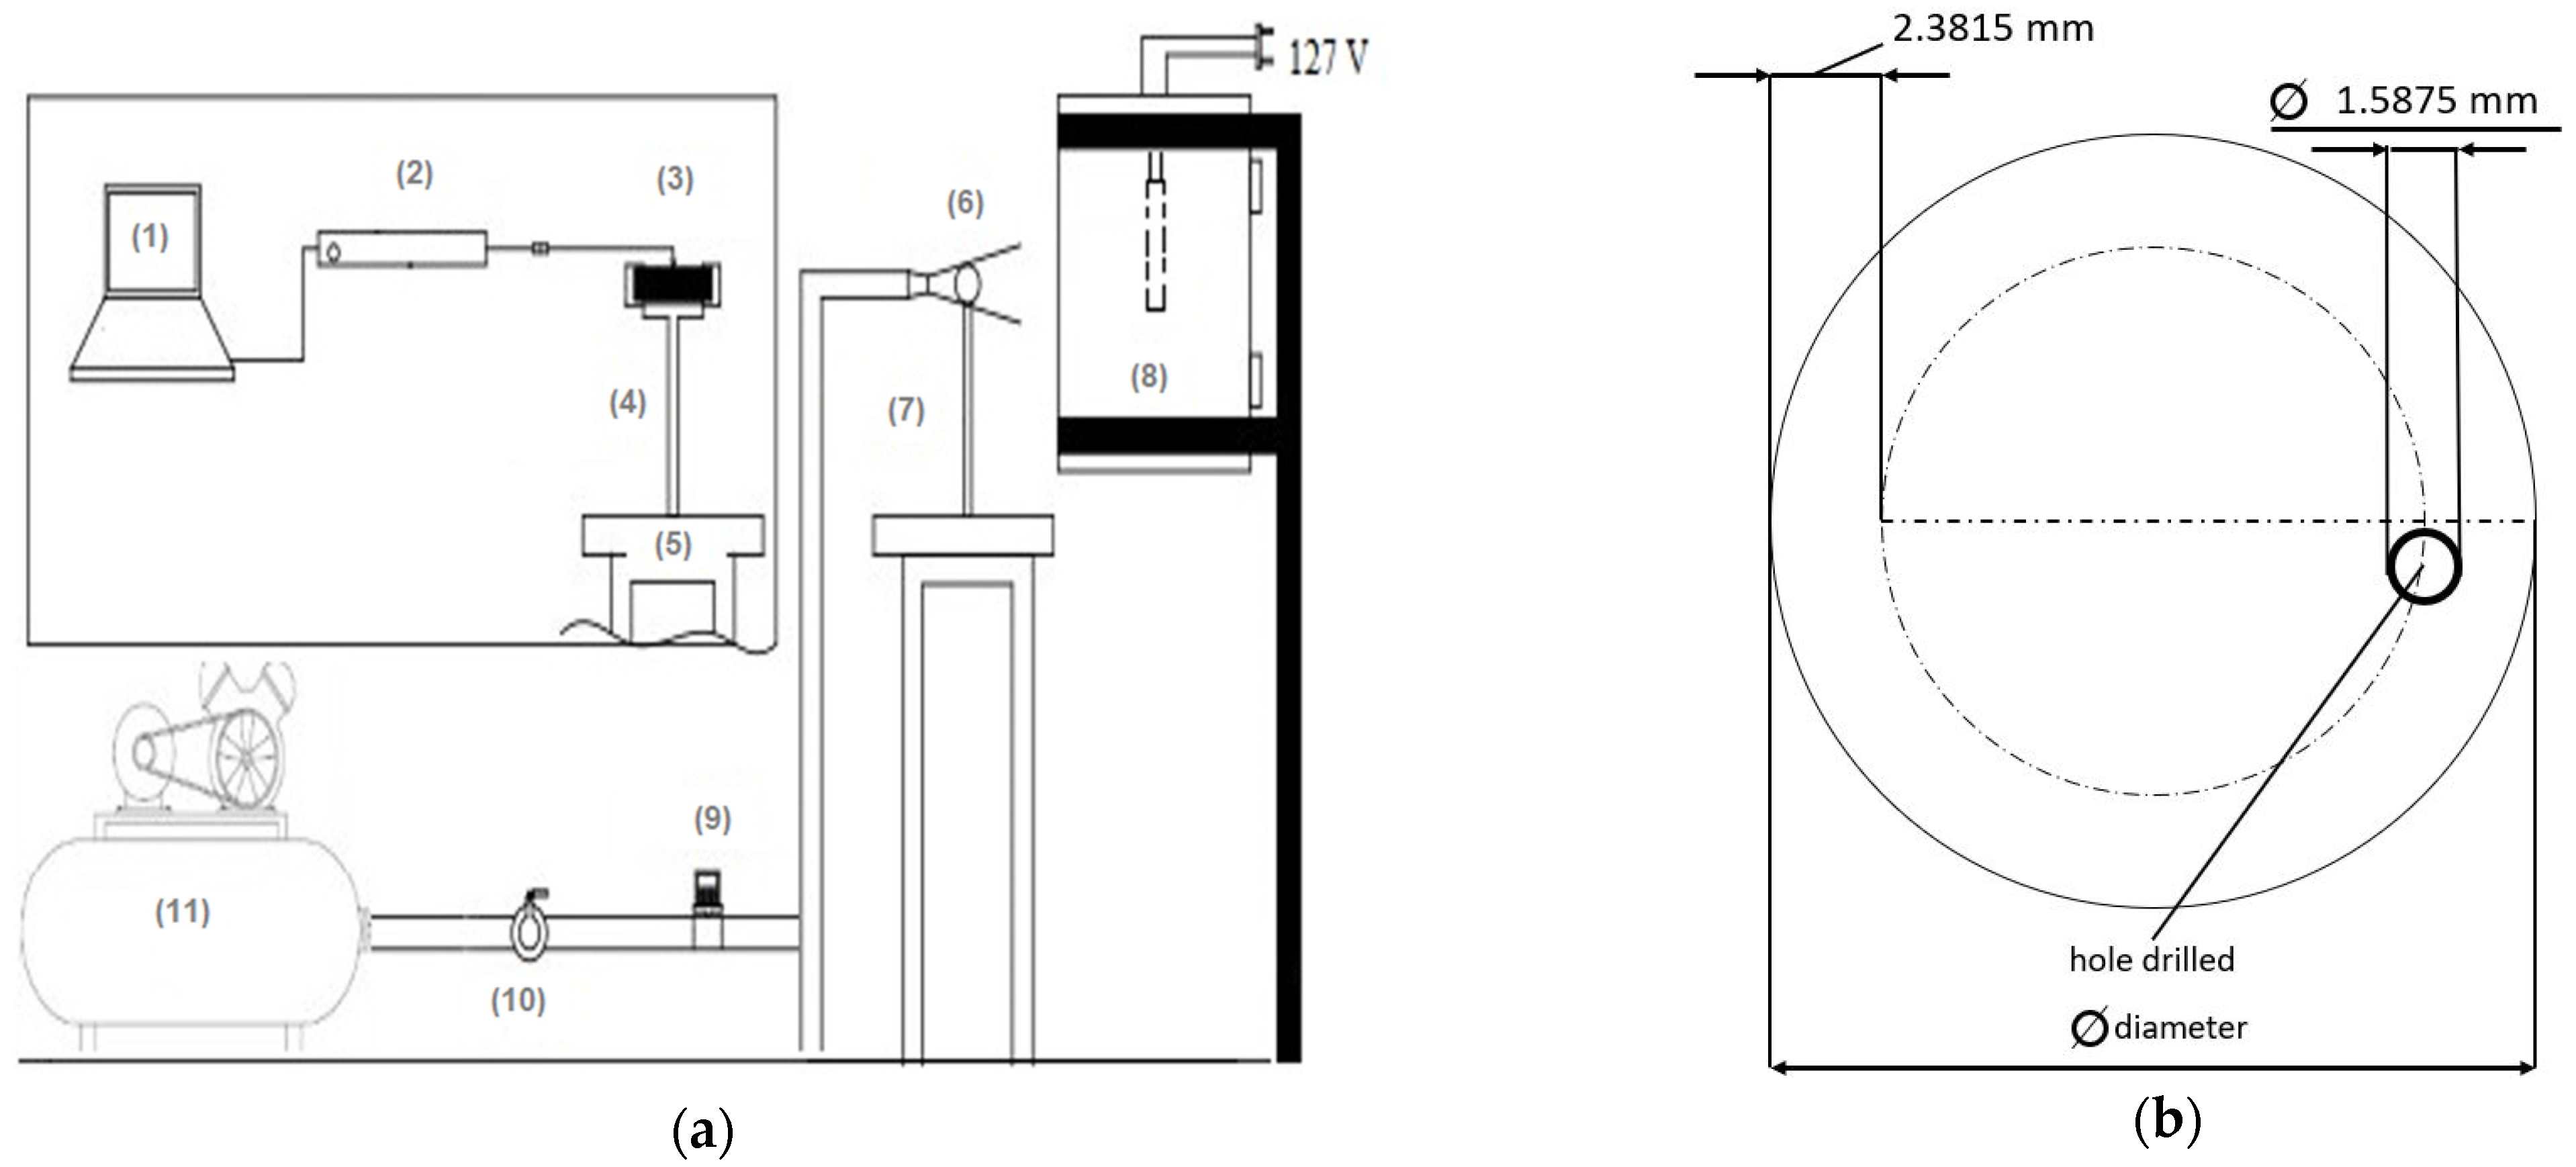
Figure 1. (a) Schematic representation of the experimental set-up used to cool the cylindrical specimens (1) server, (2) data acquirer, (3) thermocouple, (4) thermal insulator, (5) holder, (6) specimen, (7) nozzle, (h) furnace, (8) gauge, (9) valve and (10) air compressor. (b) Top view of specimens.
Metals 11 00224 g001
Figure 2. Solution algorithm for the simulation model coupled to the UDF to calculate the microstructural evolution of pearlite using the experimental thermal boundary condition.
Metals 11 00224 g002
Figure 3. Heat flux estimated by solving the inverse heat conduction problem as a function of (a) diameter and (b) air velocity.
Metals 11 00224 g003
Figure 4. Comparison between the experimental and estimated thermal histories with the simulation model for the specimens and established conditions, for (a) specimen 1, (b) specimen 2, (c) specimen 3, and (d) specimen 4.
Metals 11 00224 g004
Figure 5. Microstructural evolution of the pearlite superimposed on the estimated thermal history for each of the specimens varying the diameter and air velocity, for (a) specimen 1; (b) specimen 2; (c) specimen 3; and (d) specimen 4.
Metals 11 00224 g005aMetals 11 00224 g005b
Figure 6. SEM micrograph of the initial microstructure for the high-carbon steel wire rod in as-rolled condition, showing a characteristic coarse pearlite (CP).
Metals 11 00224 g006
Figure 7. SEM micrographs showing the different pearlite colony sizes with coarse pearlite (CP) and fine pearlite (FP), for (a) specimen 1, (b) specimen 2, (c) specimen 3, and (d) specimen 4.
Metals 11 00224 g007
Table 1. Chemical composition of the steel studied, % wt.
CSiMnPSCrAlCuNiMo
0.830.200.770.0040.0090.240.0010.0520.0210.003
Table 2. Cooling conditions applied to eutectoid steel specimens.
SpecimenDiameter (m)Average Cooling Rate (°C s−1)Average Air Velocity (m s−1)
10.010107.8
20.010129.5
30.01579.5
40.0151014.7
Table 3. Microstructural parameters for the analyzed cooling conditions.
SpecimenD (m)Va (m s−1)Ar3-s (°C)ti-s (s)ΔT = Ae −Ar3-sΔtT (s)Sp (nm)HV0.1/15
10.0107.86193210824110 ± 15337 ± 10
20.0109.56152811223100 ± 10343 ± 10
30.0159.5635409230180 ± 17313 ± 11
40.01514.76154111224170 ± 16343 ± 12
Publisher’s Note: MDPI stays neutral with regard to jurisdictional claims in published maps and institutional affiliations.