Article

Influence of High Pressure Sliding and Rotary Swaging on Creep Behavior of P92 Steel at 500 °C

1
Czech Academy of Sciences, Institute of Physics of Materials, 616 00 Brno, Czech Republic
2
Department of Engineering, Kyushu Institute of Technology, Kitakyushu 804-8550, Japan
3
Magnesium Research Center, Kumamoto University, Kumamoto 860-8555, Japan
4
Synchrotron Light Application Center, Saga University, Saga 840-8502, Japan
5
Technology Department, Nagano Forging Co., Ltd., Nagano 381-0003, Japan
6
UJP PRAHA a.s., Zbraslav, 156 10 Praha, Czech Republic
*
Author to whom correspondence should be addressed.
Metals 2021, 11(12), 2044; https://doi.org/10.3390/met11122044
Submission received: 10 November 2021 / Revised: 10 December 2021 / Accepted: 14 December 2021 / Published: 16 December 2021
(This article belongs to the Special Issue Severe Plastic Deformation Techniques of Metal Alloys)

Abstract

:
High-pressure sliding (HPS) and rotary swaging (RS) at room temperature were used to form severely deformed microstructures in martensitic creep-resistant P92 steel. The deformed microstructures contained markedly different ratios of low- and high-angle grain boundaries (LAGBs/HAGBs). The application of the RS method, with an imposed equivalent strain of 1.4, led to the formation of a heterogeneous microstructure with a high number of LAGBs, while the HPS method, with an imposed equivalent strain of 7.8, led to the formation of a relatively homogeneous ultrafine-grained microstructure with a significant predominance of HAGBs. Microstructure analyses after creep testing showed that the microstructure of RS- and HPS-processed P92 steel is quite stable, but a slight coarsening of subgrains and grains during creep testing can be observed. Constant load tensile creep tests at 500 °C and initial stresses ranging from 300 to 900 MPa revealed that the specimens processed by HPS exhibited higher creep strength (slower minimum creep rate) and ductility compared to the coarse-grained and RS-processed P92 steel. However, the HPS-processed P92 steel also exhibited lower values of stress exponent n than the other investigated states of P92 steel. For this reason, the differences in minimum creep rates determined for different states decrease with decreasing values of applied stress, and at applied stresses lower than 500 MPa, the creep resistance of the RS-processed state is higher than the creep resistance of the HPS-processed state.

1. Introduction

Creep-resistant martensitic 9% Cr steels are characterized by good thermal conductivity, and high creep and corrosion resistance [1,2]. For this reason, these steels are used as important structural materials for components of steam power plants. Their creep strength is significantly influenced by the thermal stability of low-energy boundaries, such as subgrain and martensite lath boundaries, coarsening of precipitates and formation of new phases [3,4]. The strength and corrosion resistance of these steels is also influenced by grain refinement. It is known that the grain size of materials can be reduced down to the submicroscopic level by severe plastic deformation (SPD) methods (e.g., methods based on equal channel angular pressing–ECAP [5,6,7,8]). The influence of SPD on the creep properties of materials is usually highly effective in pure metals [9]. The investigation of ECAP-processed pure Al and Cu revealed that their creep resistance is significantly higher after a single ECAP pass (imposed strain of about 1) than for their coarse-grained (CG) counterparts. However, their creep resistance decreases with increasing values of imposed strain. Nevertheless, the creep resistance of pure Al and Cu is still higher than the creep resistance of the CG un-pressed states, even after 12 ECAP passes [9,10].
In the case of SPD-processed alloys, such as Al-Sc, Al-Mg-Sc, Ti-6Al-4V, Inconel 718 or Zr-Nb opposite results were found [9,11,12,13]. The majority of SPD-processed alloys exhibited significantly lower creep resistance compared to their CG states, even after an imposed plastic strain of about one when the SPD-processed microstructure contains a large volume of low-angle grain boundaries (LAGBs). However, alloys after the application of SPD very often exhibit high strain rate superplasticity occurring at lower temperatures and faster strain rates, compared to alloys with a standard grain size [13,14].
The reported creep results on SPD-processed martensitic Cr steels [15,16,17,18] showed that the application of high-pressure torsion (HPT), equal channel angular pressing (ECAP) and high-pressure sliding (HPS) with εeq~8 leads to a significant decrease in creep resistance at 600 and 650 °C, but to higher ductility compared to CG steels. On the other hand, creep results on P92 steel after the application of rotary swaging (RS) with εeq~1.4 showed that RS-processed P92 steel can exhibit slightly higher creep strength (slower minimum creep rate ε ˙ m i n ) at 600 °C, but lower ductility than CG P92 steel. However, creep testing at 650 °C showed that the creep strength of CG P92 steel is significantly higher than in the RS-processed state.
The creep properties of SPD-processed P92 steel are influenced by the replacement of the initial martensite microstructure by different ratios of LAGBs and high-angle grain boundaries (HAGBs) formed during SPD processing at room temperature. Recent works have shown that the SPD-processed microstructure of SPD-processed P92 steel is not fully stable at a temperature of 600 °C and enables the fast formation of the secondary Laves phase during creep testing [19]. It was found that the creep behavior of SPD-processed P92 steel at 600 and 650 °C is significantly influenced by the creep mechanisms associated with HAGBs, such as grain-boundary sliding, enhanced recovery of dislocations at boundaries, or diffusion creep that deteriorate creep resistance [15,16,17,18].
However, the question naturally arises as to what creep behavior SPD-processed P92 steel will exhibit when the above-mentioned mechanisms are suppressed. It can be suggested that the activity of these grain boundary mediated processes decreases with decreasing testing temperature [20]. Therefore, the aim of the present work is the investigation of creep behavior and microstructures in P92 steel processed by RS and HPS tested at 500 °C. The experimentally determined results are compared with the creep behavior of standard P92 steel.

2. Experimental Material and Procedures

In this work, creep resistant chromium martensitic P92 steel is investigated. This steel contains about 9% Cr, 2% W and other elements, such as V and Nb, that are important for the formation of fine MX carbides. The experimental material was delivered in the form of a pipe with a wall thickness of 39 mm. Its chemical composition (in wt.%) was as follows: 0.11 C, 8.58 Cr, 0.33 Mo, 1.67 W, 0.37 Si, 0.48 Mn, 0.23 V, 0.06 Nb, 0.013 P, 0.037 N, 0.005 S, 0.0015 B, and 0.017 Al. The as-received CG state was subjected to the standard heat treatment, which consisted of normalization at 1050 °C for 1 h and tempering at 740 °C for 140 min. Both steps of heat treatment were performed on air.
From the thick-walled steel pipe, a rod with an initial diameter (d0) of 30 mm and a length of 200 mm was manufactured. The rod was gradually deformed by RS at room temperature to a final diameter (df) of 15 mm. The imposed equivalent strain, which is for RS expressed as the deformation ratio calculated as εeq = ln((d02/df2)), where d0 is the diameter of the rod before a swaging pass, and dn is the diameter of the rod after a swaging pass, was 1.4.
From the wall of the pipe were also cut sheets with a length of 100 mm, a width of 10 mm, and a thickness (t) of 1.1 mm. The sheets were processed by HPS with the sliding distance of a plunger x = 15 mm with respect to the anvil. The imposed equivalent strain ε e q = γ 3 = x t 3 during HPS at room temperature was 7.8. Where γ is shear strain, x is the sliding distance of the plunger and t is the sample thickness.
Further details regarding the SPD techniques used in this investigation are given elsewhere [21,22,23,24]. Both the rod for RS and sheets for HPS were manufactured in the direction parallel to the longitudinal axis of the pipe.
The constant load creep tests in tension were performed at 500 °C and stress range from 300 to 900 MPa. The change of the specimen length was measured using LVDT (from Hottinger Baldwin Messtechnik GmbH, Darmstadt, Germany) attached to the tensile rod near the specimen. The strain determined during creep testing is the true strain. The creep testing was performed in a protective argon atmosphere using flat specimens. Not all creep tests were conducted to the fracture of the specimens. Some tensile creep tests were interrupted near the achievement of the minimum creep rate ε ˙ m i n . Some of the creep results for the CG P92 steel were obtained from stress-increasing tests.
The microstructure was investigated by a transmission electron microscope (TEM) Jeol 2100 F (JEOL Ltd., Tokyo, Japan) and a scanning electron microscope Tescan Lyra 3 (Tescan, s.r.o., Brno, Czech Republic) equipped with a NordlysNano EBSD detector (Oxford Instruments, High Wycombe, UK) operating at an accelerating voltage of 15 kV.
The microstructures of the specimens were investigated in the sections parallel to the direction of HPS and RS processing in both the specimen grip part and gauge length. The boundaries with a misorientation θ greater than 15° are designated as HAGBs, and LAGBs are characterized as boundaries with θ less than 15°. The values of geometrically necessary dislocations (GND) were calculated by the following equation [25]:
ρGND = αθ/(bx)
where the constant α was set as 3, x is unit length (Kernel size was set 5 × 5 pixels), b is Burger’s vector, and θ is the threshold angle. The threshold angle θ for LAGBs was set at 3°. The value of α is usually about 2–4 [26]. The constant α = 2 is recommended for pure tilt boundaries and α = 4 is recommended for a pure twist boundaries. A value of α = 3 is recommended for a strongly textured disorientation axis [27]. These results are used to compare the trends and differences between the different states of the P92 steel.
The dislocation densities ρ, evaluated from TEM micrographs were determined with the interception method [28] as:
ρ = 2N/(Ltf)
where N is the number of the points of intersections between test lines and dislocation lines, L is the total length of test lines, and the thickness of the TEM foil (tf) was estimated to be 200 nm [29]. TEM micrographs for the determination of dislocation densities were taken under two beam contrast conditions using g of [110] type. The dislocation densities of different states were determined from five grains.

3. Results

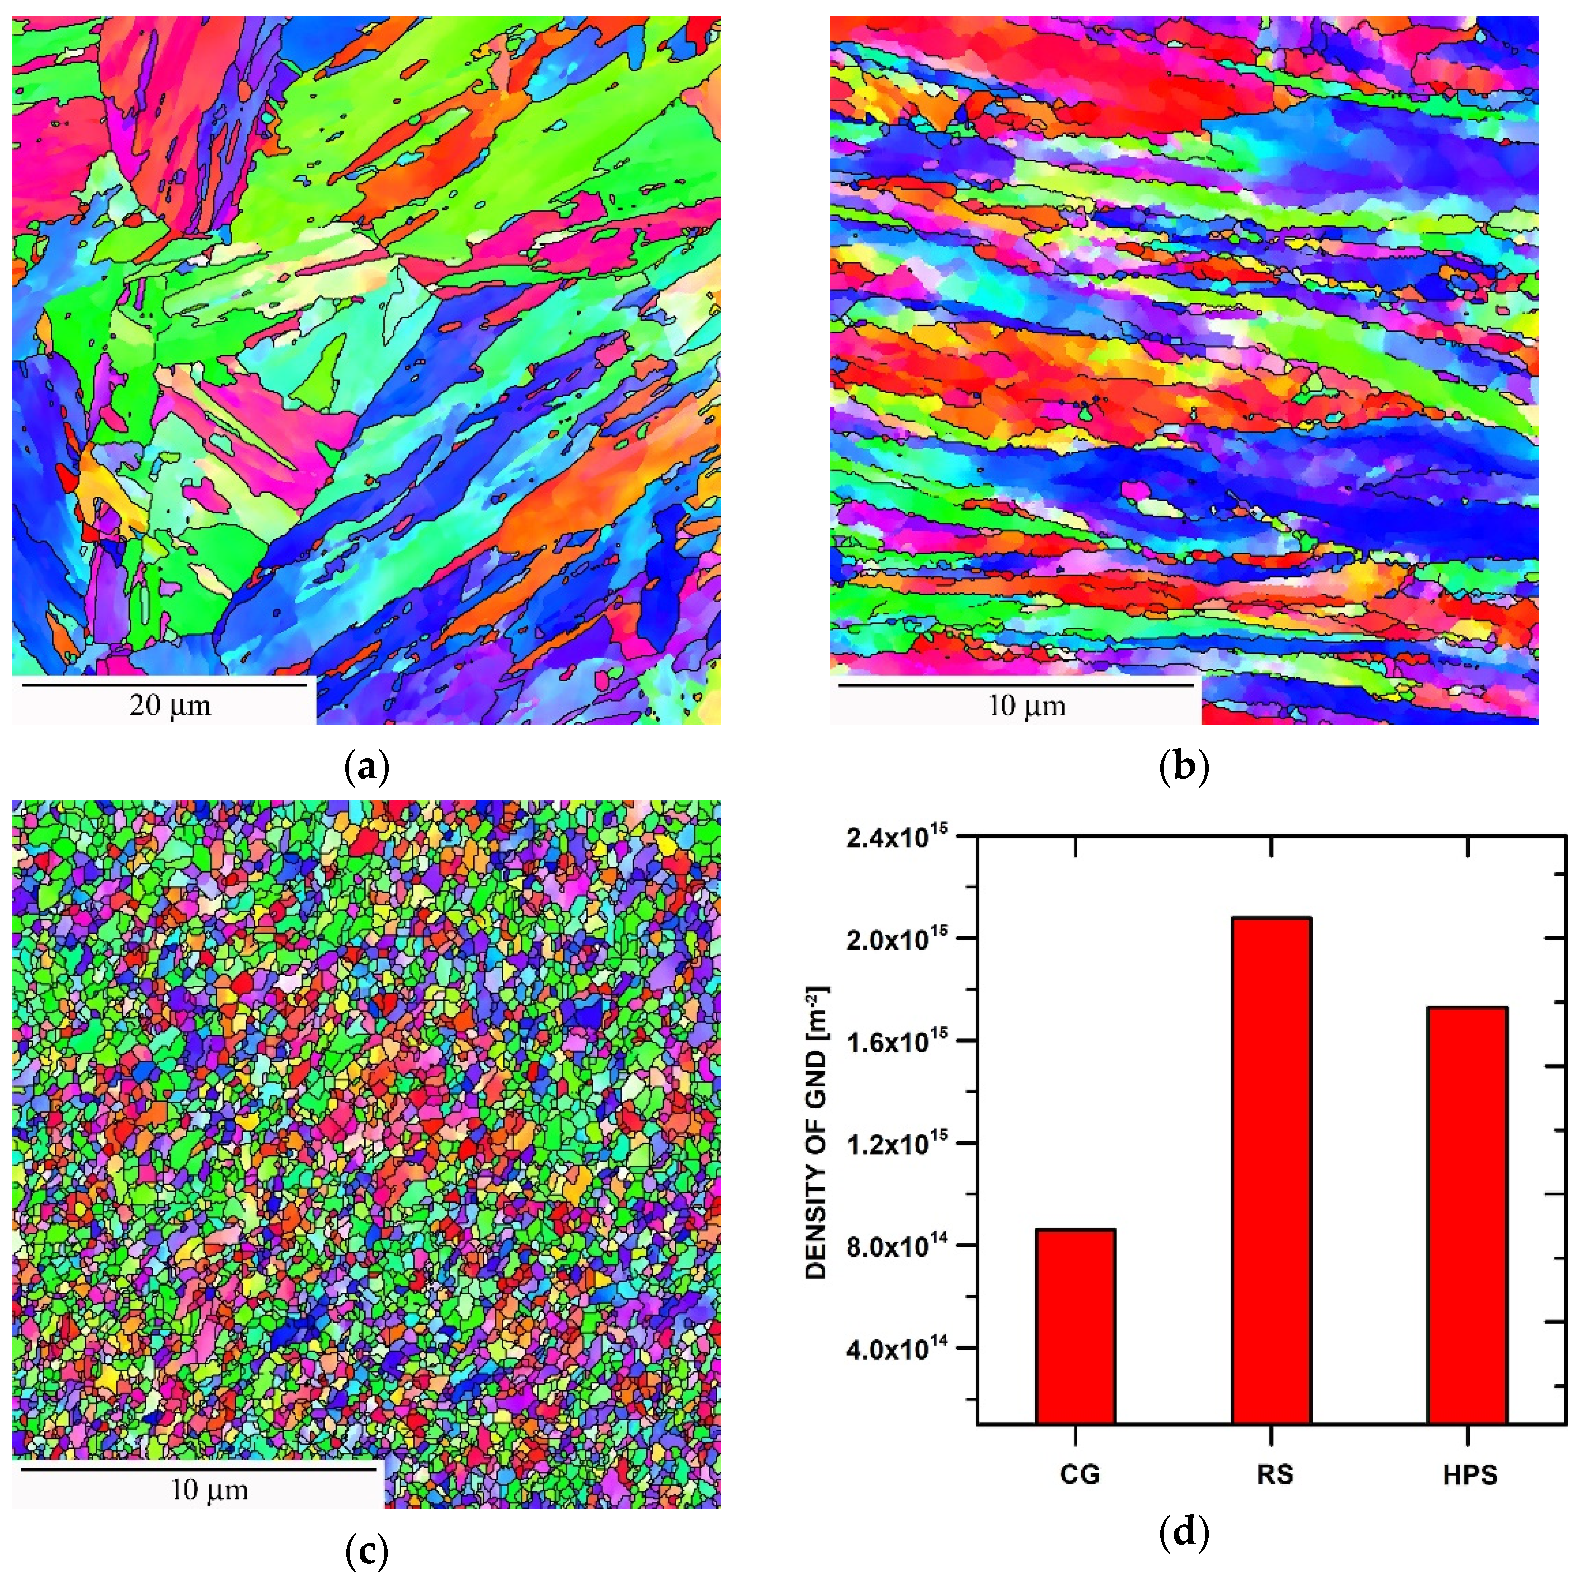
3.1. Microstructure before Creep Testing

The CG state (Figure 1a) contained prior austenite grains with a mean size of 12.7 µm with subgrains and martensite laths boundaries in their interiors. The mean subgrain size was about 1.3 µm and the mean spacing of all HAGBs was about 2 µm.
RS-processing led to the formation of a significantly heterogeneous grain structure (Figure 1b) containing fine nearly equiaxed submicron grains and large grains elongated parallel to the direction of swaging. The mean grain size of the RS-processed state was about 1 µm, the mean subgrain size was about 0.3 µm and the microstructure contained 35% HAGBs.
The HPS-processed microstructure (Figure 1c) contained a mean grain size of 0.2 µm, the mean subgrain size was about 0.15 µm, and the microstructure contained 70% HAGBs.
Figure 1d demonstrates that the application of SDP at room temperature led to the significant increase in the density of GND.

3.2. Creep Results

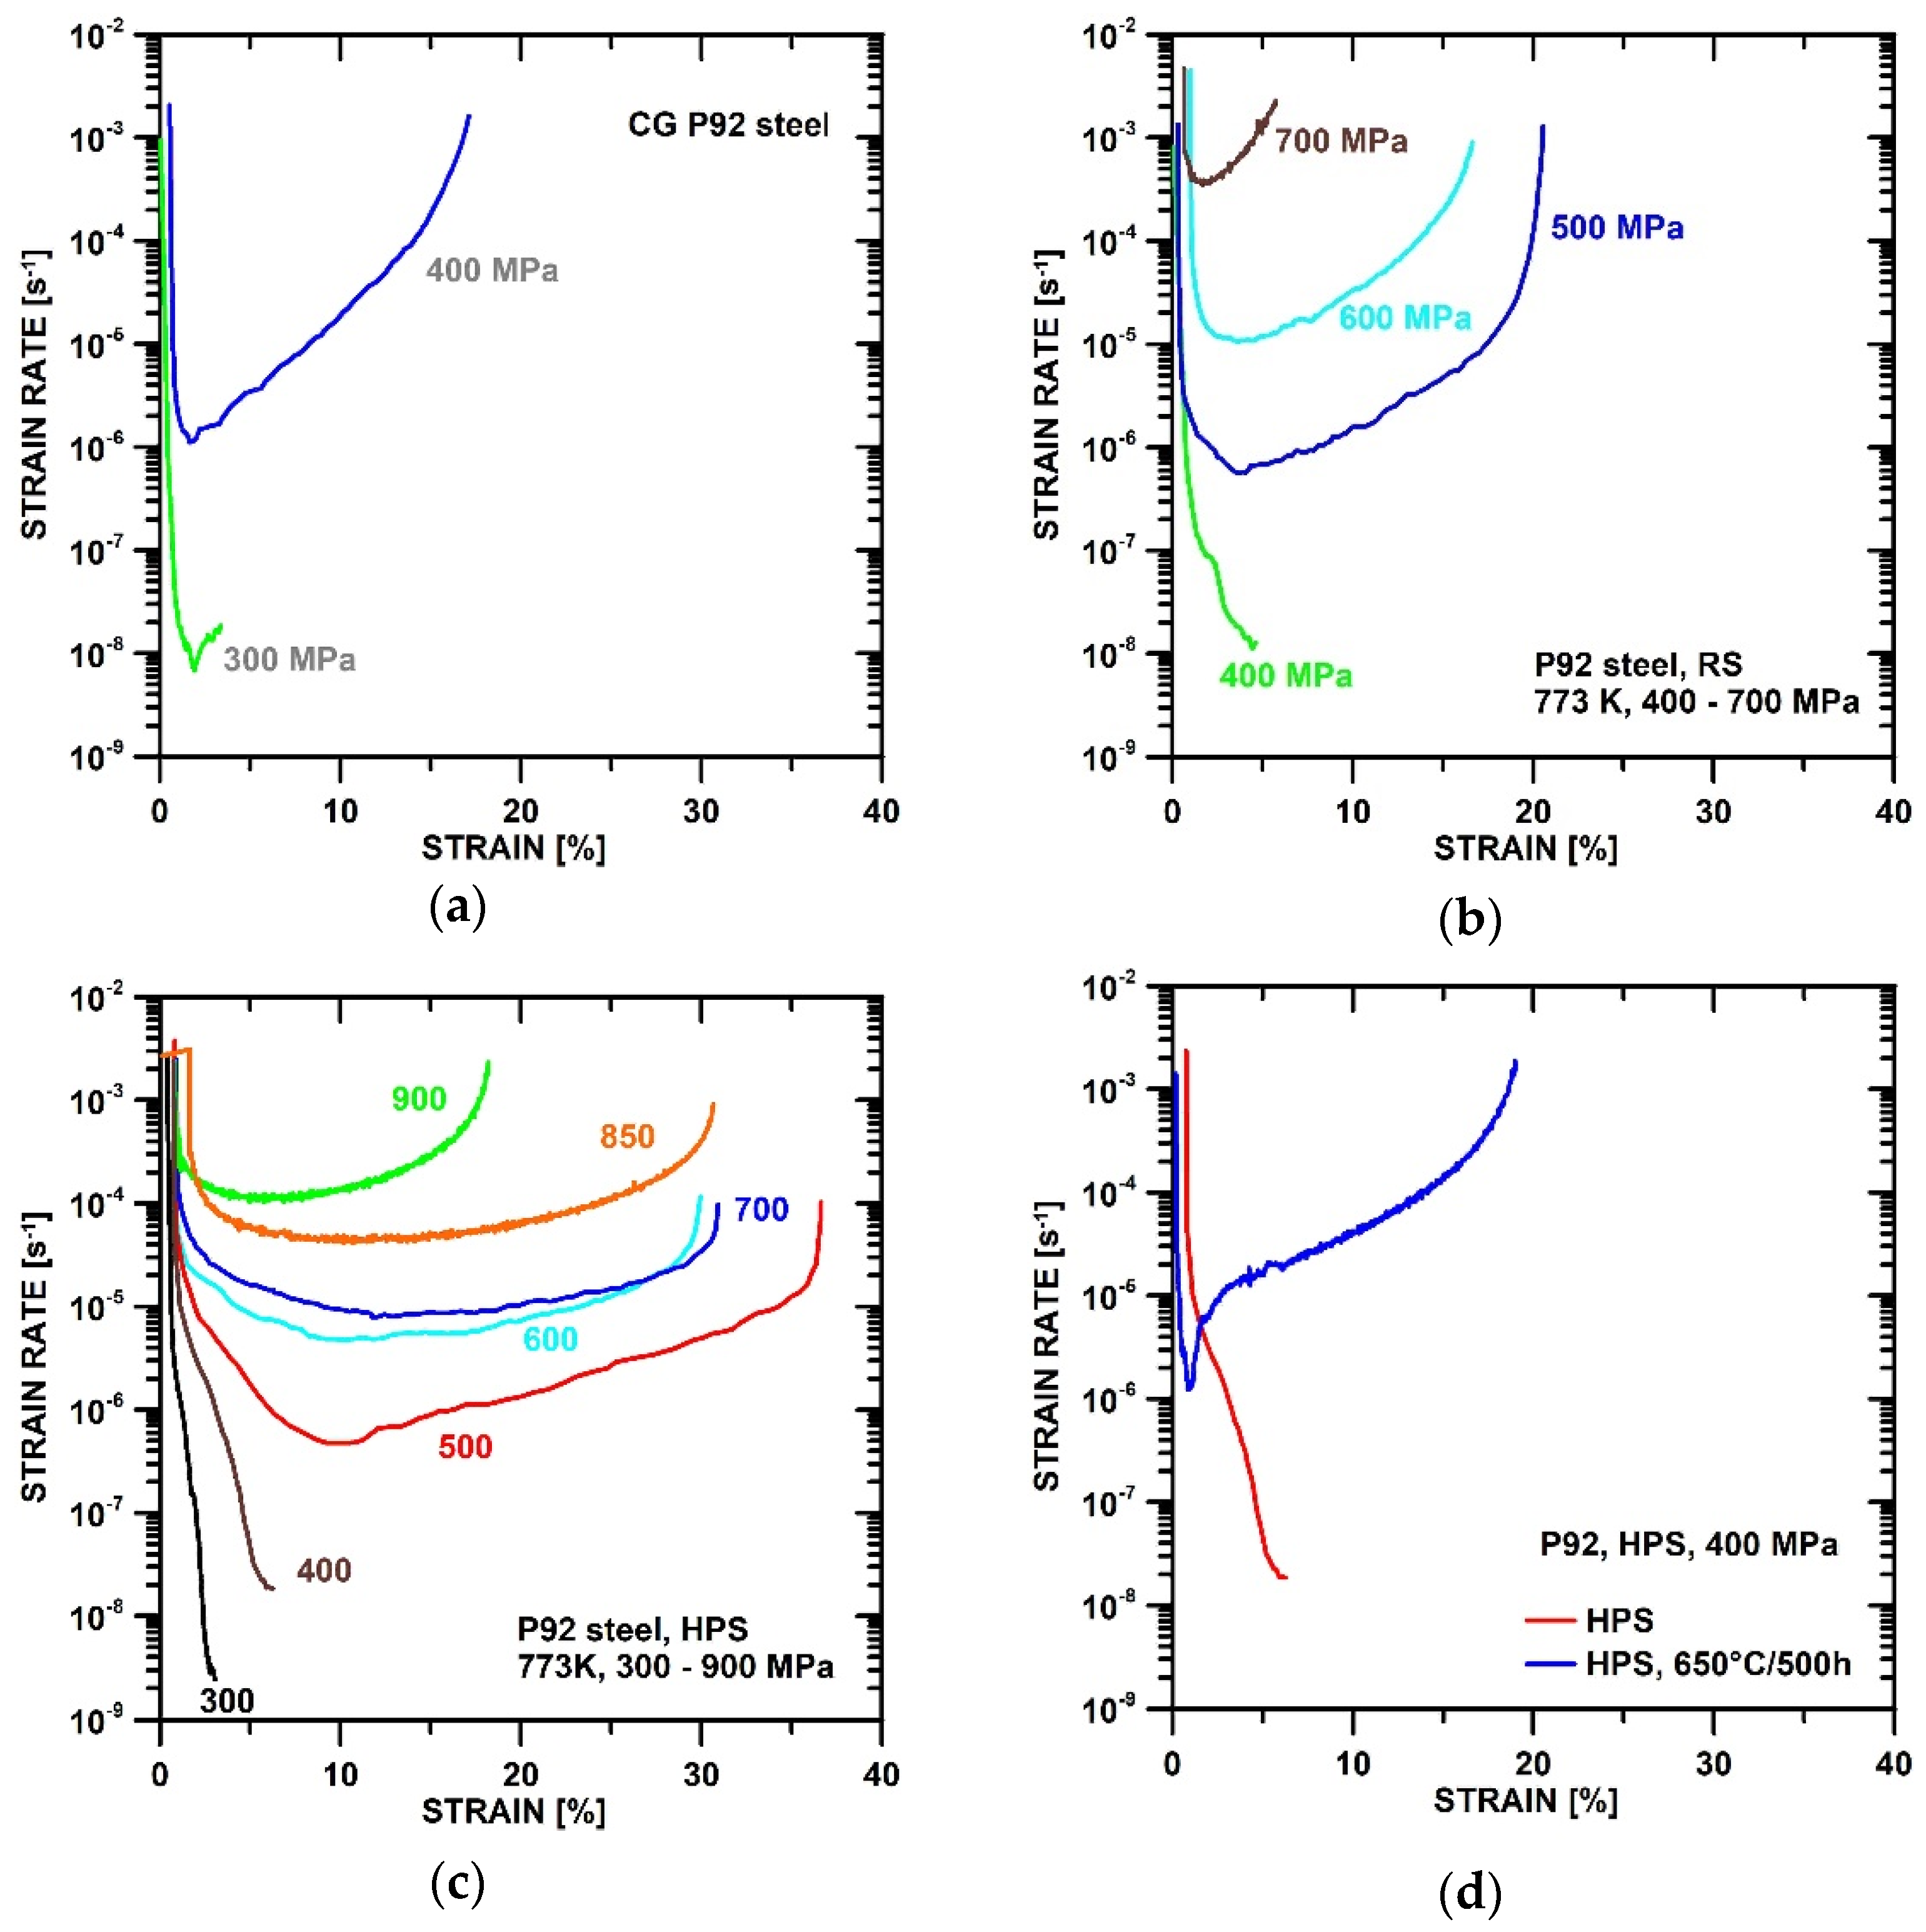
3.2.1. Dependencies of Strain Rate vs. Strain

Figure 2 shows the strain rate vs. the strain measured for the CG and SPD-processed states of P92 steel. The creep results show that the strain to fracture of P92 steel increases with the increasing equivalent strain imposed during SPD. The creep tests at low stresses were interrupted due to time constraints; thus, there are no results regarding the fracture strain.
The creep results demonstrate that the strain to fracture decreases with increasing value of applied stress in the range of medium to high stresses. One can see that the decrease of the fracture strain with increasing stress is more significant in RS-processed P92 steel compared to the HPS-processed state.
It can also be seen that the secondary stage (Figure 2) in the CG state is presented as a reflection point where the strengthening occurring during the primary stage turns into a softening occurring in the tertiary stage. The ε ˙ m i n for the CG state occurred at low strains at about 2%.
However, the RS-processed and, especially, the HPS-processed state ε ˙ m i n occurs at higher strains. In the case of the HPS-processed state, ε ˙ m i n was observed at a creep strain of about 10% at medium stresses. One can also see that the secondary stage in the HPS-processed state is not limited to the reflection point as in the CG state.

3.2.2. Stress Dependencies of Minimum Strain Rates and Time to Fracture

Figure 3a shows the stress dependences of the minimum strain rates measured for the SPD-processed states of the P92 and CG states. The creep results revealed that the P92 steel processed by HPS exhibited significantly slower minimum creep rates at stresses between 600 and 900 MPa than the CG and RS states. However, the HPS-processed steel exhibited lower values of stress exponent n = d l n ε ˙ / d l n σ . The creep results demonstrate that the value of n determined for the HPS-processed state decreases from n~11 to n~7 determined at high stresses between 600 and 900 MPa. The values of n determined for the CG and RS-processed state were about ncg~24 and nrs~18, respectively. Thus, the differences in ε ˙ m i n between the HPS-processed and other investigated states of P92 steel decreases with decreasing value of applied stress. For this reason, the stress dependence determined for the HPS-processed state crosses at about 500 MPa the stress dependence of RS-processed state and at stresses of 300 MPa it approaches the stress dependence for CG state. The creep result for the HPS specimen tested at 300 MPa is not included in the stress analysis because ε ˙ m i n was probably not achieved.
Figure 3b shows the stress dependencies of time to fracture for SPD-processed and CG P92 steel. One can see that the time to fracture for the HPS-processed state is significantly longer at stresses higher than 500 MPa in comparison with the RS and CG state. However, the differences in time to the fracture between the HPS-processed state and other states decrease with decreasing values of applied stress. At 400 MPa, the RS-processed state exhibited a significantly higher creep resistance than the HPS-processed state, and the creep test of the RS-processed state was interrupted due to time constrains. The results also show that annealing at 650 °C for 500 h prior to creep testing resulted in a significant reduction in the fracture time of the HPT-processed state.

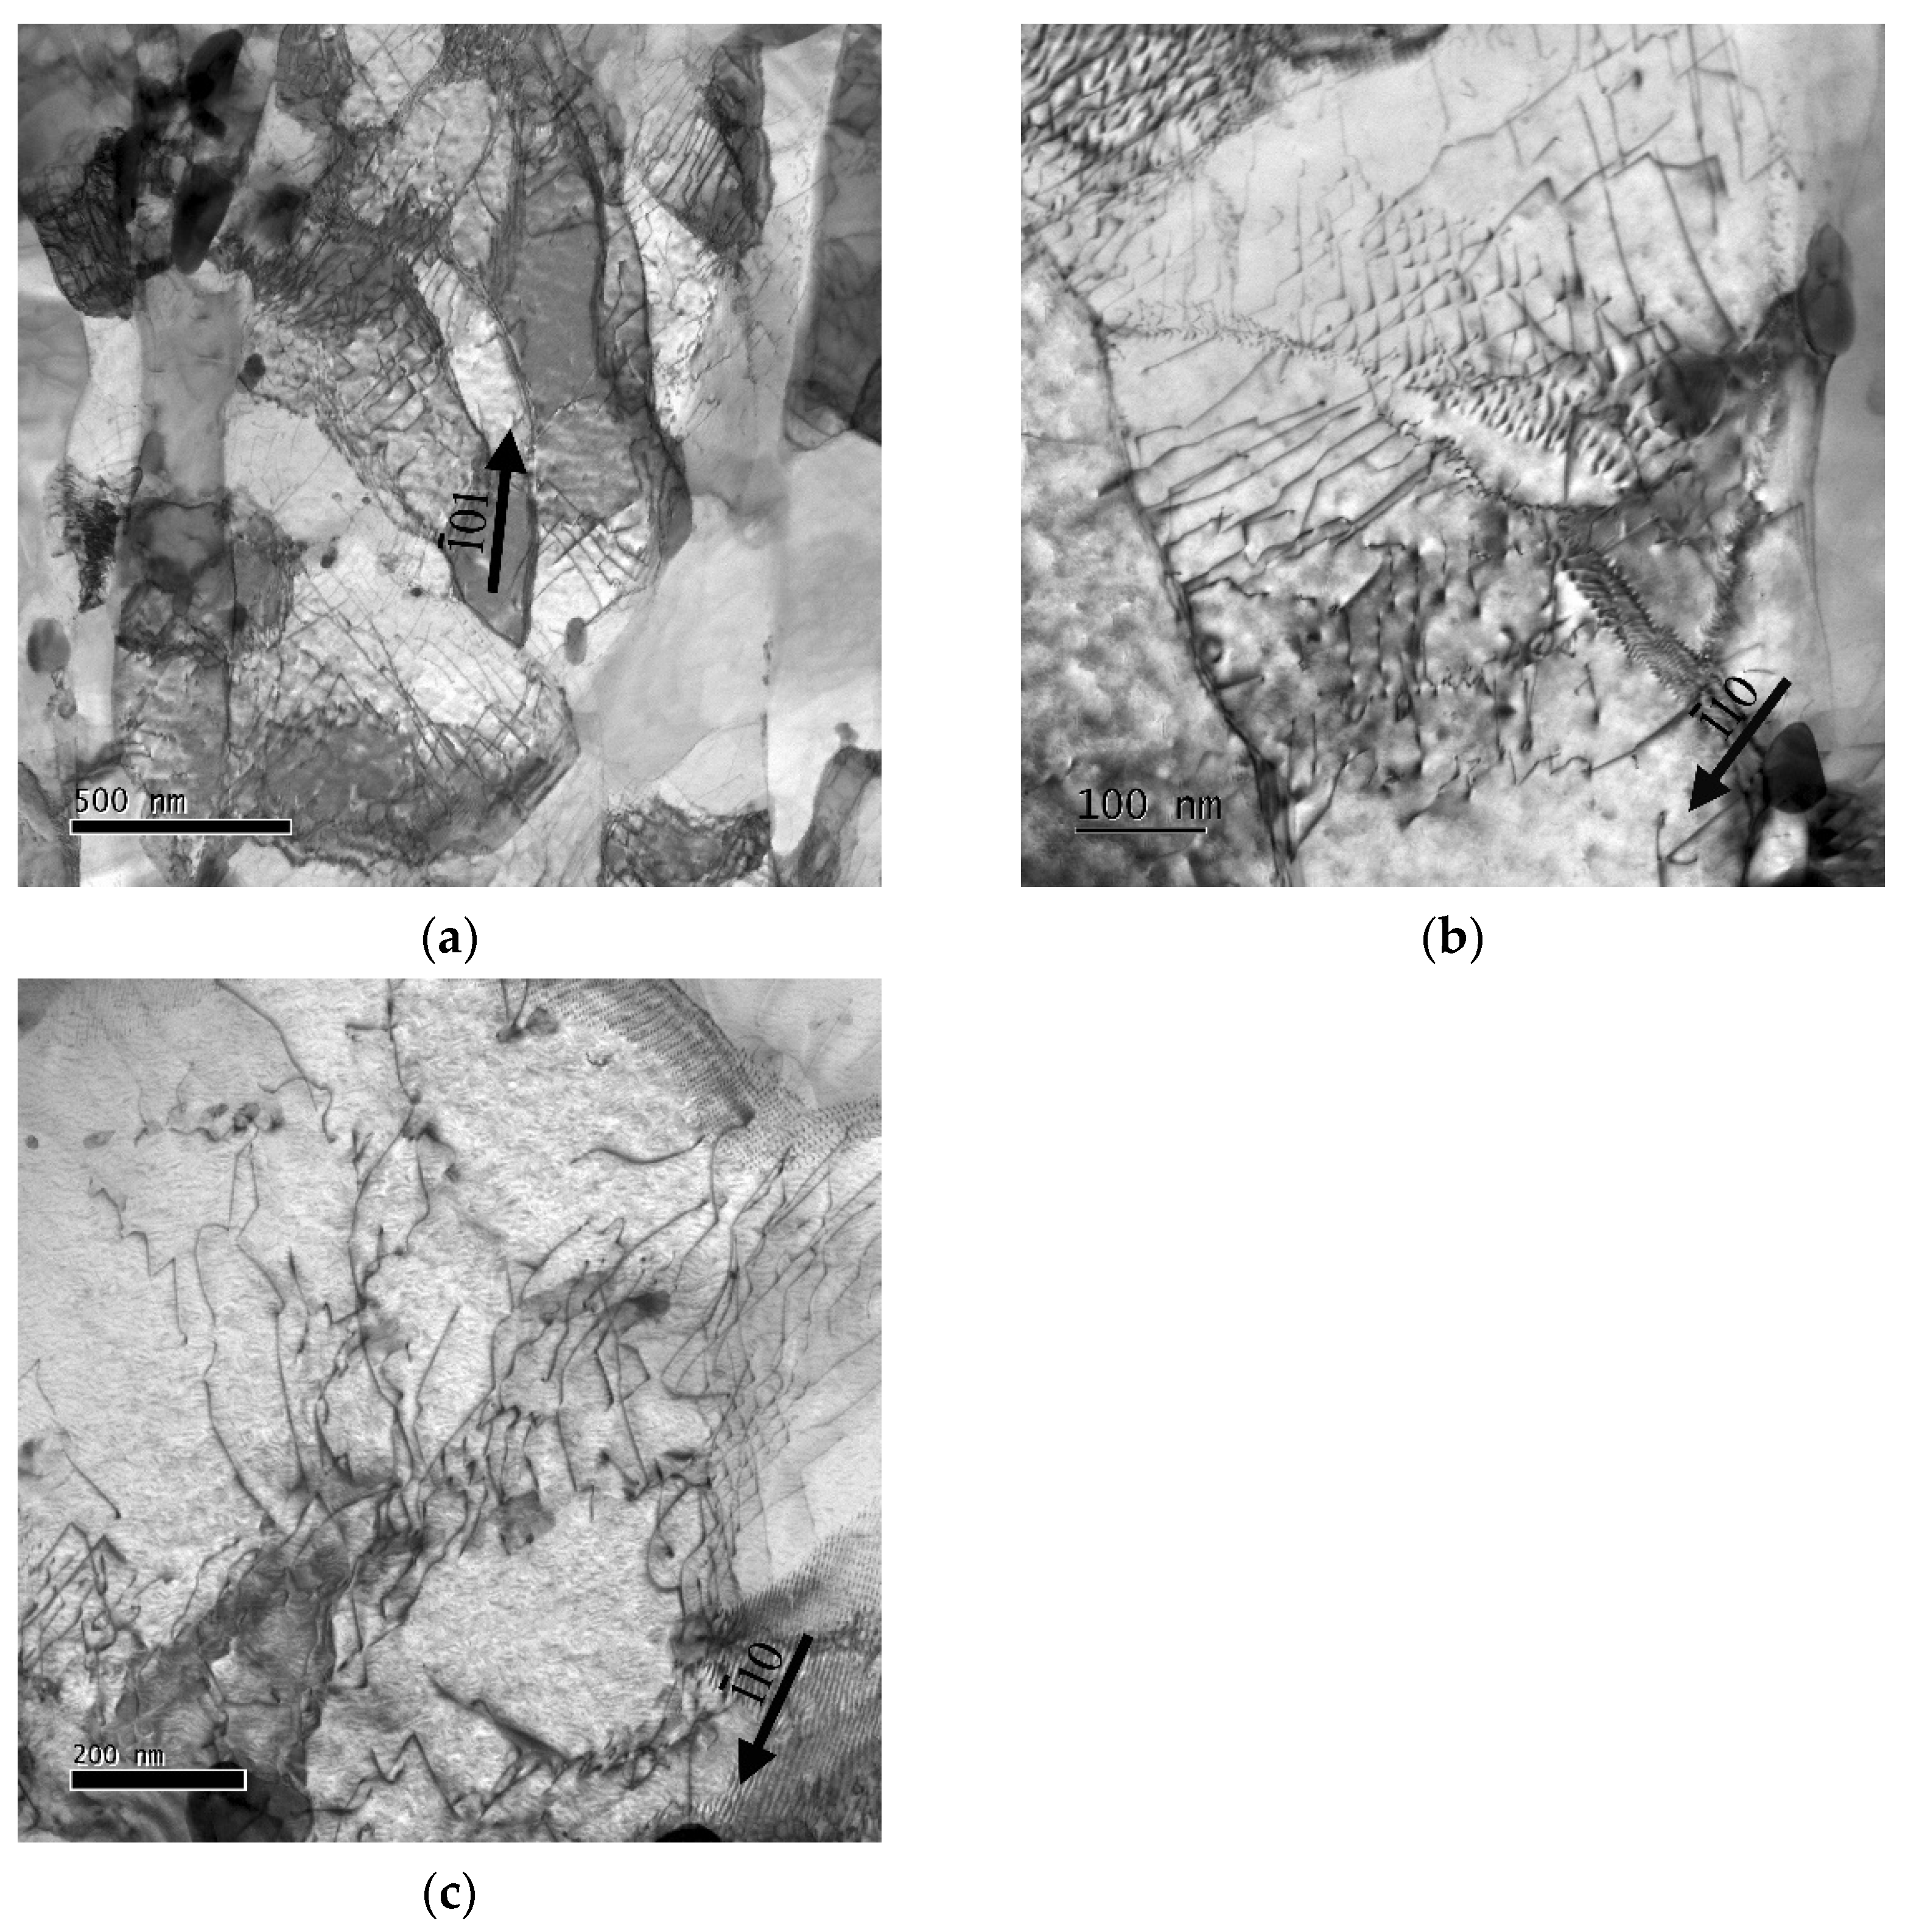
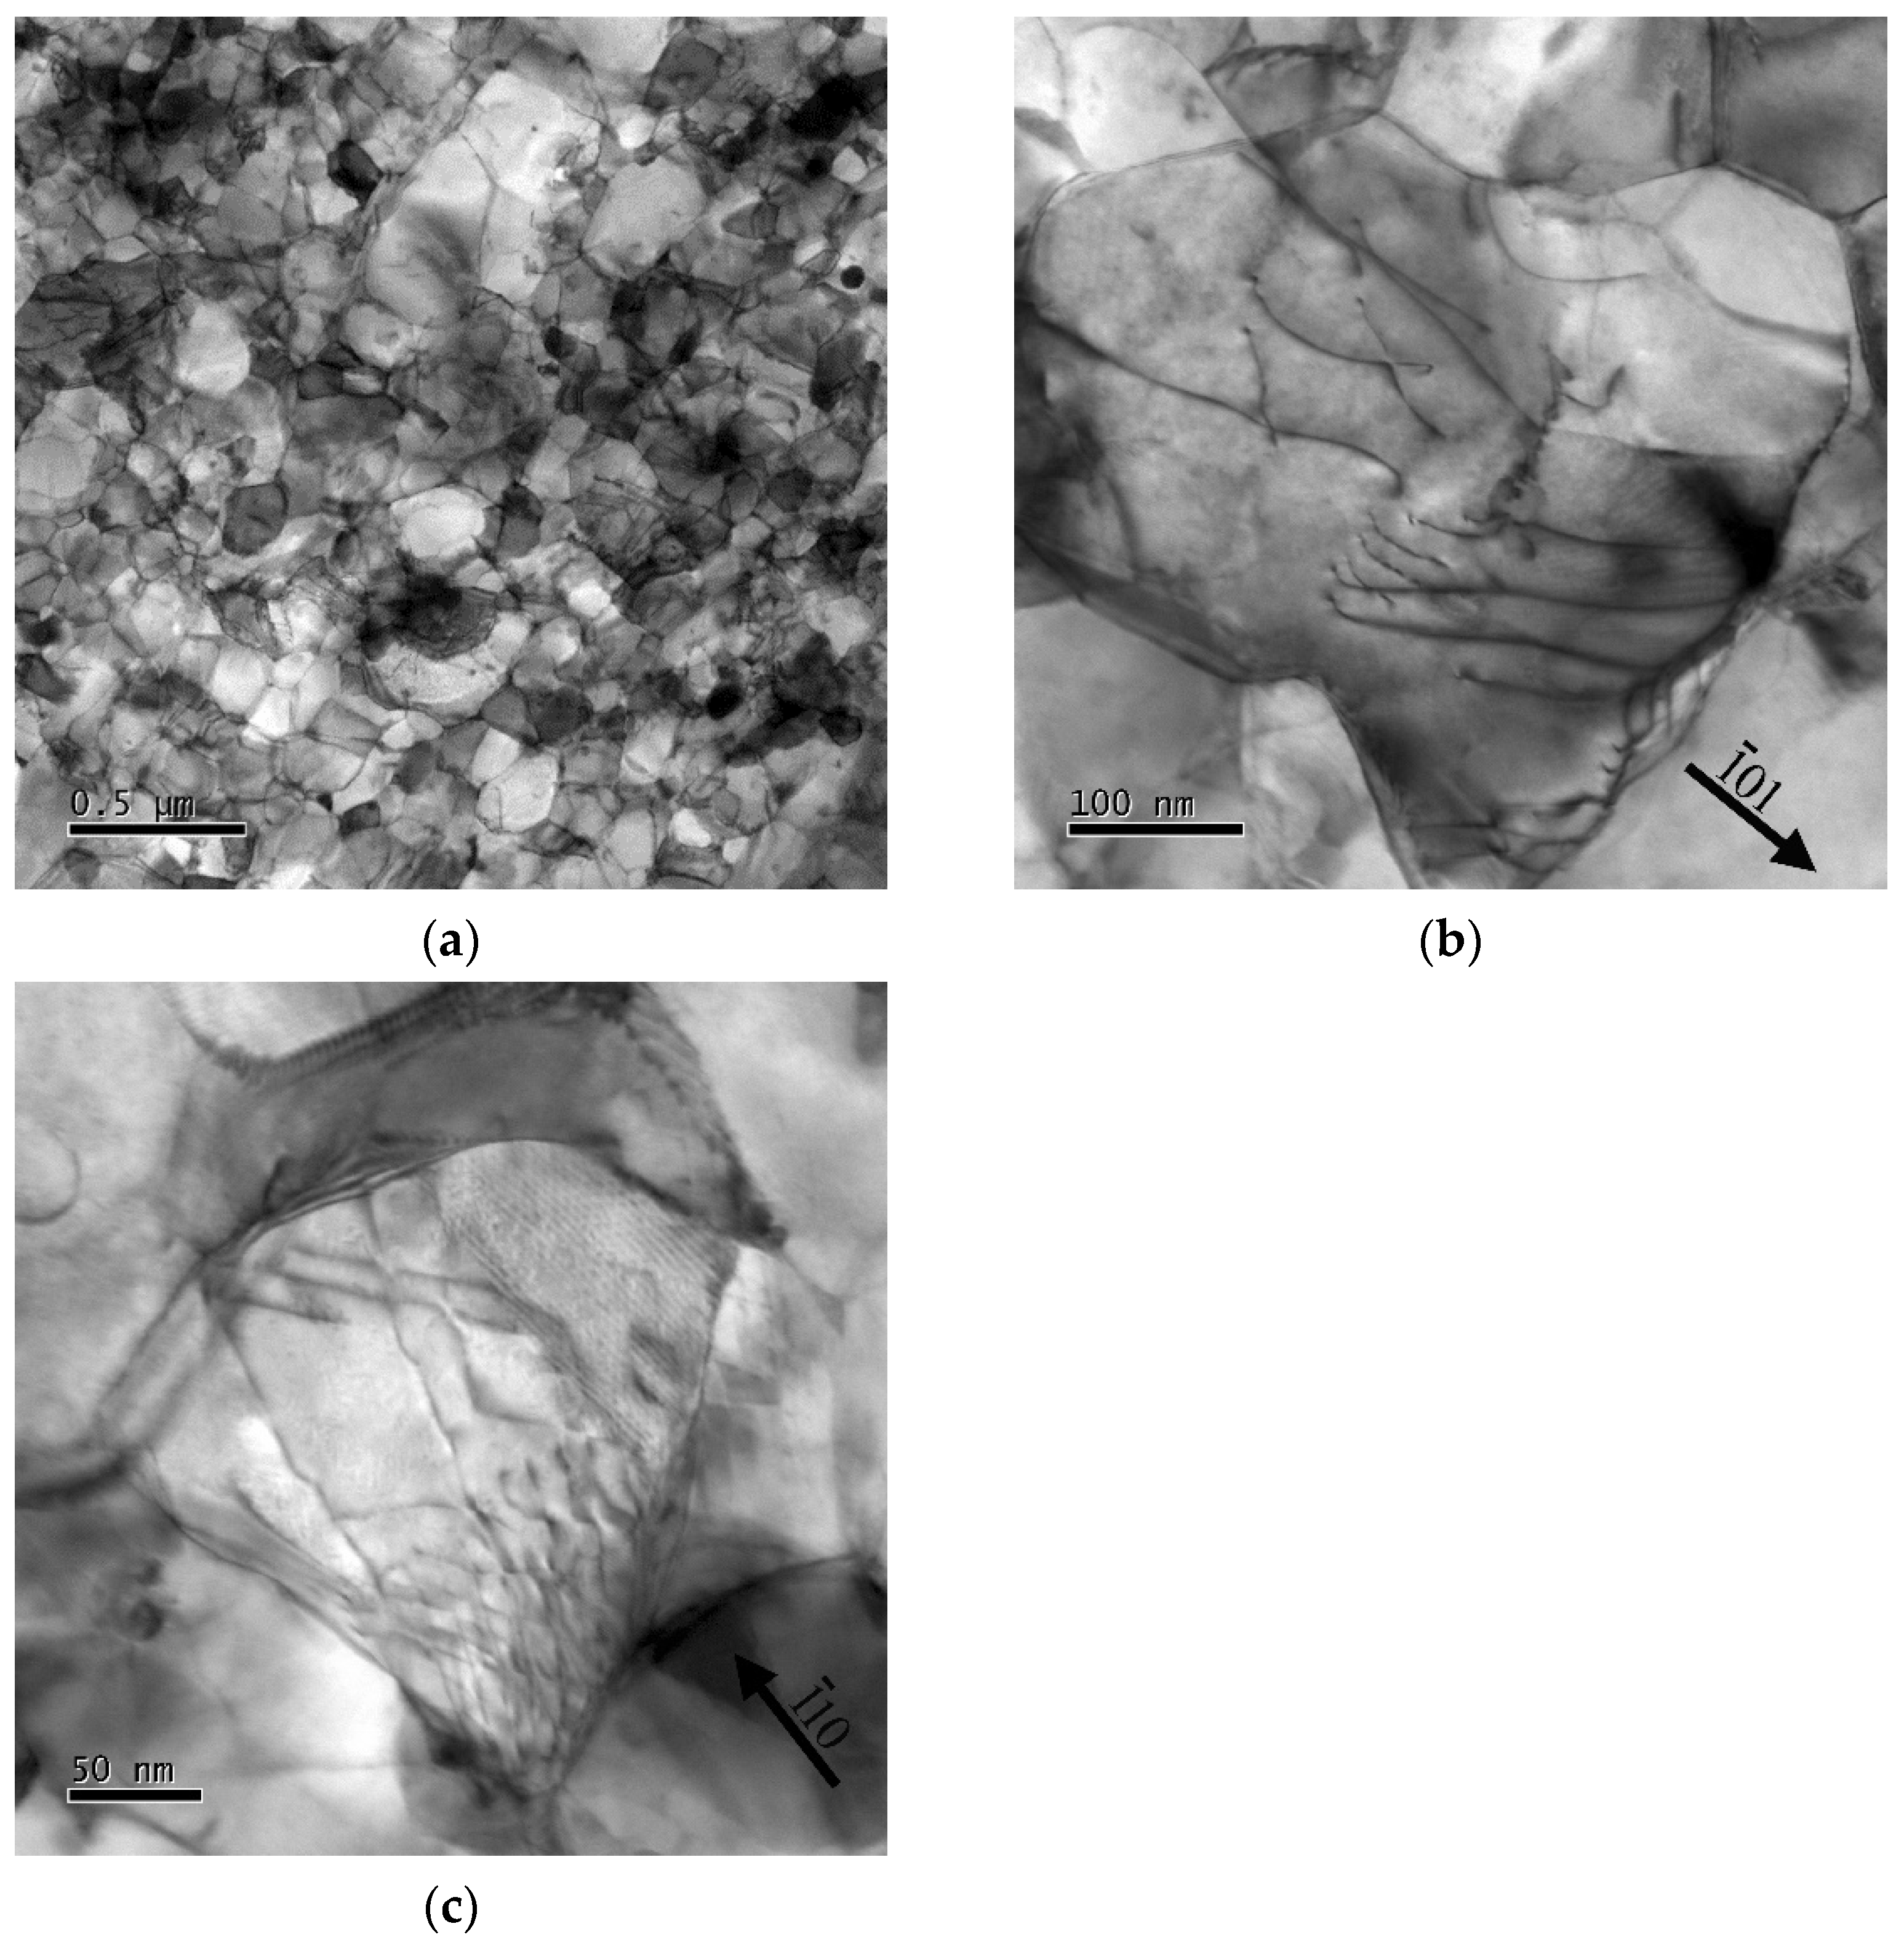
3.3. Microstructure after Creep Testing

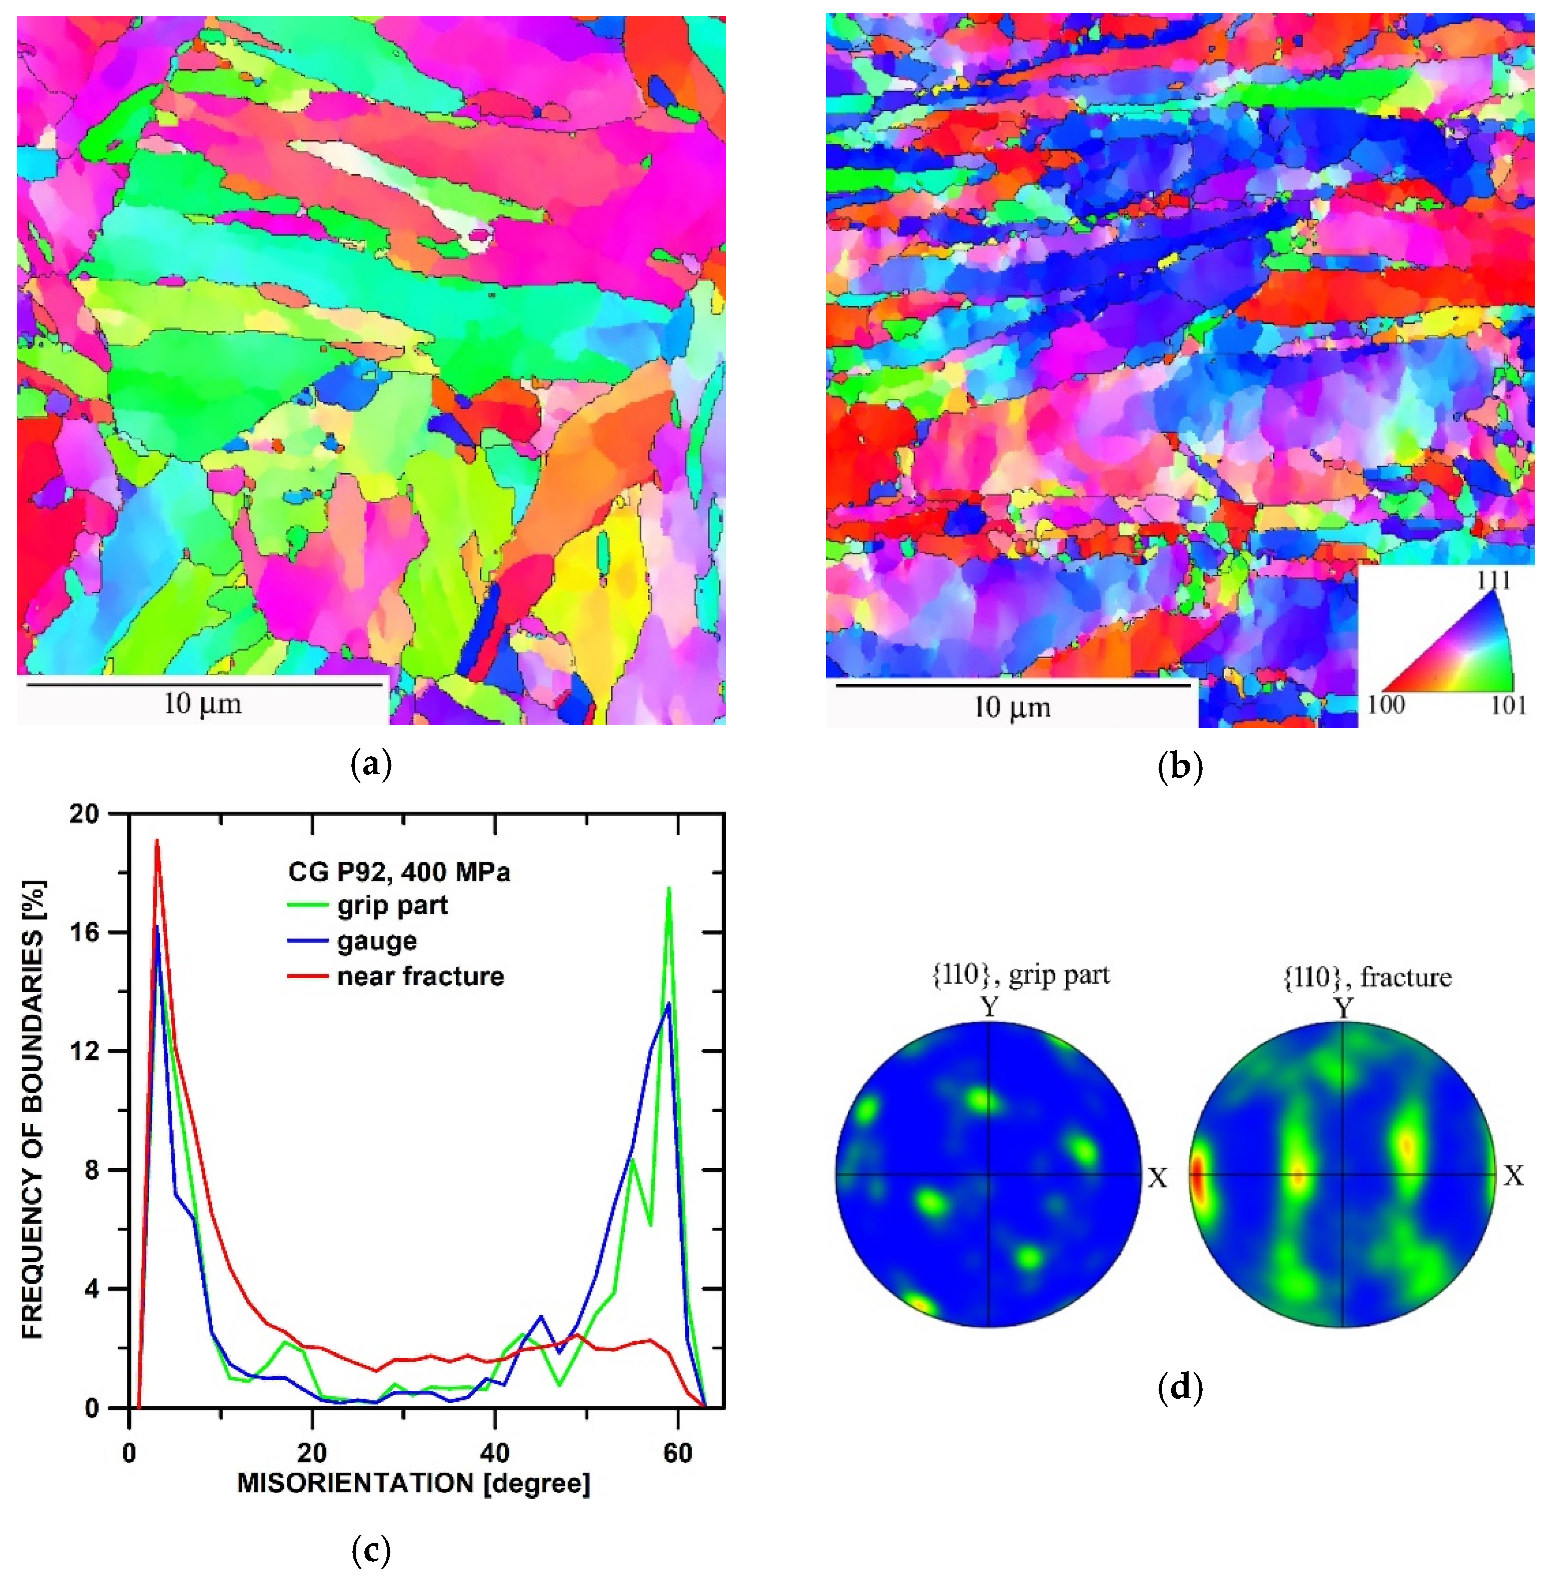
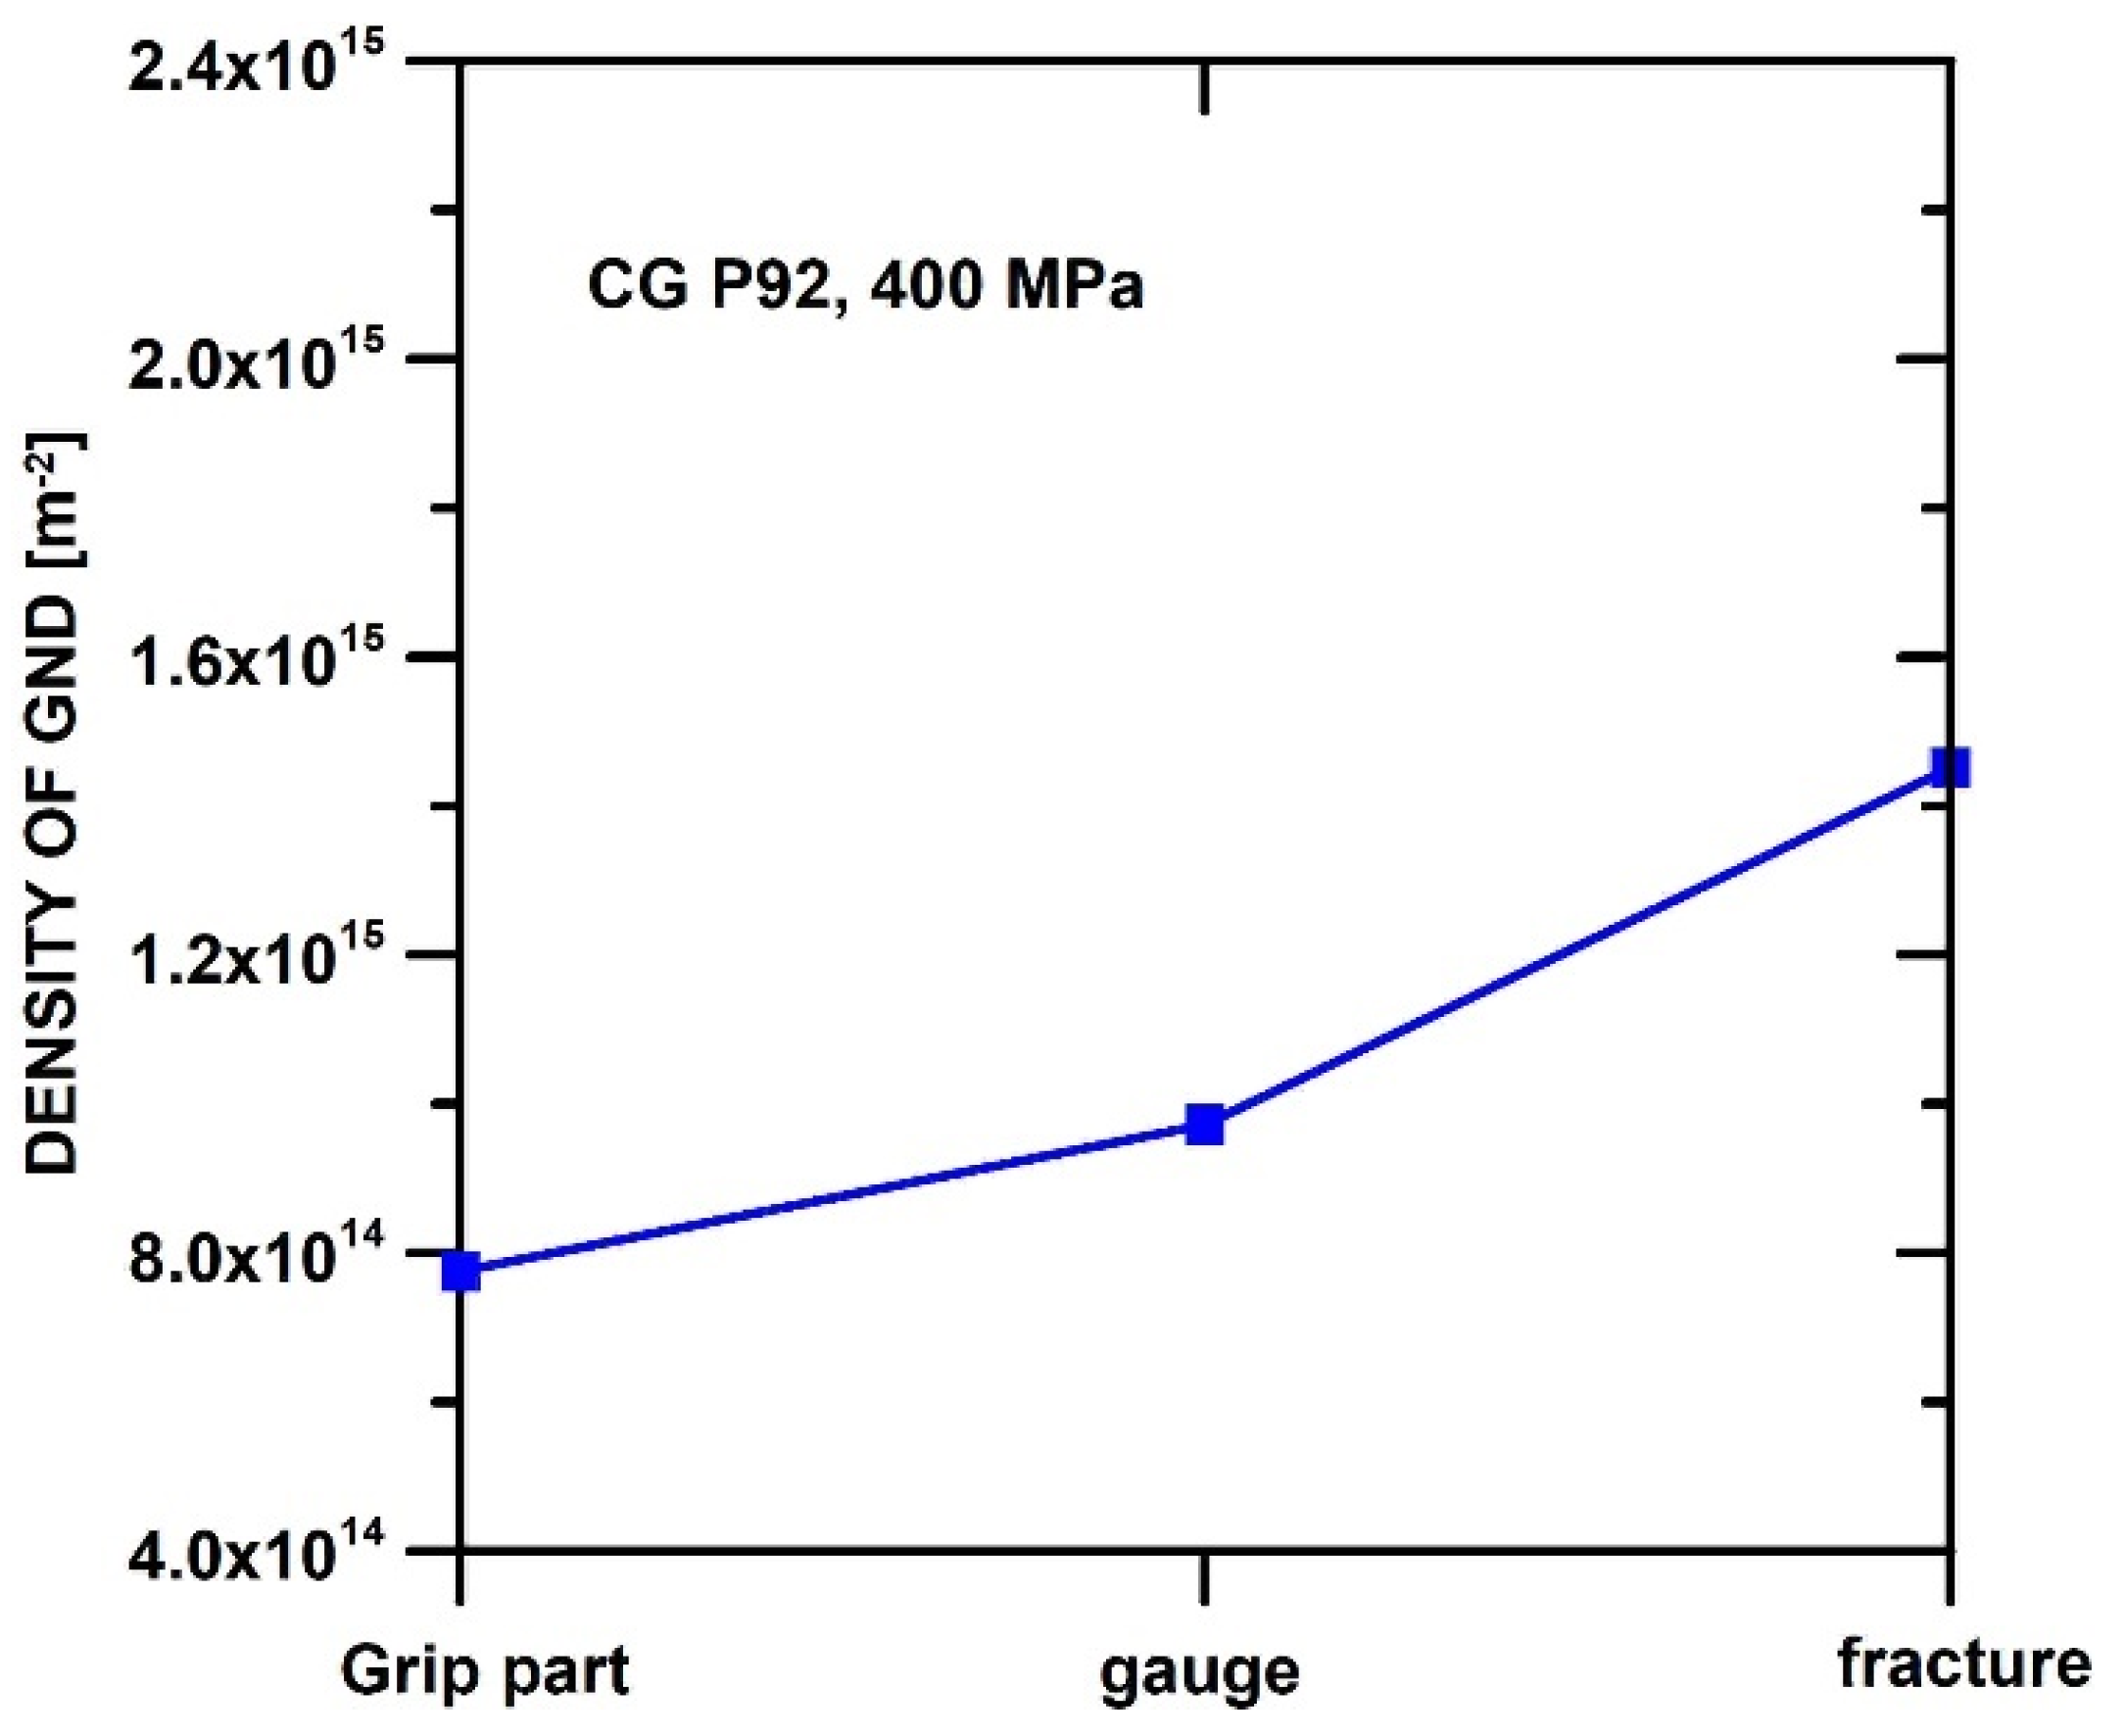
3.3.1. Microstructure of Coarse-Grained State

Figure 4a,b shows IPF (inverse pole figure) maps for CG P92 steel tested at 400 MPa in the grip part and near the fracture, respectively. The microstructure in the grip part contains prior austenite grains with subgrains and martensite laths boundaries oriented in various directions regarding the stress axis located in their interiors. The presence of laths boundaries is characterized by the occurrence of Σ3 boundaries with preferential misorientation near 111/60° (Figure 4). However, the grain boundaries located close to the fracture in the necking area have the tendency to turn parallel to the direction of the dominant stress, and the grains elongate. The number of martensite boundaries significantly decreases, and the number of LAGBs increases with increasing creep strain and stress near the fracture. Texture analyses (Figure 4d) showed that texture {113} <−310> slightly prevails in the microstructure of grip part. However, this texture is replaced near the fracture by a strong fiber texture of <110> || stress axis with significant {001}<110> and {111}<110> texture variants.
The EBSD results also show that the number of GND is higher in the microstructure of the gauge length and near the fracture compared to the grip part (Figure 5).

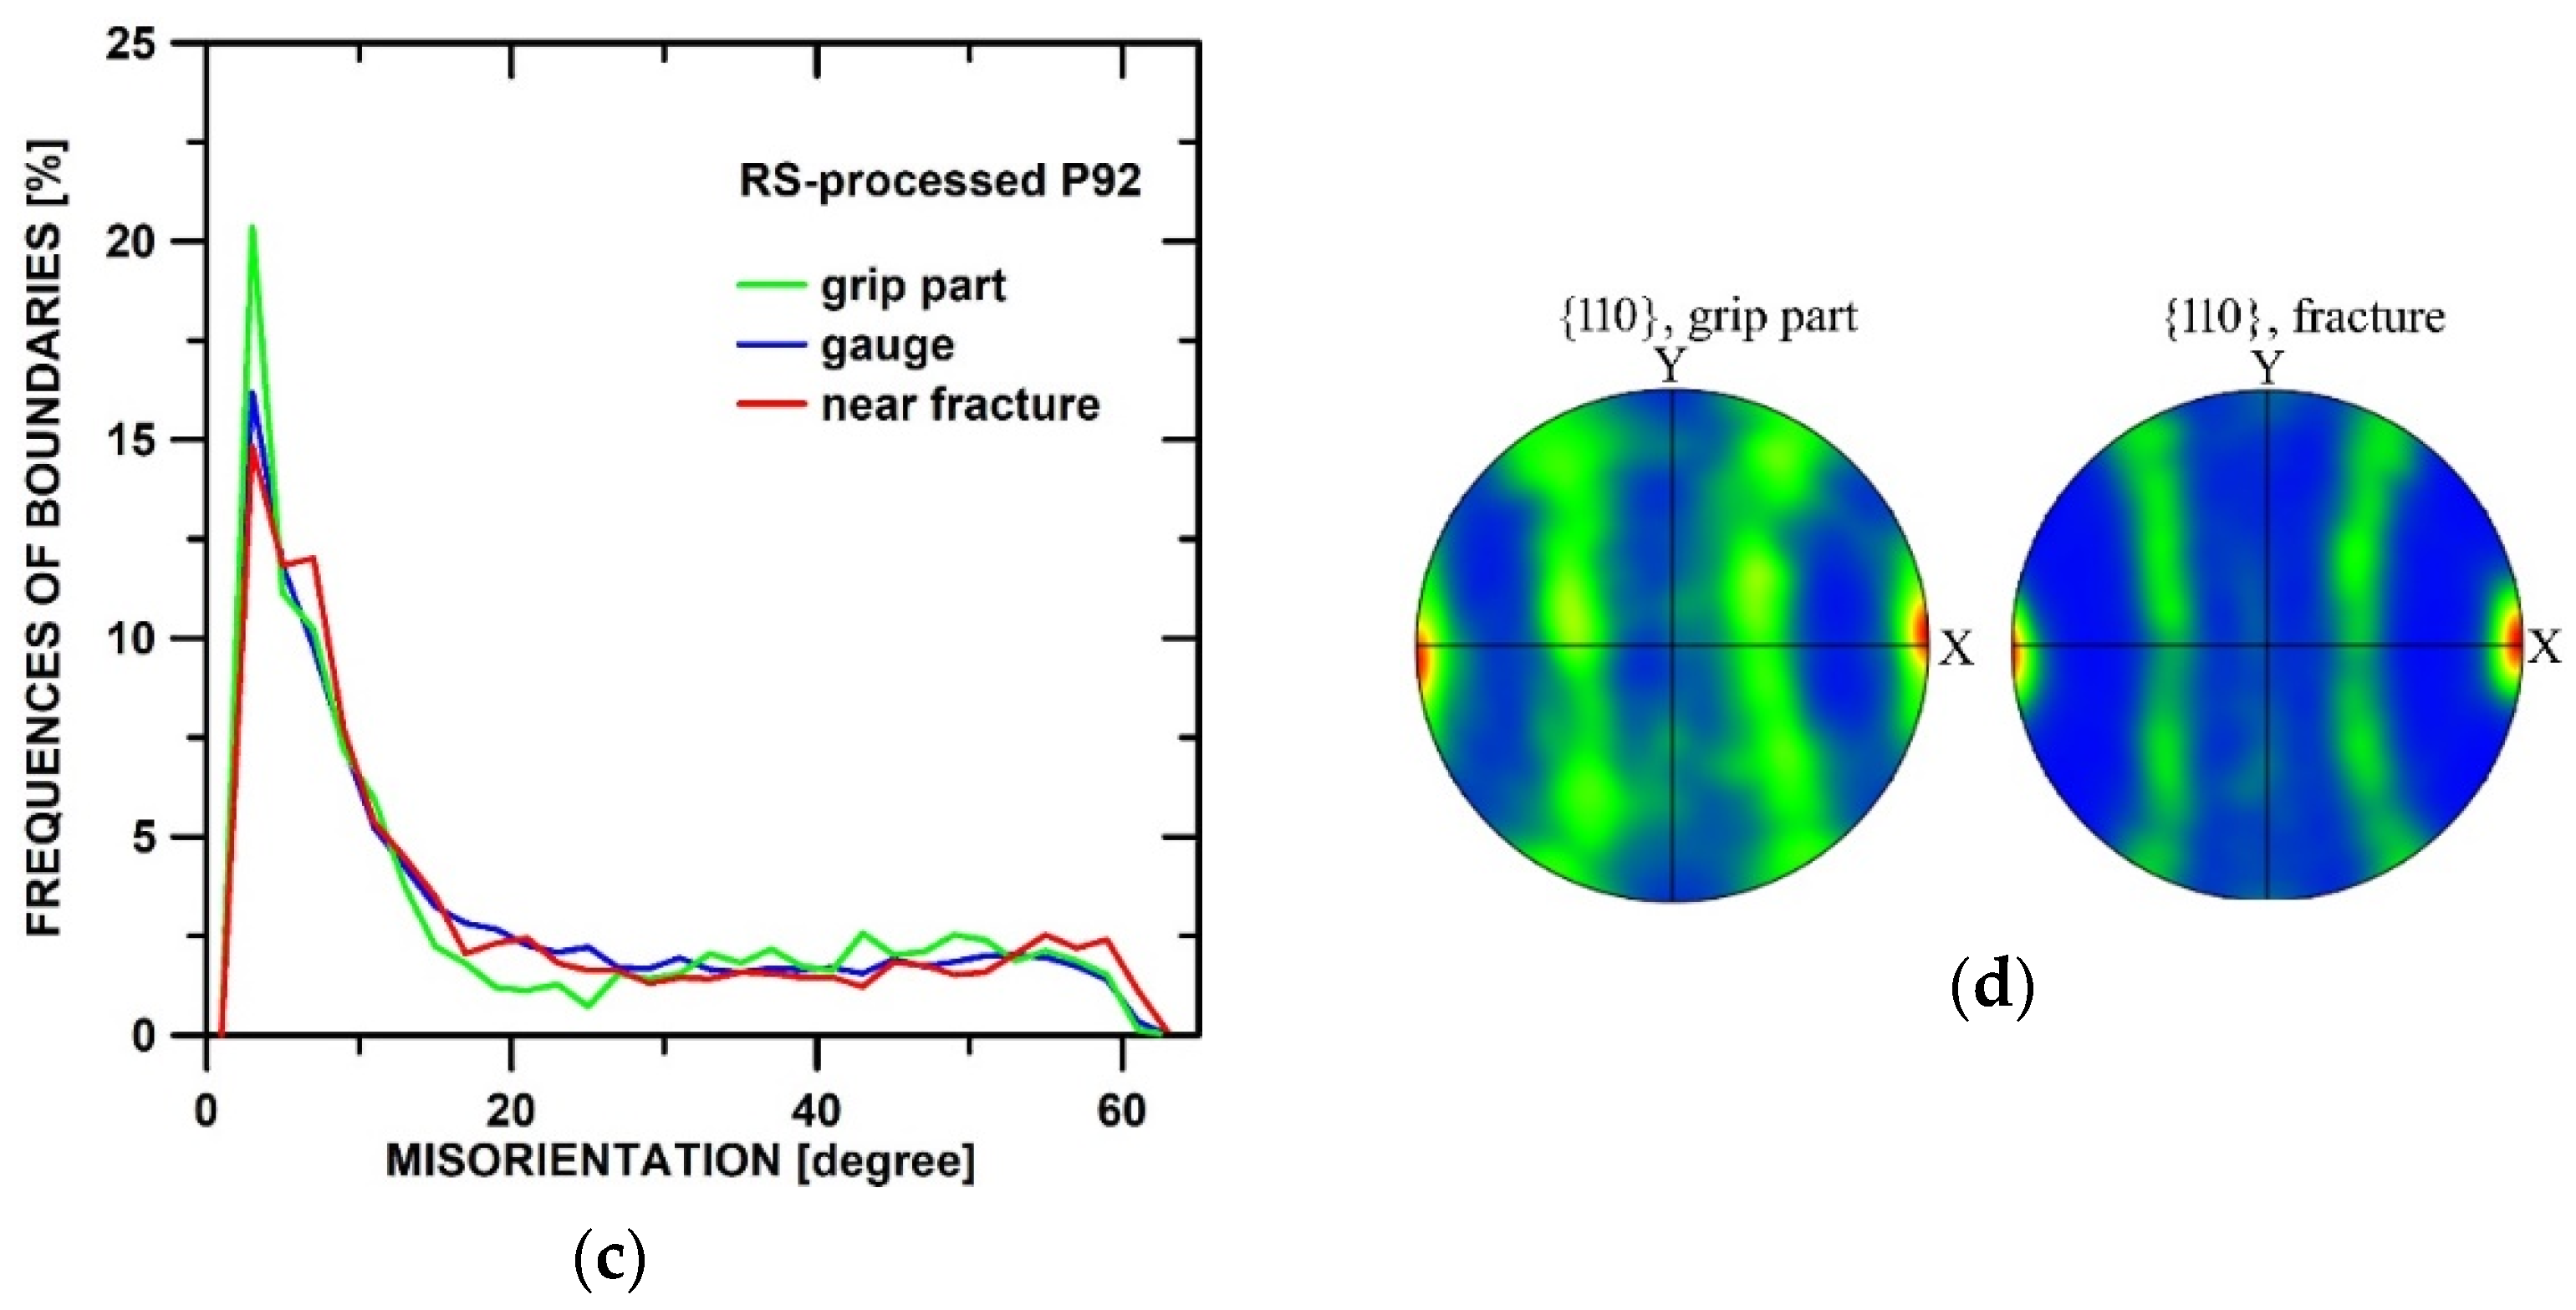
3.3.2. Microstructure of the RS-Processed State

Figure 6a,b shows the microstructures after RS and creep testing at 600 MPa within tensile specimen located in the grip part and near the fracture, respectively. The RS microstructure contains a heterogeneous microstructure with relatively large grains that are elongated approximately parallel to the load axis and fine grains located along the boundaries of large, elongated grains. The distribution of misorientation angles (Figure 6c) demonstrates that the microstructure of the RS-processed state predominantly contains LAGBs. The results showed that the number of LAGBs is highest in the grip part and that the number of LAGBs slightly decreases in the gauge length and near the fracture. A strong fiber texture with directions <110> parallel to the stress axis (Figure 6d) was also found. This fiber texture contained two significant texture components {001}<110> and {111}<110>. The fiber texture did not change significantly during creep either in the gauge length or in the area near the fracture.
The density of GND determined from EBSD data is significantly higher in comparison with the results for the CG state (Figure 7). One can also see that the number of GND in the gauge length and near the fracture is slightly lower or similar compared to that in the grip part. The results also show that the density of GND slightly decreases with the decrease in the applied stress during creep testing.
Figure 8 shows TEM micrographs of the microstructure located in the grip part (Figure 8a,b) and in the gauge length (Figure 8c) of the specimen tested at 700 MPa. The microstructure consists of long bands which contain fine subgrains with a mean size of about 0.3 µm in their interiors. One can see that there are dislocations inside the subgrains. The dislocation density within subgrains was determined to be about 2.9 × 10¹⁴ m−2. Similar results were found in the microstructure located in the gauge length. The subgrain size in the gauge length was about 0.3 µm, and the dislocation density varied from 1.95 × 10¹⁴ to 2.2 × 10¹⁴ m−2, depending on the particular location examined.

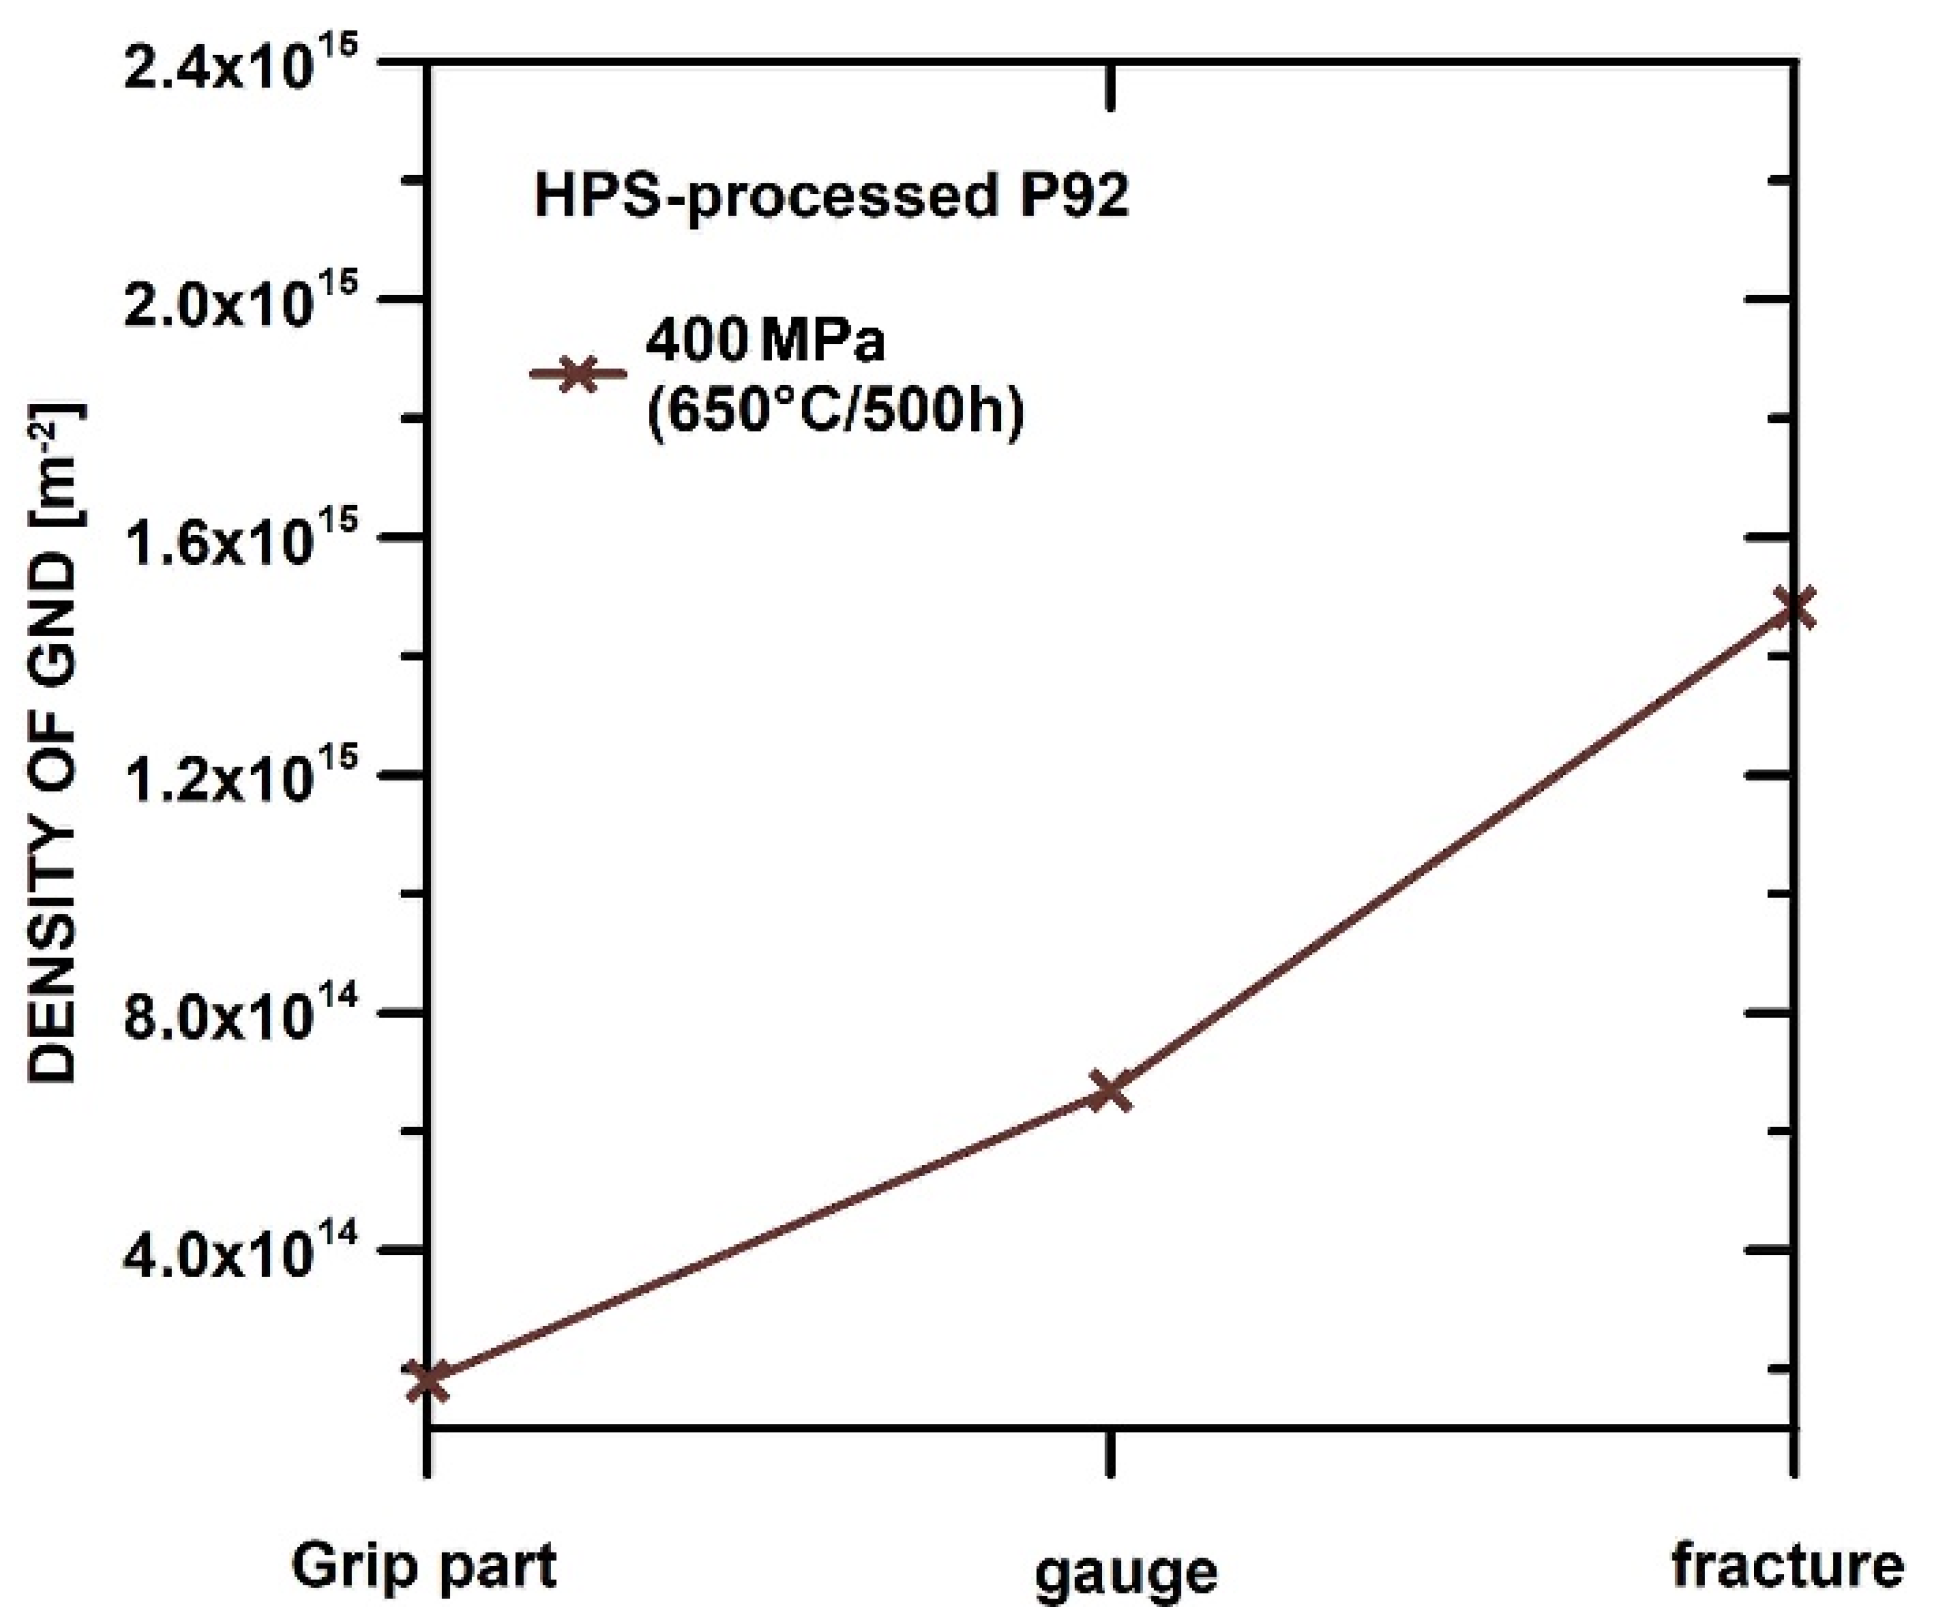
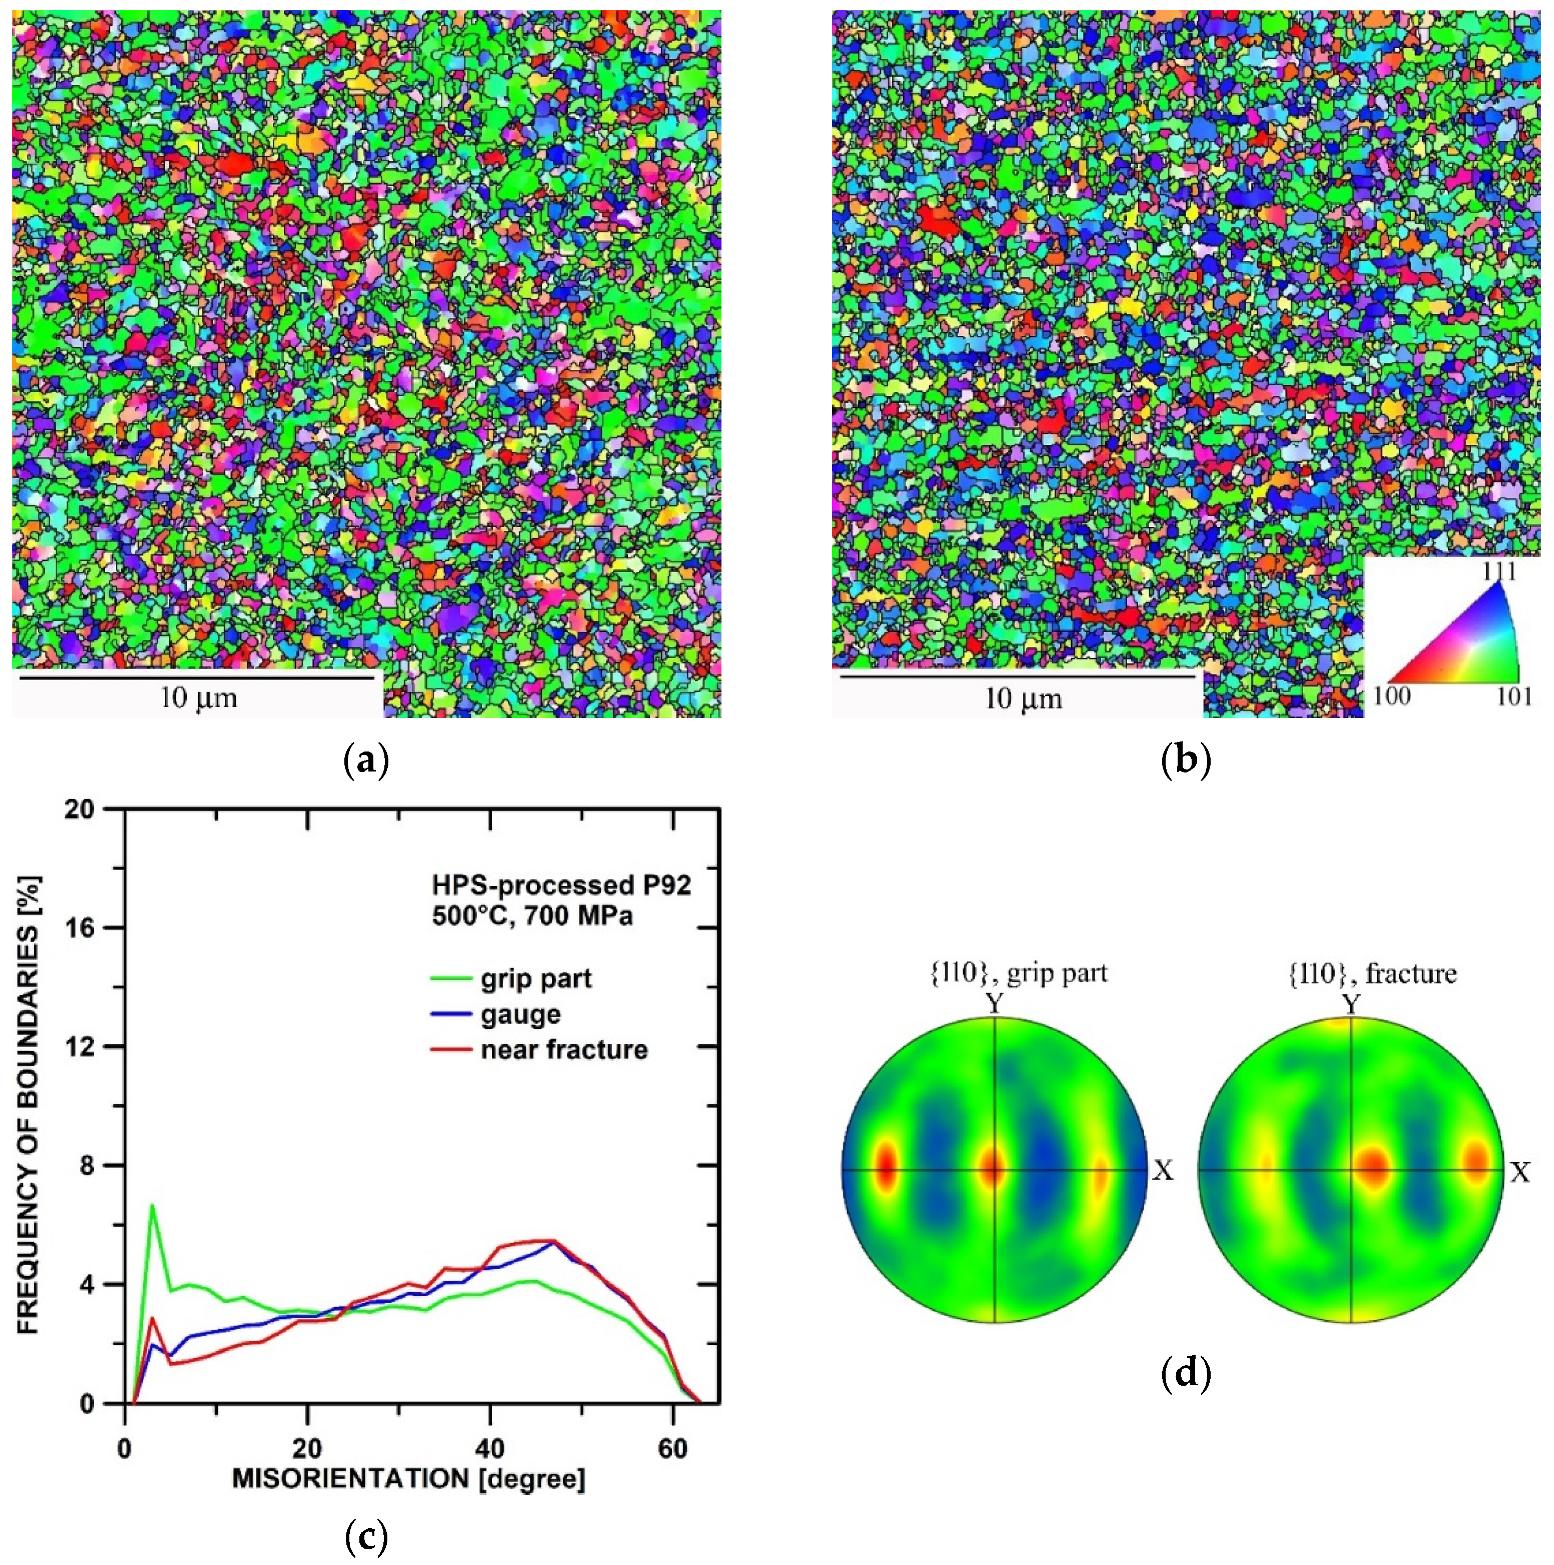
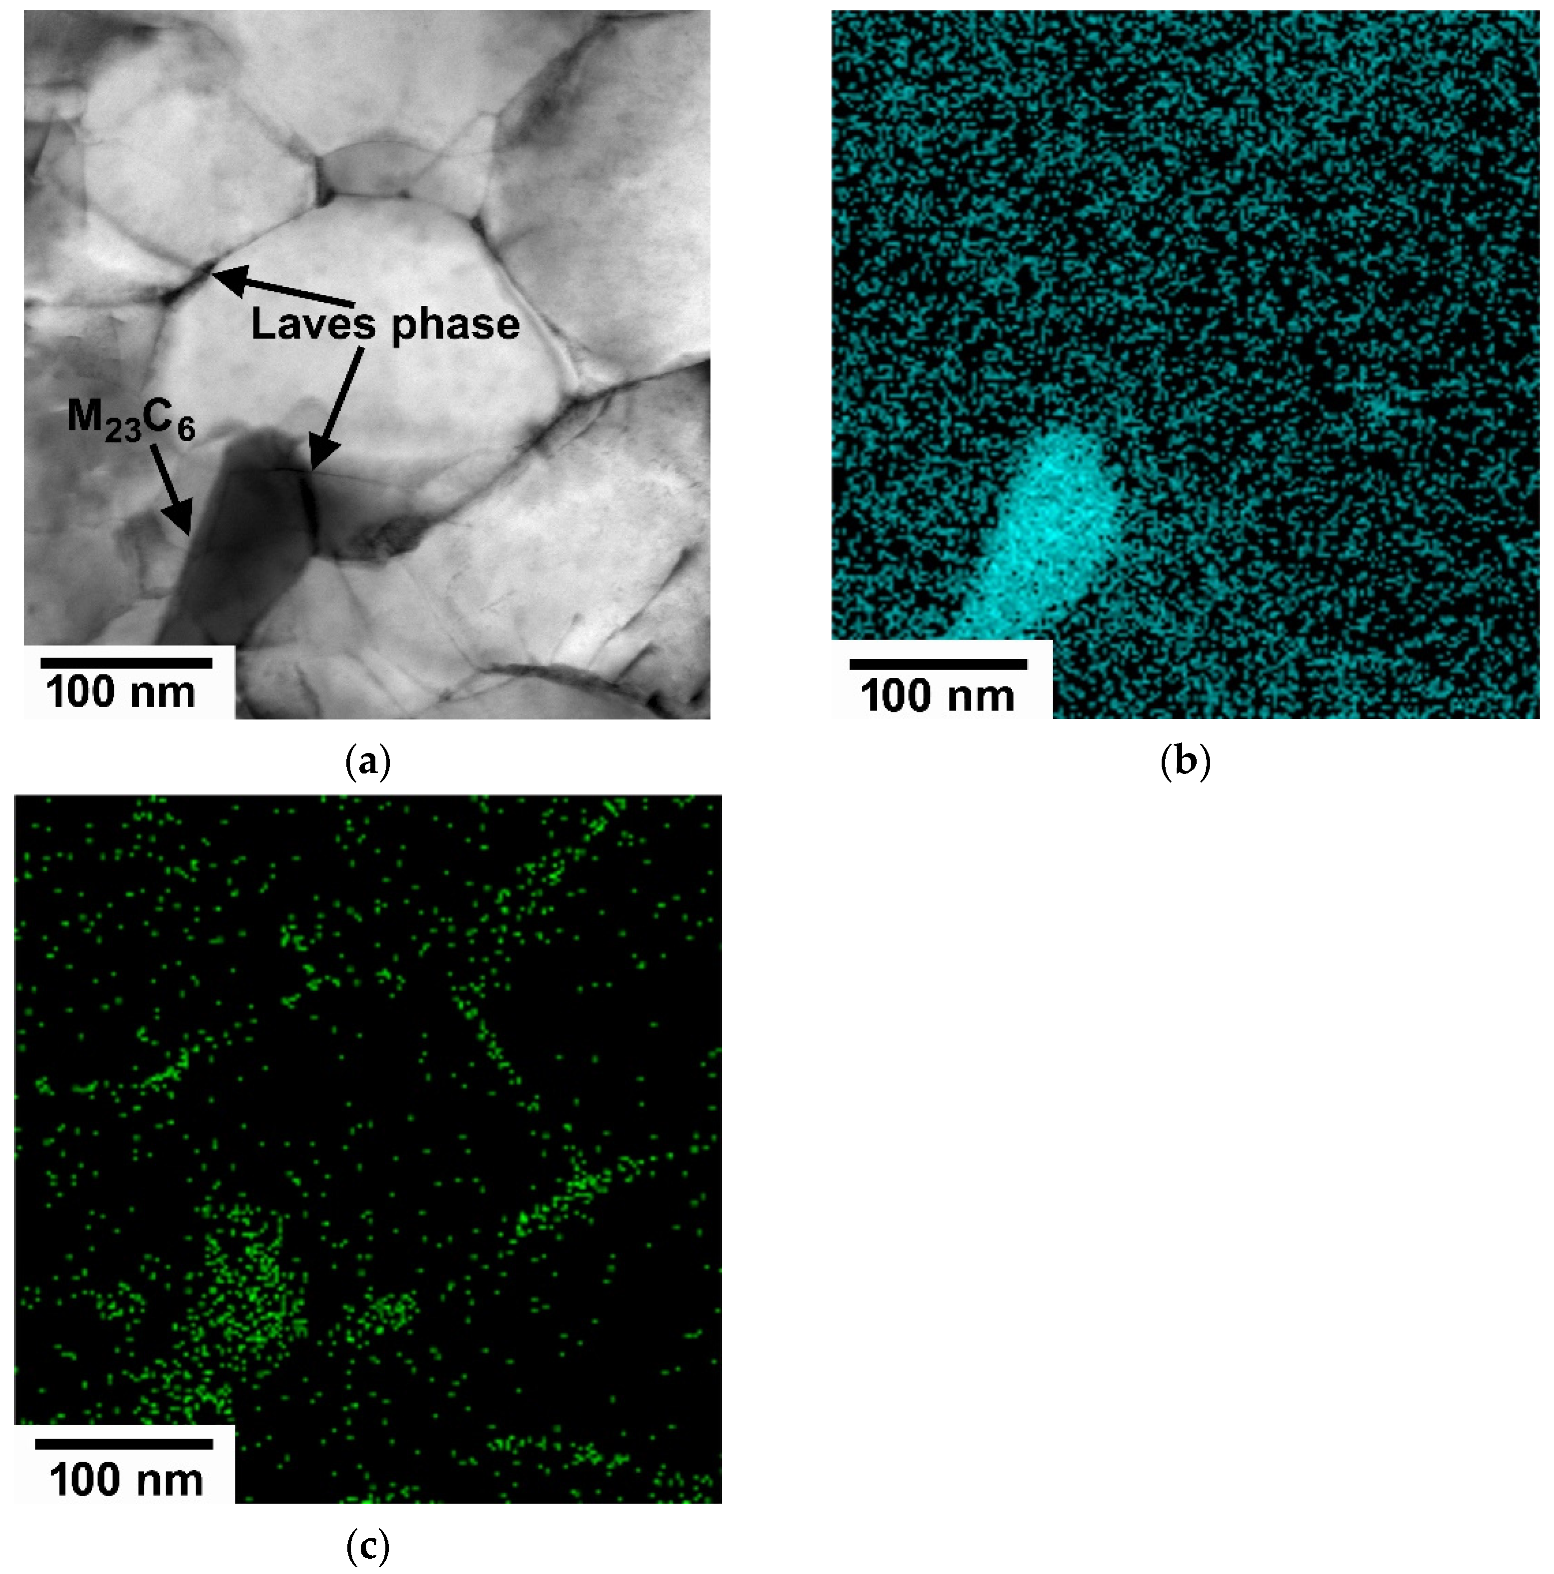
3.3.3. Microstructure of the HPS-Processed State

The microstructure of HPS-processed steel is more or less homogeneous and consists of grains with a mean size of about 0.23–0.35 µm, depending on the creep testing conditions and the location investigated. The microstructure was investigated in the grip part, half part of the gauge length and near the fracture. It was found that the mean grain size slightly increased with increasing creep strain and stress in the gauge length and near the fracture compared to the stress-free grip part (Figure 9a,b). The grains are more or less equiaxed in the grip part, but slightly elongated in the direction parallel to the stress axis near the fracture.
The misorientation distributions (Figure 9c) showed that the microstructure contains mainly HAGBs; only about 10–25% of the microstructure was found to contain LAGBs. The highest number of LAGBs was observed in the grip parts, and the number of LAGBs decreases in the gauge length and near the fracture. It was observed that the texture in the grip part had a tendency to form fiber texture with the directions <110> perpendicular to the stress axis (resp. {110} parallel to the stress axis), with significant texture components {110}<001> and {110}<111> (Figure 9d).
A similar texture was also found in the half part of the gauge length. However, slight texture changes were observed near the fracture. A slight deviation of the <110> directions (normal to {110} planes) from the center of pole figures was observed.
The number of GNDs was significantly higher in the HPS-processed microstructure than in the CG P92 steel (Figure 5 and Figure 10). The highest number of GNDs was found in the grip part. However, the number of GND decreased in the gauge length and in the area near the fracture. Figure 11 shows TEM micrographs of the microstructure after creep testing at 300 MPa and creep strain of about 0.04. The microstructure is ultrafine-grained and contains (sub)grains with a mean size of about 0.17 µm. In the interior of the larger grains with a size of about 0.4–0.5 µm, dislocations and the beginning of the formation of a subgrain boundary can be seen. In the interior of the finer grains, with a size of about 0.2 µm, dislocations and pile-ups of dislocations near triple junctions can also be observed. Dislocation density in the grain interiors was about 2.3 × 10¹⁴–3.4 × 10¹⁴ m−2, depending on the investigated location.
The analysis of precipitates in HPS-processed state after creep testing showed the formation of the Laves phase in the specimen tested at 300 MPa (Figure 12). It was observed that the Laves phase is predominantly formed along grain boundaries, near triple junctions and at M23C6 carbides.

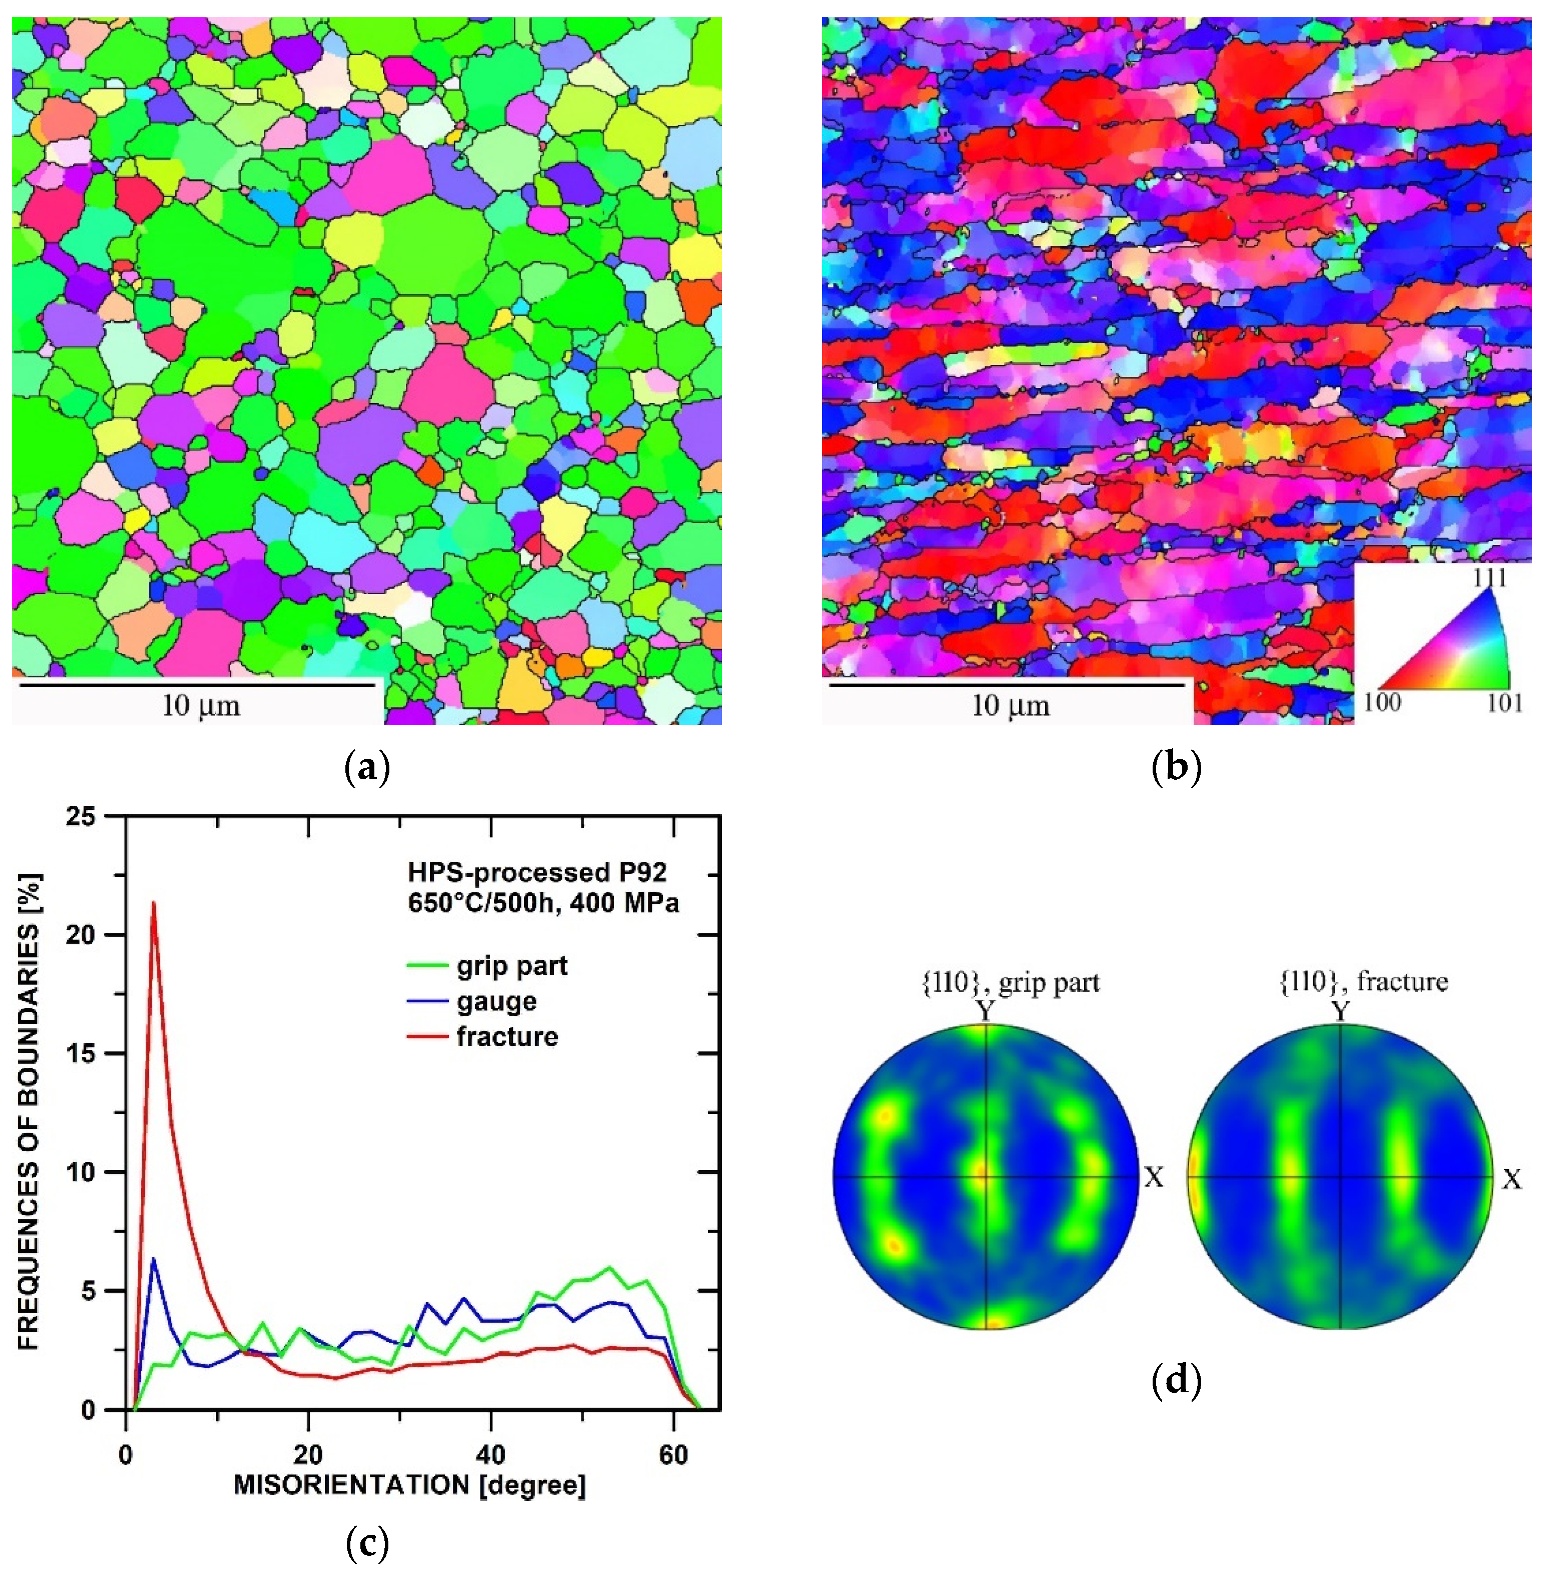
3.3.4. Microstructure of HPS State after Annealing at 650 °C for 500 h

Figure 13a,b shows the microstructures after a creep test at 500 °C and 400 MPa in the grip part and near the fracture location respectively of P92 steel after HPS and subsequent annealing at 650 °C for 500 h. The results demonstrate that the microstructure in the grip part contains nearly equiaxed grains with a mean size of about 0.85 µm and comprising about 84% of HAGBs. One can see that the static annealing did not cause significant changes in texture and the textures in the grip parts of the annealed and unannealed HPS states are similar.
The results demonstrate that creep strain caused a significant increase in LAGBs and density of GND (Figure 13c and Figure 14). Near the fracture, the grains are significantly elongated parallel to the stress direction. The fiber texture {110}<uvw> changes to the tensile texture {hkl}<110> where the directions <110> are oriented parallel to the stress axis (Figure 13d). This fiber texture contains two distinct texture variants {111}<110> and {001}<110>.

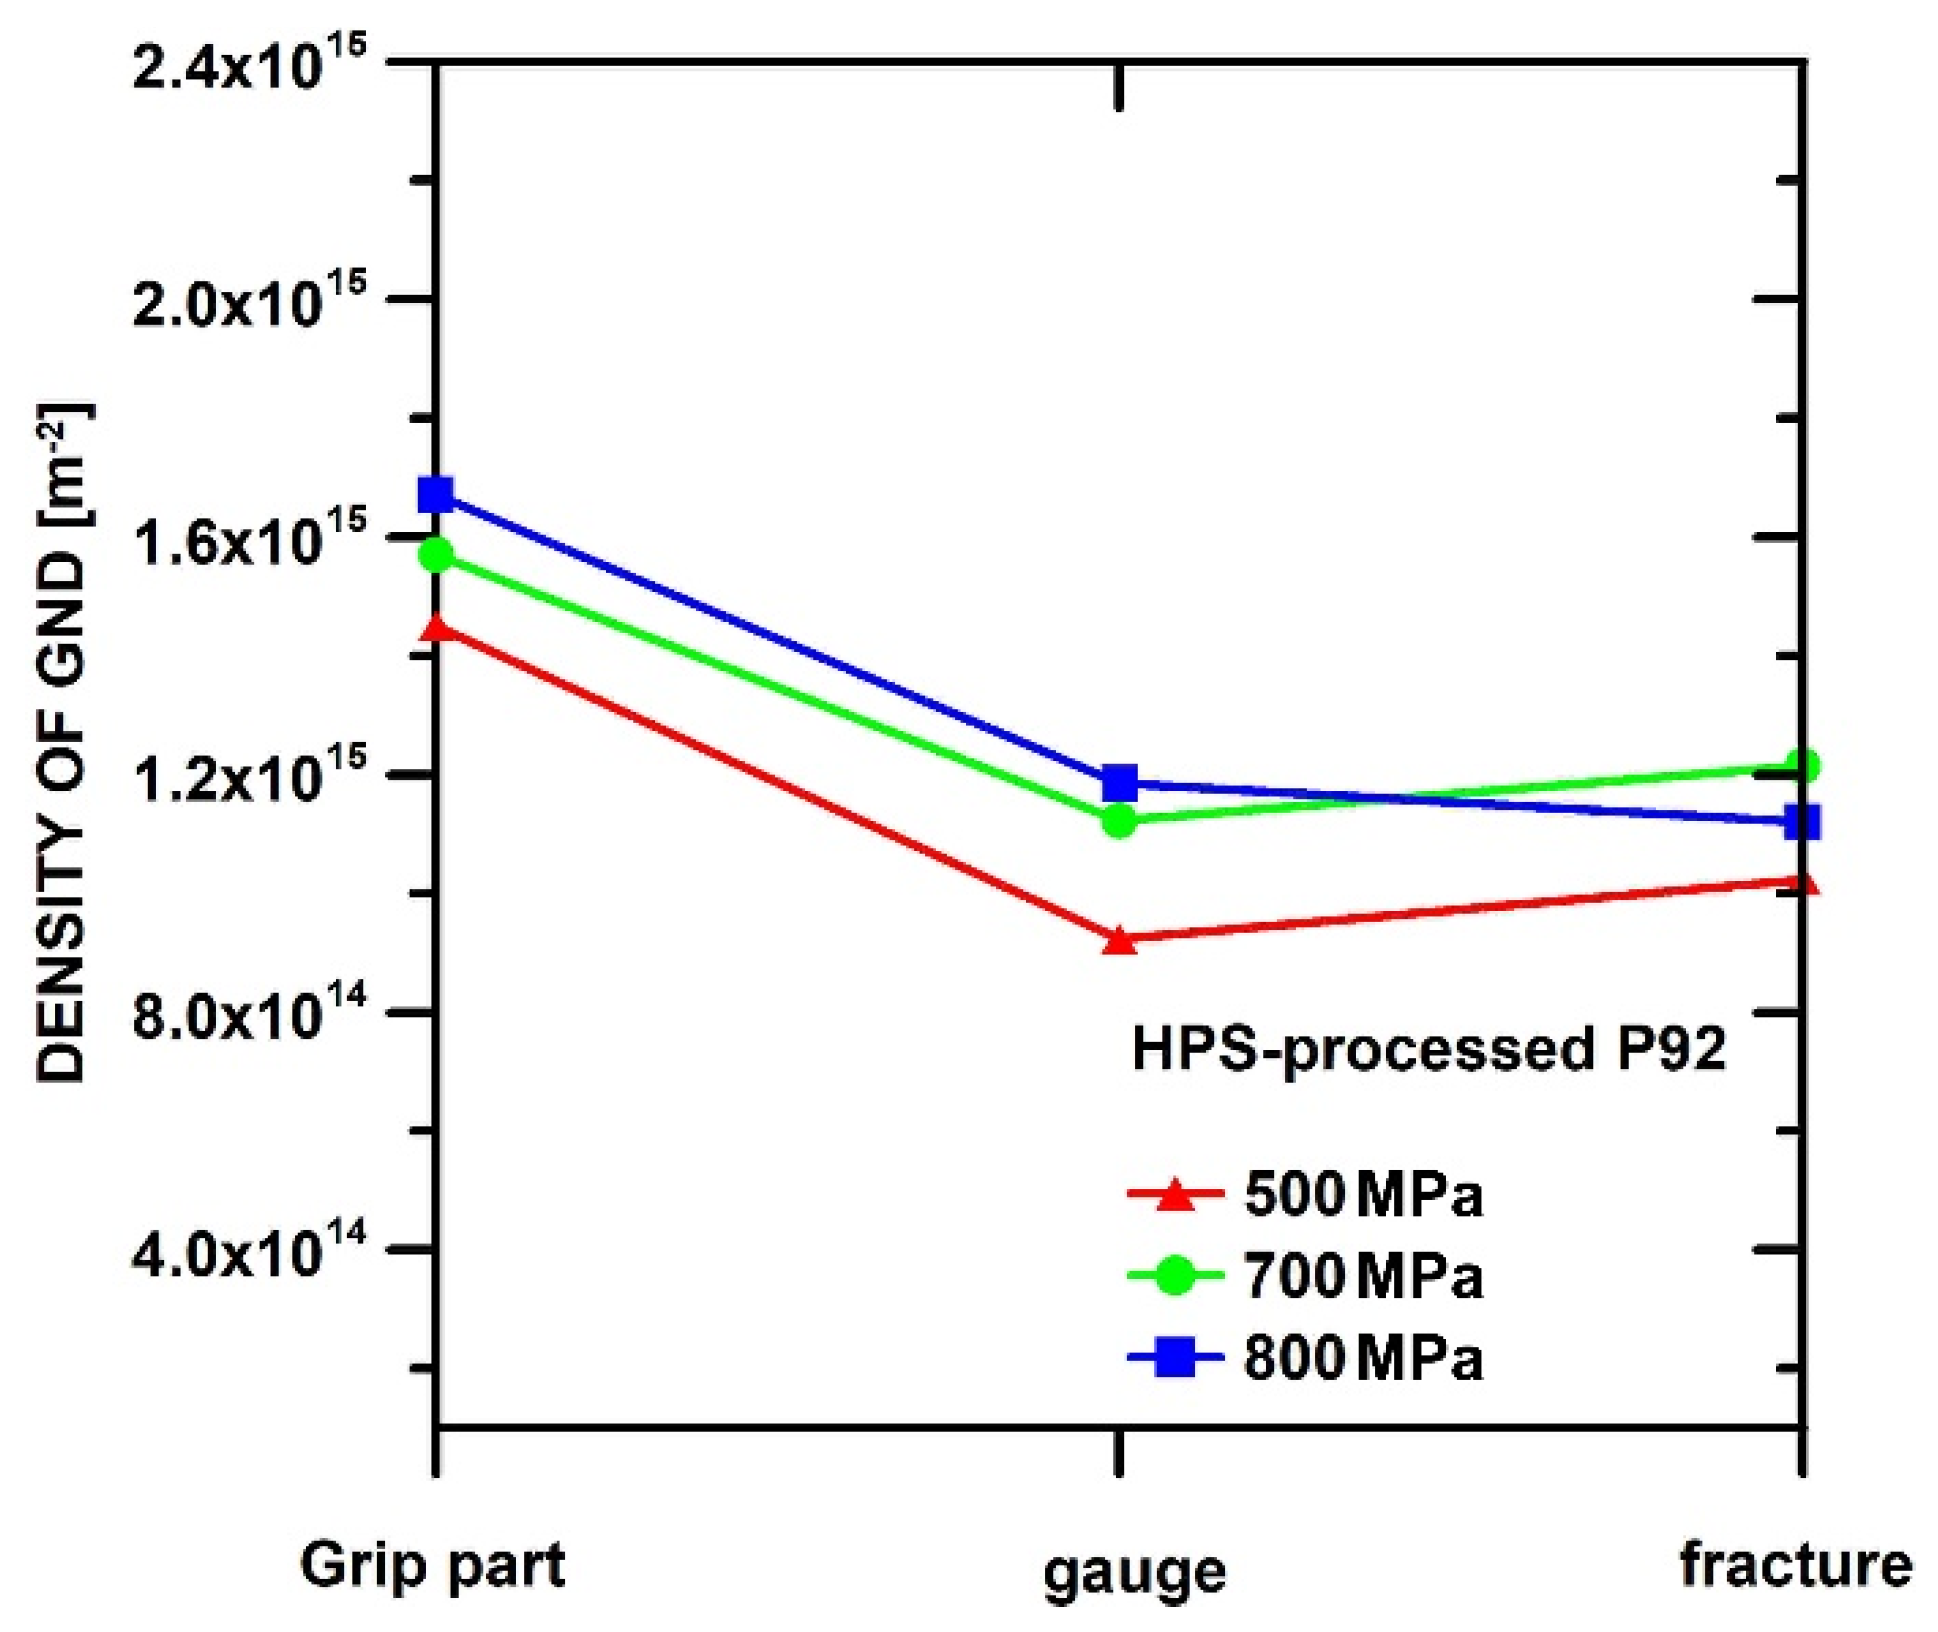
3.3.5. Comparison of Selected Microstructure Characteristics for GC, RS and HPS State Tested at 500 °C

Figure 15 shows the mean subgrain and grain size measured in the grip part and gauge length of different states of P92 steel. The experimentally determined values of subgrain and grain size are compared with the estimated stationary subgrain size. The stationary subgrain size was expected to be 10 bG/σ. For estimations of stationary subgrain sizes, values of shear modulus G published in different studies of 9% Cr steels [30,31] and Burger’s vector b = 2.48 × 10⁻¹⁰ m [32] were used.
The results demonstrate that CG P92 steel tested at 400 MPa contains mean subgrain and grain sizes that are larger than the estimated stationary subgrain size. Slightly larger subgrain and grain sizes compared to the stationary subgrain size are also seen in the annealed HPS-processed state. The subgrain size in the RS-processed state tested at 500 and 600 MPa is more or less comparable with the stationary subgrain. The mean subgrain and grain sizes determined for the HPS-processed state tested at high stresses are comparable with the estimated stationary subgrain size. However, opposite results can be seen at low stresses.

4. Discussion

The previous results found that predeformation by SPD, resulting in microstructure refinement of standard CG alloys (including P92 steel), leads to improved ductility, but often significantly deteriorates creep resistance [9]. However, the results of this study show that SPD can significantly improve both creep resistance and ductility (Figure 2 and Figure 3). Such improvement in the creep properties of SPD-processed P92 steel occurs predominantly at high stresses for both the HPS- and RS-processed states. However, the creep behavior of the RS- and HPS-processed states is different (Figure 3). P92 steel processed by RS exhibits a high value of the stress exponent n~18, which is not much lower than the value of n determined for the CG state (n~24). Such high values can be observed in precipitation strengthened alloys due to the threshold stresses caused by the presence of precipitates [20]. We assume that the particle spacing λ in the RS- and HPS-processed states is more or less similar to the particle spacing in the CG state. The particle spacing and associated Orowan stress σor can be estimated from the published data [28] to be about 148 MPa. This value is lower compared to the creep stresses used in the present work.
The previous works [33,34,35] investigating the precipitation in SPD-processed alloys revealed that the formation of precipitates in SPD-processed alloys is significantly accelerated. However, the types of precipitates and the sequence of the phase precipitation in SPD-processed alloys are similar to those of CG states [33]. The accelerated precipitation of secondary phase was also observed in SPD-processed P92 steel at 600 °C. It was found [19] that the Laves phase in HPT-processed P92 steel tested at 600 °C is formed within a few hours. The present results showed that the fine Laves phase can also be formed in HPS-processed P92 steel during medium-term creep testing at 500 °C. It was suggested [36] that the formation of fine Laves phase in 9% chromium steels leads to the additional strengthening during primary creep stage. However, the present microstructure results (Figure 12) showed that the fine Laves phase is predominantly located along the grain boundaries in HPS-processed state. For this reason, the Laves phase probably does not significantly contribute to the precipitation strengthening in the HPS-processed state tested at 500 °C, but rather restricts the grain boundary movement.
Moreover, the microstructure results showed that the investigated states of P92 steel differ predominantly by the subgrain/grain size (Figure 15) and the density of GNDs (Figure 5, Figure 7, Figure 10 and Figure 14). The high values of n could also be associated with the power–law breakdown (PLB). Previous works investigating PLB [37,38] showed that its occurrence is accompanied by the formation of LAGBs within grains. The significantly high values of n were determined for the GC and RS states containing grains larger than the estimated stationary subgrain size (Figure 15). In the interior of these large grains the subgrains can be formed and so these states contain high values of LAGBs during creep testing at given stresses. For this reason the creep resistance of the CG and RS states is influenced significantly by LAGBs. However, the RS-processed steel exhibited higher creep resistance than the CG state. The higher creep resistance of the RS-processed steel is influenced by finer subgrain size and higher GND density compared to the CG state before creep testing. The values of the GND density determined before creep testing (Figure 1d) are more or less similar to the values measured in the stress-free grip parts of the specimens after short term creep exposure at 500 °C.
In the CG state the subgrain size has a tendency to decrease its size towards the estimated stationary subgrain size and the density of GND increases with increasing creep strain, However, in the RS-processed state the subgrain has a tendency to grow and the density of GND slightly decreases with increasing creep strain. These trends suggest that the density of GND and subgrain size tend to reach a certain stationary state for a given stress and strain.
Significant differences in the GND and subgrain size in the RS and CG states are influenced by the different thermal deformation treatments of both states. Significantly lower GND values and larger subgrain sizes in the CG state before creep testing are related to tempering at 740 °C for 140 min. However, the microstructure of the RS-processed state was formed at room temperature and was only heated up to the creep testing temperature of 500 °C. For this reason, the RS-processed microstructure contains a higher density of GND and a finer subgrain size, which leads to higher creep resistance in comparison with CG state. The creep results at 500 °C demonstrate that the synergy of the high GND value and fine subgrain size provides good creep resistance at lower stresses.
The creep results (Figure 2) also showed that the RS-processed state exhibited a longer primary stage than the CG state. This can be explained by the higher density of free dislocations in the RS-processed microstructure [39]. The prolonged primary stage is also exhibited by the HPS-processed state. The ε ˙ m i n for the HPS-processed state reaches up to the creep strain of about 10% (Figure 2). This result suggests that the density of free dislocations in the HPS-processed state is higher than in the CG and RS-processed states. It is reasonable to expect that the density of dislocations inside the ultrafine grains is high because at such large strains imposed into the material the grain size reaches almost the subgrain size [16,40]. The dislocations cannot form the subgrains in such small grains and they are accumulated inside the grains. This can be supported by relatively high values of dislocation density within the grains measured by TEM and high values of GND measured by EBSD showing significant lattice curvature related to plastic deformation gradients inside the grains (Figure 7 and Figure 10).
HPS-processed P92 steel predominantly contains HAGBs (Figure 9), so the creep behavior is predominantly influenced by the creep mechanisms associated with grain boundaries. The HPS-processed state exhibits significantly lower values of stress exponent n than the CG and RS-processed states (Figure 3). The value of n for the HPS-processed state is about 11 at low stresses (between 400–600 MPa). The value of n could be expected to increase, due to formation of LAGBs within the grains, with increasing value of applied stress. However, in the HPS-processed state at high stresses of about 600–900 MPa, PLB did not occur. On the contrary, a decrease of the stress exponent n to about 7 was observed for this state (Figure 3). The value of n~7 is often associated with the intragranular dislocation process involving the climb of dislocations [20,41]. The fact that PLB did not occur in the HPS-processed state at high stresses can be explained by the absence of LAGBs in the grain interiors [37,38]. This can be documented by microstructure results found in the present work.
The microstructure results demonstrate that the grain and subgrain size in the HPS-processed state coarsen during creep towards the estimated stationary subgrain size and at high stresses the grain and subgrain sizes are almost the same as expected stationary subgrain size (Figure 15). At high stresses, the HPS-processed state reaches high creep resistance and good ductility. The microstructure results suggest that this creep behavior is associated with a high number of HAGBs and high density of GND (Figure 1, Figure 9 and Figure 10). The high number of HAGBs in the microstructure suggests that creep can be influenced by grain boundary mediated processes such as grain boundary sliding and/or diffusion creep. However, the value of the stress exponent n~7 is significantly higher than the values of n for grain boundary sliding (GBS) or diffusion creep [20]. In addition, during GBS, the rotation of grains occurs which leads to a reduction of texture [20,37]. However, such an effect was not observed.
The differences in creep resistance between the CG, HPS-processed and RS-processed states decrease with decreasing value of applied stress. It can be suggested that the decrease in the creep resistance with decreasing value of the stress (increasing creep time) in the HPS-processed state can be caused by the recovery of dislocations during creep [42,43,44]. Because the HPS-processed state contains mainly HAGBs, defects are recovered preferentially at these boundaries. In the case that the HPS-processed microstructure is annealed before creep testing, there is a significant reduction in creep resistance and a shortening of the primary stage. The ε ˙ m i n for the annealed HPS-processed state is more than two orders of magnitude faster compared to the unannealed HPS-processed state, and ε ˙ m i n is comparable to the CG state. The microstructure results showed that the annealed microstructure is still ultrafine-grained and contains predominantly HAGBs. However, the annealed HPS microstructure contains low number of GNDs in the grip part compared with unannealed HPS- and RS-processed states (Figure 10 and Figure 14). The reduction of GND density in the grip part of the annealed specimen is mainly caused by static annealing at 650 °C/500 h prior creep, and the static annealing of the stress-free grip part at 500 °C has a small additional effect on the GND value. For this reason, it can be suggested that the decrease in GND density during static annealing of the HPS-processed state at 650 °C/500 h has an additional influence on the reduction of creep resistance. In other words, not only grain and subgrain size, but also the density of the defects forming the curvature of the crystallographic lattice inside the grains are significantly associated with the high strength of SPD-processed materials. The decrease in strength of SPD materials during short annealing has also been observed in other works [45,46].

5. Conclusions

Standard martensitic creep-resistant P92 steel was processed at room temperature by rotary swaging (RS) and high-pressure sliding (HPS). The creep behavior at 500 °C and microstructures of coarse-grained and SPD-processed P92 steel were investigated. The main results were:
  • P92 steel processed by RS and HPS exhibited higher creep resistance than standard coarse-grained steel.
  • HPS-processed state exhibited slower minimum creep rates and longer fracture times than RS-processed state when tested at high stresses (about 600–900 MPa). However, opposite results were observed at low stresses.
  • HPS-processed P92 steel exhibits lower values of stress exponent n compared to CG and RS-processed states tested under the same loading conditions.

Author Contributions

Conceptualization, P.K., V.S., Z.H.; methodology, P.K., V.S., J.D. and Z.H.; validation, P.K., J.D., Z.H., Y.T. (Yoichi Takizawa) and Y.T. (Yongpeng Tong); formal analysis, V.S., P.K., M.K.; investigation, P.K., J.D., V.S.; L.K., M.O., Y.T. (Yongpeng Tong); resources, P.K., J.D., L.K., M.O., Y.T. (Yoichi Takizawa) and Y.T. (Yongpeng Tong); data curation, P.K., J.D. and L.K.; writing–original draft preparation, P.K., J.D., M.K. and V.S.; writing–review and editing, P.K., Z.H. and V.S.; visualization, P.K., J.D., L.K. and M.K.; supervision, Z.H. and V.S. All authors have read and agreed to the published version of the manuscript.

Funding

This research was funded by the Czech Science Foundation, grant number 19-18725S.

Data Availability Statement

Not applicable.

Acknowledgments

The authors acknowledge financial support from the Czech Science Foundation (grant No. 19-18725S). The work was supported partly by a grant-in-aid from MEXT, Japan, for scientific research (A) (No. J19H00830).

Conflicts of Interest

The authors declare no conflict of interest.

References

  1. Abe, F.; Kern, T.-U.; Viswanathan, R. Creep-Resistant Steels; Woodhead Publishing: Cambridge, UK, 2008. [Google Scholar]
  2. Kaibyshev, R.O.; Skorobogatykh, V.N.; Shchenkova, I.A. New martensitic steels for fossil power plant: Creep resistance. Phys. Met. Metallogr. 2012, 109, 186–200. [Google Scholar] [CrossRef]
  3. Maruyama, K.; Sawada, K.; Koike, J. Strengthening mechanisms of creep resistant tempered martensitic steel. ISIJ Int. 2001, 41, 641–653. [Google Scholar] [CrossRef]
  4. Prat, O.; Garcia, J.; Rojas, D.; Sauthoff, G.; Inden, G. The role of Laves phase on microstructure evolution and creep strength of novel 9%Cr heat resistant steels. Intermetallics 2013, 32, 362–372. [Google Scholar] [CrossRef]
  5. Kocich, R. Effects of twist channel angular pressing on structure and properties of bimetallic Al/Cu clad composites. Mater. Des. 2020, 196, 109255. [Google Scholar] [CrossRef]
  6. Naizabekov, A.B.; Andreyachshenko, V.A.; Kocich, R. Study of deformation behavior, structure and mechanical properties of the AlSiMnFe alloy during ECAP-PBP. Micron 2013, 44, 210–217. [Google Scholar] [CrossRef] [PubMed]
  7. Kocich, R.; Macháčková, A.; Andreyachshenko, V.A. A study of plastic deformation behaviour of Ti alloy during equal channel angular pressing with partial back pressure. Comput. Mater. Sci. 2015, 101, 233–241. [Google Scholar] [CrossRef]
  8. Hlaváč, L.M.; Kocich, R.; Gembalová, L.; Jonšta, P.; Hlaváčová, I.M. AWJ cutting of copper processed by ECAP. Int. J. Adv. Manuf. Technol. 2016, 86, 1–4. [Google Scholar] [CrossRef]
  9. Kral, P.; Dvorak, J.; Sklenicka, V.; Langdon, T.G. The characteristics of creep in metallic materials processed by severe plastic deformation. Mater. Trans. 2019, 60, 1506–1517. [Google Scholar] [CrossRef] [Green Version]
  10. Sklenicka, V.; Dvorak, J.; Svoboda, M. Creep in ultrafine grained aluminium. Mater. Sci. Eng. A 2004, 387–389, 696–701. [Google Scholar] [CrossRef]
  11. Kral, P.; Dvorak, J.; Blum, W.; Kudryavtsev, E.; Zherebtsov, S.; Salishchev, G.; Kvapilova, M.; Sklenicka, V. Creep study of mechanisms involved in low-temperature superplasticity of UFG Ti-6Al-4V processed by SPD. Mater. Character. 2016, 116, 84–90. [Google Scholar] [CrossRef]
  12. Takizawa, Y.; Kajita, T.; Kral, P.; Masuda, T.; Watanabe, K.; Yumoto, M.; Sklenicka, V.; Horita, Z. Superplasticity of Inconel 718 after processing by high-pressure sliding (HPS). Mater. Sci. Eng. A 2017, 682, 603–612. [Google Scholar] [CrossRef]
  13. Sklenicka, V.; Dvorak, J.; Kral, P.; Betekhtin, V.I.; Kadomtsev, A.G.; Narykova, M.V.; Dobatkin, S.V.; Kucharova, K.; Kvapilova, M. Influence of a prior pressurization treatment on creep behaviour of an ultrafine-grained Zr-2.5%Nb alloy. Mater. Sci. Eng. A 2021, 820, 141570. [Google Scholar] [CrossRef]
  14. Greger, M.; Kocich, R. Superplasticity of magnesium alloys. In Proceedings of the Metal 2011 20nd International Metallurgy Material Conference, Brno, Czech Republic, 18–20 May 2011; pp. 421–424. [Google Scholar]
  15. Král, P.; Dvořák, J.; Sklenička, V.; Masuda, T.; Tang, Y.; Horita, Z.; Kunčická, L.; Kuchařová, K.; Kvapilová, M.; Svobodová, M. Effect of severe plastic deformation on creep behaviour and microstructure changes of P92 at 923K. Kovove Mater. 2021, 59, 141–148. [Google Scholar]
  16. Král, P.; Dvořák, J.; Blum, W.; Sklenička, V.; Horita, Z.; Takizawa, Y.; Tang, Y.; Kunčická, L.; Kocich, R.; Kvapilová, M.; et al. The Effect of Predeformation on Creep Strength of 9% Cr Steel. Materials 2020, 13, 5330. [Google Scholar] [CrossRef]
  17. Sklenicka, V.; Kral, P.; Dvorak, J.; Takizawa, Y.; Masuda, T.; Horita, Z.; Kucharova, K.; Kvapilova, M.; Svobodova, M. Effects of grain refinement and predeformation impact by severe plastic deformation on creep in P92 martensitic steel. Adv. Eng. Mater. 2020, 22, 1900448. [Google Scholar] [CrossRef]
  18. Kostka, A.; Tak, K.-G.; Eggeler, G. On the effect of equal-channel angular pressing on creep of tempered martensite ferritic steels. Mater. Sci. Eng. A 2008, 481–482, 723–726. [Google Scholar] [CrossRef]
  19. Kral, P.; Dvorak, J.; Sklenicka, V.; Masuda, T.; Horita, Z.; Kucharova, K.; Kvapilova, M.; Svobodova, M. Microstructure and creep behaviour of P92 steel after HPT. Mater. Sci. Eng. A 2018, 723, 287–295. [Google Scholar] [CrossRef]
  20. Čadek, J. Creep in Metallic Materials; Elsevier: Amsterdam, The Netherlands, 1988. [Google Scholar]
  21. Strunz, P.; Kocich, R.; Canelo-Yubero, D.; Macháčková, A.; Beran, P.; Krátká, L. Texture and differential stress development in W/Ni-Co composite after rotary swaging. Materials 2020, 13, 2869. [Google Scholar] [CrossRef]
  22. Kunčická, L.; Kocich, R. Deformation behaviour of Cu-Al clad composites produced by rotary swaging. In Proceedings of the 5th Global Conference on Polymer and Composite Materials (PCM 2018), Kitakyushu, Japan, 10–13 April 2018; p. 012029. [Google Scholar] [CrossRef]
  23. Fujioka, T.; Horita, Z. Development of high-pressure sliding process for microstructural refinement of rectangular metallic sheets. Mater. Trans. 2009, 50, 930–933. [Google Scholar] [CrossRef] [Green Version]
  24. Macháčková, A.; Krátká, L.; Petrmichl, R.; Kunčická, L.; Kocich, R. Affecting structure characteristics of rotary swaged tungsten heavy alloy via variable deformation temperature. Materials 2019, 12, 4200. [Google Scholar] [CrossRef] [Green Version]
  25. Kubin, L.; Mortensen, A. Geometrically necessary dislocations and strain-gradient plasticity: A few critical issues. Scr. Mater. 2003, 48, 119–125. [Google Scholar] [CrossRef] [Green Version]
  26. Liu, Q.; Jensen, D.J.; Hansen, N. Effect of grain orientation on deformation structure in cold-rolled polycrystalline aluminium. Acta Mater. 1998, 46, 5819–5838. [Google Scholar] [CrossRef]
  27. Konijnenberg, P.J.; Zaefferer, S.; Raabe, D. Assessment of geometrically necessary dislocation levels derived by 3D EBSD. Acta Mater. 2015, 99, 402–414. [Google Scholar] [CrossRef]
  28. Ham, R.K. The determination of dislocation densities in thin films. Philos. Mag. 1961, 6, 1183–1184. [Google Scholar] [CrossRef]
  29. Pešička, J.; Kužel, R.; Dronhofer, A.; Eggeler, G. The evolution of dislocation density during heat treatment and creep of tempered martensite ferritic steels. Acta Mater. 2003, 51, 4847–4862. [Google Scholar] [CrossRef]
  30. Sawada, K.; Takeda, M.; Maruyama, K.; Ishii, R.; Yamada, M.; Nagae, Y.; Komine, R. Effect of W on recovery of lath structure during creep of high chromium martensitic steels. Mater. Sci. Eng. A 1999, 267, 19–25. [Google Scholar] [CrossRef]
  31. Čadek, J.; Šustek, V.; Pahutová, M. An analysis of a set of creep data for a 9Cr–1Mo–0.2V (P91 type) steel. Mater. Sci. Eng. A 1997, 225, 22–28. [Google Scholar] [CrossRef]
  32. Frost, H.J.; Ashby, M.F. Deformation-Mechanism Maps; Pergamon Press: Oxford, UK, 1982; pp. 62–63. [Google Scholar]
  33. Zhao, Y.H.; Liao, X.Z.; Jin, Z.; Valiev, R.Z.; Zhu, Y.T. Microstructures and mechanical properties of ultrafine grained 7075 Al alloy processed by ECAP and their evolutions during annealing. Acta Mater. 2004, 52, 4589–4599. [Google Scholar] [CrossRef]
  34. Kim, J.K.; Jeong, H.G.; Hong, S.I.; Kim, Y.S.; Kim, W.J. Effect of aging treatment on heavily deformed microstructure of a 6061 aluminum alloy after equal channel angular pressing. Scr. Mater. 2001, 45, 901–907. [Google Scholar] [CrossRef]
  35. Gubicza, J.; Schiller, I.; Chinh, N.Q.; Illy, J.; Horita, Z.; Langdon, T.G. The effect of severe plastic deformation on precipitation in supersaturated Al–Zn–Mg alloys. Mater. Sci. Eng. A 2007, 460–461, 77–85. [Google Scholar] [CrossRef]
  36. Abe, F. Effect of fine precipitation and subsequent coarsening of Fe2W laves phase on the creep deformation behavior of tempered martensitic 9Cr–W steels. Metall. Mater. Trans. A 2005, 36, 321–332. [Google Scholar] [CrossRef]
  37. Kassner, M.E.; Ermagan, R. Power law breakdown in the creep in single-phase metals. Metals 2019, 9, 1345. [Google Scholar] [CrossRef] [Green Version]
  38. Lesuer, D.R.; Syn, C.K.; Sherby, O.D. An Evaluation of Power Law Breakdown in Metals, Alloys, Dispersion Hardened Materials and Compounds. Available online: https://www.osti.gov/servlets/purl/791669 (accessed on 20 November 1999).
  39. Sakai, T.; Suzuki, H.G.; Gakkai, N.K. Proceedings of ReX’99 (JIMIS-10). In Proceedings of the 4th International Conference on Recrystallization and Related Phenomena, Tsukuba City, Japan, 13–16 July 1999. [Google Scholar]
  40. Renk, O.; Pippan, R. Saturation of grain refinement during severe plastic deformation of single phase materials: Reconsiderations, current status and open questions. Mater. Trans. 2019, 60, 1270–1282. [Google Scholar] [CrossRef] [Green Version]
  41. Kassner, M.E. Fundamental of Creep in Metals and Alloys; Elsevier: Amsterdam, The Netherlands, 2009. [Google Scholar]
  42. Blum, W.; Zeng, X.H. A simple dislocation model of deformation resistance of ultrafine-grained materials explaining Hall–Petch strengthening and enhanced strain rate sensitivity. Acta Mater. 2009, 57, 1966–1974. [Google Scholar] [CrossRef]
  43. Blum, W.; Dvořák, J.; Král, P.; Eisenlohr, P.; Sklenička, V. Effects of grain refinement by ECAP on the deformation resistance of Al interpreted in terms of boundary-mediated processes. J. Mater. Sci. Technol. 2016, 32, 1309–1320. [Google Scholar] [CrossRef]
  44. Blum, W.; Dvorak, J.; Kral, P.; Eisenlohr, P.; Sklenicka, V. Effect of grain refinement by ECAP on creep of pure Cu. Mater. Sci. Eng. A 2014, 590, 423–432. [Google Scholar] [CrossRef]
  45. Valiev, R.Z. Structure and mechanical properties of ultrafine-grained metals. Mater. Sci. Eng. A 1997, 234–236, 59–66. [Google Scholar] [CrossRef]
  46. Valiev, R.Z.; Islamgaliev, R.K.; Alexandrov, I.V. Bulk nanostructured materials from severe plastic deformation. Prog. Mater. Sci. 2000, 45, 103–189. [Google Scholar] [CrossRef]
Figure 1. Microstructure of P92 steel before creep testing (a) CG state, (b) RS-processed state, (c) HPS-processed state and (d) density of GND.
Metals 11 02044 g001
Figure 2. Dependences of strain rate vs. strain (a) CG state, (b) RS-processed state, (c) HPS-processed state and (d) influence of annealing on creep behavior.
Metals 11 02044 g002
Figure 3. Stress dependences of (a) minimum creep rates and (b) time to fracture for CG, RS and HPS-processed states tested at 500 °C.
Metals 11 02044 g003
Figure 4. Microstructure of CG state tested at 500 °C and 400 MPa (a) grip part, (b) near the fracture, (c) misorientation distributions measured in different locations and (d) pole figures for {110} planes in the grip part and near the fracture, X direction is parallel to the stress axis.
Metals 11 02044 g004
Figure 5. Density of GND in CG state tested at 500 °C and 400 MPa determined in various locations of the tensile specimen.
Metals 11 02044 g005
Figure 6. Microstructure of RS-processed P92 steel tested at 500 °C and 600 MPa (a) grip part, (b) near the fracture, (c) misorientation distributions measured in different locations and (d) pole figures for {110} planes in the grip part and the near fracture, X direction is parallel to the stress axis.
Metals 11 02044 g006aMetals 11 02044 g006b
Figure 7. Density of GND in RS-processed P92 steel tested at 500 °C determined in various locations of the tensile specimen.
Metals 11 02044 g007
Figure 8. Substructure and dislocation structure of RS-processed P92 steel tested at 700 MPa (a) grip part–substructure inside of long band, zone axis near [101], (b) grip part–dislocation inside subgrain, zone axis near [111], (c) gauge length–dislocation inside subgrain, zone axis near [111].
Metals 11 02044 g008
Figure 9. Microstructure of the HPS-processed P92 steel tested at 500 °C and 700 MPa (a) grip part, (b) near the fracture, (c) misorientation distributions measured in different locations and (d) pole figures for {110} planes in the grip part and near the fracture, X direction is parallel to the stress axis.
Metals 11 02044 g009
Figure 10. Density of GND in HPS-processed P92 steel tested at 500 °C determined in various locations of the tensile specimen.
Metals 11 02044 g010
Figure 11. Microstructure after creep testing at 300 MPa and creep strain about 0.04 (a) gauge length, (b) dislocations inside larger grain, zone axis near [111] and (c) dislocations in interior of fine grain, zone axis near [111].
Metals 11 02044 g011
Figure 12. Microstructure in the gauge length of the HPS-processed specimen tested at 500 °C and 300 Mpa. (a) Formation of the Laves phase, (b) distribution of Cr and (c) distribution of W in the microstructure.
Metals 11 02044 g012
Figure 13. Microstructure of HPS-processed P92 steel annealed at 650 °C for 500 h and tested at 500 °C and 400 MPa (a) grip part, (b) near the fracture, (c) misorientation distributions measured in different locations and (d) pole figures for {110} planes in the grip part and near the fracture, X direction is parallel to the stress axis.
Metals 11 02044 g013
Figure 14. Density of GND in HPS-processed P92 steel annealed at 650 °C for 500 h and tested at 400 MPa determined in various locations of the tensile specimen.
Metals 11 02044 g014
Figure 15. Microstructure characteristics measured in grip part (empty symbols) and gauge length (full symbols) of CG and SPD-processed P92 steel after creep testing at different stresses. (a) Subgrain, the crosses indicate the subgrain size measured by TEM in gauge length (b) grain size. The subgrain and grain sizes are compared with the expected stationary subgrain size with different value of G [30,31].
Metals 11 02044 g015
Publisher’s Note: MDPI stays neutral with regard to jurisdictional claims in published maps and institutional affiliations.

