
Effect of Tungsten Carbide Morphology, Quantity, and Microstructure on Wear of a Hardfacing Layer Manufactured by Plasma Transferred Arc Welding


Abstract
:1. Introduction
2. Materials and Methods
3. Results
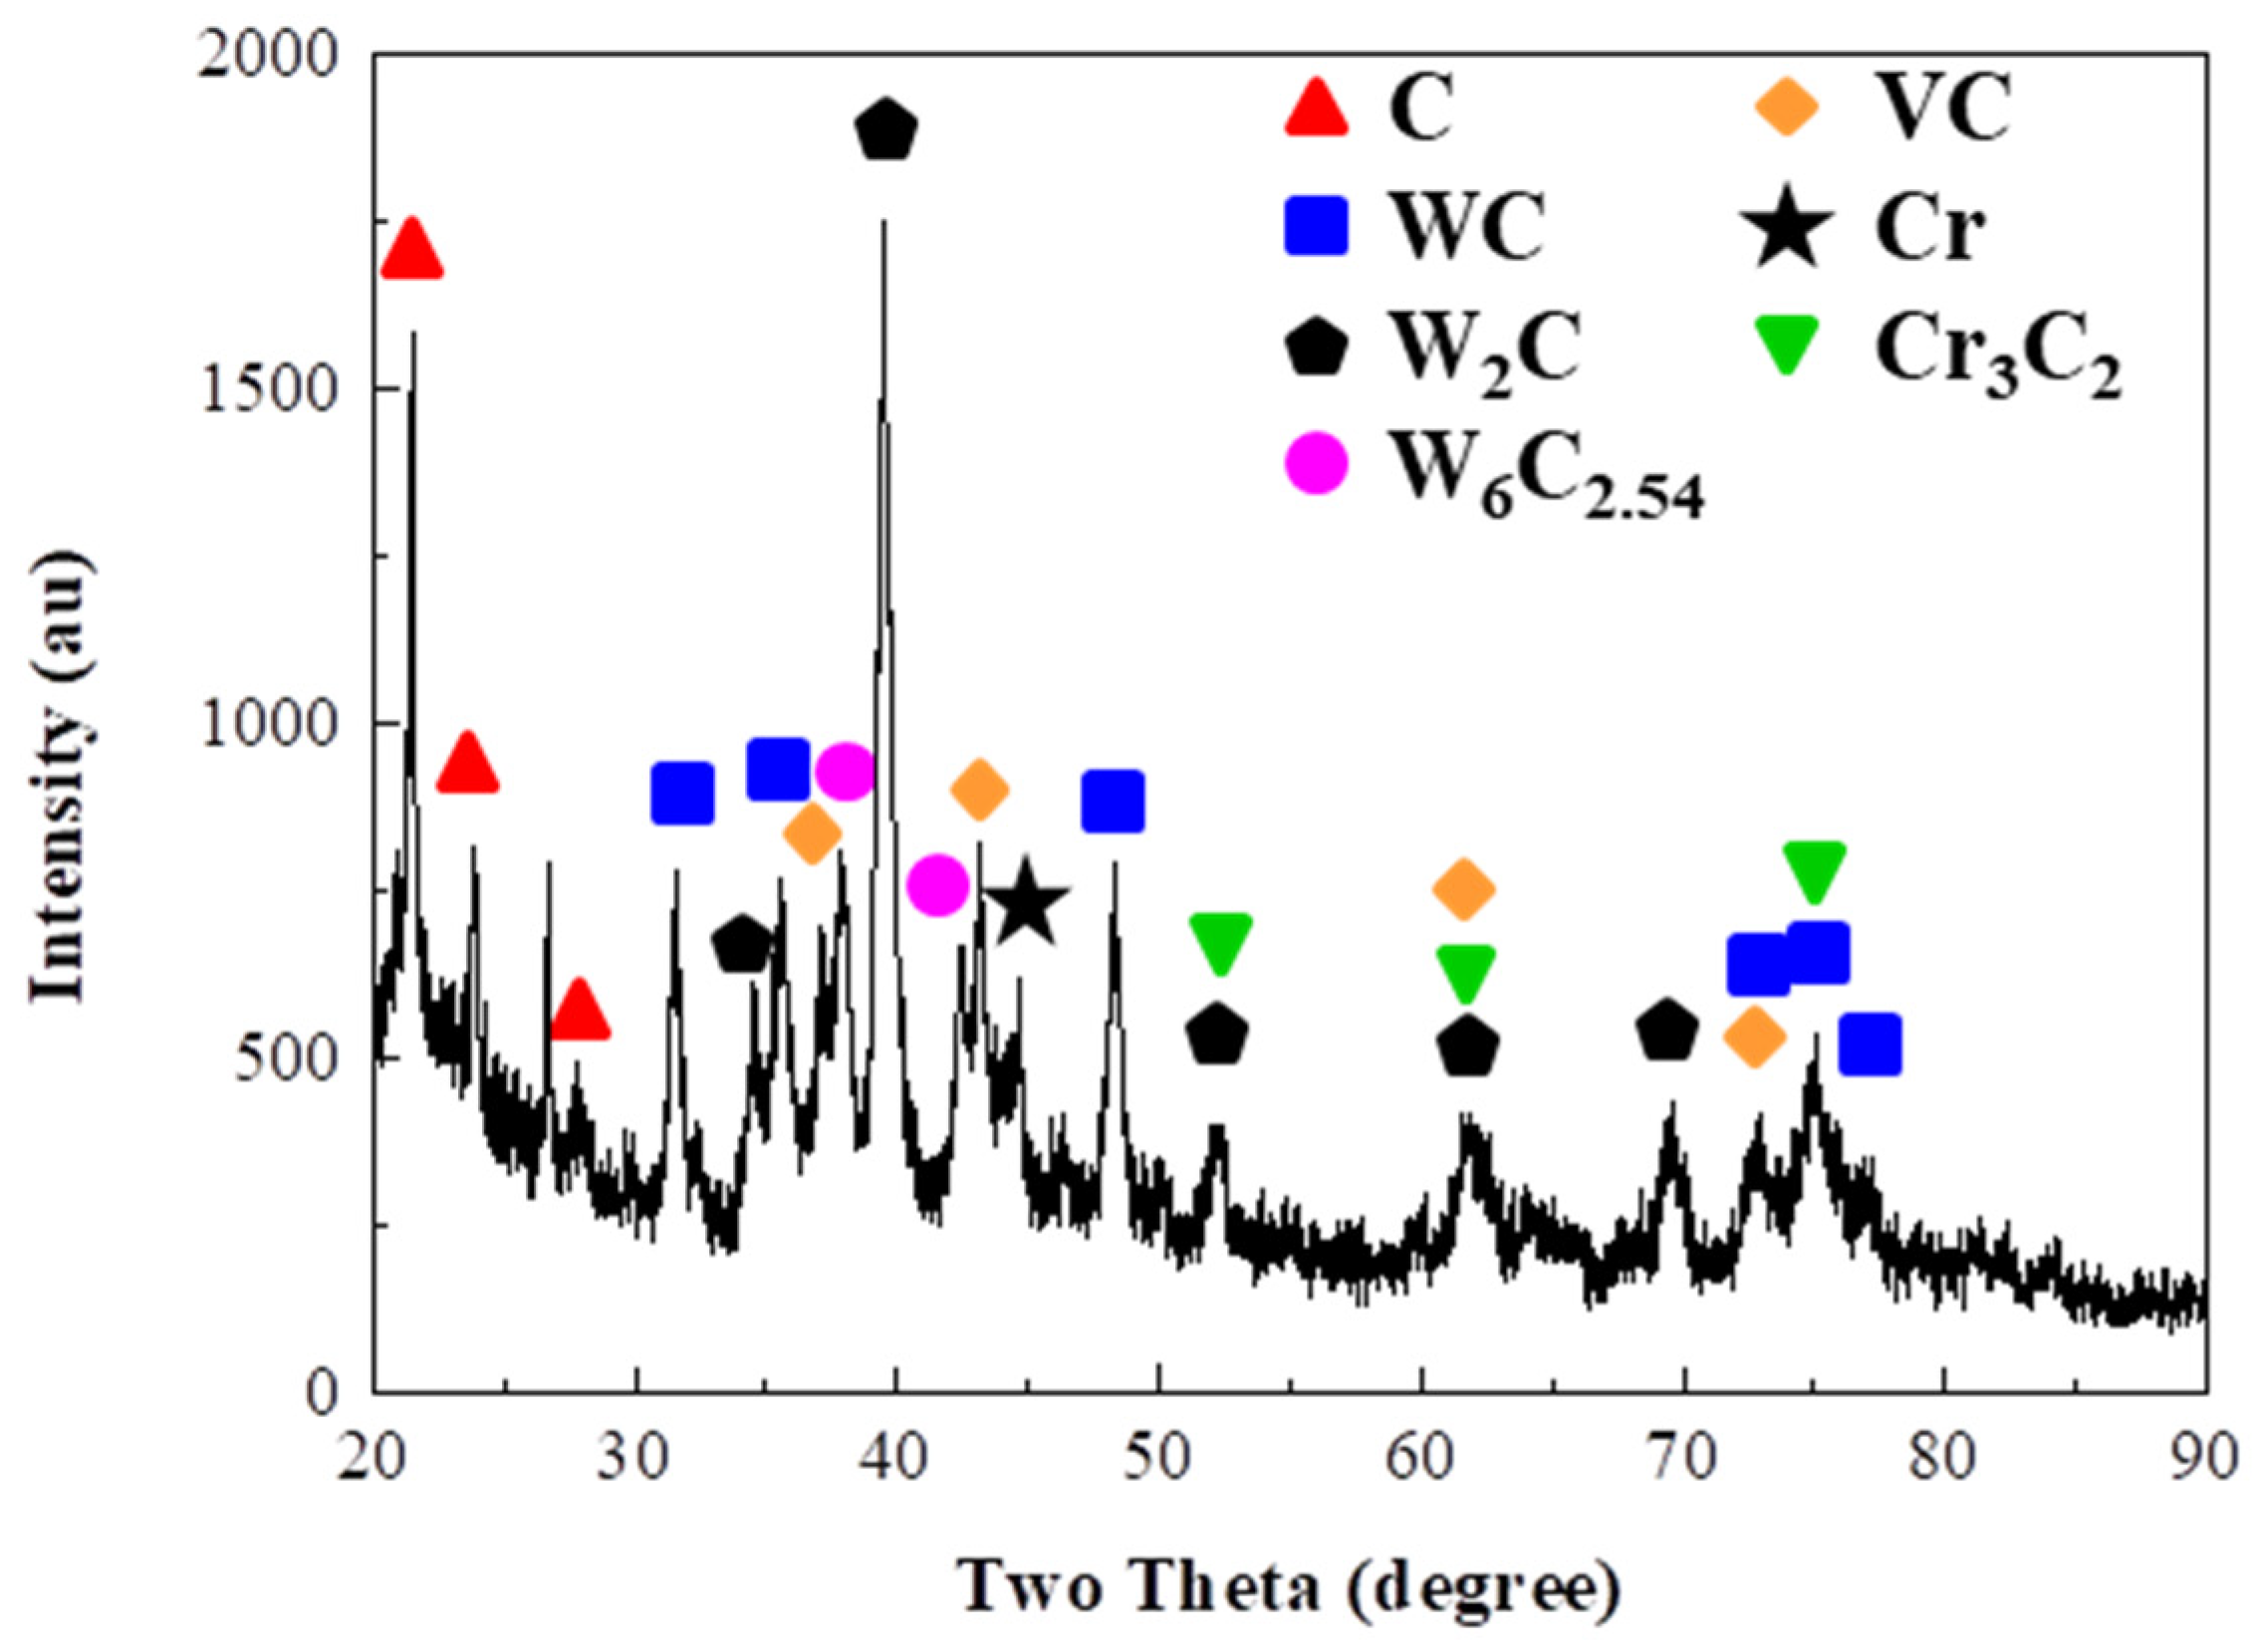
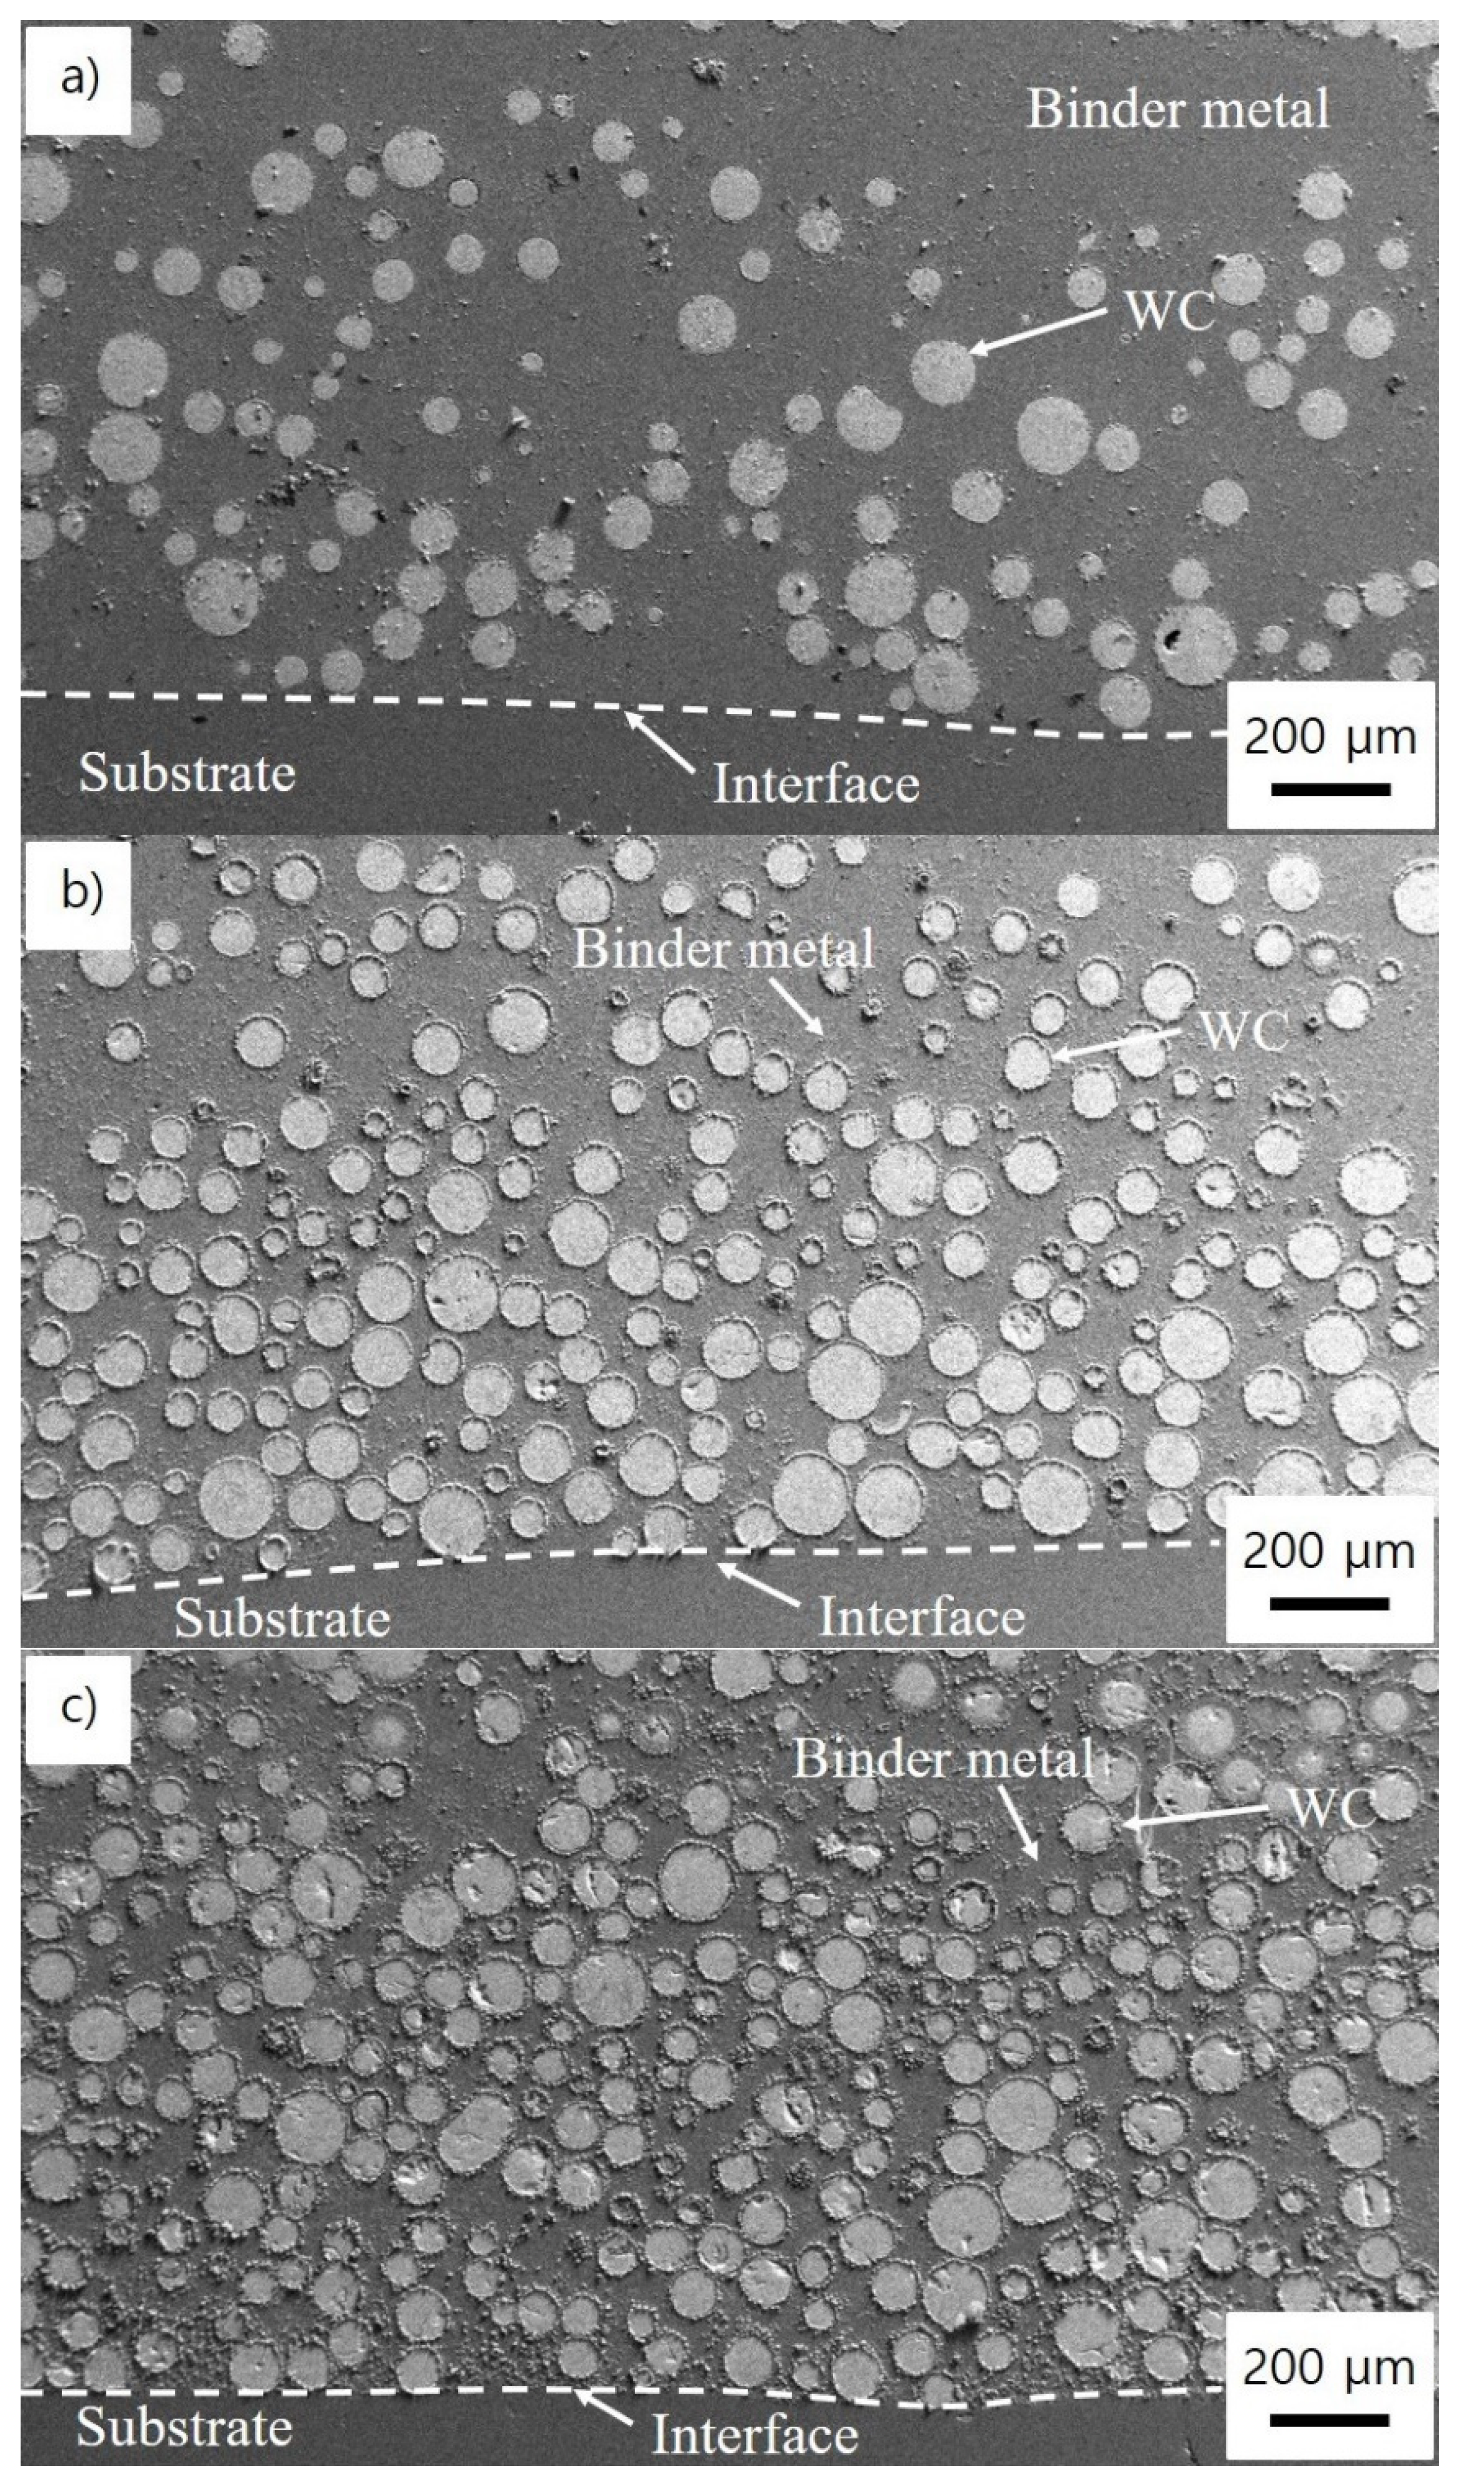
3.1. Formation and Growth of Intermediate Phases (IPs) in the Hardfacing Layer
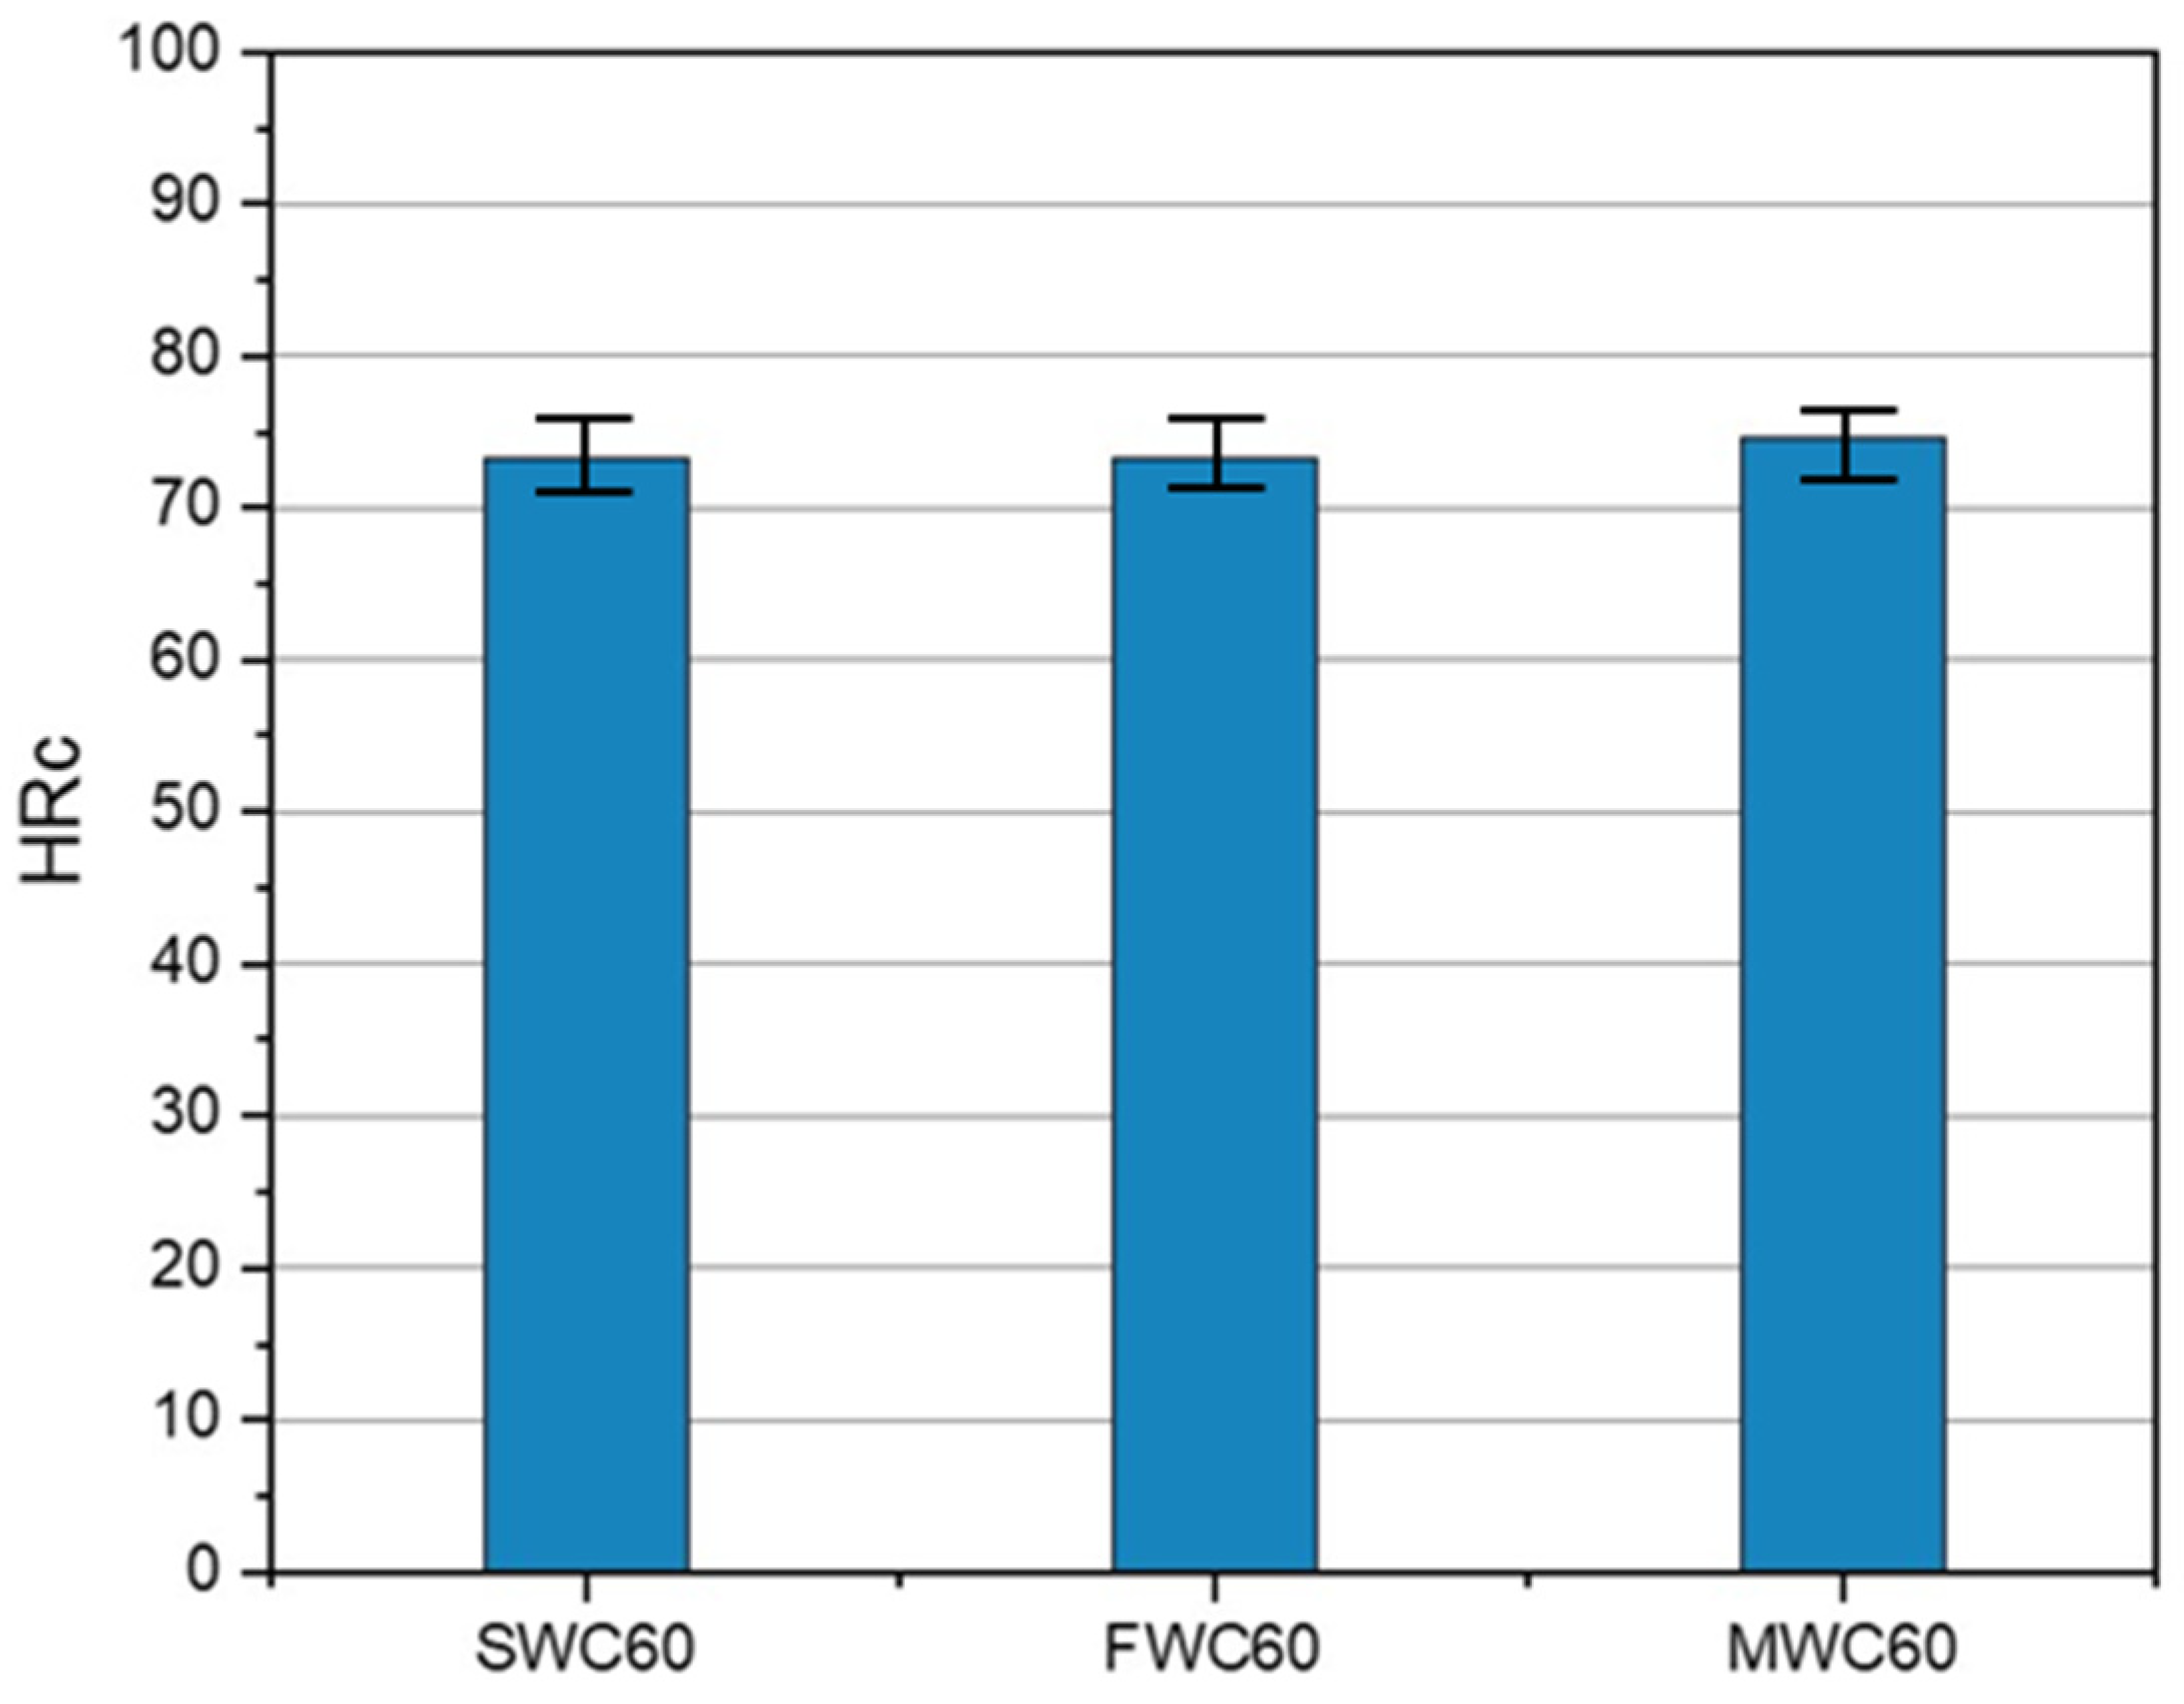
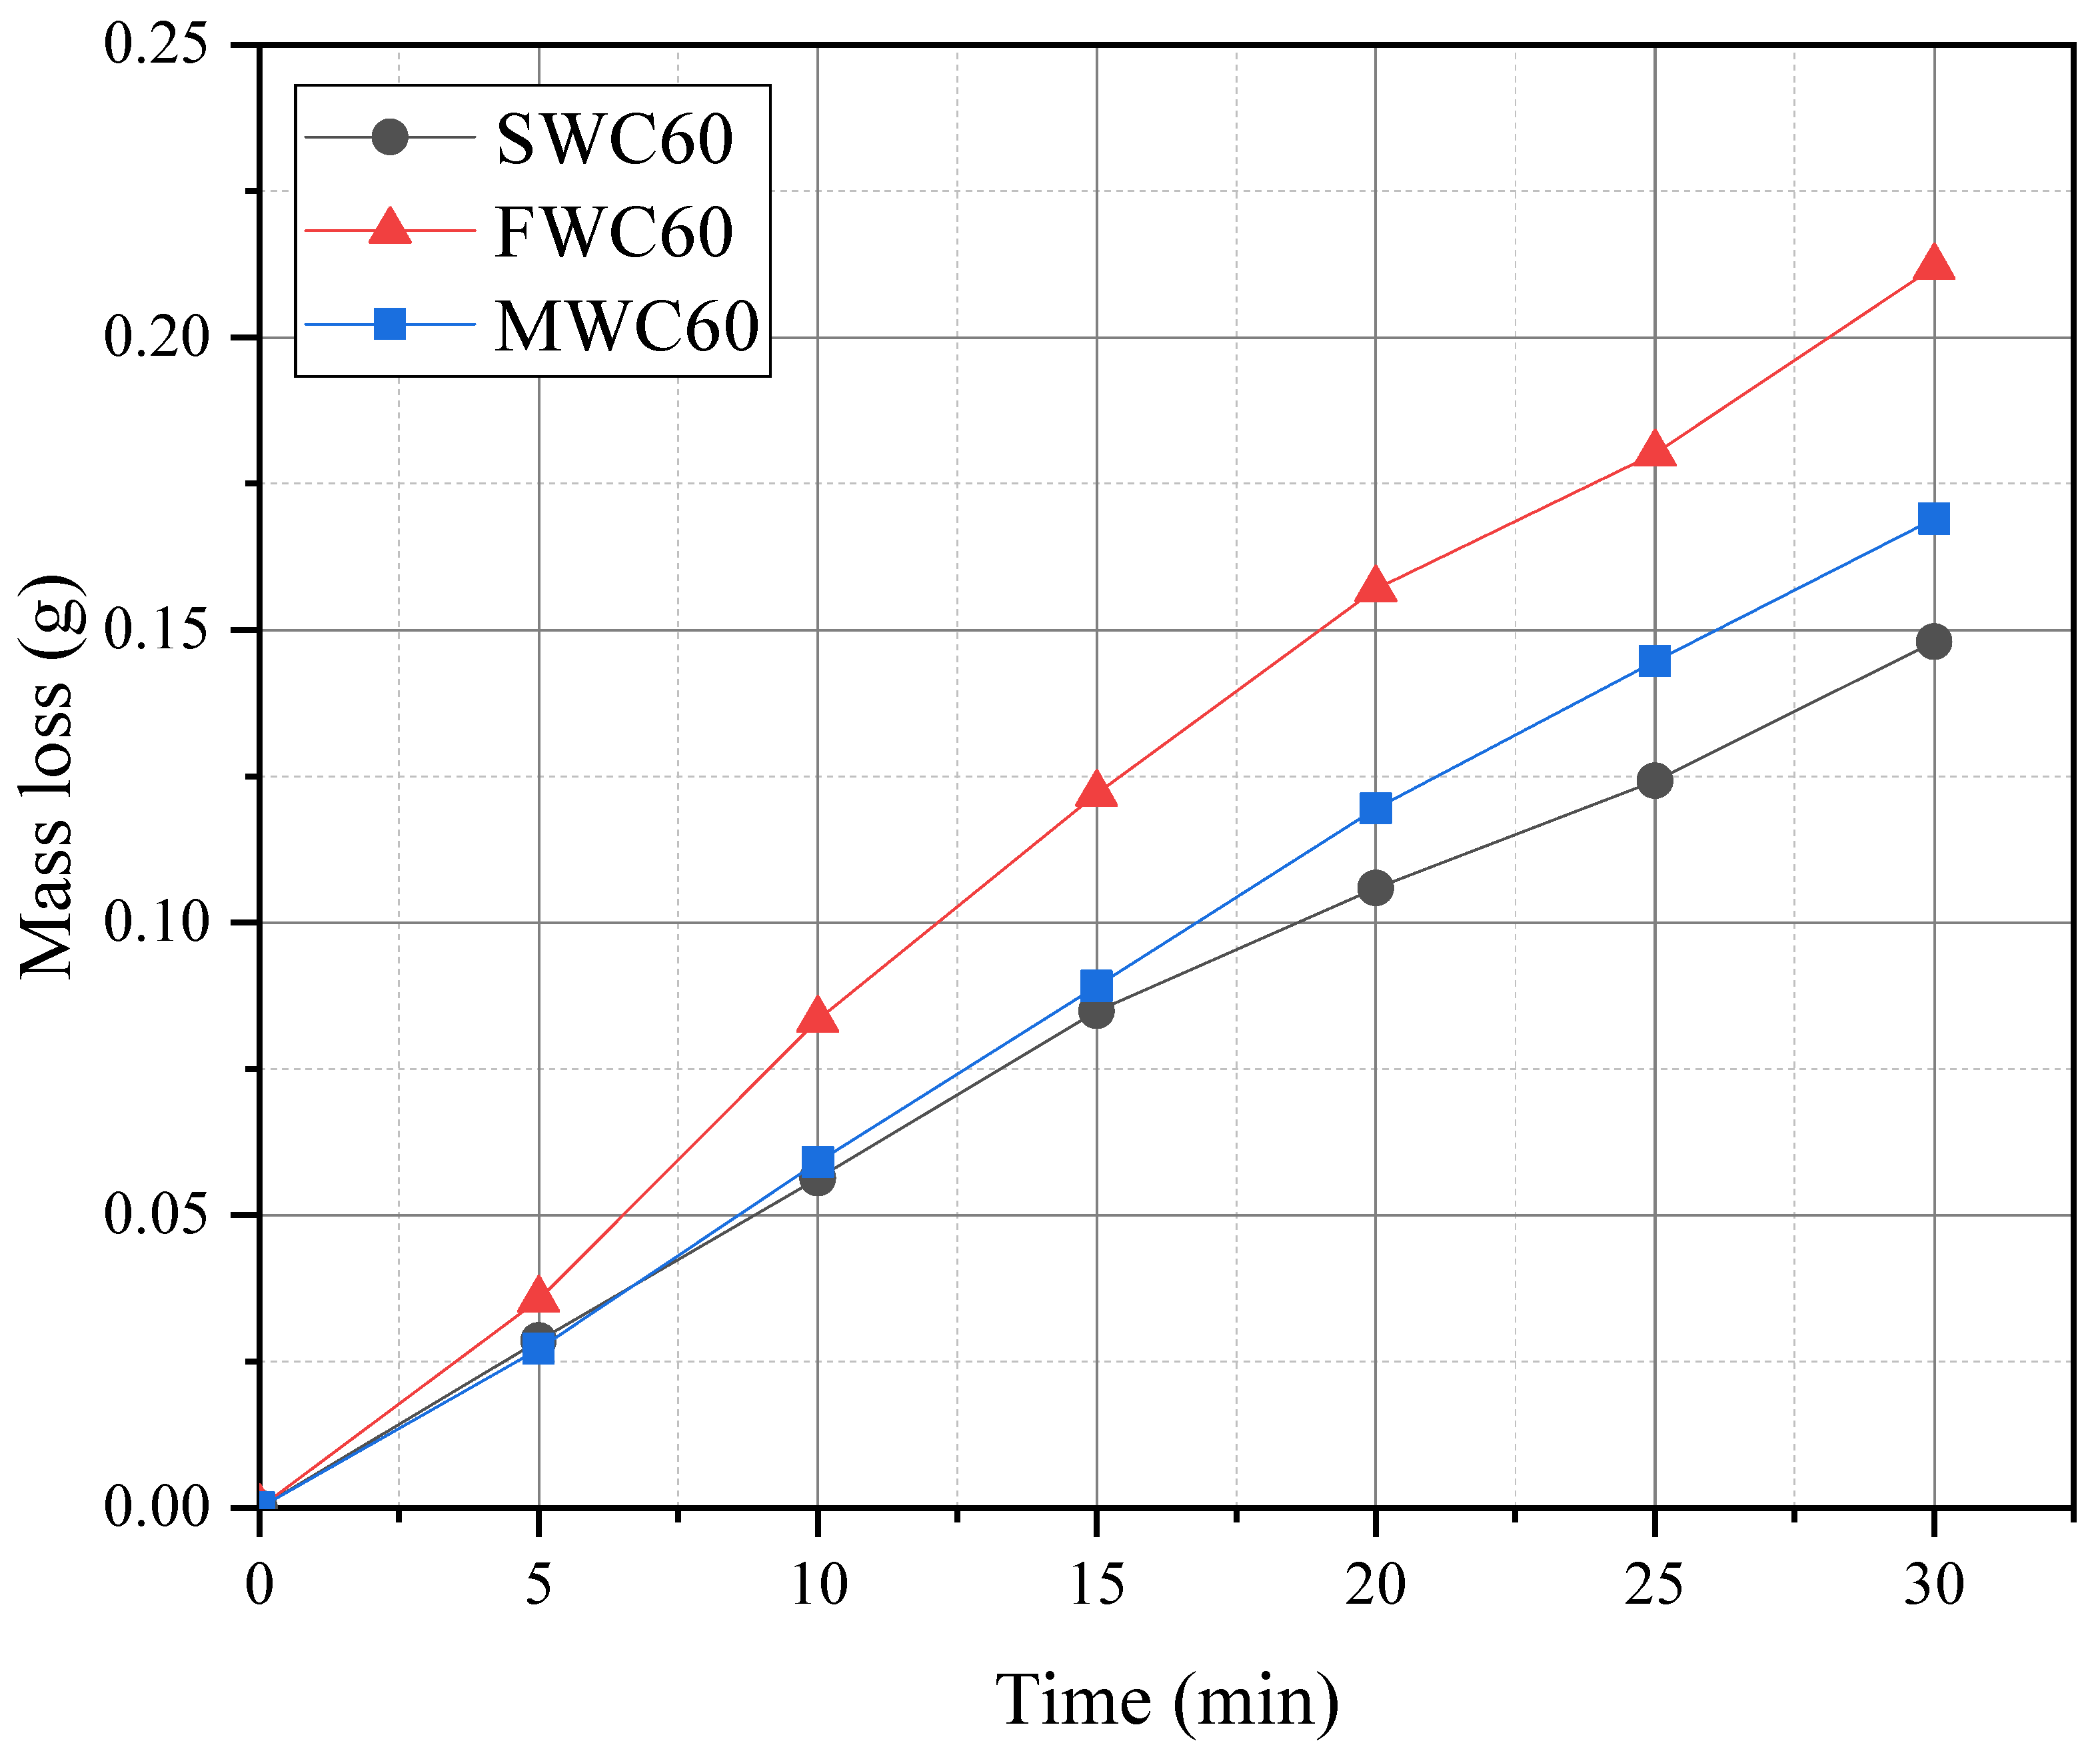
3.2. Effect of WC Morphology on the Mechanical Properties of the PTAW Hardfacing Layer
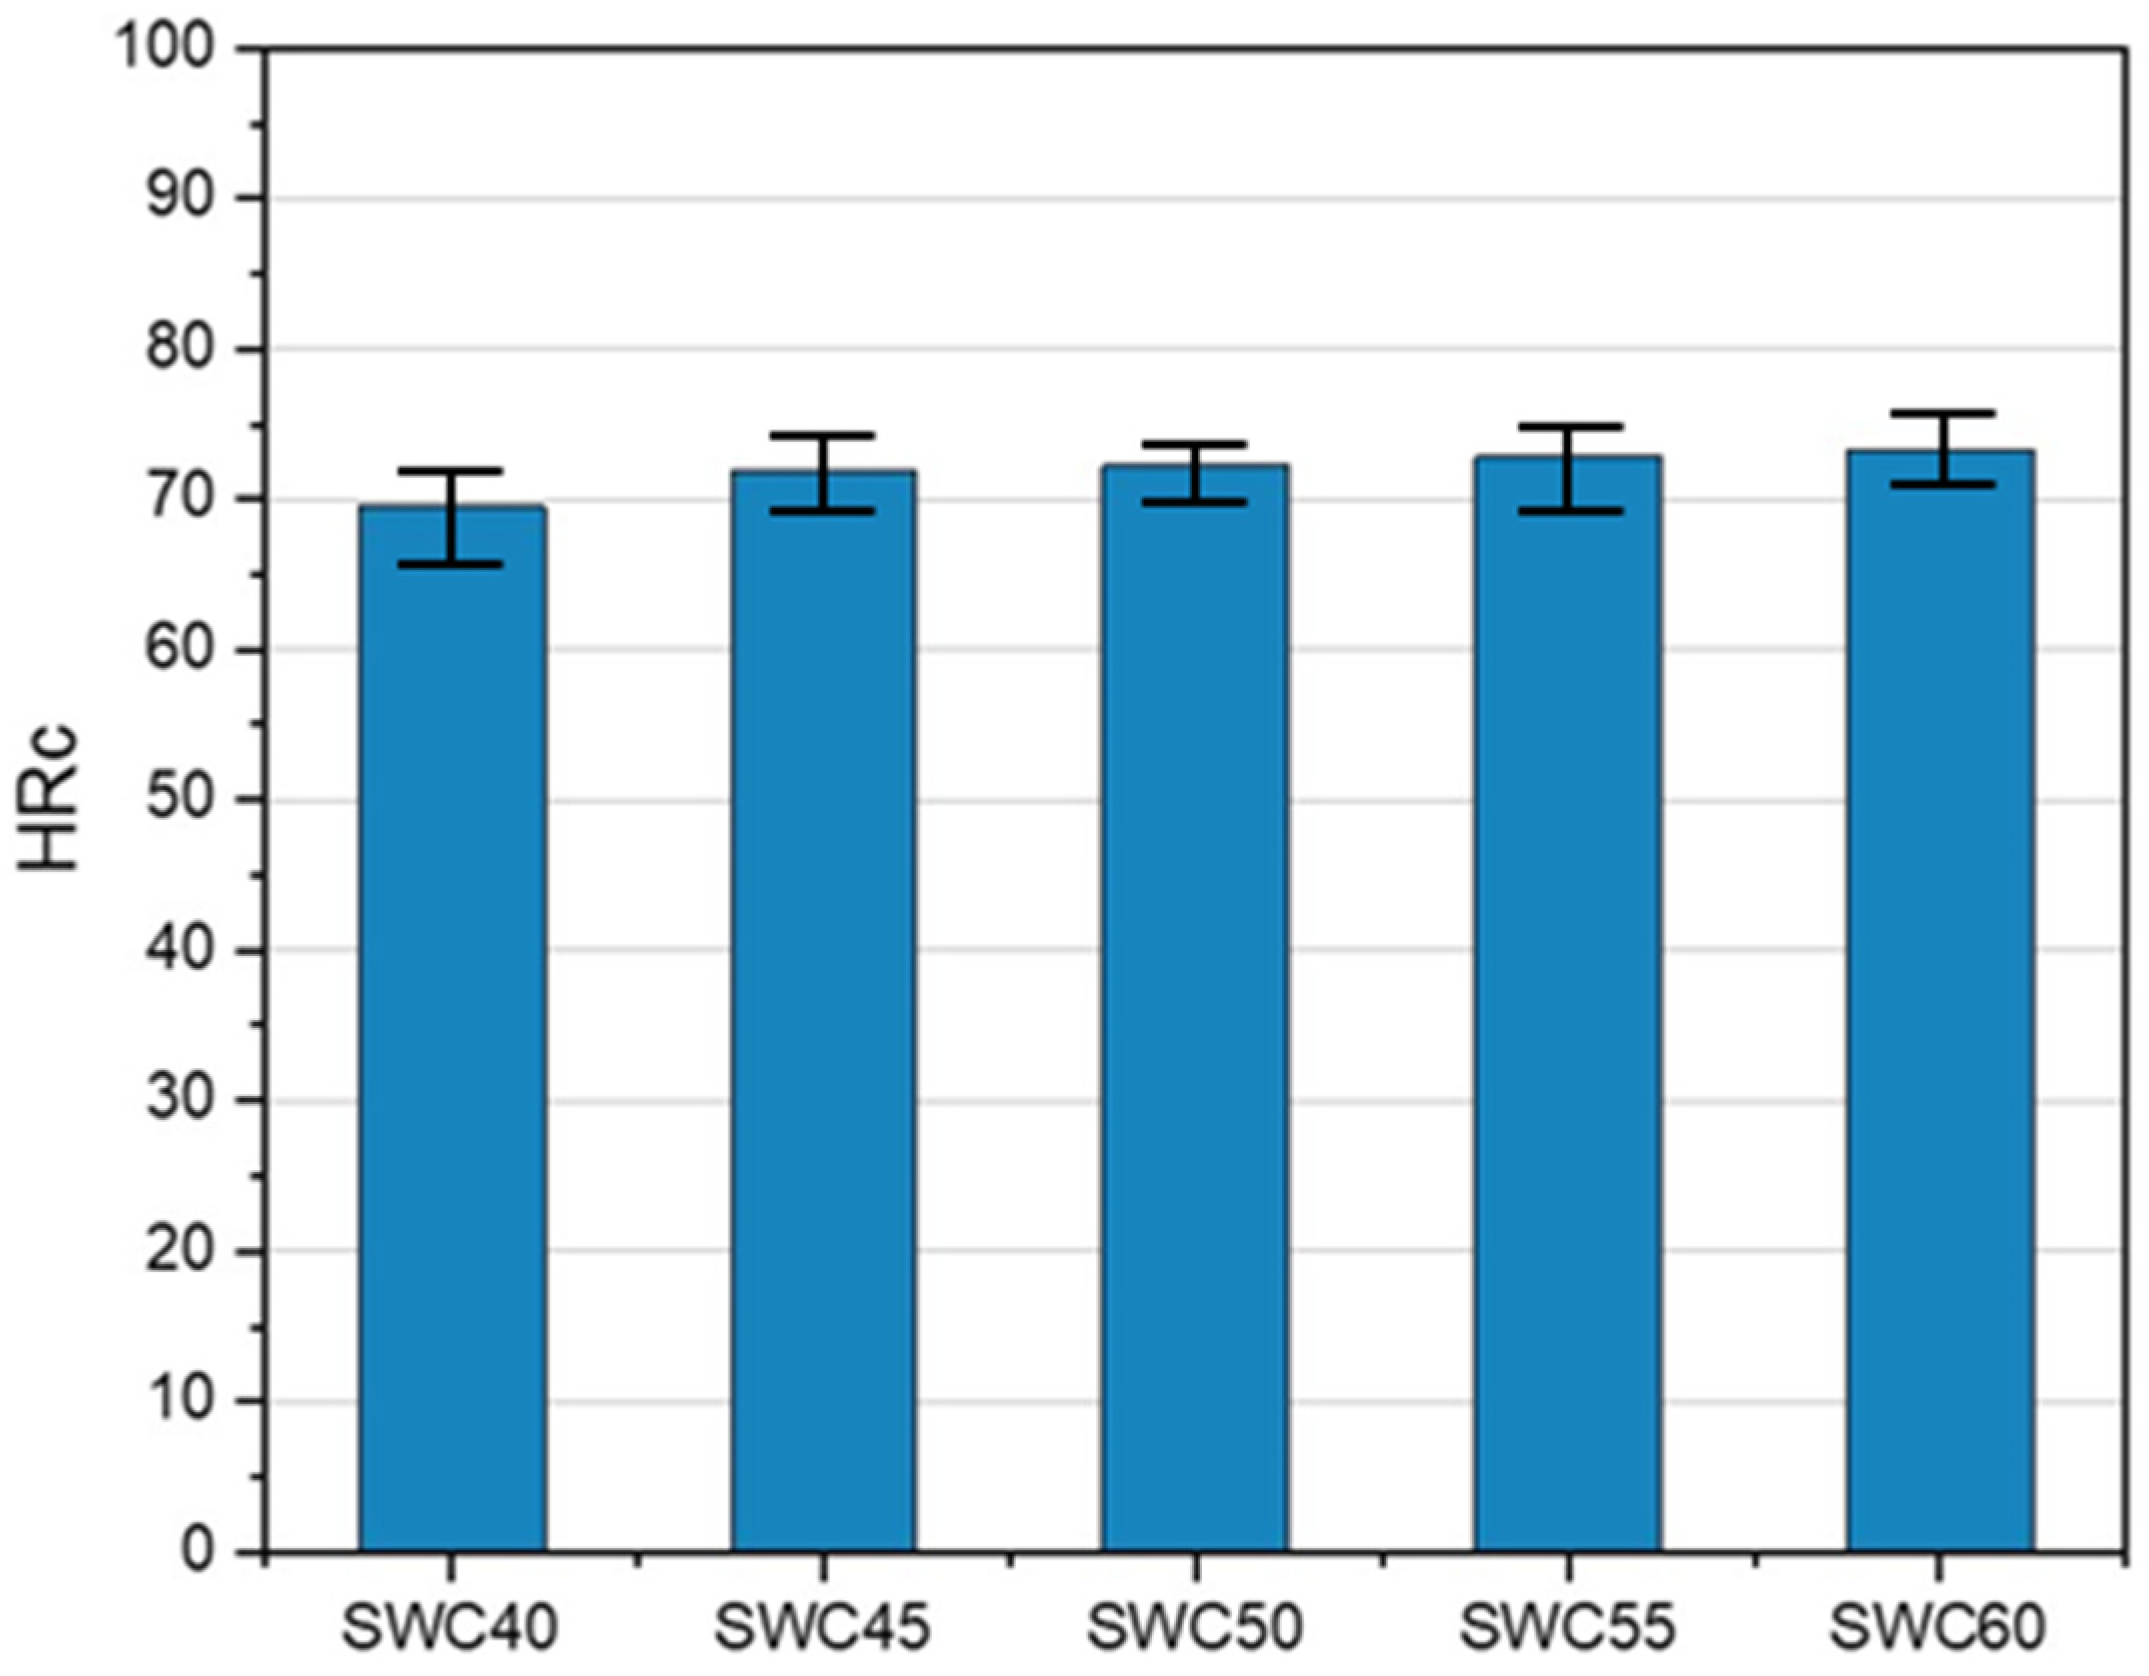
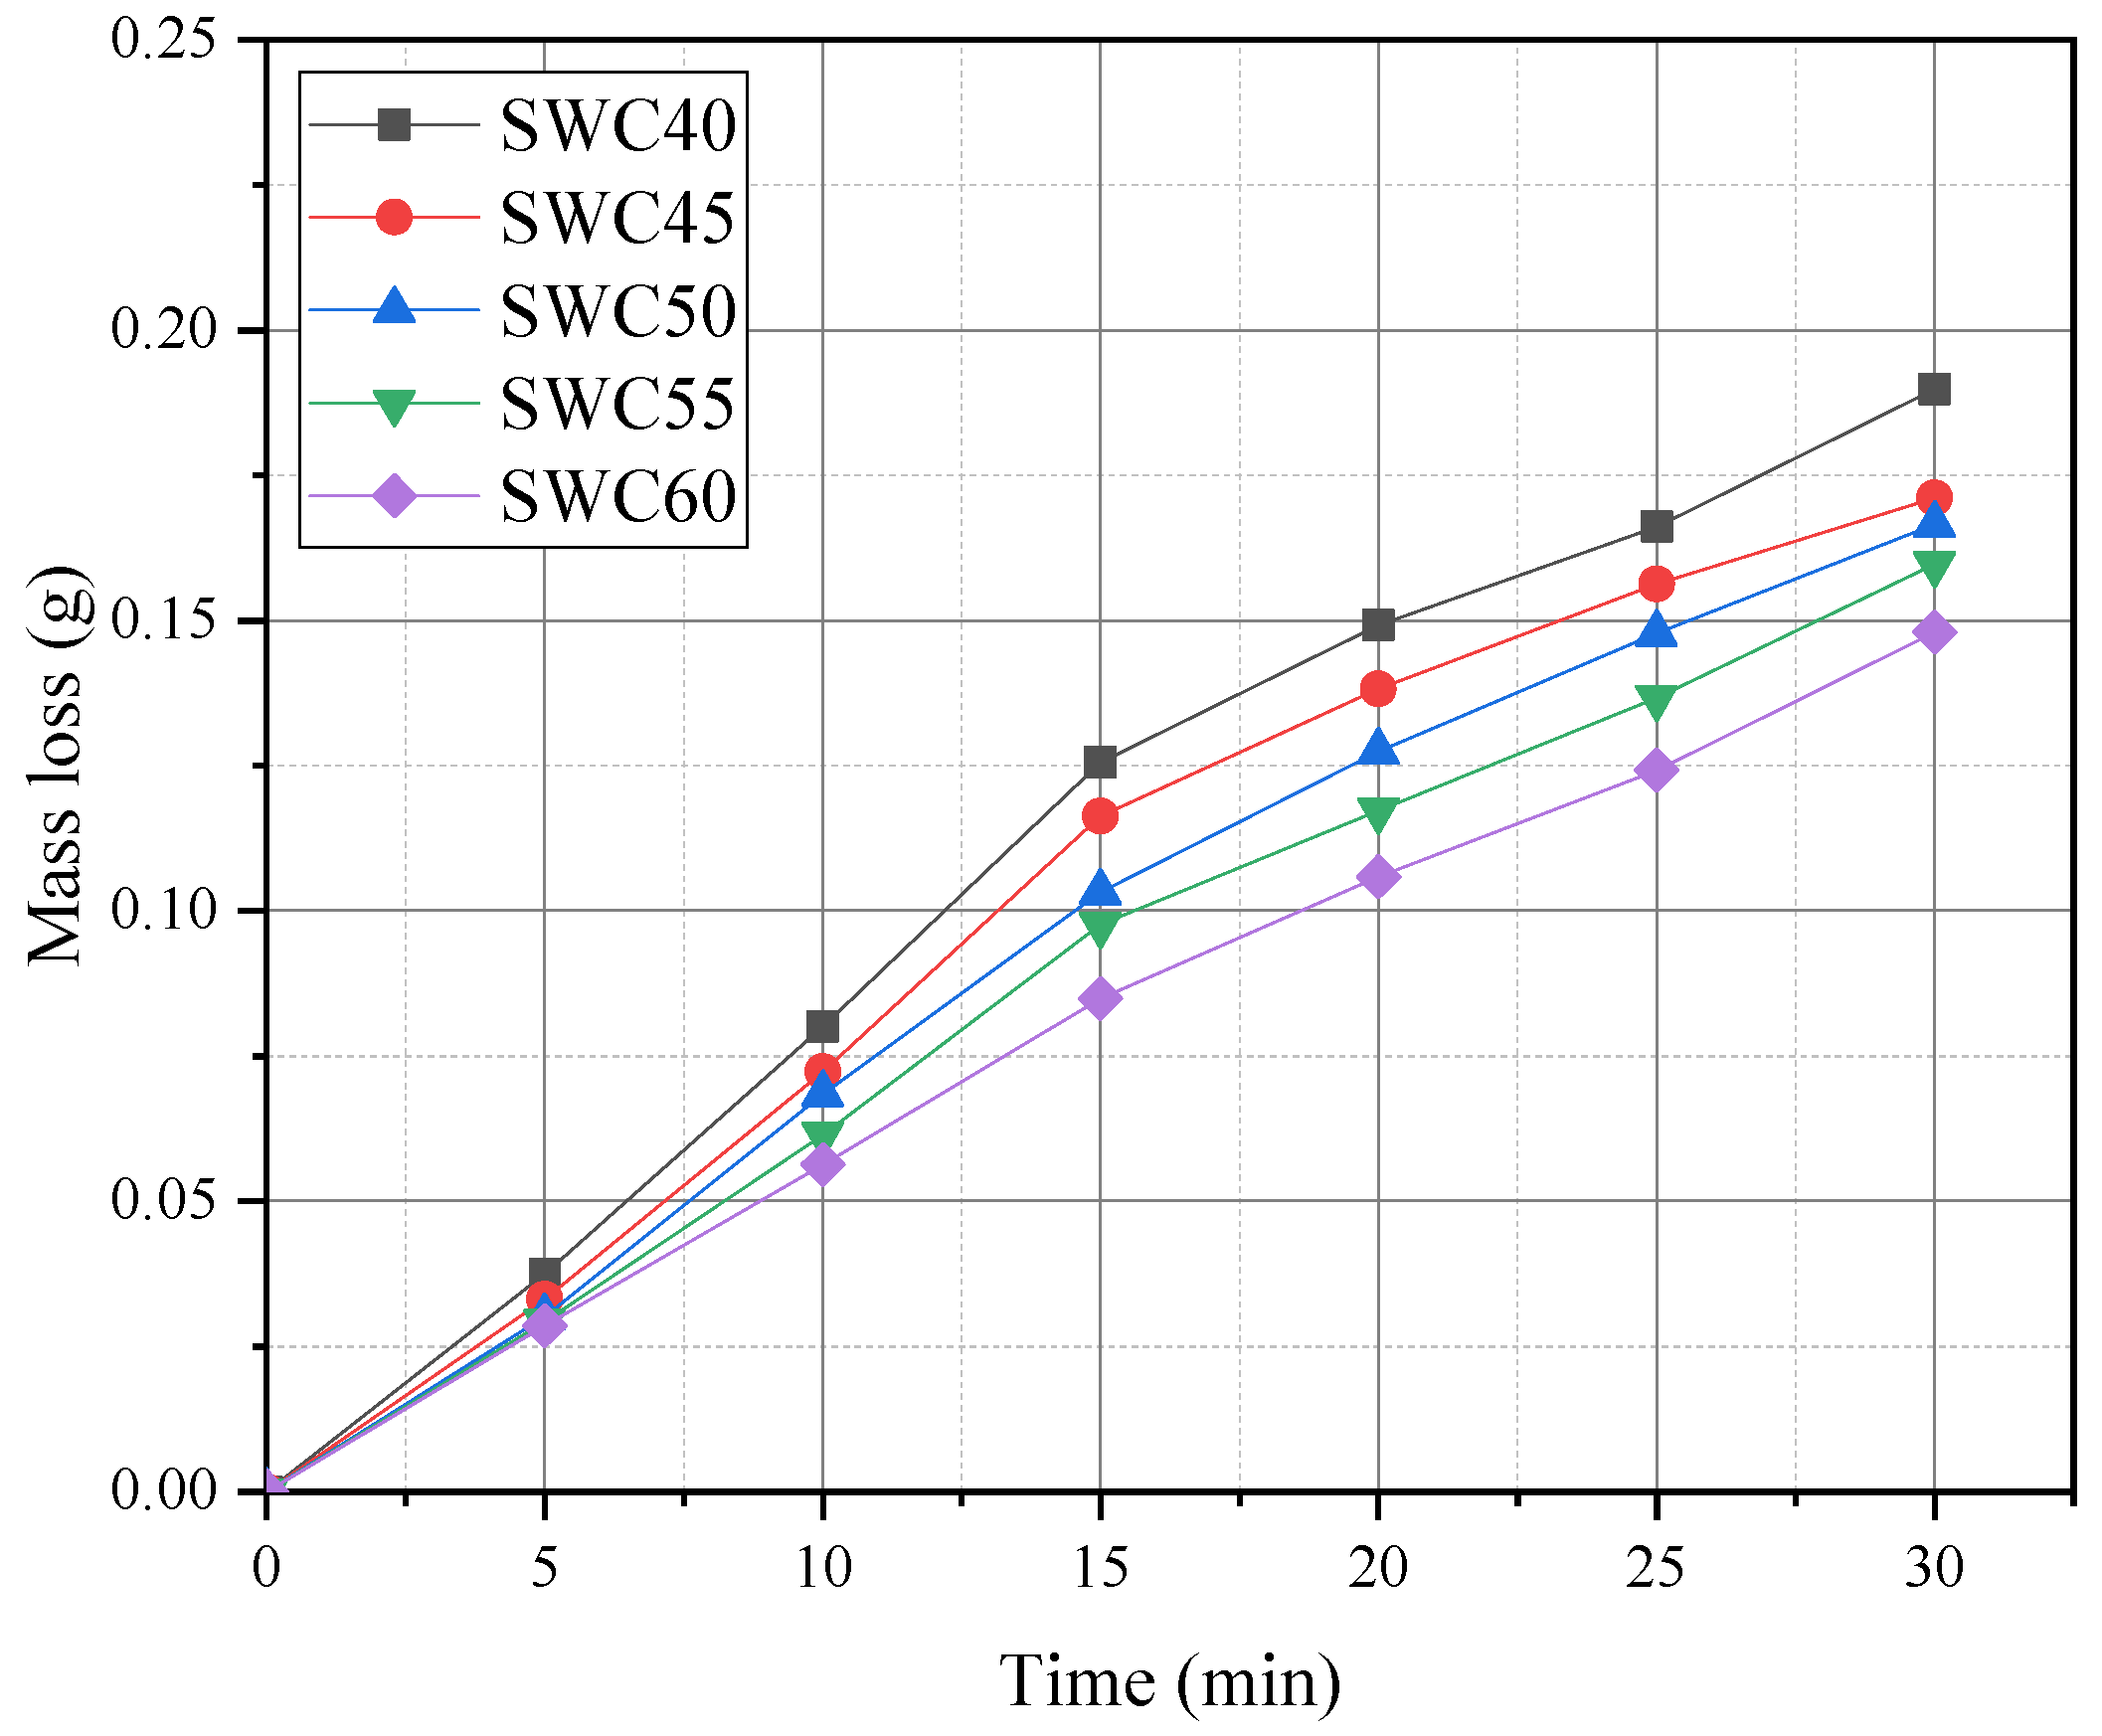
3.3. Effect of WC Quantity on the Mechanical Properties of the PTAW Hardfacing Layer
4. Discussion
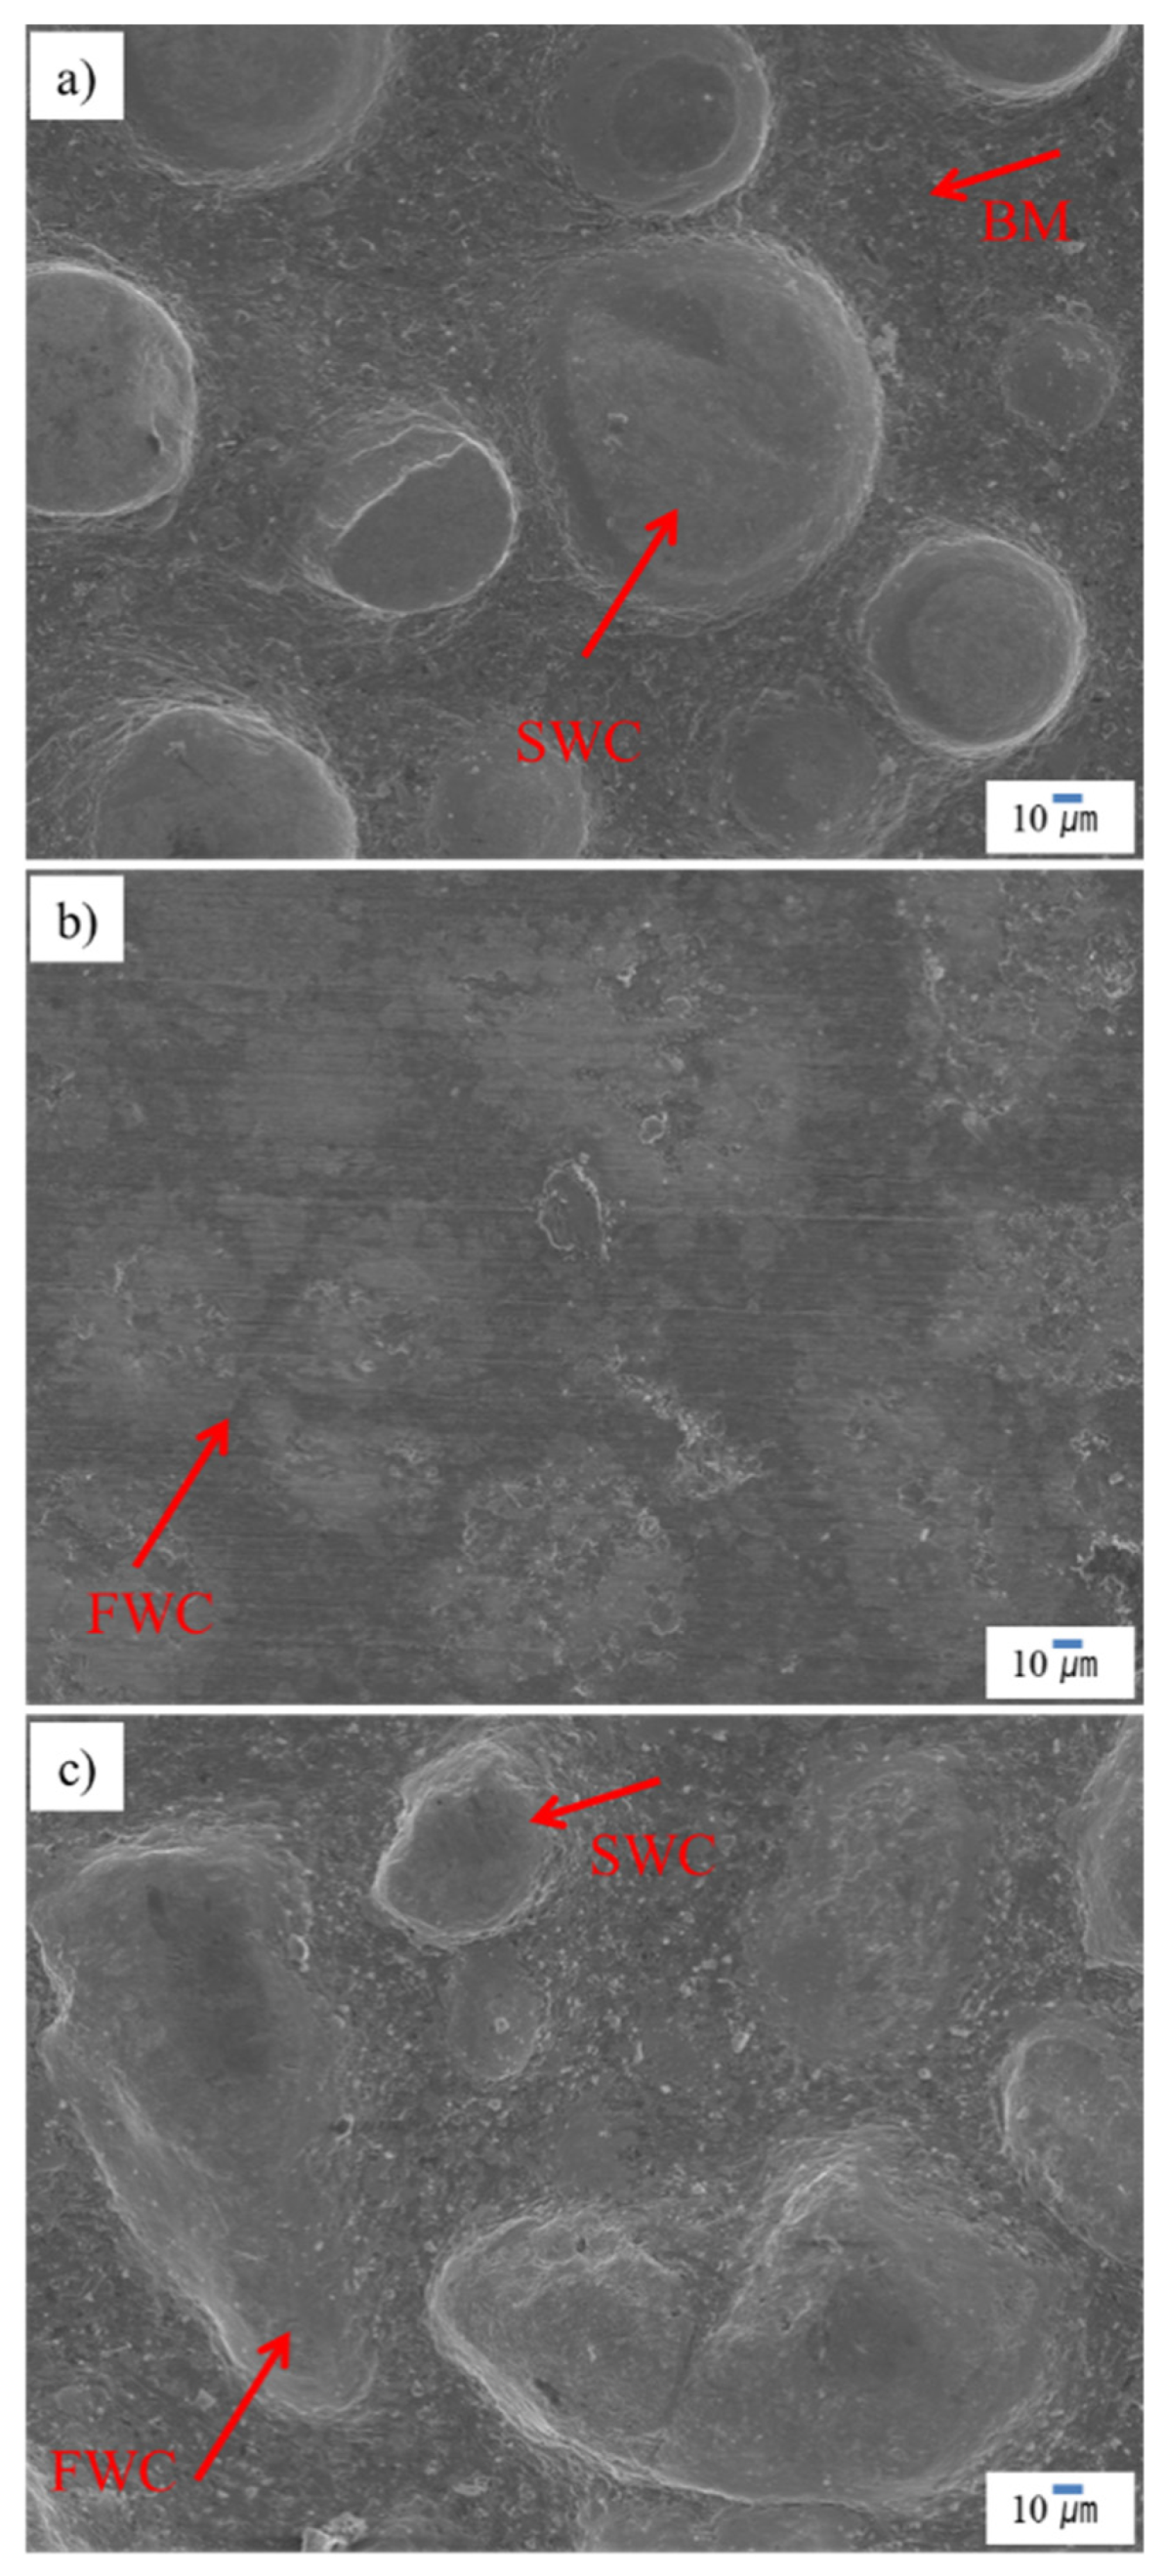
Wear Mechanism and the IPs Bands Formed around the WC Powders in the Hardfacing Layer
5. Conclusions
Author Contributions
Funding
Institutional Review Board Statement
Informed Consent Statement
Data Availability Statement
Acknowledgments
Conflicts of Interest
References
- Jones, A.H.; Roffey, P. The improvement of hard facing coatings for ground engaging applications by the addition of tungsten carbide. Wear 2009, 267, 925–933. [Google Scholar] [CrossRef]
- Günther, K.; Liefeith, J.; Henckell, P.; Ali, Y.; Bergmann, J.P. Influence of processing condition on the degradation kinetics of fused tungsten carbides in hardfacing. Int. J. Refract. Met. Hard Mater. 2018, 70, 224–231. [Google Scholar] [CrossRef]
- Takahashi, T.; Itoh, H. Chemical vapor deposition of tungsten carbide dendrites. J. Cryst. Growth 1972, 12, 265–271. [Google Scholar] [CrossRef]
- Sun, Y.M.; Lee, S.Y.; Lemonds, A.M.; Engbrecht, E.R.; Veldman, S.; Lozano, J.; White, J.M.; Ekerdt, J.G.; Emesh, I.; Pfeifer, K. Low temperature chemical vapor deposition of tungsten carbides for copper diffusion barriers. Thin Solid Film. 2001, 397, 109–115. [Google Scholar] [CrossRef]
- Reed, B.; Wang, R.; Lu, P.Y.; Qu, J. Autoclave grid-to-rod fretting wear evolution of a candidate coating for accident-tolerant fuel. Wear 2021, 466–467, 203578. [Google Scholar] [CrossRef]
- Xu, B.; Jiang, P.; Geng, S.; Zhao, J.; Mi, G. In-situ reaction and mechanical properties of 6061 aluminun alloy weld joint with SiCp by laser melting injection. Mater. Des. 2021, 203, 109538. [Google Scholar] [CrossRef]
- Cao, X.; Zhu, P.; Wang, W.; Liu, T.; Lu, Y.; Shoji, T. Effect of thermal aging on oxide film of stainless-steel weld overlay cladding exposed to high temperature water. Mater. Charact. 2018, 138, 195–207. [Google Scholar] [CrossRef]
- Mendez, P.F.; Barnes, N.; Bell, K.; Borle, S.D.; Gajapathi, S.S.; Guest, S.D.; Izadi, H.; Gol, A.K.; Wood, G. Welding Processes for Wear Resistant Overlays. J. Manuf. Processes 2014, 16, 4–25. [Google Scholar] [CrossRef]
- Sundaramoorthy, R.; Tong, S.X.; Parekh, D.; Subramanian, C. Effect of Matrix Chemistry and WC types on the Performance of Ni-WC based MMC overlays deposited by Plasma Transferred Arc (PTA) Welding. Wear 2017, 376–377, 1720–1727. [Google Scholar] [CrossRef]
- Bourithis, L.; Papadimitriou, G.D. The effect of microstructure and wear conditiojns on the wear resistance of steel metal matrix composites fabricated with PTA alloying technique. Wear 2009, 266, 1155–1164. [Google Scholar] [CrossRef]
- Iakovou, R.; Bourithis, L.; Papadimitriou, G. Synthesis of boride coatings of steel using plasma transferred arc (PTA) process and its wear performance. Wear 2002, 252, 1007–1015. [Google Scholar] [CrossRef]
- Deuis, R.L.; Yellup, J.M.; Subramanian, C. Metal-matrix composite coatings by PTA surfacing. Compos. Sci. Technol. 1998, 58, 299–309. [Google Scholar] [CrossRef]
- Jankauskas, V.; Antonov, M.; Varnauskas, V.; Skirkus, R.; Goljandin, D. Effect of WC Grain size and content on low stress abrasive wear of manual arc welded hardfacings with low-carbon or stainless steel matrix. Wear 2015, 328–329, 378–390. [Google Scholar] [CrossRef]
- Liyanage, T.; Fisher, G.; Gerlich, A.P. Microstructures and abrasive wear performance of PTAW deposited Ni-WC overlays using different Ni-alloy chemistries. Wear 2012, 274–275, 345–354. [Google Scholar] [CrossRef]
- Chen, G.; Fu, X.; Wei, Y.; Zhou, W. Microstructure and wear properties of nickel-based surfacing deposited by plasma transferred arc welding. Surf. Coat. Technol. 2013, 228, s276–s282. [Google Scholar]
- Gnyusov, S.F.; Degterev, A.S.; Tarasov, S.Y. The effect of plsma torch weaving on microstructural evolution in multiple-pass plasma-transferred arc Fe-Cr-V-Mo-C coating. Surf. Coat. Technol. 2018, 344, 75–84. [Google Scholar] [CrossRef]
- Lee, K.; Kumai, S. Interfacial microstructure and strength of steel to aluminum alloy lap joints welded by a defocused laser beam. Mater. Trans. 2005, 46, 1847–1856. [Google Scholar] [CrossRef]
- Lee, K.; Kumai, S. Characterization of intermetallic compound layer formed at the weld interface of the defocused laser welded low carbon steel/6111 aluminum alloy lap joint. Mater. Trans. 2006, 47, 1178–1185. [Google Scholar] [CrossRef] [Green Version]


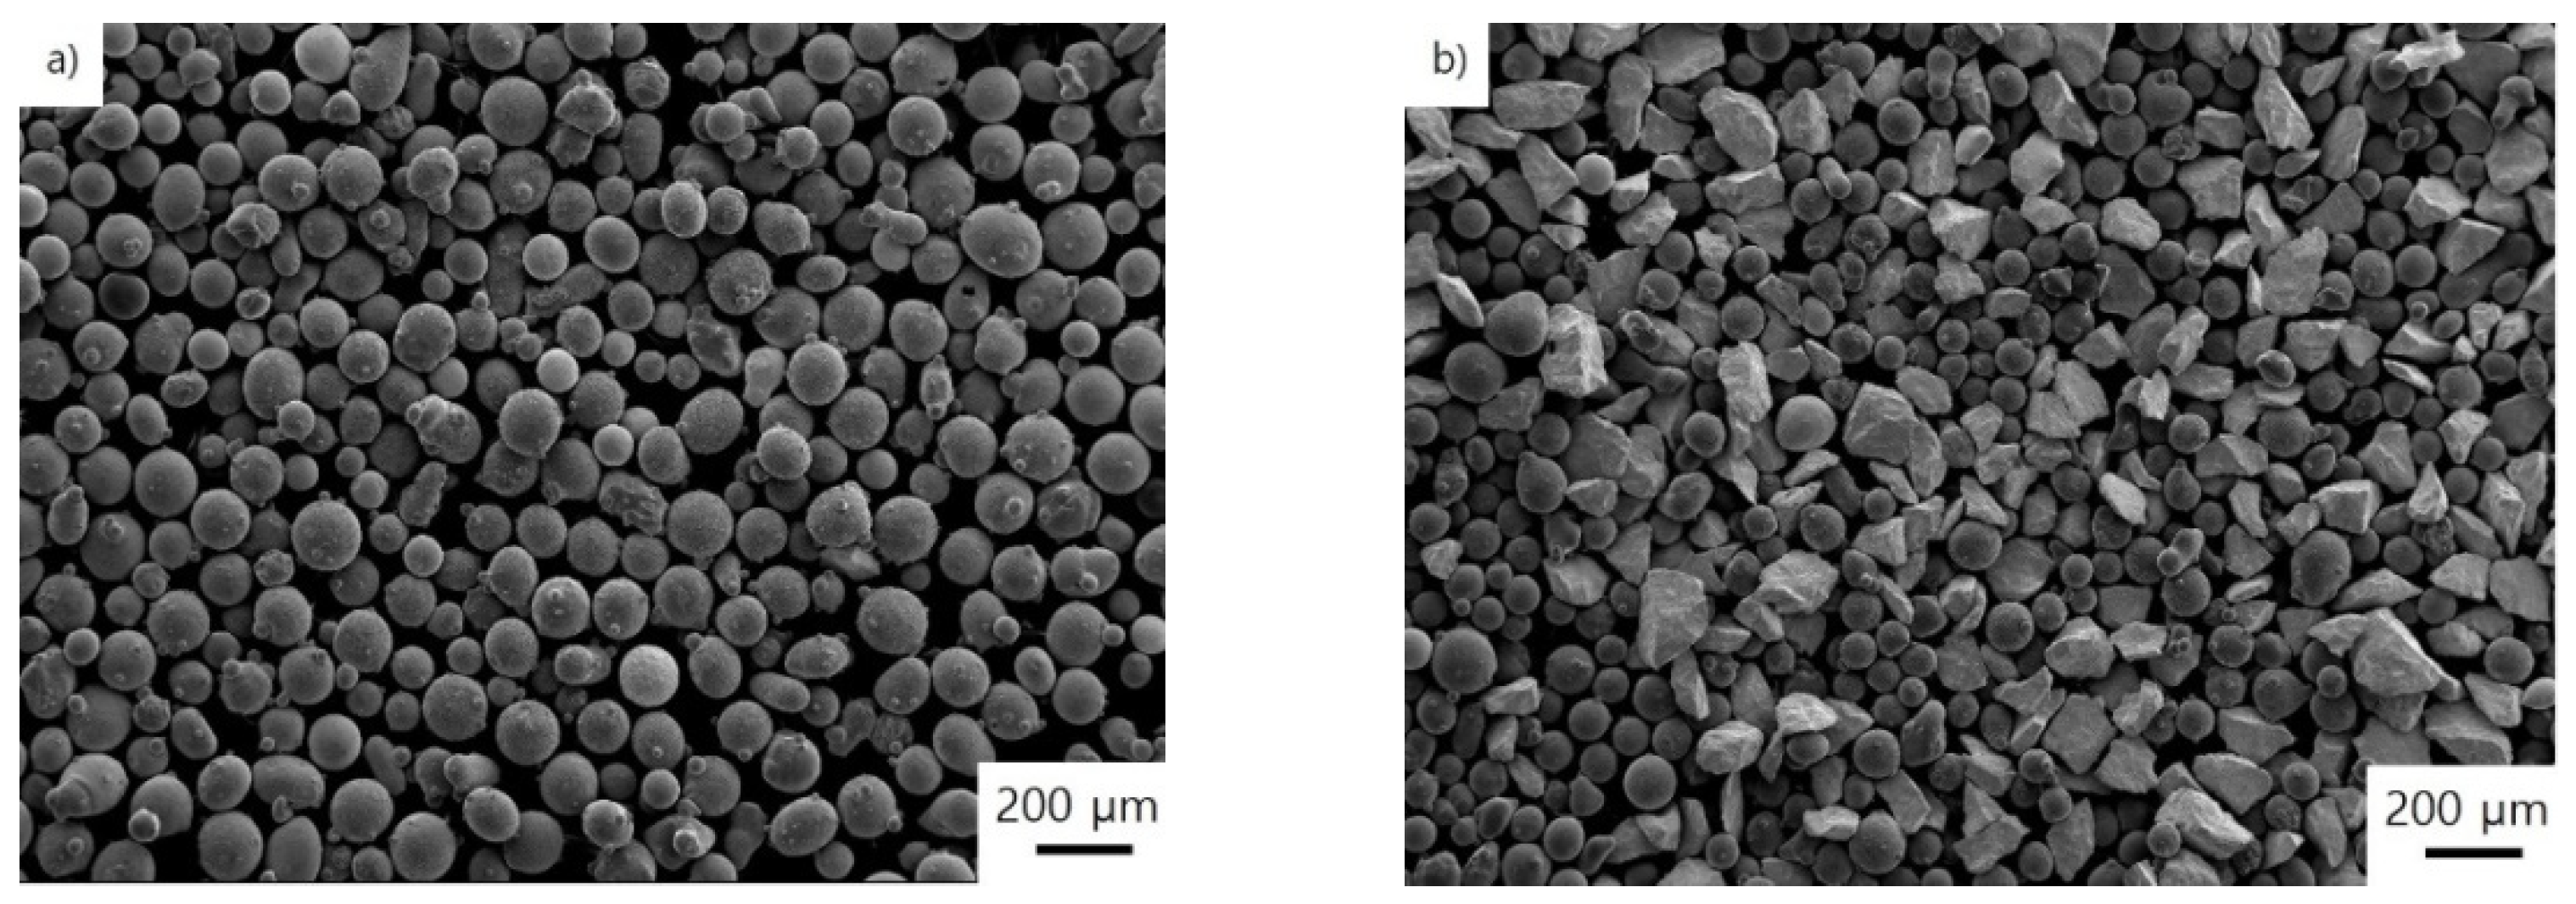
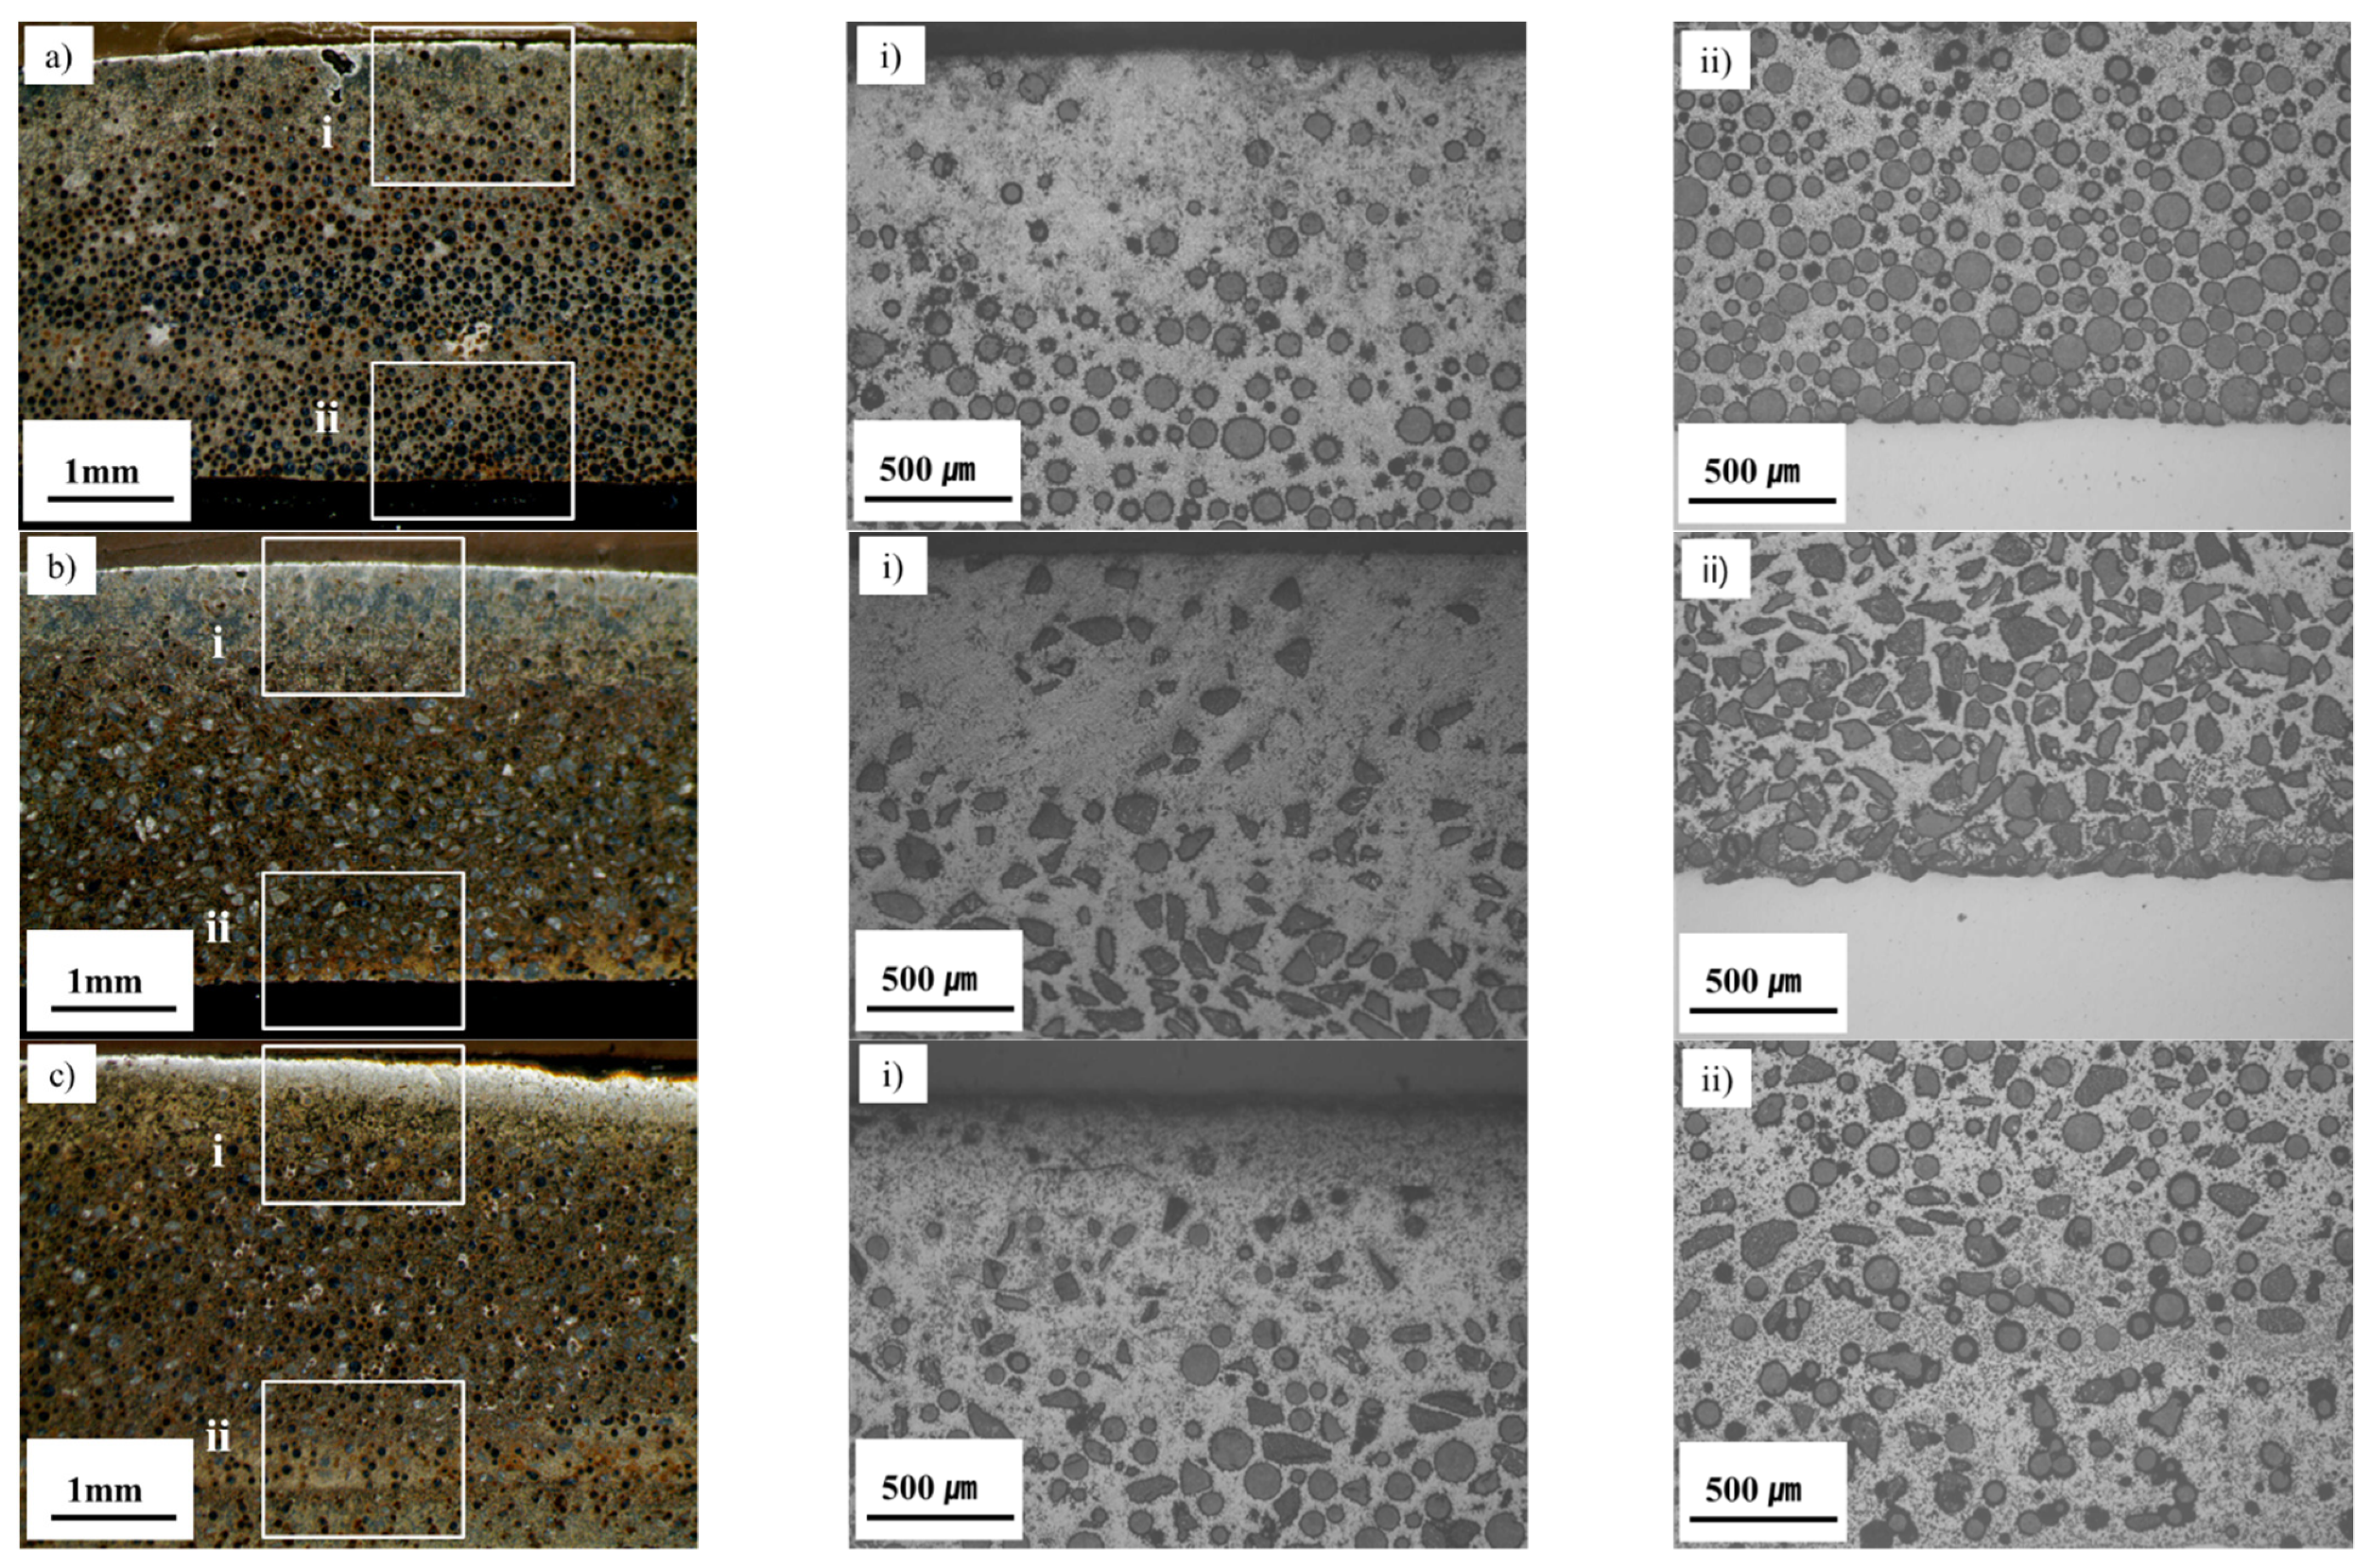
| Type | Spherical | Fused Angular | Mixed |
|---|---|---|---|
| Size of WC | 70–140 µm | 80–210 µm | 70–210 µm |
| V | Cr | C | Mn | Si | Fe | Total |
|---|---|---|---|---|---|---|
| 12.0 | 6.0 | 3.5 | 1.0 | 1.0 | 76.5 | 100.0 |
| Morphological Type of WC | Specimen Name | Proportion of WC | Proportion of Binder Metal |
|---|---|---|---|
| Spherical | SWC40 | 40 | 60 |
| SWC45 | 45 | 55 | |
| SWC50 SWC55 SWC60 | 50 55 60 | 50 45 40 | |
| Fused | FWC40 | 40 | 60 |
| FWC45 FWC50 FWC55 FWC60 | 45 50 55 60 | 55 50 45 40 | |
| Mixed | MWC40 | 40 | 60 |
| MWC45 | 45 | 55 | |
| MWC50 | 50 | 50 | |
| MWC55 MWC60 | 55 60 | 45 40 |
| Votage | Current | Welding Speed | Weaving Speed | Powder Feed | Ar Flow |
|---|---|---|---|---|---|
| 26 V | 150 A | 30 mm/min | 8 mm/s | 100 g/min | Max. 6 bar |
| Position | C | V | Cr | Fe | W | Mn | Si |
|---|---|---|---|---|---|---|---|
| 1 | 10.44 | - | - | - | 89.56 | - | - |
| 2 | 14.44 | 0.85 | 0.89 | 14.19 | 69.19 | - | - |
| 3 | 7.85 | 1.31 | 1.73 | 80.70 | 6.94 | 1.01 | 0.47 |
| 4 | 10.21 | 0.60 | 0.58 | 88.71 | - | - | - |
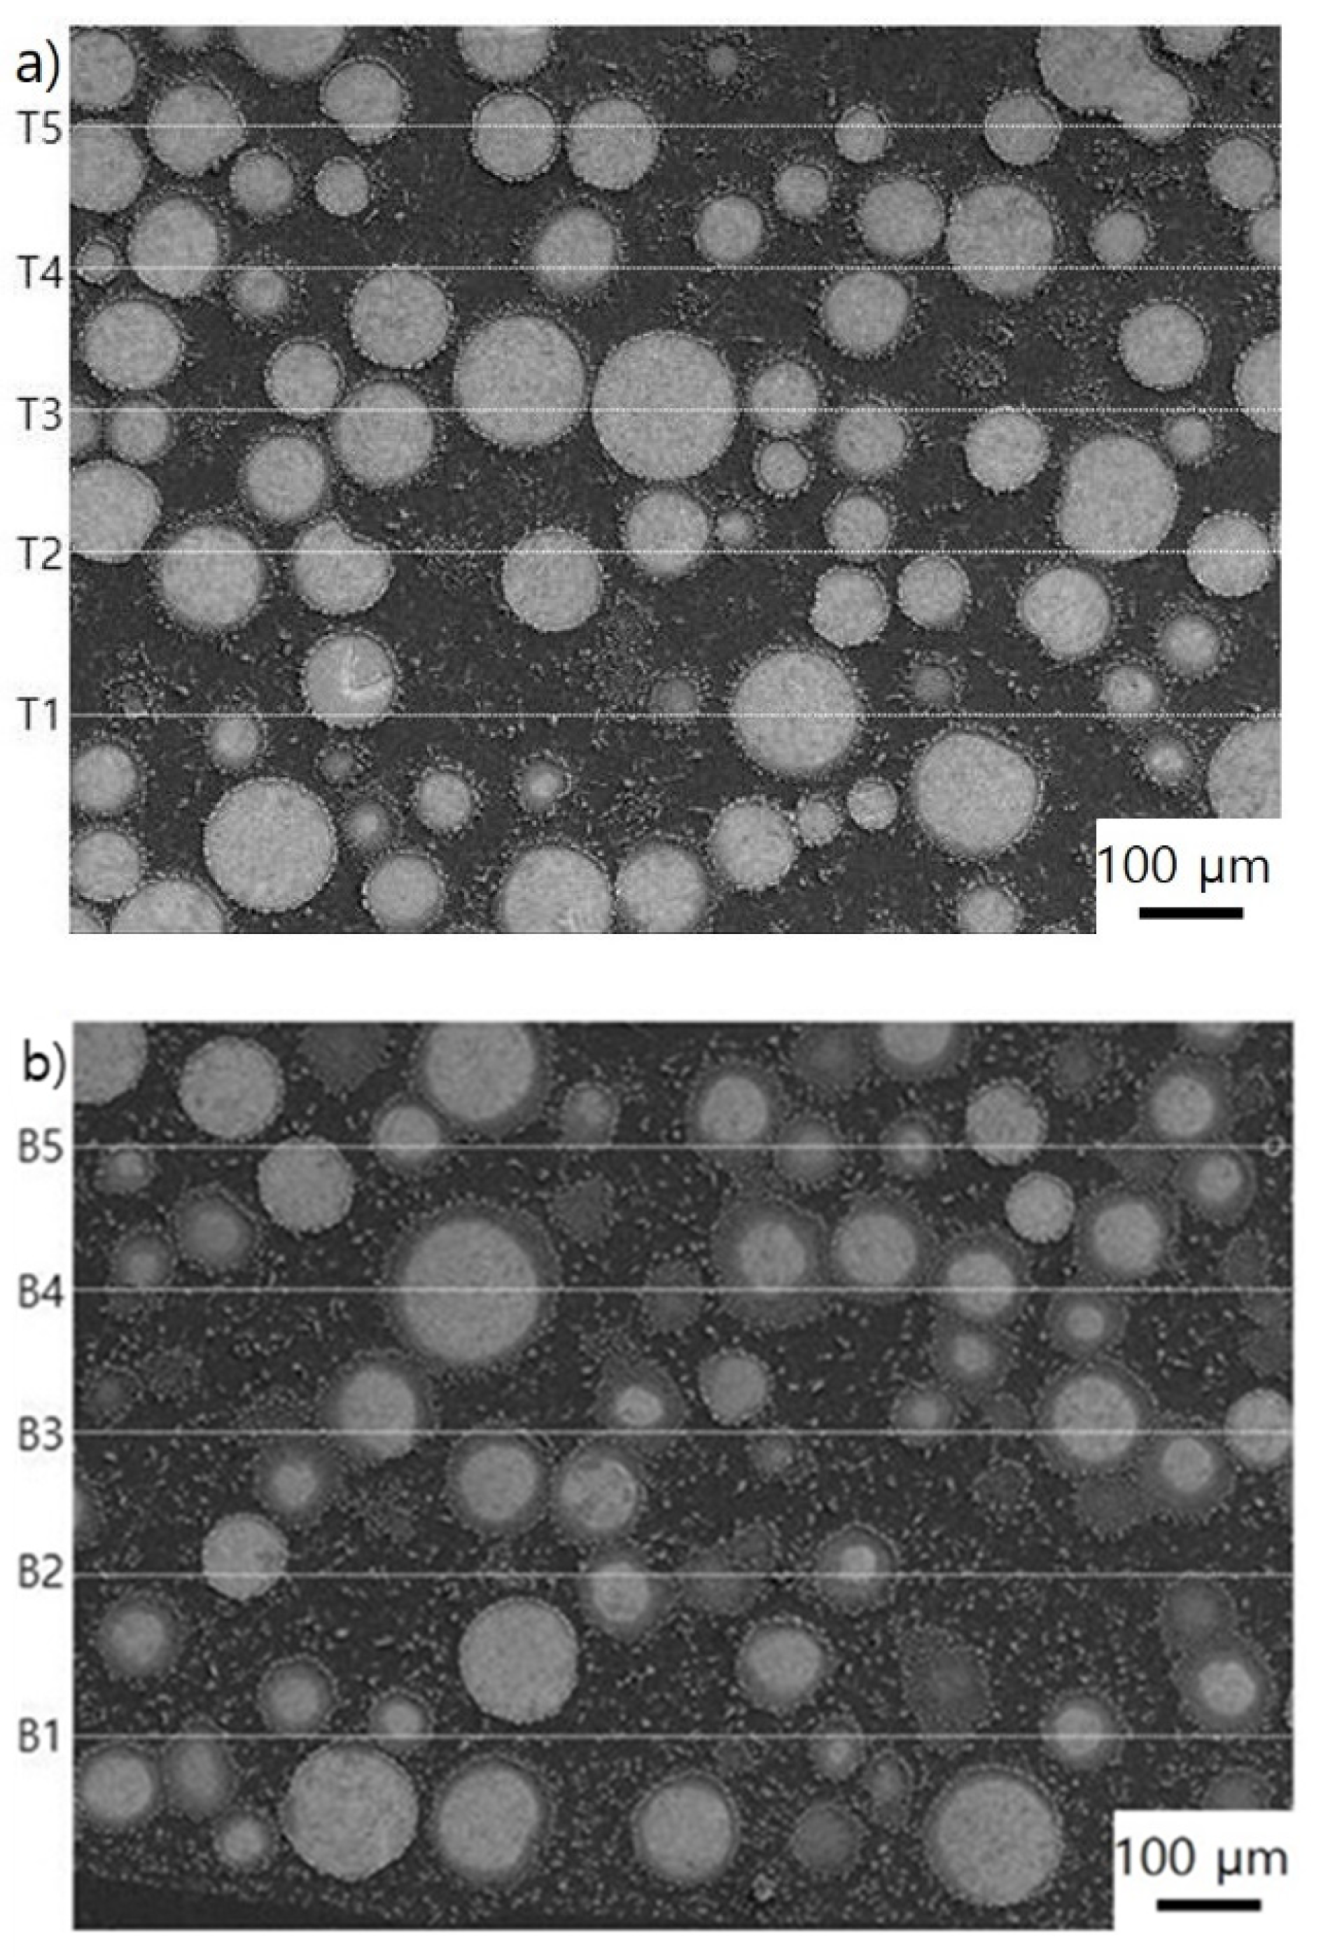
| Region | Volume Fraction in Each Region | ||
|---|---|---|---|
| WC (vol %) | Intermediate Phase (vol %) | Binder Metal (vol %) | |
| Top | 33.4 | 14.4 | 52.2 |
| Bottom | 23.3 | 30.1 | 46.6 |
Publisher’s Note: MDPI stays neutral with regard to jurisdictional claims in published maps and institutional affiliations. |
© 2021 by the authors. Licensee MDPI, Basel, Switzerland. This article is an open access article distributed under the terms and conditions of the Creative Commons Attribution (CC BY) license (https://creativecommons.org/licenses/by/4.0/).
Share and Cite
Lee, K.-j.; Kim, D. Effect of Tungsten Carbide Morphology, Quantity, and Microstructure on Wear of a Hardfacing Layer Manufactured by Plasma Transferred Arc Welding. Metals 2021, 11, 2035. https://doi.org/10.3390/met11122035
Lee K-j, Kim D. Effect of Tungsten Carbide Morphology, Quantity, and Microstructure on Wear of a Hardfacing Layer Manufactured by Plasma Transferred Arc Welding. Metals. 2021; 11(12):2035. https://doi.org/10.3390/met11122035
Chicago/Turabian StyleLee, Kwang-jin, and DaeHan Kim. 2021. "Effect of Tungsten Carbide Morphology, Quantity, and Microstructure on Wear of a Hardfacing Layer Manufactured by Plasma Transferred Arc Welding" Metals 11, no. 12: 2035. https://doi.org/10.3390/met11122035
APA StyleLee, K.-j., & Kim, D. (2021). Effect of Tungsten Carbide Morphology, Quantity, and Microstructure on Wear of a Hardfacing Layer Manufactured by Plasma Transferred Arc Welding. Metals, 11(12), 2035. https://doi.org/10.3390/met11122035