Abstract
Laser surface hardening is an attractive heat treatment solution used to selectively enhance the surface properties of components by phase transformation. A quantitative parameter to measure the efficacy of hardening processes is still lacking, which hinders its application in industries. In this paper, we propose a simple approach to assess the effectiveness of the process by calculating its thermal efficiency. The proposed method was applied to calculate the hardening efficiency during different laser processing conditions. This study revealed that only a small portion of supplied laser energy (approximately 1–15%) is utilized for hardening. For the same laser system, the highest efficiency is achieved when surface melting is just avoided. A comparative study showed that pulsed lasers are more efficient in energy utilization for hardening than continuous wave laser. Similarly, the efficiency of a high-power laser is found to be higher than a low-power laser and an increase in beam absorption produces higher hardening efficiency. The analysis of the hardened surface revealed predominantly martensite. The hardness value gradually decreased along the depth, which is attributed to the decrease in percentage of martensite.
1. Introduction
Laser surface hardening is an emerging technique used in manufacturing industries to selectively increase the surface hardness of highly stressed components such as camshafts, crankshafts, brake drums, bearings and gears by phase transformation. It produces a hardened wear-resistant outer layer without affecting desirable bulk properties such as toughness and ductility [1]. Compared to other techniques such as induction and flame hardening, the laser hardening process enjoys a short hardening time, low surface distortion, ease of automation and ability to harden any kind of steel with complex geometry.
The surface transformation hardening using lasers has attracted considerable attention in recent decades [2,3,4,5,6,7]. However, the productivity of surface hardening remains a big issue for its industrial acceptability. Despite the progress made in computational modeling and simulation [8,9], experimental trials are still required to select the processing parameters for industrial hardening applications. The main aim is to determine the right laser parameters to achieve superior surface hardness and the desired hardened depth. The availability of a suitable framework would ease the screening process and help in optimization.
In welding, a parameter called joining efficiency is widely used to quantify the effectiveness of the welding process [10]. It is defined as the ratio of the product of welding velocity and plate thickness to the incident power used for welding. The parameter gives a simple measure to quantify the energy spent in melting the interface to be joined. It can also be used to compare the effectiveness of different welding processes such as arc welding, plasma welding and laser welding. Similarly, thermal efficiency has been proposed for laser cutting processes to account for the material removal capability, dimensional accuracy and quality of the cut [11]. However, a quantitative parameter to determine the effectiveness of the hardening process is still missing. In this regard, it seems essential to develop a method that can calculate the hardening efficiency of the process to be deemed viable for industrial applications.
In this paper, a simple approach to assess the effectiveness of laser transformation hardening by calculating its efficiency was proposed. The method was applied to calculate the hardening efficiency of a fiber laser during processing of 50CrMo4 steel. In relation to the effectiveness of hardening, the microstructures and hardness distribution after hardening were also investigated.
2. Laser Hardening Efficiency
The efficiency of a system defines its ability to do things successfully and without waste. In other words, it measures the extent to which the input is utilized for an intended task. Thus, the efficiency parameter for hardening should define the capability of the process to produce a hardened surface (output) with respect to the laser energy supplied (input).
When a high energy laser beam irradiates a material, only a part of the incident energy is absorbed by the material, as illustrated in Figure 1. The absorbed energy is used to heat up the material. The heating from the laser energy increases the temperature of the surface and the surrounding region. It is more prominent near the surface than inside it. When the beam source moves away, the heated region rapidly cools and transforms to martensite producing hardened surface layer.
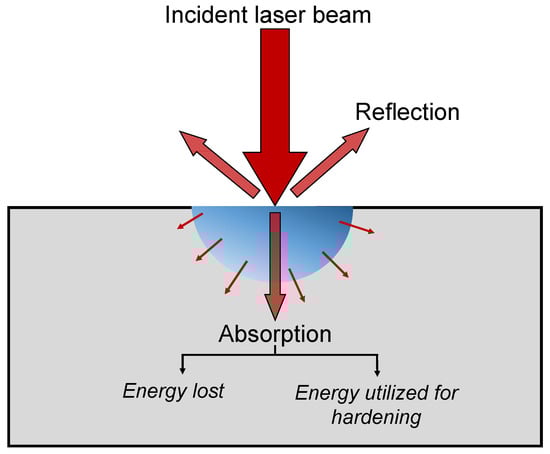
Figure 1.
Schematic diagram showing laser energy transfer during laser surface hardening.
It is worth pointing out that not all of the region affected by the laser heating transforms into martensite. Only the area near the surface where the austenitization temperature is reached or exceeded transforms into hard martensite. The martensitic transformation also depends on the rate of cooling. The cooling rate can be calculated using Rosenthal’s equation for a moving point heat source [10,12] which is given by
where is the thermal conductivity, is the scanning velocity, is the absorptivity (taken as 0.36 for a typical steel surface), is the laser power and is the ambient temperature. Based on Equation (1), the value is calculated to be in excess of 106 K/s near the surface while it dropped to approximately 104 K/s at the depth of 300 μm—both of which are higher than the critical cooling rate required. Therefore, the cooling is generally sufficient to induce martensitic transformation during laser processing without the aid of any quenching medium [13].
Since the cooling rate is generally fast enough for martensitic transformation, the volume of the hardened region is the main factor to determine the effectiveness of laser hardening. Therefore, the actual energy utilized for hardening is the energy required to harden this region. The hardening efficiency can then be calculated as the ratio of energy required to harden the substrate material to laser energy input for the hardening process. The rate of energy input during laser hardening can be calculated as
where q is the laser power applied.
The energy utilized for hardening consists of two parts—first, the energy required to raise the temperature above austenitization temperature and second, the latent energy required for phase transformation. Assuming the soaking time is sufficient for carbon homogenization to obtain martensitic structure on cooling, the minimum rate of energy (i.e., power) utilized for phase transformation hardening can be calculated using the following equation:
where is the density of the material, is the specific heat of the material, is the volume of hardened zone and is the specific latent heat of the phase transformation, the value for which was obtained from [14]. and represent the room temperature and the highest surface temperature, respectively.
The temperature in the laser-affected zone gradually decreases along the depth with the highest temperature at the surface. Depending on the laser parameter used, the temperature at the surface can be much higher than the austenitization temperature. Equation (3) can be simplified by assuming constant material properties and considering the temperature rise to upper austenitization temperature () as a sufficient condition for hardening. In the actual case, an additional energy is utilized to heat the region to a high temperature which should be accounted for in the total energy utilization. However, the assumption is justifiable as it greatly simplifies Equation (3) and removes the need to measure the exact temperature of the surface.
Equation (3) can now be simplified as
where is the scanning velocity and is the cross-section area given by ; represents the width and is the depth from the surface. The width and depth are measured from the cross-section metallography of the laser-affected zone after etching with 2% nital solution.
The thermal efficiency is defined as
The definition provides a simple measure of assessing the efficiency of laser hardening. It also accounts for the material properties and volume of the hardened region.
In 2018, Ameri et al. [15] proposed a different method to calculate the hardening efficiency of a fiber laser. They defined a hardening efficiency index (HEI), which is given by
where is the average increase in hardness of the material, and is the cross-sectional hardened area. This method requires the determination of hardness and the microstructural changes in the laser-hardened zone. It can be a tedious task as hardness and microstructure vary along the depth. As the thermal influence decreases away from the surface, the hardness also gradually decreases which is hard to accurately capture using Equation (6). Therefore, instead of computing the average increase in hardness, a more accurate way of measuring process efficiency could be to consider the thermal influence of the laser heating using the energy utilization concept. It omits the need to quantity the extent of fusion zone, martensite and bainite which are required as input to calculate HEI. Our proposed approach uses the temperature increase in the hardened region and material properties to quantify the effectiveness of hardening. Therefore, it should provide a better definition to quantify the effectiveness of hardening.
The definition given in Equation (5) was used to calculate the hardening efficiency of a fiber laser in the surface hardening of 50CrMo4 steel. The method was also applied to other types of lasers for the purpose of comparing their hardening efficiencies.
3. Experimental Methods
To test the efficiency of the hardening process, laser hardening was performed on 50CrMo4 bearing steel with nominal chemical composition, as shown in Table 1. Specimens were extracted from a cylindrical steel bar using electric discharge machining. The surfaces of the specimens were ground with progressively finer SiC papers (P120, P180, P320, P400, P800, P1200) producing a final surface roughness of approximately 0.376 μm ± 0.052 μm. The specimens were cleaned with alcohol and dried with an air gun before laser surface treatment.

Table 1.
Chemical composition (in wt%) of 50CrMo4 steel used.
An Ytterbium-based continuous wave fiber laser (YLR-150/1500-QCW, IPG Photonics, Oxford, MA, USA) with wavelength of 1070 nm was used for surface hardening. The laser beam approximates a Gaussian-shaped intensity distribution at the center. Single line scans of 10 mm length were made on the steel surface using a laser beam of 0.5 mm spot radius. The power used was in the range of 150 W–230 W, while the speed was varied from 10 mm/s to 75 mm/s (see Table 2). All experiments were performed in air.
Table 2.
Parameters used for laser surface hardening experiments.
After surface treatment, the cross-section microstructure of the laser-hardened layer was studied using the optical microscope (OM, Carl Zeiss AxioCAM, Oberkochen, Germany) and scanning electron microscope (SEM, 5600LV, JEOL, Tokyo, Japan). The measurements were carried out in OM and SEM images using the freely available image processing software (ImageJ 1.7.0, NIH, MD, USA). Since the laser-hardened area was in the range of a few hundred microns, nanoindentation tests were carried out in an Agilent G200 nanoindenter (Agilent Technologies, Santa Clara, CA, USA) using a Berkovich indenter to obtain a microhardness profile. A surface approach velocity of 10 nm/s and a maximum depth of 2000 nm were used to create a series of indents on the laser-treated surface. The average hardness for each point was measured using a depth range of 1000–1800 nm where the hardness values were more stable.
4. Results and Discussion
4.1. Hardening Efficiency Analysis
A typical laser hardening process is shown in Figure 2 whereby a defocused laser beam is utilized to scan over a surface to obtain the hardening effect. The hardened zone can be clearly distinguished from the base microstructure after etching with 2% nital solution. The details of structural changes are discussed in Section 4.2.
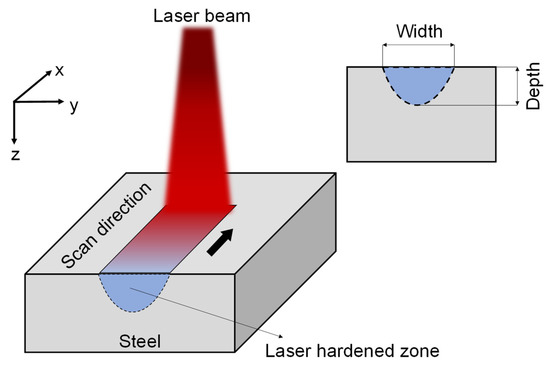
Figure 2.
A single laser-hardened track showing associated depth and width.
4.1.1. Effect of Processing Parameters
The hardening efficiency during the processing of 50CrMo4 steel with fiber laser was calculated based on the above approach and the results are shown in Figure 3. For the range of experiments, the maximum thermal efficiency was measured to be 4.95% at 18.4 J/mm2 heat input. This shows that only a small portion of the energy supplied by laser is utilized for hardening.
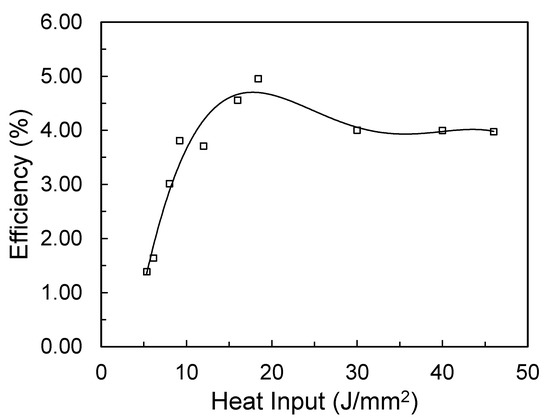
Figure 3.
Graph showing a variation of hardening efficiency with heat input.
Heat input can be varied by changing the power and speed. If the power is high and the scanning speed is slow, then a higher heat input is obtained and vice versa. The efficiency is low at low heat input which is expected as a lower heat input is insufficient to increase the temperature at the surface. With the increase in heat input, the temperature at the surface can reach the austenitization temperature required for hardening. Further increase in heat input expands the austenitized region in the steel substrate which transforms into martensite on rapid cooling. Figure 4 shows this increase in hardened depth and width with an increase in heat input. This results in a rapid increase in hardening efficiency. However, it is to be noted that the austenitized region does not keep on linearly increasing. The increment slows down at higher heat input. This is because the depth of penetration is limited by the thermal conductivity of the material. Therefore, the hardening efficiency slightly reduces after approximately 20 J/mm2. The further increase in heat input might result in surface melting.
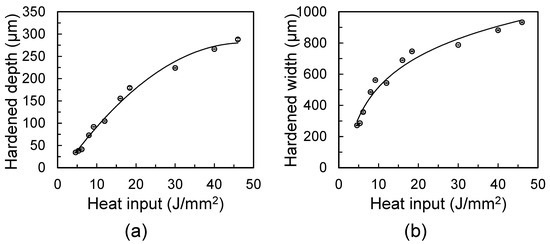
Figure 4.
Graph showing the effect of heat input on the (a) depth of hardening; and (b) width of hardening.
From the above analysis, we observed that efficiency can vary for the same laser system depending on the process parameter used. Generally, a high-power laser system with a large beam spot yields higher hardening efficiency compared to a low-power laser. This is because of the higher amount of energy available for hardening a larger area and less energy loss due to the conduction for a high-power laser. However, the melting of the surface consumes extra energy to reduce the overall hardening efficiency as seen above. Therefore, the process parameters should be chosen such that melting is avoided to achieve maximum hardening efficiency during processing.
4.1.2. Effect of Pulse Duration
A comparative study on the effect of laser pulse duration in surface hardening was conducted in our previous work [5]. The data from the study were used to calculate the hardening efficiencies of various pulsed lasers here and the results are summarized in Figure 5. From the calculation, it is obvious that femtosecond and picosecond pulsed lasers had zero hardening efficiency, as no hardening effect was observed when using such short pulsed lasers. A continuous wave laser and a millisecond laser were used to achieve a similar hardening effect by tuning the process parameters. The efficiency calculation revealed that the millisecond laser has a hardening efficiency that is almost double that of a continuous wave laser to achieve the same hardening effect. This suggests an effective utilization of laser energy for hardening of the millisecond laser, which explains why a low-power millisecond laser is sufficient to achieve a hardening effect similar to that of the high-power continuous wave laser.
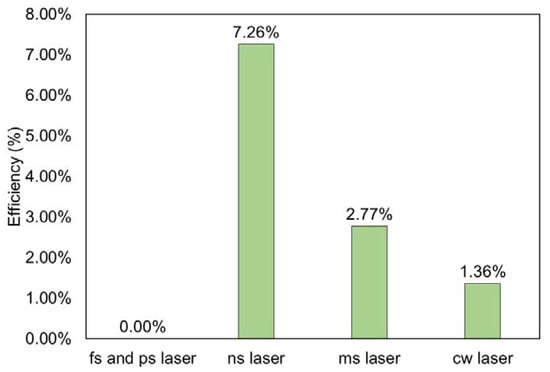
Figure 5.
Hardening efficiency comparison for different pulsed lasers used in our previous study [5].
Interestingly, the nanosecond laser yielded the highest efficiency (7.26%). This could be due to the specific laser-processing condition used for the comparative study, which coincided with a good energy utilization for hardening (as discussed in Section 4.1.1). Generally, most of the energy during nanosecond laser treatment is utilized for the ablation of the surface and surface hardening is actually a side effect. The fast processing speed (200 mm/s) used for the study must have resulted in an overall heat input which is insufficient for producing deep surface ablation but still large enough to heat up the surface and produce a hardening effect. Based on the current findings, a detailed investigation of nanosecond laser processing is recommended to understand the feasibility of hardening without creating any surface ablation.
4.1.3. Effect of Laser Wavelength
The absorption of the laser beam by a steel surface increases with the decrease in laser wavelength. Higher absorption should result in a larger amount of energy available for surface heating. Nevertheless, infrared lasers are still widely employed for surface hardening due to their low cost and easy availability. With the recent progress in laser technology, new high-power lasers with wavelength in the visible range are being developed [16,17,18]. These lasers may become gamechangers in industrial material processing.
Based on the existing literature, a comparison of the hardening efficiencies of lasers with different wavelengths is shown in Table 3. A slightly lower efficiency was calculated for the fiber laser used in our experiment compared to others. This is probably due to the low power used in our case. With the low power available, the hardened volume is small and much of the energy is lost in heating the substrate.
Table 3.
Hardening efficiency calculation of different lasers.
Despite having a long wavelength, the high-power CO2 laser had an efficiency similar to that of fiber laser. Interestingly, the use of an absorptive coating layer during CO2 laser hardening almost doubled the hardening efficiency. This is because of the increase in absorption rate, which ensures that more energy is available for surface hardening. Most importantly, the high-power blue laser recorded the highest efficiency (22.85%). This is attributed to the higher absorption of blue laser by the steel (70.4% absorption rate for blue laser compared to 25.6% for fiber laser [16]). This efficiency is more than double that of the hardening efficiency achieved with the high-power diode laser. This demonstrates that the efficiency can be improved by increasing the absorption of laser energy into the material.
The evaluation of hardening efficiency thus reveals that high-power lasers are more efficient for hardening than the low-power laser and CO2 laser. This gives an idea of how a laser can be effectively utilized for surface hardening. However, care must be taken while interpreting the efficiency values. The approach was designed to compare the relative efficacy of the surface hardening process in a simple way. Assumptions made for the calculation such as negligible heat loss through the conduction and absence of surface topography effect may not apply in all cases. The efficiency of the same laser might be different depending on the material properties and initial material conditions. On the other hand, processing parameters such as scanning speed, beam spot size and power can alter the volume of the hardened region. Therefore, there is still room for the further development of this approach to compare the efficiency of the laser-hardening process.
4.2. Microstructural Changes during Hardening
The hardening of the surface due to laser beam absorption produces a unique microstructure which is different from the base material. A typical macrograph of the cross-section zone of a laser-hardened layer is shown in Figure 6. The depth and width of the hardening were measured to be approximately 290 μm and 930 μm, respectively. As can be seen, the laser-affected area can be clearly distinguished from the base microstructure. The shape is due to the flow of heat energy across the surface perpendicular to the direction of travel of the laser beam inside the material.
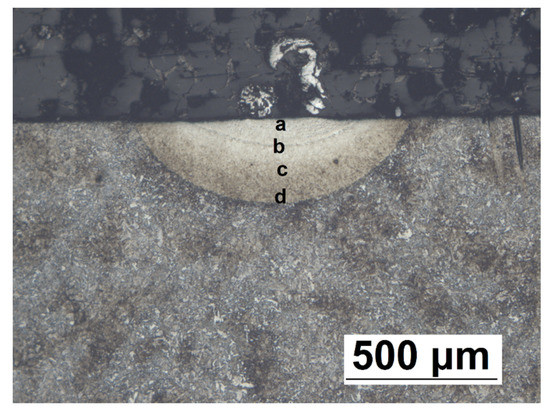
Figure 6.
Optical micrograph of the cross-section of the laser-hardened region obtained using 46 J/mm2 heat input at 10 mm defocus position. a, b, c and d represent laser melted zone (LMZ), transition line, laser transformation-hardened zone (LHZ) and heat affected zone (HAZ) respectively.
In order to investigate the microstructure of the hardened layer, SEM analysis was carried out at different zones (Figure 7). The base microstructure consisted of a ferritic-pearlitic phase, as shown in Figure 7e. This consisted of spherical and elongated carbides distributed all over the matrix. Depending on the laser parameters used, the hardened layer had different microstructures along the depth. They could be broadly categorized into a laser-melted zone (LMZ), a laser transformation-hardened zone (LHZ) and a heat-affected zone (HAZ) from the surface towards depth direction. The LMZ was observed for a heat input of 18.4 J/mm2 and higher. In the LMZ, the microstructure consisted of a fine lath martensitic structure (Figure 7a) which is similar to a typical laser weld fusion microstructure. Due to the high temperature reached during melting, the atoms in this region can be easily redistributed, which on subsequent cooling forms a fine lath martensite.
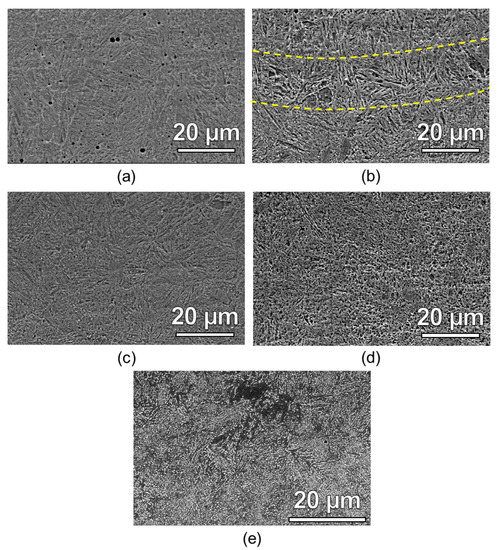
Figure 7.
SEM micrographs at different position: (a) LMZ, shown as ‘a’ in Figure 5; (b) transition zone, shown as ‘b’ in Figure 5; (c) LHZ, shown as ‘c’ in Figure 5; (d) HAZ, shown as ‘d’ in Figure 5; and (e) base microstructure. The specimen was etched with 2% nital solution for 5 s before observation under SEM.
A distinct transition zone appeared just beneath the LMZ, which appeared as a dark line approximately 15 μm thick in the OM image (indicated as ‘b’ in Figure 6). This is the boundary between LMZ and LHZ and is identified as a coarse structure of lath martensite (Figure 7b). It experienced a longer austenitization time due to the solid-to-liquid transition and thus, formed a coarser microstructure. The LHZ below the transition zone was predominantly made up of martensite with traces of bainite and spherical carbides (Figure 7c). The presence of spherical carbides indicates undissolved carbide particles during austenitizing prior to quenching because of the insufficient time for the dissolution of carbides in the structures present prior to austenitizing [21]. The microstructure gradually varied along the depth. At the lower end of the LHZ, the martensitic structure with a large number of spherical carbide particles was observed due to the decreasing effect of the thermal cycle. The HAZ also had a similar microstructure with a mixture of undissolved carbides, pearlite and tempered microstructure (Figure 7d). A distinct boundary did not exist between LHZ and HAZ.
Figure 8 shows the hardness profile along the depth of the hardened layer and across the direction parallel to the surface. The results obtained matched with the microstructure evolution discussed above. The hardness of the laser-treated area was quite high compared to that of the base material. The base material hardness was approximately 2.55 GPa which increased to approximately 8.00 GPa in the melted zone near the surface (Figure 8b). The maximum hardness value obtained was 8.36 GPa at the depth of approximately 140 μm from the surface. A slightly lower hardness near the surface can be attributed to surface decarburization [22]. A sudden drop in hardness was found in the transition zone, which had coarse lath martensite. The hardness gradually decreased down to approximately 7.00 GPa along the depth direction in the laser-affected region due to the reduced thermal effect of the laser at a larger depth. At approximately 290 μm from the surface, the hardness of the base material dropped to 2.55 GPa. Figure 8c shows the variation of hardness across the direction parallel to the surface. Two positions were considered—the first one at 40 μm and the second one at 170 μm below the surface. The first line passed through the laser-melted zone and had a slightly higher hardness value compared to the second line. The hardness along the lines was almost constant at the laser-treated region.
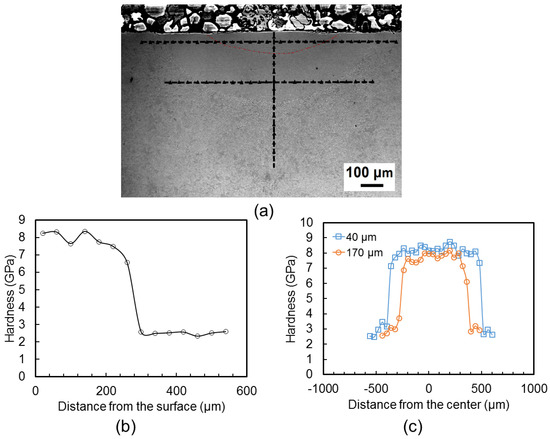
Figure 8.
Hardness profile analysis: (a) SEM image showing indents made on the specimen, the dotted red line represents the extent of surface melting; (b) graph showing the variation of hardness along with depth; and (c) the graph showing the variation of hardness across planes parallel to the surface.
From the microstructure and hardness variation results, it is clear that the heating from the laser has a decreasing effect on the structure away from the surface. However, the hardened area can be clearly distinguished from the base microstructure by simple optical microscopy, thus allowing to use the proposed method to measure the hardening efficiency.
5. Conclusions
A simple approach to calculate the thermal efficiency of laser surface hardening was proposed. The developed method was applied to evaluate the hardening efficiency during the processing of 50CrMo4 steel using a fiber laser. The hardening efficiency was calculated for other lasers as well using data from existing literature. The following conclusions were derived based on the findings:
- Hardening efficiency typically ranges from 1% to 15% for most studies, suggesting that only a small fraction of laser energy is utilized for hardening.
- The efficiency can significantly vary even for the same laser system depending on the process parameters used. Generally, a high-power laser system with a large beam spot yields higher hardening efficiency compared to a low-power laser.
- Maximum hardening efficiency is achieved when surface melting is just avoided. The maximum value is calculated to be 4.95% for the fiber laser used.
- For a similar hardening effect, the ms laser is almost twice as efficient than the cw laser.
- The hardening efficiency of the blue laser (445 nm wavelength) is more than two times that of a diode laser (1.06 μm wavelength). This is primarily due to the higher beam absorption by the steel for shorter wavelengths, which makes a large amount of laser energy available for hardening compared to longer wavelengths.
- Surface hardening generates a gradient microstructure in the laser-hardened region with a predominantly martensitic microstructure. This is due to the rapid quenching process and the decrease in thermal cycling over the depth. A maximum hardness of approximately 8.36 GPa was obtained in the hardened region which was approximately three times higher than in the base material.
Author Contributions
N.M.: conceptualization, methodology, formal analysis, investigation, data curation, writing—original draft, writing—review and editing, visualization; N.W.: validation, investigation; W.Z.: conceptualization, supervision, formal analysis, funding acquisition, writing—review and editing. All authors have read and agreed to the published version of the manuscript.
Funding
This research was funded by LUX Photonics Consortium and Precision Laser Solutions Pte. Ltd. through grants #020408-00002 and #020408-00003.
Institutional Review Board Statement
Not applicable.
Informed Consent Statement
Not applicable.
Data Availability Statement
Available upon request.
Acknowledgments
The authors would like to thank the School of Mechanical and Aerospace Engineering, Nanyang Technological University, for their research support.
Conflicts of Interest
The authors declare no conflict of interest.
References
- Basu, A.; Chakraborty, J.; Shariff, S.M.; Padmanabham, G.; Joshi, S.V.; Sundararajan, G.; Dutta Majumdar, J.; Manna, I. Laser surface hardening of austempered (bainitic) ball bearing steel. Scr. Mater. 2007, 56, 887–890. [Google Scholar] [CrossRef]
- Li, W.-B.; Easterling, K.E. Residual stresses in laser transformation hardened steel. Surf. Eng. 1986, 2, 43–48. [Google Scholar] [CrossRef]
- Patwa, R.; Shin, Y.C. Predictive modeling of laser hardening of AISI5150H steels. Int. J. Mach. Tools Manuf. 2007, 47, 307–320. [Google Scholar] [CrossRef]
- Moradi, M.; Fallah, M.M.; Jamshidi Nasab, S. Experimental Study of Surface Hardening of AISI 420 Martensitic Stainless Steel Using High Power Diode Laser. Trans. Indian Inst. Met. 2018, 71, 2043–2050. [Google Scholar] [CrossRef]
- Maharjan, N.; Zhou, W.; Zhou, Y.; Guan, Y.; Wu, N. Comparative study of laser surface hardening of 50CrMo4 steel using continuous-wave laser and pulsed lasers with ms, ns, ps and fs pulse duration. Surf. Coat. Technol. 2019, 366, 311–320. [Google Scholar] [CrossRef]
- Maharjan, N.; Zhou, W.; Wu, N. Direct laser hardening of AISI 1020 steel under controlled gas atmosphere. Surf. Coat. Technol. 2020, 385, 125399. [Google Scholar] [CrossRef]
- Frerichs, F.; Lu, Y.; Lübben, T.; Radel, T. Process signature for laser hardening. Metals 2021, 11, 465. [Google Scholar] [CrossRef]
- Reti, T.; Bagyinszki, G.; Felde, I.; Verö, B.; Bell, T. Prediction of as-quenched hardness after rapid austenitization and cooling of surface hardened steels. Comput. Mater. Sci. 1999, 15, 101–112. [Google Scholar] [CrossRef]
- Lakhkar, R.S.; Shin, Y.C.; Krane, M.J.M. Predictive modeling of multi-track laser hardening of AISI 4140 steel. Mater. Sci. Eng. A 2008, 480, 209–217. [Google Scholar] [CrossRef]
- Steen, W.M. Laser Material Processing, 3rd. ed.; Springer: Berlin/Heidelberg, Germany, 2003; ISBN 1852336986. [Google Scholar]
- Yilbas, B.S. Laser cutting quality assessment and thermal efficiency analysis. J. Mater. Process. Technol. 2004, 155, 2106–2115. [Google Scholar] [CrossRef]
- Rosenthal, D. The Theory of Moving Source of Heat and its Application to Metal Transfer. ASME Trans. 1946, 43, 849–866. [Google Scholar]
- Katsamas, A.I. A computational study of austenite formation kinetics in rapidly heated steels. Surf. Coat. Technol. 2007, 201, 6414–6422. [Google Scholar] [CrossRef]
- Tajima, M.; Umeyama, Y. Latent heats of phase transformations in iron and steels. High Temp. High Press. 2002, 34, 91–97. [Google Scholar] [CrossRef]
- Ameri, M.H.; Ghaini, F.M.; Torkamany, M.J. Investigation into the efficiency of a fiber laser in surface hardening of ICD-5 tool steel. Opt. Laser Technol. 2018, 107, 150–157. [Google Scholar] [CrossRef]
- Wang, H.; Kawahito, Y.; Yoshida, R.; Nakashima, Y.; Shiokawa, K. Development of a high-power blue laser (445 nm) for material processing. Opt. Lett. 2017, 42, 2251–2254. [Google Scholar] [CrossRef] [PubMed]
- Baumann, M.; Balck, A.; Malchus, J.; Chacko, R.V.; Marfels, S.; Witte, U.; Dinakaran, D.; Ocylok, S.; Weinbach, M.; Bachert, C.; et al. 1000 W blue fiber-coupled diode-laser emitting at 450 nm. In Proceedings of the SPIE 10900, High-Power Diode Laser Technology XVII, 1090005, San Francisco, CA, USA, 3–5 February 2019. [Google Scholar]
- Chi, H.; Wang, Y.; Davenport, A.; Menoni, C.S.; Rocca, J.J. Demonstration of a kilowatt average Power, 1 Joule, green Laser. Opt. Lett. 2021, 45, 6803–6806. [Google Scholar] [CrossRef]
- Li, R.; Jin, Y.; Li, Z.; Qi, K. A comparative study of high-power diode laser and CO2 laser surface hardening of AISI 1045 steel. J. Mater. Eng. Perform. 2014, 23, 3085–3091. [Google Scholar] [CrossRef]
- Selvan, J.S.; Subramanian, K.; Nath, A.K. Effect of laser surface hardening on En18 (AISI 5135) steel. J. Mater. Process. Technol. 1999, 91, 29–36. [Google Scholar] [CrossRef]
- Krauss, G. Martensite in steel: Strength and structure. Mater. Sci. Eng. A 1999, 273, 40–57. [Google Scholar] [CrossRef]
- Maharjan, N.; Zhou, W.; Zhou, Y.; Wu, N. Decarburization during laser surface processing of steel. Appl. Phys. A 2018, 124, 682. [Google Scholar] [CrossRef]
Publisher’s Note: MDPI stays neutral with regard to jurisdictional claims in published maps and institutional affiliations. |
© 2021 by the authors. Licensee MDPI, Basel, Switzerland. This article is an open access article distributed under the terms and conditions of the Creative Commons Attribution (CC BY) license (https://creativecommons.org/licenses/by/4.0/).