Article

Adaptation of the Rist Operating Diagram as a Graphical Tool for the Direct Reduction Shaft

1
Institut Jean Lamour, Campus Artem, UMR 7198 Université de Lorraine/CNRS, 2 Allée André Guinier-BP 50840, LabEx DAMAS, CEDEX, 54011 Nancy, France
2
ArcelorMittal R&D Maizières Process, Voie Romaine, 57280 Maizières-lès-Metz, France
3
ArcelorMittal Produits Longs Canada, 4000, Route des Aciéries, Contrecoeur, QC J0L 1C0, Canada
*
Author to whom correspondence should be addressed.
formerly ArcelorMittal R&D Maizières Process.
Metals 2021, 11(12), 1953; https://doi.org/10.3390/met11121953
Submission received: 15 October 2021 / Revised: 29 November 2021 / Accepted: 2 December 2021 / Published: 4 December 2021

Abstract

:
The blast-furnace operating diagram proposed by Rist was revised to direct reduction and was specifically applied to the Midrex NGTM process. The use of this graphical tool in the study of an industrial process highlighted the staggered nature of the reduction in the shaft furnace with, in particular, the existence of a prereduction zone in the upper part where metallization is thermodynamically impossible. A sensitivity study also showed the impact of the in situ reforming rate on the ability of the gas to completely reduce iron oxides. Finally, we graphically defined the minimum quality required for the top gas to produce direct-reduced iron.

1. Introduction

The production of direct-deduced Iron (DRI) is the main alternative route to blast furnace ironmaking. Over the last decade, this route has become increasingly popular and counts from 1.5% in the 1980s to more than 6% of the overall reduced-iron production nowadays [1,2]. The most widespread direct-reduction (DR) technology is the vertical shaft reactor fabricating reducing gas from natural gas (i.e., Midrex NGTM and HYL processes). ArcelorMittal operates an installed capacity of 13 Mt/year including nine Midrex NGTM modules and four HYL reactors.
Experimental and mathematical modeling of DR processes is important in terms of energy efficiency and productivity. Therefore, the development and application of tools to study the chemical reactions along the reduction shaft are necessary for the understanding and optimization of the process [3,4,5].
In this respect, it is interesting to draw a parallel with the blast furnace, an older process on which technical and scientific investigations are not comparable to the direct reduction processes. Numerous studies during the 1960s led to a more complete understanding of the blast furnace and a profound change in its operating point.
As such, Rist and Meyson have developed in the early 1960s a graphical tool to describe the operating point of the blast furnace [6,7,8,9]. The graphical approach also existed more widely in chemical engineering to describe the operating conditions of many industrial processes. The graphical tool they have developed allows to describe more specifically the ideal operating point of the blast furnace. It takes into account the thermal equilibria and some critical chemical equilibria, which limit the heat and material exchanges, respectively, in this process.
This graphical tool is based on the work of Kitaiev and Michard and, in particular, on the mathematical modeling of the blast furnace proposed by Michard [7]. The blast furnace is considered as a counter-current gas–solids reactor, and it behaves as an oxygen exchanger in the iron oxide reduction reaction.
The graphical representation of the blast furnace was particularly relevant from an educational point of view. Moreover, through the evaluation of material and heat balances within the blast furnace, the diagram has been used for years both to describe the operating point of a blast furnace and to establish prospective operating points for optimization [7,10,11,12,13].
The more-recently developed Midrex NGTM and Tenova HYL processes have strong similarities with the blast furnace. The reduction shaft furnace can also be thought of as an oxygen exchanger in a counter-current gas–solids reactor configuration.
Rist proposed in 1992 an original graphic description of the Midrex NGTM process [14], combining a diagram for the reformer with that of the shaft furnace. Nevertheless, it is an idealized and simplified description, with an educational vocation, which cannot be directly exploited to describe the real operations. For example, natural-gas injections downstream of the reformer are not taken into account for a fair description of the gas mass balance in the reduction zone. Moreover, in situ methane cracking or carburization of iron bearing materials are not taken into account.
It may therefore be interesting to adapt the original diagram proposed by Rist and Meysson for the blast furnace to this process, in order to identify the industrial operating point and study the prospects of such a graphical tool.
The adaptation of the Rist diagram to the Midrex NGTM process, and to direct reduction processes in general, requires overcoming two difficulties:
  • The gas composition is more complex than in the blast furnace. Particular attention will be paid to considering the hydrocarbons, including methane.
  • The carburization phenomena in DRI will impact the operating line of the diagram.
This article reviews the formalism of the Rist approach in order to provide a comprehensive description of the Midrex NGTM reduction shaft, compatible with the Rist diagram and applicable to direct-reduction processes. The approach developed on a Midrex NGTM flowsheet is easily transferable to the HYL III process.

2. Modeling

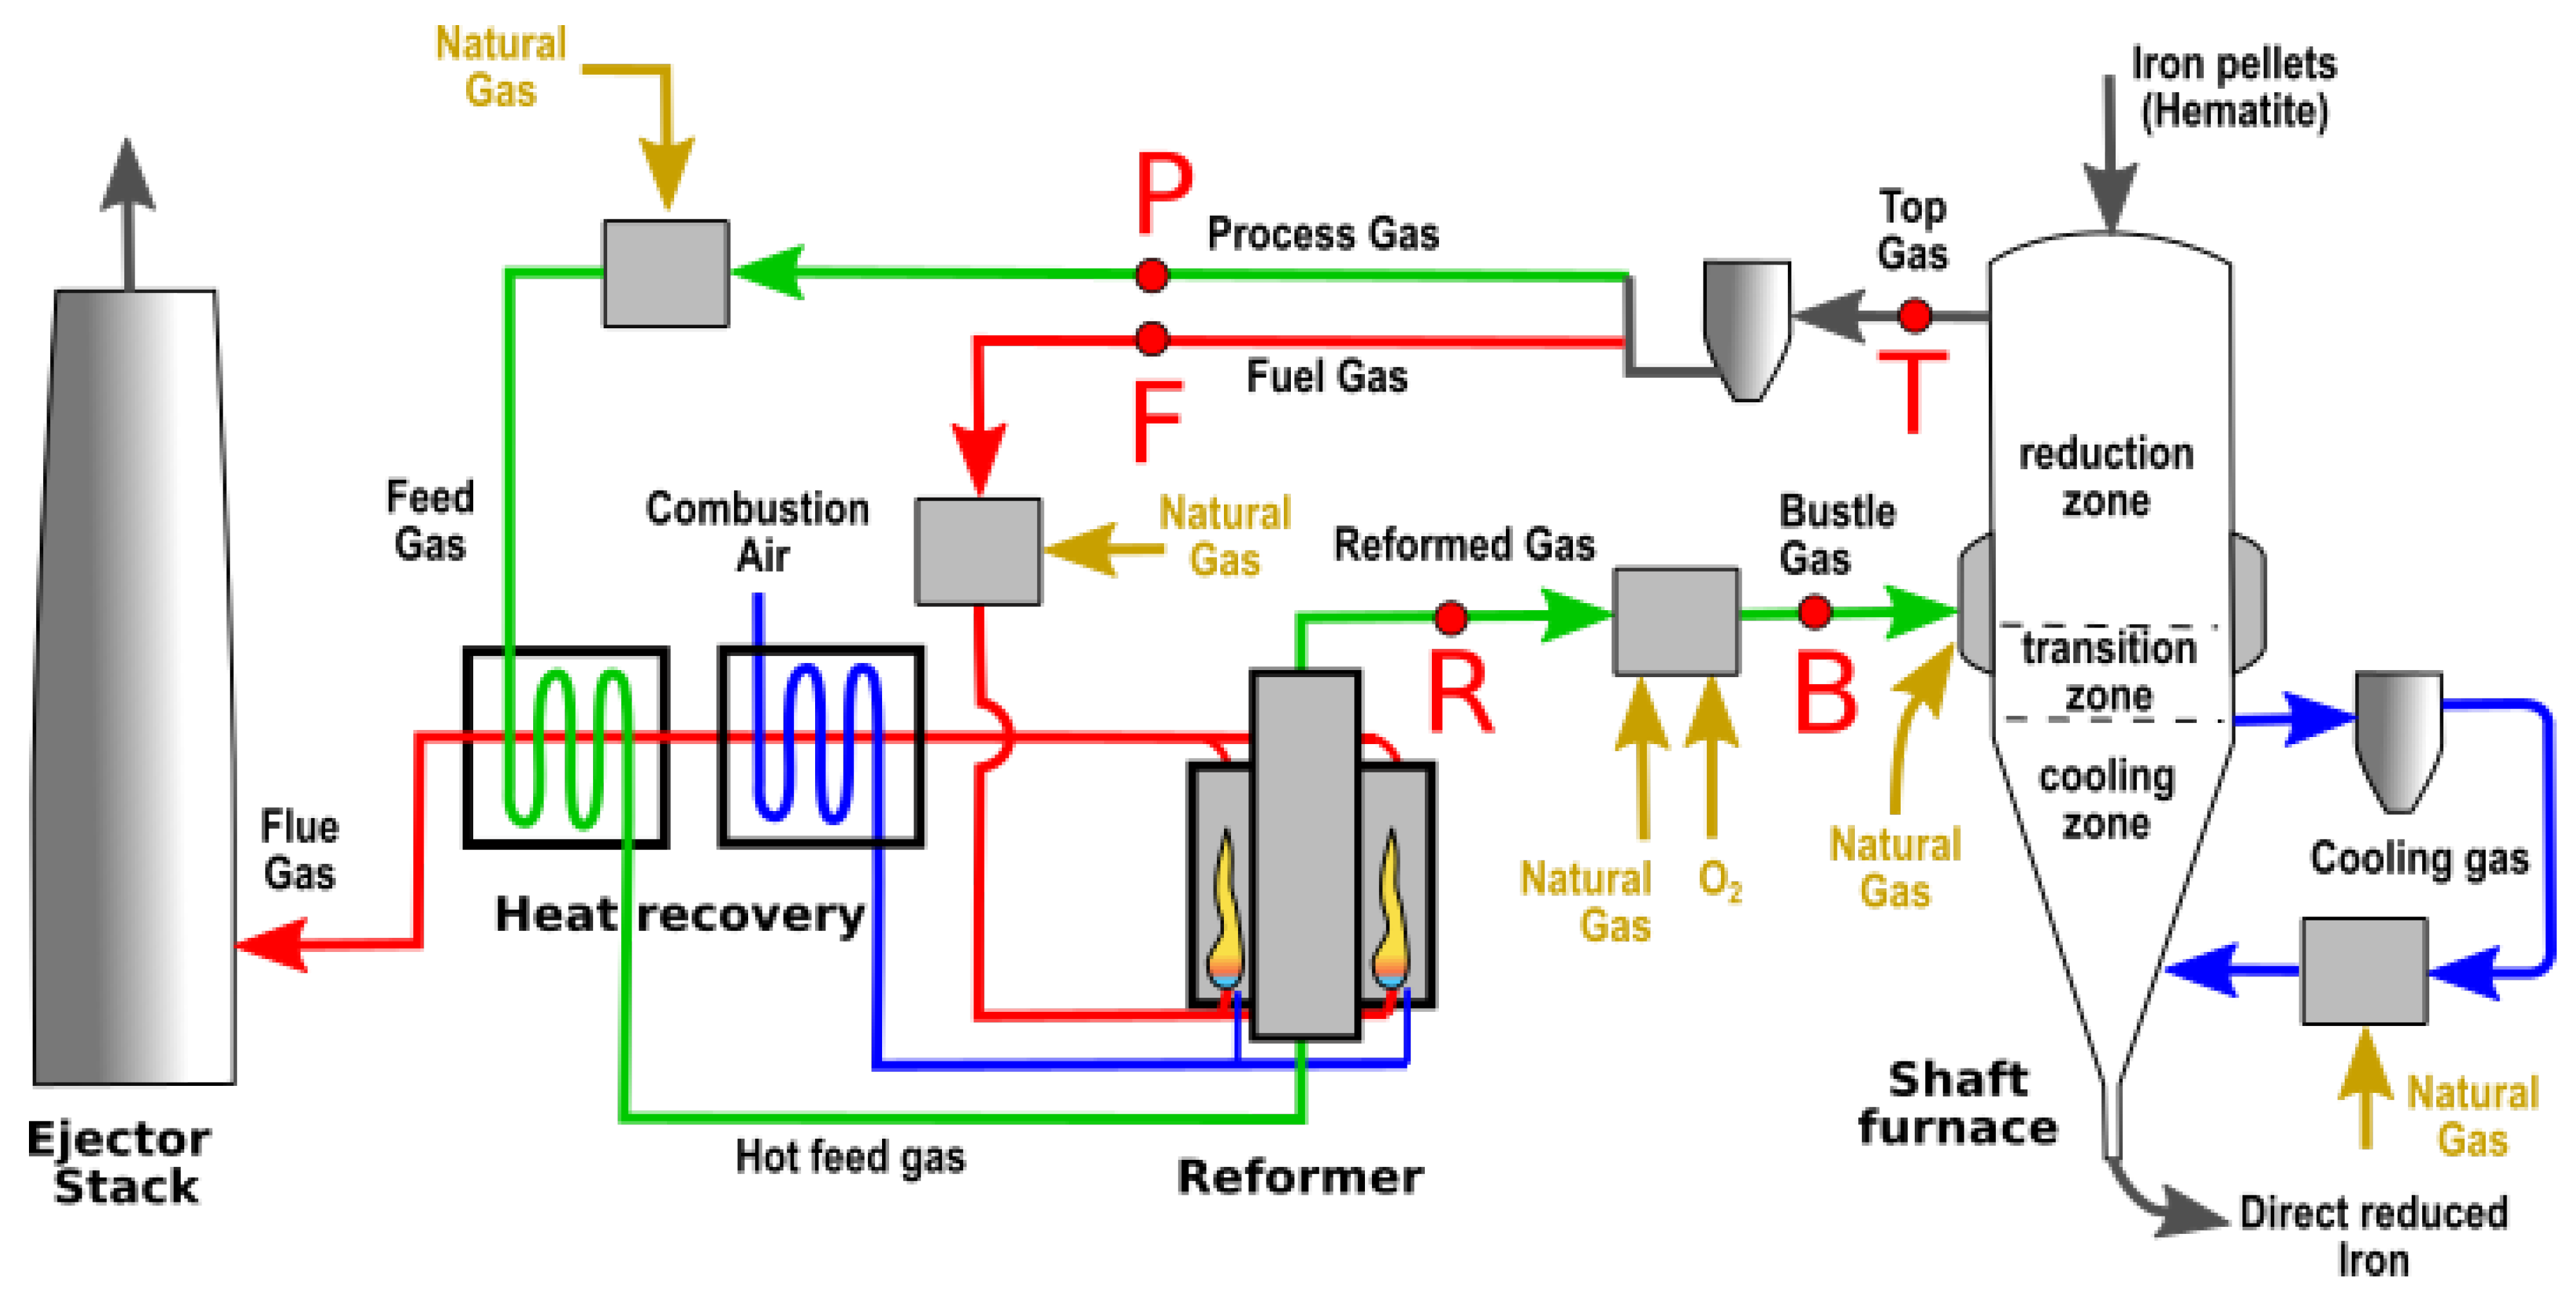
2.1. Description of the Midrex Process

The Midrex NGTM process is one of the most-spread technologies in the steel industry for the production of direct-reduced iron (DRI). The main differences with the conventional reduction route (blast furnace) are the use of natural gas as a reducing agent and as a heat source, allowing an almost complete reduction of iron oxides at a lower temperature (below 1000 °C) without any melting phenomenon. The process itself is based on the coupling of three main components, a heat recovery device, a reformer, and a shaft furnace, for an optimized use of the natural-gas consumption for the production of DRI. Figure 1 shows the operating principle of the Midrex NGTM process.
Moreover, the compositions of the inlet and outlet gases measured in the Midrex shaft at the Gilmore plant [3] are presented as an illustration in Table 1. The reducing gas corresponds to the mixing of the bustle gas (B) with the natural gas injected into the transition zone.
The operating point of the process is summarized in the following overview:
  • The shaft furnace is a vertical gas–solid countercurrent reactor with a downward flow of iron oxides and an upward flow of a hot reducing gas. The iron pellets, consisting mainly of hematite (%Fe2O3 > 95%), are then both reduced and carburized. The direct-reduced iron (DRI) leaving the shaft achieves a high rate of metallization (92–96% iron metal, with residual iron oxides being Wustite) and a moderate level of carburization (2–2.5% carbon in the total mass).
  • The preparation of the reducing gas follows several steps. First, a fraction of the recycled top gas, named the process gas (P), is mixed with injected natural gas. The corresponding mixture, called the feed gas, is preheated in the recovery heat device and then injected into the reformer. Cracking occurs between CH4, CO2, and H2O in the tubes of the reformer. The resulting reformed gas (R) is mainly composed of CO, CO2, H2, and H2O, with a low rate of remaining CH4 (few %).
  • The reformed gas (R) is mixed with additional natural gas and pure oxygen and injected in the shaft furnace at a temperature around 950 °C. Additional natural gas is also injected in the shaft, in the bottom area, inside the loop of the cooling gas and in the transition zone with the bustle gas.

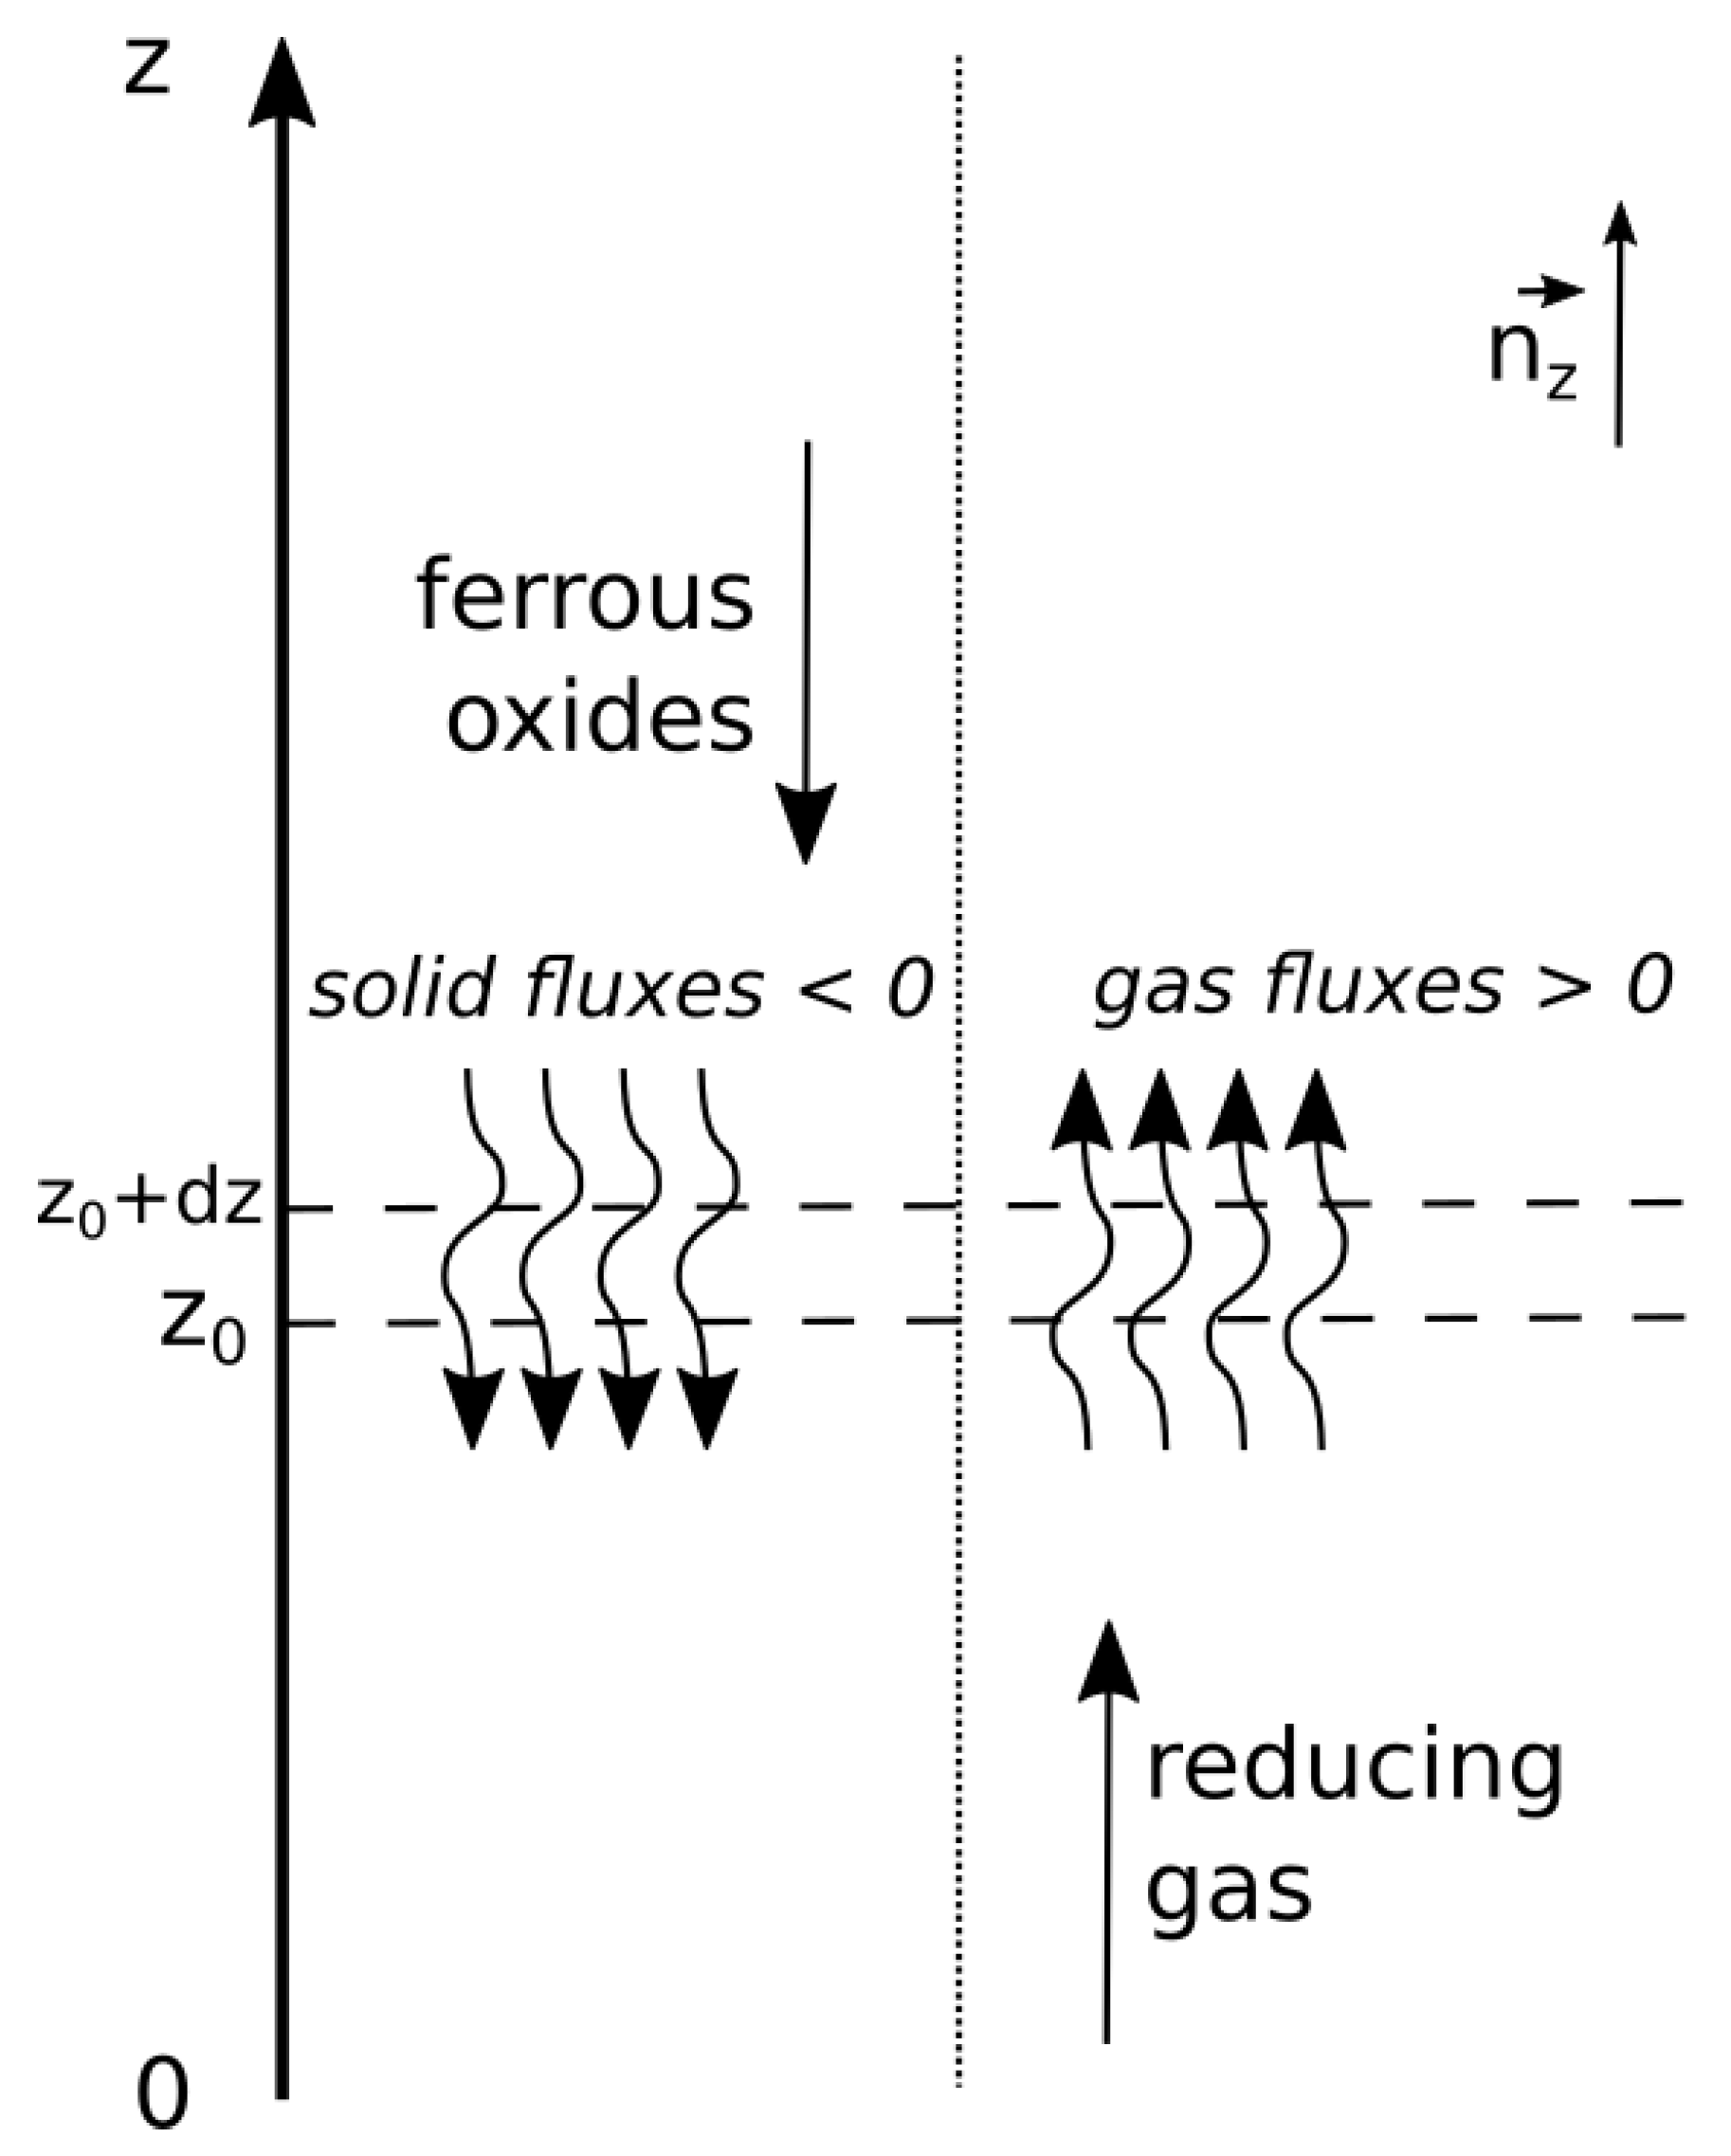
2.2. Description of the Local Mass Balance in the Shaft Furnace

In the frame of a counter-current gas–solid reaction, for steady-state conditions without any diffusion phenomena, the local balance law can be written in the following way:
c i t = · ϕ i g a s + · ϕ i s = 0
where c i is the local molar concentration of atom i. ϕ i g a s and ϕ i s are the local gaseous and solid molar fluxes in the shaft furnace, respectively. It can be applied to calculate any mass balance of O, H, C, and Fe.
We adopt the following formalism to describe the counter-current gas–solid reduction, as shown in Figure 2.
Each local mass balance equation is simplified according to this formalism:
· ϕ i g a s = d ϕ i g a s d z , · ϕ i s = d ϕ i s d z
Finally, Equations (1) and (2) lead to:
d ϕ i g a s d z = d ϕ i s d z
The molar gaseous flux of the atom i is calculated with the following relation:
ϕ i g a s = Q v g a s V m × m o l e c u l e j a j · n i j
where Q v g a s is the volumetric gas flow rate, V m the molar volume of the gas, a j the volumetric fraction of the molecule j in the gas, and n i j the number of atoms i in the molecule j.
ϕ i s , the solid molar flux of the atom i, provided by the iron bearing material, is obtained using Equation (5), according to the mass flow rate Q m s of the burden, the mass fraction w i s , and the molar mass M i .
ϕ i s = Q m s × w i s M i

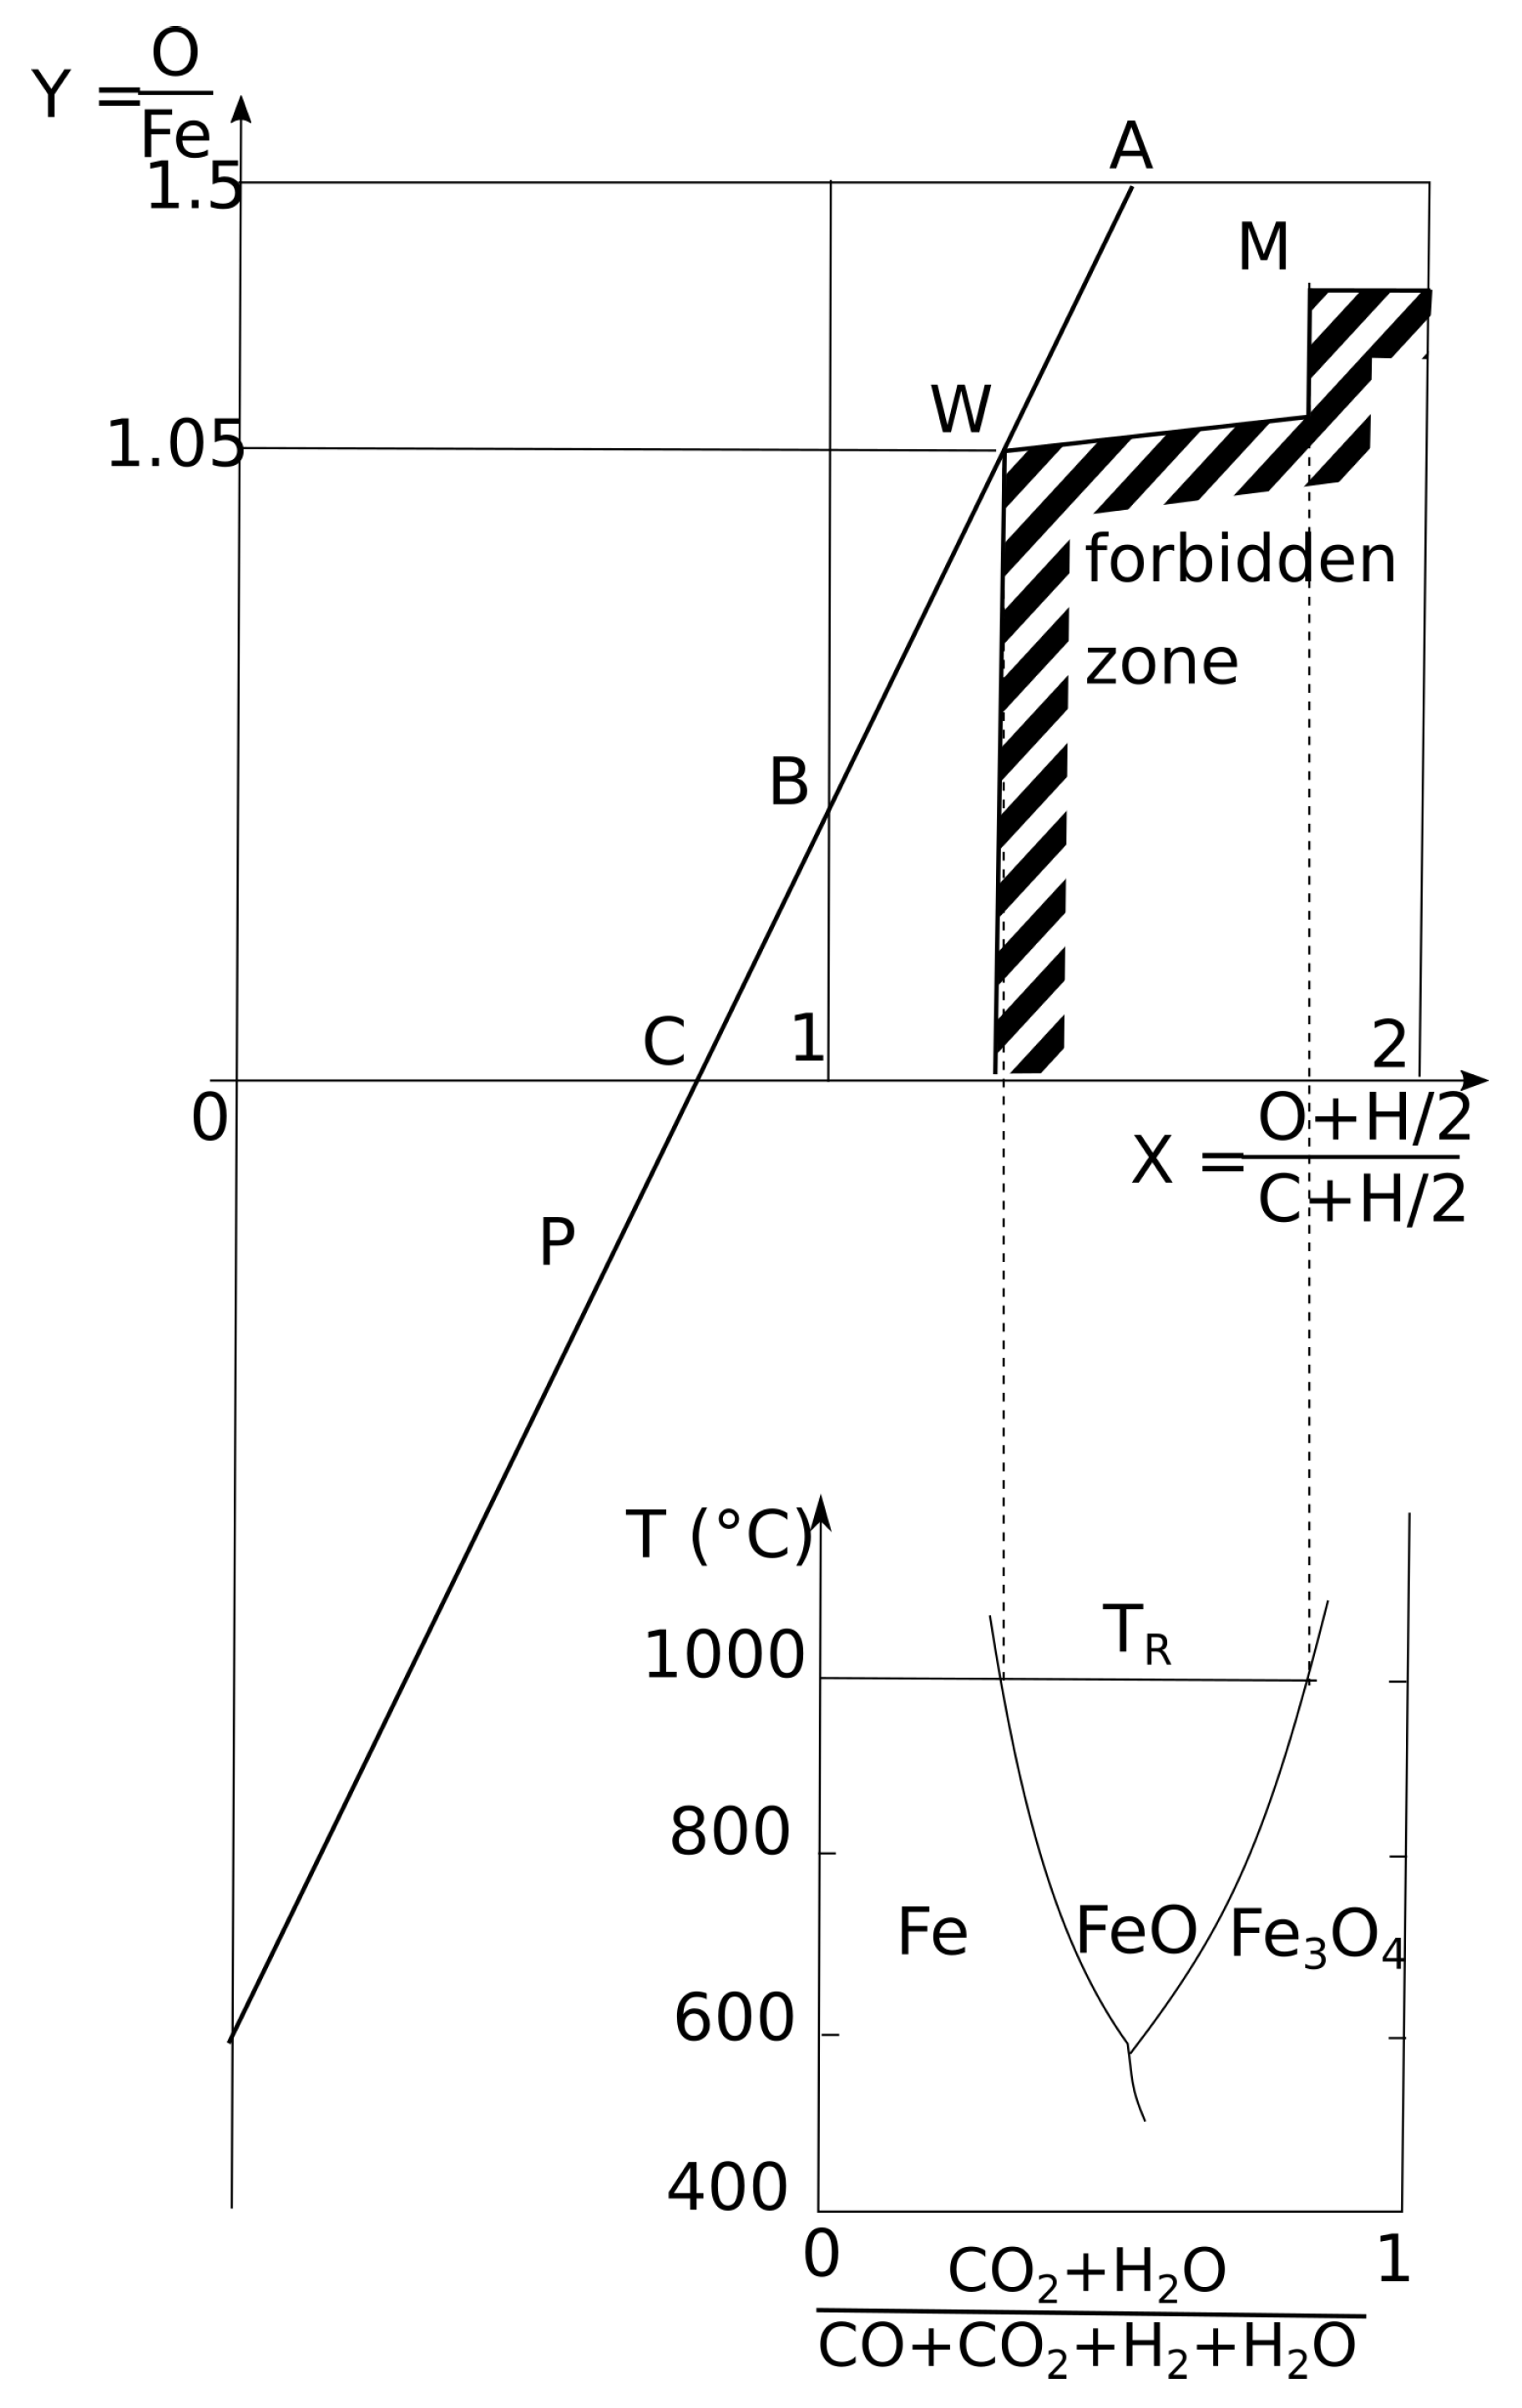
2.3. Presentation of the Operating Diagram

The operating diagram represents on the x-axis and y-axis the gas and burden oxidation degrees denoted by X g a s and y, respectively, and defined by the following relations:
X g a s = ϕ O g a s + 1 2 ϕ H g a s ϕ C g a s + 1 2 ϕ H g a s
y = ϕ O s + 1 2 ϕ H s ϕ F e s
In a counter-current configuration, according to a complete oxygen transfer from oxides to the gas all along the reduction path, the burden and gas oxidation degree variations are correlated. μ represents the specific consumption as the stoichiometric ratio between gas and solid, according the following relation:
μ = ϕ C g a s + 1 2 ϕ H g a s ϕ F e s
Rist also introduces a coupling with the Chaudron diagram. As a reminder, Chaudron has established the equilibrium conditions between the CO-CO2 and H2-H2O gas mixtures and the various iron oxides, as a function of temperature. The diagram represents the thermodynamic equilibria gas–Wustite and gas–Magnetite as a function of x g a s on the abscissa, a derived definition of the gas oxidation degree, and temperature on the ordinate, with:
x g a s = X g a s 1 = ϕ O g a s ϕ C g a s ϕ C g a s + 1 2 ϕ H g a s
Rist plots the points W and M for these equilibria. Abscissae are provided by the Chaudron diagram, and ordinates correspond to the oxidation degrees of these oxides (yW = 1.056 and yM = 1.33), as shown in Figure 3. He thus delimits the shape of a thermodynamic boundary excluding thermodynamically impossible situations, when the gas is not sufficiently reducing: the forbidden zone.
In the blast furnace, it has been shown that the main thermodynamic constraint is located in the reserve zone, halfway up the shaft, where coke gasification is preponderant, for a temperature around 950–1000 °C. Rist defines the ideal blast furnace operation when thermal and thermodynamic equilibria are reached in this reserve zone and the iron oxides are reduced to pure Wustite. Here, the operating line passes through the W-point, as shown in Figure 3.
Rist also establishes the existence of an invariant point P about which the operating line rotates when the operating point of the blast furnace is changed. This point is plotted on the basis of the heat balance calculated in the blast furnace elaboration zone below the reserve zone. The details of these calculations are described in [7], but this section does not apply to the Midrex NGTM process. Therefore, it is not developed further in this document.

2.4. Application to the Description of the Shaft Furnace in the Midrex NGTM Process

To use the Rist diagram in the Midrex NGTM process, we need to consider the following phenomena that do not occur in the blast furnace:
  • The more complex composition of the reducing gas, including the presence of hydrocarbons,
  • the in situ reforming of hydrocarbons in the shaft furnace,
  • the phenomena of carburization of DRI by gas, through the Boudouard and Beggs reactions.
We consider the following two situations, with an increasing degree of complexity.

2.4.1. Simplified Case: No Carburization Phenomena

In a simplified case, the carbon remains in a gaseous state, and the chemical reactor is considered to be an oxygen exchanger, similar to Rist’s approach for the blast furnace. Therefore, the changes in oxidation states x and y are calculated from the following relationships:
d x 0 d z = d X 0 d z = 1 ϕ C g + 1 2 ϕ H g ϕ O g z
d y d z = 1 ϕ F e s ϕ O s z
According to the local oxygen mass balance Equation (3), we deduced the simplified specific consumption:
μ 0 = d y d X 0 = ϕ C g + 1 2 ϕ H g ϕ F e s
In the shaft furnace of the Midrex NGTM process, the reducing gas is composed of CO, CO2, H2, H2O, N2, and hydrocarbons denoted CmHn. The degree of oxidation of the gas and the specific consumption can then be deduced from these relationships:
x 0 = % C O 2 + % H 2 O m % C m H n η C H
μ 0 = Q v g · η C H V m · M F e Q m D R I · % F e D R I
where:
η C H = % C O + % C O 2 + % H 2 + % H 2 O + m + n 2 % C m H n

2.4.2. Real Case: Carburization Is Taken into Account

We assumed that the carburization phenomena occur below the reduction zone in the shaft furnace. Therefore, the efficient carbon content of the reducing gas should exclude the carbon deposited on DRI:
ϕ C g = ϕ C i n l e t ϕ C s
We can thus complete the definition of specific consumption and oxidation degrees, on the basis of the simplified forms defined above.
The corresponding new specific consumption is deduced from Equations (14) and (16):
μ = ϕ C g + 1 2 ϕ H g ϕ F e s = μ 0 ϕ C s ϕ F e s
We defined μ c a r b as the decrease in specific fuel consumption due to carburization:
μ c a r b = M F e M C % C % F e D R I
We then introduced the correction factor r μ to be applied to the specific consumption to take into account its decrease due to carburization:
r μ = μ 0 μ c a r b μ 0 = 1 1 μ 0 M F e M C % C % F e D R I
Finally, the generalized specific consumption, considering carburization, was calculated from the following relationship:
μ = μ 0 · r μ
By similar reasoning, the degree of oxidation was calculated from the correction coefficient r μ :
X = X 0 r μ
We finally deduced:
x = x 0 + 1 r μ r μ

2.5. Plotting of the Thermodynamic Forbidden Zone

As previously explained, the Chaudron diagram determines the gas–solid equilibrium states between the different types of iron oxides and a reducing gas composed of H2, H2O, CO, and CO2. The abscissa, denoted xChaudron, was calculated from the reactive component of the gas, according to the following relationship:
x C h a u d r o n = % C O 2 + % H 2 O % C O + % C O 2 + % H 2 + % H 2 O
Contrary to the situation encountered for the blast furnace, the xChaudron abscissa is not directly transferable from the Chaudron diagram to the Rist diagram. Consequently, we applied the following transformation to trace the critical points W and M in this generalized formalism, according to Equations (13) and (23):
x R i s t = ( 1 α ) · x C h a u d r o n α
α = m + n 2 % C m H n η C H

3. Results and Discussion

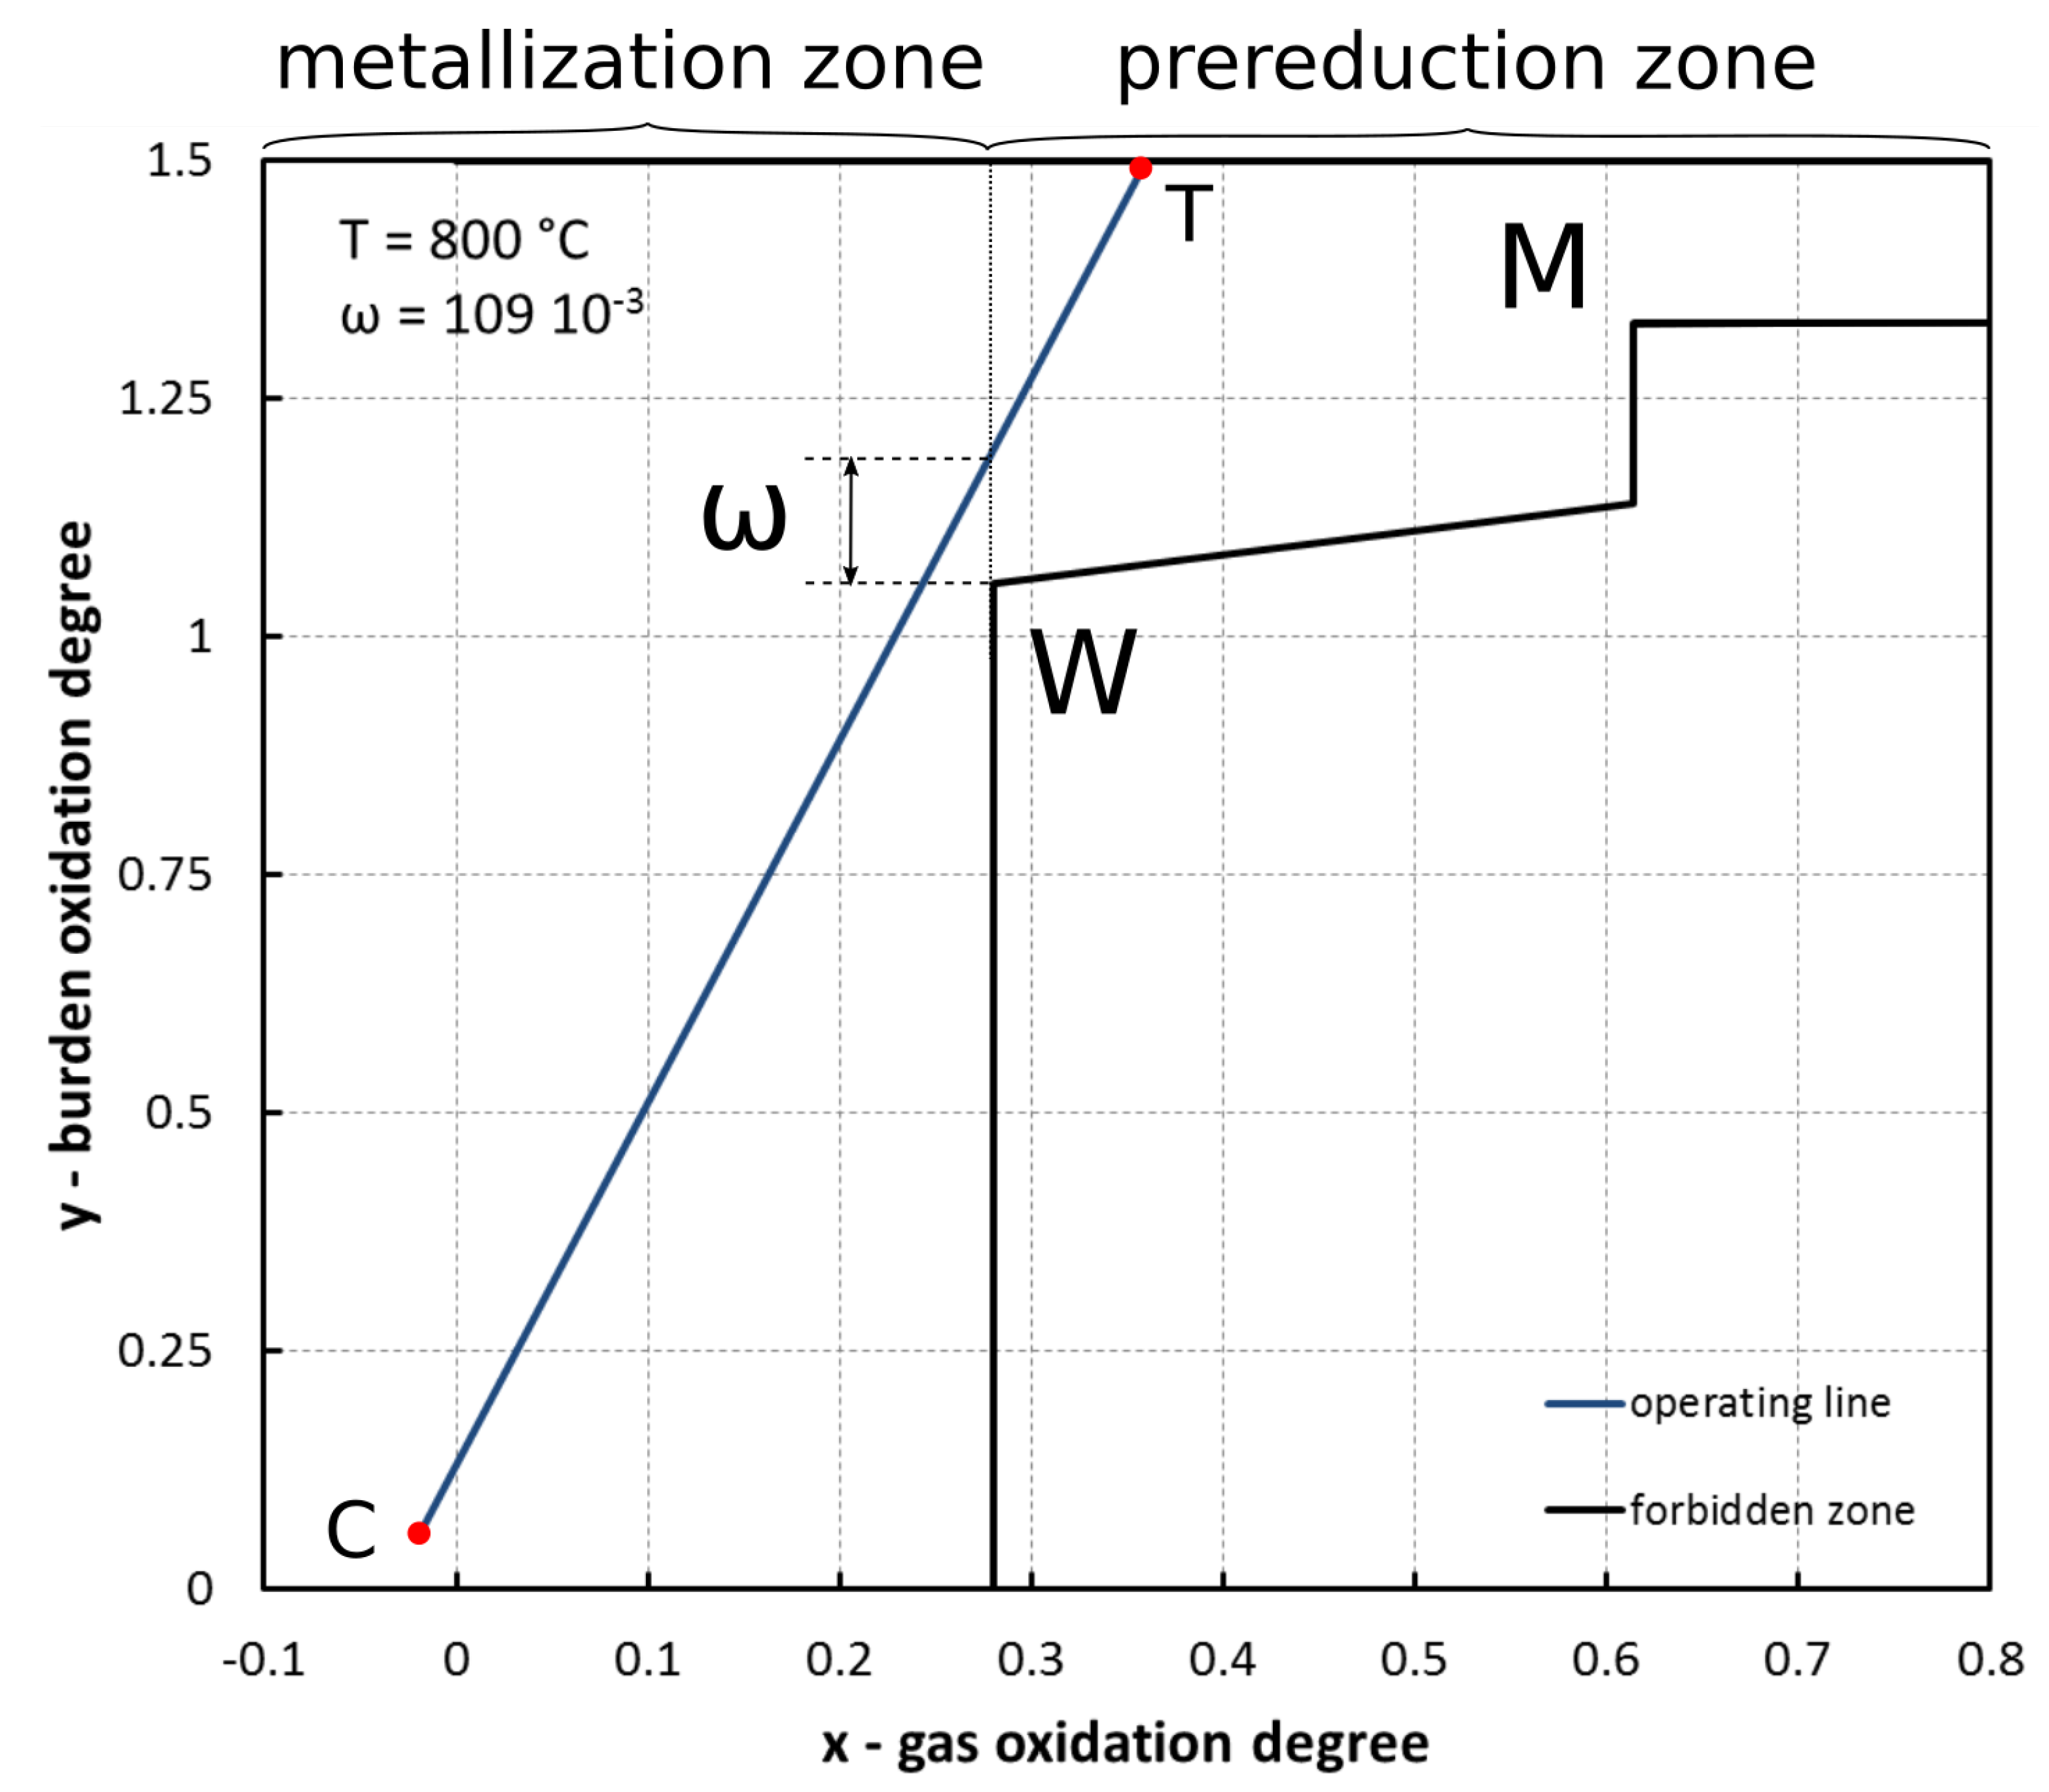
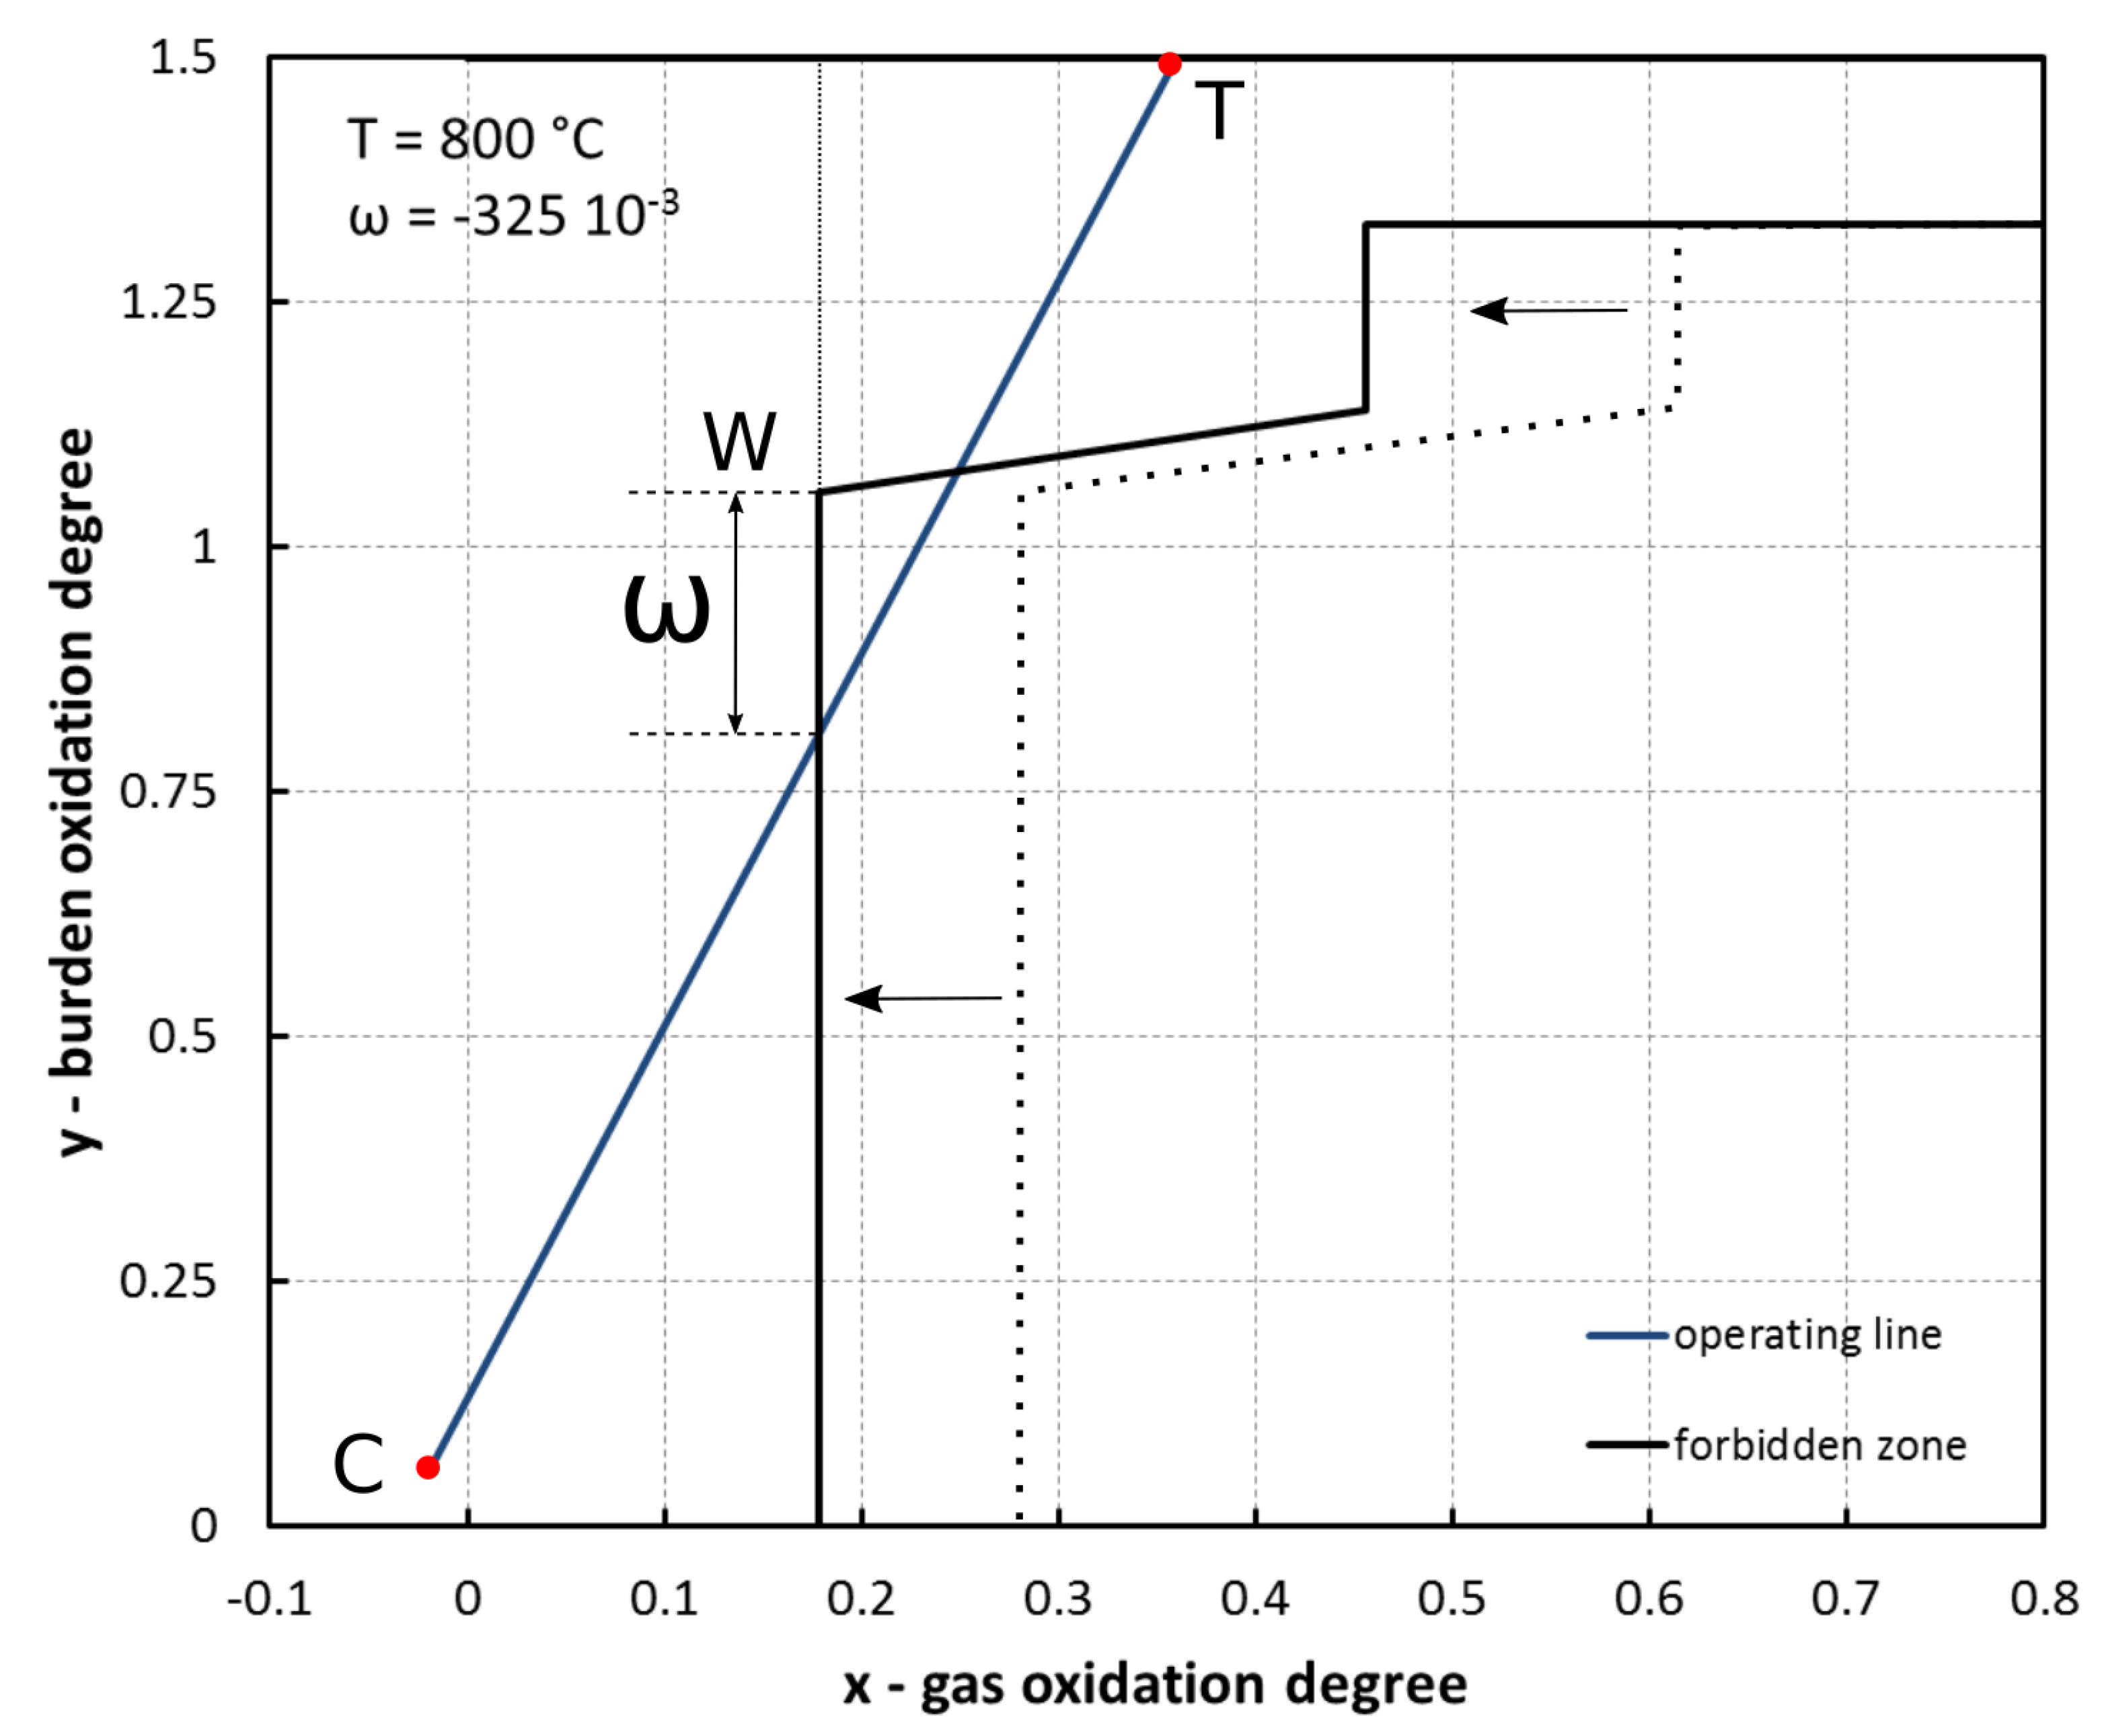
3.1. Graphical Description of a Direct-Reduction Shaft Working Point in ArcelorMittal Contrecoeur

We studied the operating point of Midrex NGTM Module 2 in the ArcelorMittal Contrecoeur plant obtained in April 2016 using the Rist operating diagram, following the methodology developed in the previous section.
To describe this operating point, we assumed that in situ methane reforming was localized in the metallization zone. This assumption is widely accepted, although not measured, because this reaction is favored both by the local temperatures and by the presence of iron, which acts as a catalyst [4,5]. Therefore, a constant methane rate was assumed throughout the reduction zone, equal to that of the top gas. The CH4 content at points W and M was finally equal to that of the top gas, and their corresponding coefficient α can be calculated with Equation (25).
Figure 4 shows the operating line for this operating point, as well as the forbidden zone calculated for a gas-Wustite and gas-Magnetite equilibrium at a temperature of 800 C, in agreement with in-situ measurements provided by Takenaka and Kimura [15].
Point C represents the bottom of the reduction zone, assumed to be localized above DRI carburization. Point T corresponds to the top gas zone. Point W defines the critical value of the gas oxidation degree xM above which the Wustite cannot be reduced to ferrous metal. In this diagram, we considered, on both sides of point W, the metallization zone and the prereduction zone.
The figure shows a distance between the operating line and point W. Rist defines this distance as the deviation from ideality ω , here equal to 0.109 (Figure 4). It corresponds to the difference between the average oxidation state of the iron bearing material and that of the pure Wustite at the time of metallization start-up.
In this case, the average oxidation degree of iron oxides was 1.165 ( y M + ω ), when metallization was initiated. In 2015, in the framework of experimental laboratory tests on the reduction of pellets in a steady-state counter-current configuration, under conditions as close as possible to the industrial reactor, we showed that the reduction of Hematite to Magnetite was almost complete when Wustite appeared, at point M [16]. Therefore, in the present situation, it is reasonable to assume that there was no residual Hematite at the time of metallization start-up. The degree of oxidation of iron oxides therefore corresponds to a mixture of 40% Magnetite and 60% Wustite ( 1.165 0.4 × 1.33 + 0.6 × 1.056 ).
The reduction of iron oxides follows successive and staggered reactions, which is inherent to the counter-current configuration. We emphasize that this staggered effect is less pronounced here than in the blast furnace where metallization starts when sinter is mainly prereduced into Wustite.

3.2. Influence of In Situ Reforming

To show the impact of in situ reforming on the operating point of the shaft furnace, we now assume that methane cracking occurs in the prereduction zone and not in the metallization zone. This obviously contradicts what is commonly accepted, for the reasons detailed above. According to this hypothesis, the methane content taken into account for plotting the forbidden zone corresponds to that of the reducing gas injected in the lower part (mixture of the bustle gas with the natural gas injected in the transition zone and in the cooling zone).
A higher methane content changes the value of the α coefficient, calculated with relation (25), used to transpose the coordinates of the Chaudron diagram to the operating diagram. The increase in the coefficient α induces a decrease in the values xW and xM. As a result, the forbidden zone is shifted to the left. On the other hand, the operational line remains unchanged.
Figure 5 depicts this hypothetical operating point that would obey these assumptions. It shows that the deviation to ideality ω is negative this time, because the operating line crosses the forbidden zone. This situation, which is thermodynamically impossible, proves that in situ reforming cannot take place in the prereduction zone.

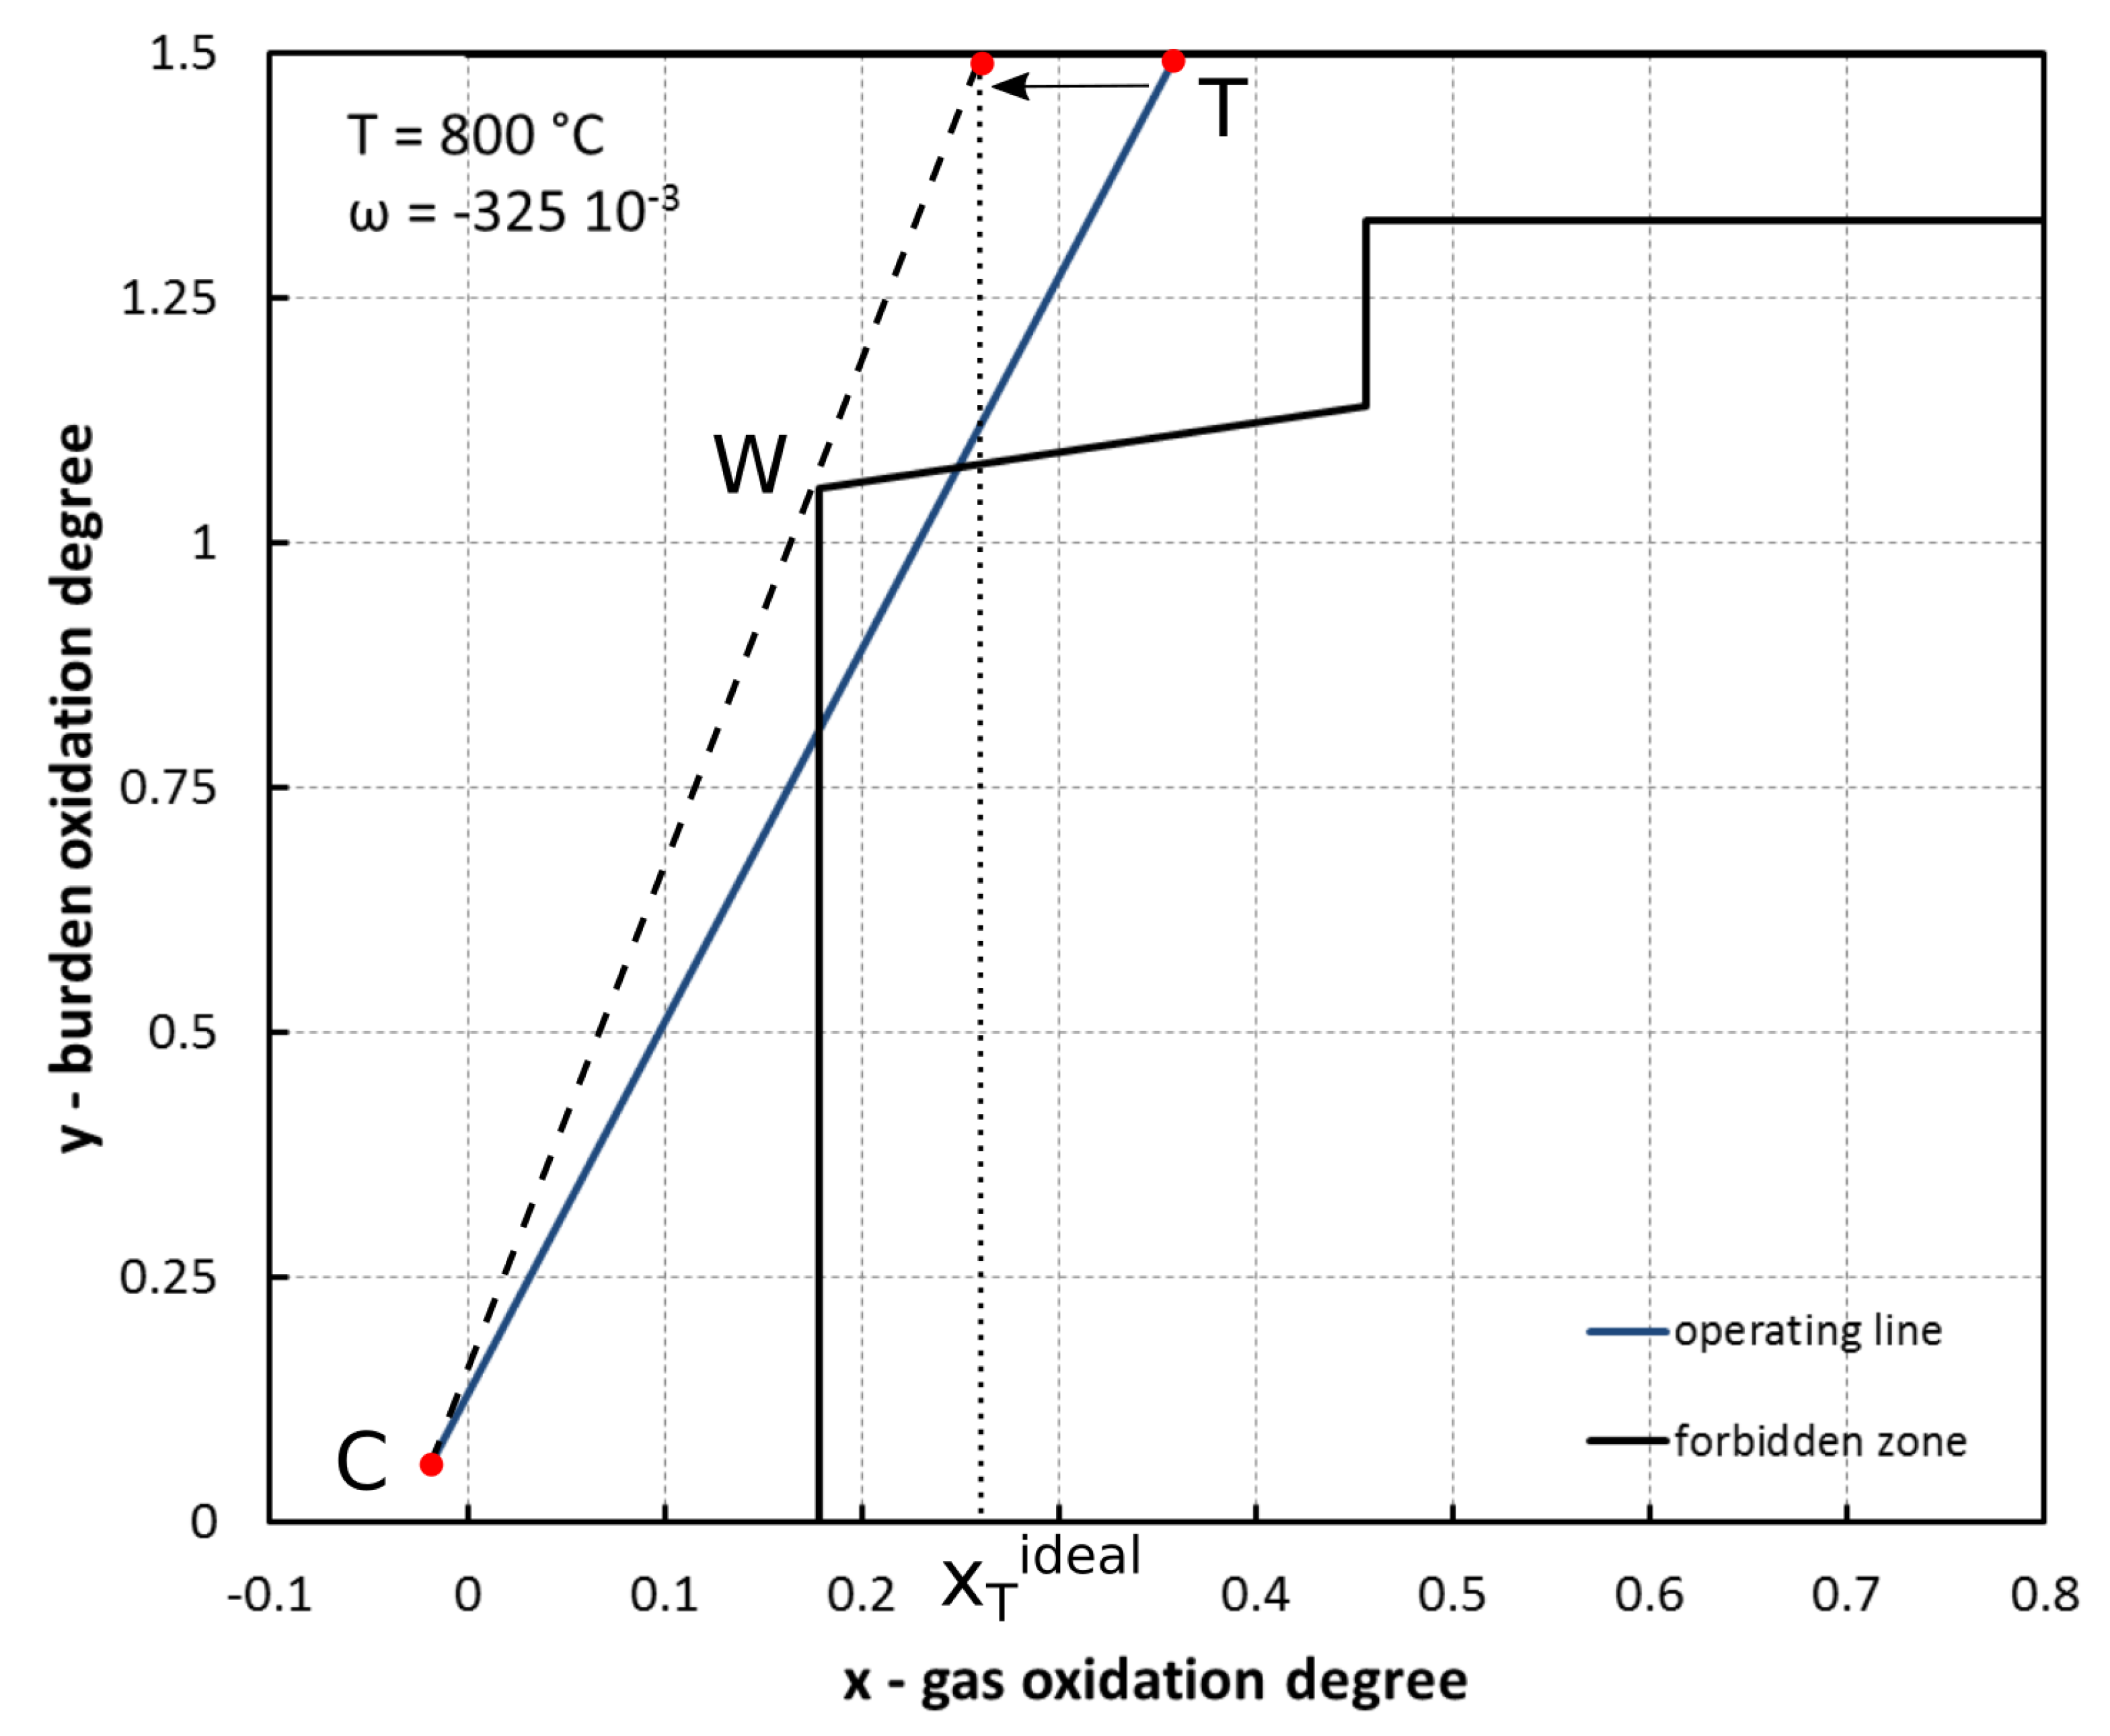
3.3. Definition of the Ideal Working Point

In the situation previously described in Figure 5, the most direct way to restore metallization is to increase specific consumption, either by increasing gas flow rates or simply by decreasing DRI production.
Figure 6 shows the change in the process working point required to generate metallization in the shaft. This is an optimized (or ideal) configuration where we rotated the operating line around the point C so that it passes through the point W.
We thus defined a maximum oxidation degree for the top gas, denoted x T i d e a l , necessary for metallization to occur. This graphical description highlights a direct link between the efficiency of in situ reforming and the minimal required top gas quality (or degree of oxidation).
Finally, we must also point out that this ideal working point may not be achievable, as we did not consider the limits related to the heat balance in the metallization zone. In the situations described above, we assumed that metallization occurs at 800 °C. However, the energy required to heat the ferrous material and the metallization was provided by the sensible heat of the reducing gas, which has a maximum acceptable temperature of about 950 °C in the bustle zone to avoid DRI clustering. The only way to provide sufficient energy is therefore to inject a minimum flow of gas, which implies the existence of a minimum critical specific consumption. This condition will be particularly severe for higher levels of H2 where the metallization is more endothermic than with CO.

4. Conclusions

We presented the adaptation of the operating diagram proposed by Rist, a graphical tool describing the operating point of the blast furnace, to direct reduction.
To achieve this, we generalized the initial approach by taking into account the presence of hydrocarbons in the reducing gas, the cracking phenomena in the shaft furnace, and the carburization of the DRI.
The diagram was thus redefined for direct reduction, also integrating the information provided by the Chaudron diagram concerning the thermodynamic equilibria between iron oxides and the reducing gas.
We used this diagram to describe the operating point of the Midrex NGTM module n°2 of the ArcelorMittal Contrecoeur plant. We thus highlighted the staggered character of the reduction within the shaft furnace, distinguishing between a prereduction zone and a metallization zone. Similar to the blast furnace, the beginning of the metallization is the critical point of reduction from a thermodynamic point of view.
We studied the impact of in situ reforming on the process limits to ensure metallization, which allowed us to define the minimum top gas quality required to meet this condition. This graphical tool can be built with basic information, such as solid and gas chemical compositions and flows. It can allow us to estimate the plant performance by calculating the distance between the operating point and thermodynamic limits in order to minimize the gas/solid ratio. Such a minimal ratio should lead to a lower natural gas consumption.
This graphical tool can be used to optimize the operating point of the direct-reduction shaft furnace or to define prospective operating points (e.g., coupling with other processes—hydrogen reduction). It is also an interesting pedagogical tool to understand the reduction zone of the shaft as a counter-current gas–solid reactor.

Author Contributions

Conceptualization, T.Q.; methodology, T.Q.; software, T.Q.; validation, T.Q. and J.B.; formal analysis, T.Q.; resources, P.G. and G.L.; writing—original draft preparation, T.Q.; writing—review and editing, T.Q., J.B. and P.G. All authors have read and agreed to the published version of the manuscript.

Funding

This research received no external funding.

Institutional Review Board Statement

Not applicable.

Informed Consent Statement

Not applicable.

Data Availability Statement

Not applicable.

Conflicts of Interest

The authors declare no conflict of interest.

Abbreviations

The following abbreviations are used in this manuscript:
Greek letters
μ specific consumption
ϕ molar flux (mol·m−3·s−1)
Latin letters
a j volumetric fraction of the molecule j in a mix gas
c i local molar concentration of the atomic element i (mol·m−3)
n i j number of atoms i in the molecule j
Q m mass flow rate (kg·s−1)
Q v volumetric flow rate (m3·s−1)
V m molar volume of the gas (m3·mol−1)
wmass fraction
x g a s gas oxidation degree (derived definition)
X g a s gas oxidation degree (original definition)
yburden oxidation degree
superscript
gasrelated to gaseous element
srelated to solid element (iron bearing material)
subscript
iatomic element (C, H, O, or Fe)

References

  1. Usui, T.; Ohmi, M.; Yamamura, E. Analysis of Rate of Hydrogen Reduction of Porous Wustite Pellets Basing. ISIJ Int. 1990, 30, 347–355. [Google Scholar] [CrossRef]
  2. Vannucci, M.; Colla, V.; Corbo, G.; Fera, S. A simplified approach to the simulation of direct reduction of iron ore. Metall. Res. Technol. 2010, 107, 195–204. [Google Scholar] [CrossRef]
  3. Parisi, D.R.; Laborde, M.A. Modeling of counter current moving bed gas-solid reactor used in direct reduction of iron ore. Chem. Eng. J. 2004, 104, 35–43. [Google Scholar] [CrossRef] [Green Version]
  4. Shams, A.; Moazeni, F. Modeling and Simulation of the MIDREX Shaft Furnace: Reduction, Transition and Cooling Zones. JOM 2015, 67, 2681–2689. [Google Scholar] [CrossRef]
  5. Hamadeh, H.; Mirgaux, O.; Patisson, F. Detailed Modeling of the Direct Reduction of Iron Ore in a Shaft Furnace. Materials 2018, 11, 1865. [Google Scholar] [CrossRef] [Green Version]
  6. Rist, A.; Bonnivard, G. Reduction d’un lit d’oxydes de fer par un gaz, première partie. Rev. Métall. 1963, 60, 23–37. [Google Scholar] [CrossRef]
  7. Rist, A.; Meysson, N. Étude graphique de la marche du haut fourneau avec vent humide et injections aux tuyères. Rev. Métall. 1965, 62, 995–1040. [Google Scholar] [CrossRef]
  8. Rist, A.; Bonnivard, G. Réduction d’un lit d’oxydes de fer par un gaz, deuxième partie. Rev. Métall. 1966, 63, 296–312. [Google Scholar] [CrossRef]
  9. Rist, A.; Dancoisne, P.; Jon, R. Connaissance du haut fourneau. Rev. Métall. 1967, 64, 97–118. [Google Scholar] [CrossRef]
  10. Cordier, J.; Guerbois, J.; Hazard, P.; Malvaux, R.; Reveil, C. Les injections au haut fourneau. Rev. Métall. 1962, 59, 791–815. [Google Scholar] [CrossRef]
  11. Rist, A.; Meysson, N. Recherche graphique de la mise au mille minimale du haut fourneau a faible température de vent. Rev. Métall. 1964, 61, 121–146. [Google Scholar] [CrossRef]
  12. Meysson, N.; Maaref, A.; Rist, A. Emploi de boulettes prereduites au haut fourneau etude graphique. Rev. Métall. 1965, 62, 1161. [Google Scholar]
  13. Nicolle, R.; Capelani, R.; Guillot, J.B.; Rist, A. La réduction dans le haut fourneau et la recherche des très faibles mises au mille de coke. Rev. Métall. 1980, 77, 769–779. [Google Scholar] [CrossRef]
  14. Rist, A. Analogue Diagrams for Process Metallurgists. ISIJ Int. 1992, 32, 1034–1043. [Google Scholar] [CrossRef] [Green Version]
  15. Takenaka, Y.; Kimura, Y.; Narita, K.; Kaneko, D. Mathematical model of direct reduction shaft furnace and its application to actual operations of a model plant. Comput. Chem. Eng. 1986, 10, 67–75. [Google Scholar] [CrossRef]
  16. Quatravaux, T.; Barros, J.; Maurice, Y.; Pierret, H.; Chen, E.; Tsvik, G. Laboratory scale study of reduction kinetics of iron oxides on direct reduction conditions. In Proceedings of the METEC & 2nd Estad 2015, Düsseldorf, Germany, 15–19 June 2015. [Google Scholar]
Figure 1. Operating principle of the Midrex NGTM process.
Metals 11 01953 g001
Figure 2. Formalization of the counter-current configuration of the reduction zone in the shaft furnace.
Metals 11 01953 g002
Figure 3. An illustration of the Rist diagram applied for the blast furnace, coupled with thermodynamics constraints from the Chaudron diagram.
Metals 11 01953 g003
Figure 4. Operating diagram for Midrex NGTM module 2 in ArcelorMittal Contrecoeur plant on April 2016, assuming 100% in situ reforming in the metallization zone.
Metals 11 01953 g004
Figure 5. Operating diagram for Midrex NGTM module 2 in ArcelorMittal Contrecoeur plant on April 2016, assuming 100% in situ reforming in the prereduction zone.
Metals 11 01953 g005
Figure 6. Operating diagram for an ideal configuration.
Metals 11 01953 g006
Table 1. Compositions of inlet and outlet gases of the Midrex shaft in Gilmore plant. [3].
Gas Composition (% mol)H2COH2OCO2CH4 + N2
Reducing gas52.9030.04.74.88.1
Top gas (T)37.018.921.214.38.6
Publisher’s Note: MDPI stays neutral with regard to jurisdictional claims in published maps and institutional affiliations.

