Article

Distortion-Induced Fatigue Reassessment of a Welded Bridge Detail Based on Structural Stress Methods

by
Vencislau Quissanga
1,*,
Guilherme Alencar
2,
Abílio de Jesus
3,
Rui Calçada
4 and
José Guilherme S. da Silva
5
1
Civil Engineering Postgraduate Programme (PGECIV), State University of Rio de Janeiro (UERJ), Rua São Francisco Xavier St., 524, Maracanã, Rio de Janeiro 20550-900, Brazil
2
Civil and Environmental Engineering Department, University of Brasilia (UnB), DF, Brasília 70910-900, Brazil
3
Mechanical Engineering Department, Faculty of Engineering of University of Porto (FEUP), Rua Dr. Roberto Frias St., 4200-465 Porto, Portugal
4
Civil Engineering Department, Faculty of Engineering of University of Porto (FEUP), Rua Dr. Roberto Frias St., 4200-465 Porto, Portugal
5
Structural Engineering Department, Faculty of Engineering, State University of Rio de Janeiro (UERJ), Rua São Francisco Xavier St., 524, Maracanã, Rio de Janeiro 20550-900, Brazil
*
Author to whom correspondence should be addressed.
Metals 2021, 11(12), 1952; https://doi.org/10.3390/met11121952
Submission received: 12 October 2021 / Revised: 12 November 2021 / Accepted: 26 November 2021 / Published: 3 December 2021
(This article belongs to the Special Issue Computational Mechanics of Fatigue and Fracture in Metallic Materials)

Abstract

:
Typically, bridge structural systems are affected by random loads that can cause significant damage. One challenging problem in this field is the high-stress amplitude associated with distortion-induced fatigue. In this study, the hot-spot method and the master S-N curve method were validated for the evaluation of fatigue resistance induced by distortion in welded joints of steel bridges. Validation of the master S-N curve method in this research was a necessary prior step for application of the method in real case studies of road bridges, which will be subject to loads of variable amplitudes in the near future, ensuring the basis for the application. The method of validation was based on an important available full-scale fatigue test database, which was generated decades ago to serve as the foundation for the assessment of distortion-induced fatigue. Modelling was carried out based on the finite element method with the aid of ANSYS software, considering the shell and solid elements and equivalent structural stresses. The experimental results were compared with the numerical ones obtained with the two methodologies, and the difference, in terms of global and local tension, was less than 1%.

1. Introduction

The fatigue phenomenon in welded connections, which significantly affects the useful life of metallic structures, is an important case study in the field of structural engineering. This phenomenon is caused by cyclic loadings capable of causing the failure of a structural element at lower stress levels compared to the strength limit of the material itself [1,2,3,4,5,6].
The fatigue life of welded bridge structures subjected to dynamic loading is governed by the fatigue behaviour of their joints [7]. In this context, it is known that welded connections are among the weakest points in steel bridges, as they are responsible for stress concentrations responsible for fatigue cracking, or manufacturing defects that can act as initial cracks [8]. According to a recent historic review [5], for most welded steel bridges fatigue occurs in the web gap region between flanges and transverse stiffeners or connections plates, due to out-of-plane distortion. Indeed, according to Connor and Fisher [9], nearly 90% of all fatigue cracking is the result of out-of-plane distortion or other unanticipated secondary stresses. Existing design procedures (on fatigue) provide recommendations for mitigating the effects of distortion-induced fatigue caused by differential vertical movements between adjacent longitudinal girders under traffic loading, but do not directly address secondary out-of-plane strains, nor provide guidance for determining the magnitude of out-of-plane stresses in beams. In this sense, distortion-induced fatigue cracking results from second-order stresses, typically due to out-of-plane deformations and incompatible deformations at intersecting structural elements [5,9,10].
The bridge maintenance process is expensive, and often, its occasional failures have been the “stimulus” for researchers and/or bridges professionals, to significantly increase the concern in the use of adequate materials, better designs, and beneficial maintenance methods [11,12]. The computational numerical modelling process with the finite element method (FEM) is one way to simplify and determine the aspects located in welded joints, facilitating the process of the local analysis to calculate fatigue life, especially in details with essential stress concentrations [13,14,15]. Thus, adequate modelling techniques in engineering projects are becoming increasingly important [16], to overcome the problems related to the local approach to structures.
In this context, when carrying out bridge design, researchers and/or engineering professionals usually rely on knowledge of finite element analysis as a basis, to thoroughly assess the fatigue resistance of structural systems with welded joints. However, the use of very fine meshes around singular geometries, such as the weld toes where most fatigue cracks initiate, may trigger unreliable singular stress fields. Indeed, the increasingly adopted hot-spot stress method [17] requires that relatively fine hexahedron elements be adopted in the investigated site of fatigue cracking initiation in order to alleviate mesh-sensitivity issues. In other words, the method consists of obtaining the stress in the most critical region or detail of the weld joint based on the extrapolation of stresses from the surrounding regions or by linearizing stresses along the element thickness [18,19,20].
Moreover, in the case of evaluating fatigue strength in welded connections efficiently in coarser FE models, using either hexahedron or tetrahedron solid elements and triangular or rectangular shell elements, without overlooking accuracy in fatigue life estimates, the master S-N curve method is one of the important alternatives. Furthermore, it is noteworthy that in the method development process, some researchers have proven the capability of the master S-N curve to collapse into a narrow band several weld fatigue failures, based on different loading modes, dimensions, and thicknesses in structures with piping and pressure vessels [21], offshore structures [22], and bridge structures [2,11,23]. Despite that, as mentioned above, in the last decades the method has been included as an alternative procedure to the standard methods in the following codes: API 579-1/ASME FFS-1 2016 Fitness-For-Service [24], and ASME B&PV Code, Section VIII Div2 [25]. Recently, the method has also been applied to railway vehicles [26,27].
The master S-N curve method is based on the concepts of fracture mechanics to modify the stress parameter of the S-N diagram, considering the nodal forces and nodal moments that act in the plane at the local equilibrium [28,29], aiming to reduce the mesh problems associated with the hot-spot stress method.
Thus, in this research, we evaluated the fatigue resistance due to the distortion-induced of the most critical details of a welded joint by the hot-spot stress and master S-N curve methods, based on shell elements for global FE models and solid elements for local FE sub-models. Note that previous applications of the master S-N curve method for bridge structures mainly focused on load-induced fatigue only, as shown in Alencar et al. [11], while this work focuses on distortion-induced fatigue, which, for current existing ageing bridges, can be more damaging than load-induced fatigue. Therefore, the objective was to study the possibility of validating the methods with the results obtained through the experimental tests of 12 steel beams, developed by Fisher et al. [30]. With the validation of the method, this research will support, in the near future, the necessary steps for the fulfilment of the application of the curve master S-N method in cases of real studies, mainly of road bridges subjected to real variable amplitude traffic.
This paper is divided into three parts. In the first part, structural stress methods are briefly presented and defined. In the second part, all assumptions of the analyses performed on the evaluation and detailed descriptions of the fatigue test configurations are provided, as well as the finite element models developed. In the third part, the results of the analyses are discussed, the methodologies applied in the research are validated, and the conclusions of the study are presented.

2. Structural Stress Methods

Several authors in the field of engineering have discussed the analyses related to the fatigue life of welded structures [18,31,32,33,34]. Therefore, several methodologies were developed, and national and international standards are constantly being updated to mitigate the risks in complex systems composed of welded metal structures.
As the authors mentioned in the previous paragraph [7,32,35], Aygül [16] classified the fatigue assessment into two parts; the first consists of the global analysis approach (nominal stress), and the second of the local analysis, where the latter is related to hot-spot stress, effective notch stress, and fracture mechanics. According to Poutiainen et al. [18], the hot-spot (local) stress method is divided into three variants, namely; (I) linear surface extrapolation (LSE); (II) through thickness at the weld toe (TTWT); and (III) mesh insensitive structural stress (MISS). It is worth noting that the first and second methods can be applied in the calculation of structural stress in welded joints where the principal stress acts perpendicularly to the weld toe, which is, therefore, the probable fatigue crack nucleation region. The third method can be considered an intermediate approach between the global analysis and the local analysis [36].

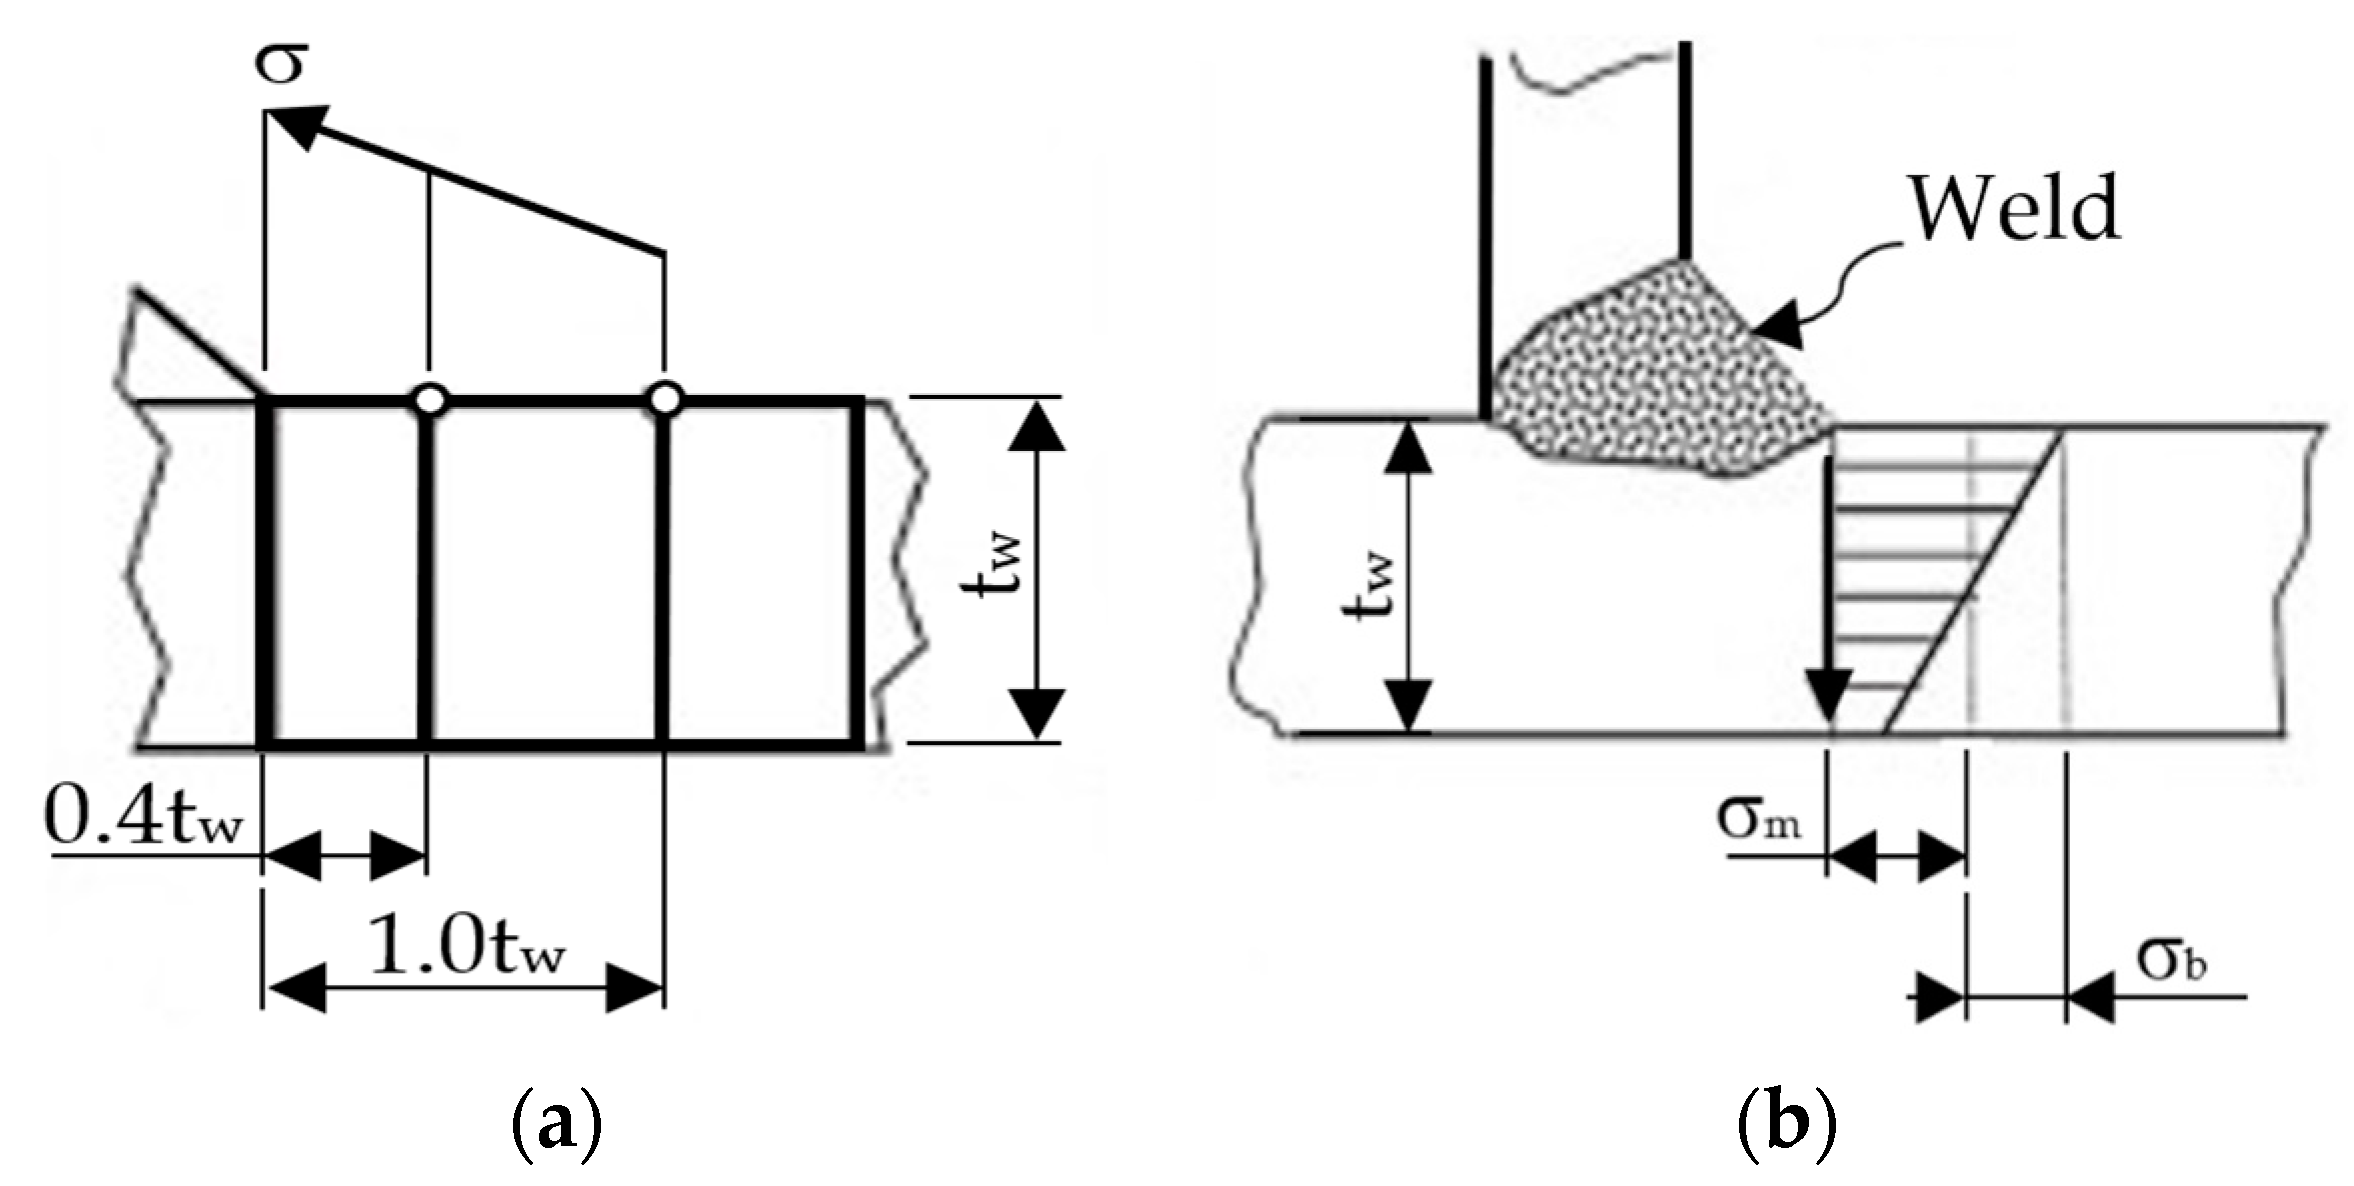
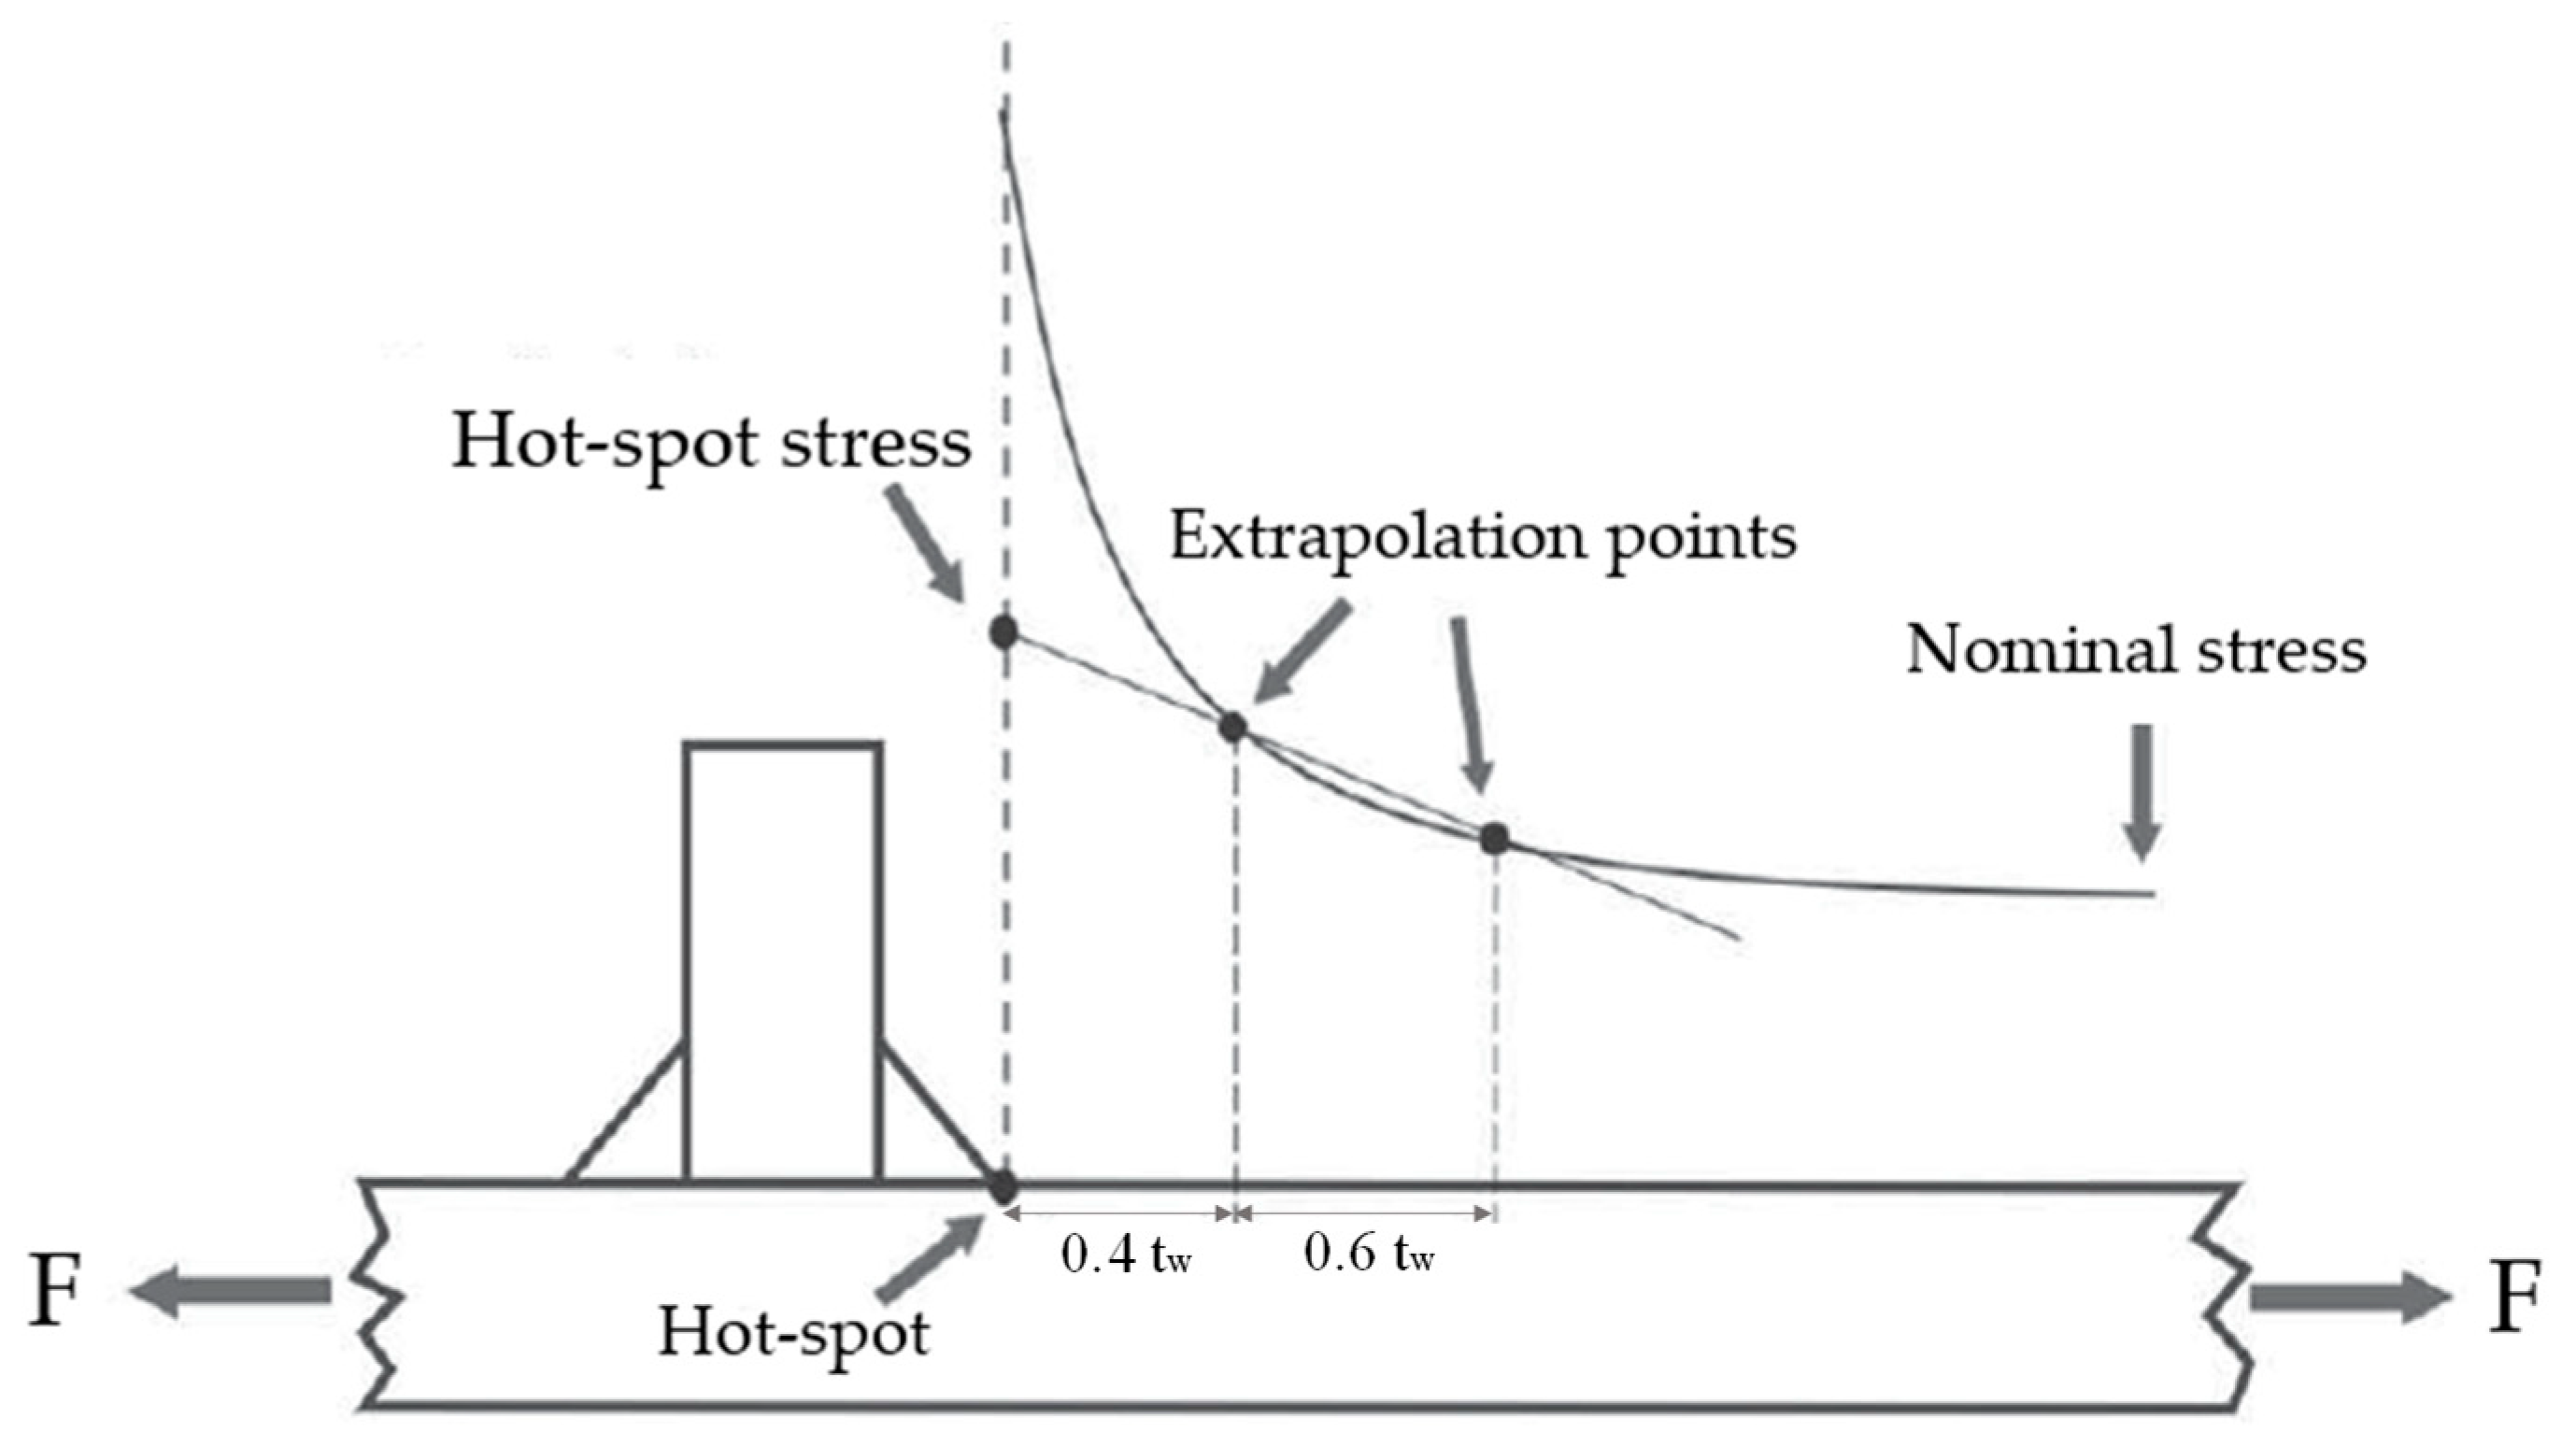
2.1. Hot-Spot Stress Method

The hot-spot stress method is based on the maximum principal stress in the material adjacent to the edge of the weld bead, taking into account the effects of stress concentration due to gross geometry as a whole and excluding non-linear effects due to the local weld bead geometry [37]. Among the different procedures for calculating the hot-spot stress, the most typical is based on the superficial linear extrapolation of the stress values at distances of 0.4 tw and 1 tw from the weld toe, where tw corresponds to the plate thickness/plate of the element subjected to loading (Figure 1). In this context, according to Saini et al. [38], the hot-spot stress method considers the effect of increased stress due to geometric discontinuity, but disregards the stress located in the notch of the weld of the structural element under analysis. The hot-spot stress, also known as geometric stress, does not consider the non-linear peak resulting from the discontinuity existing in the limit of the weld bead of the structural element (refer to Figure 1). Surface extrapolated (Figure 1a) or through thickness linearized structural stresses may be computed (Figure 1b).
According to Viana [31], Niemi et al. [20], and the International Institute of Welding (IIW) [7], the fatigue design of welded joints should be based on guidelines of practice (standards) substantiated for obtaining geometrical stress via numerical analyses. Thus, IIW [7] presents in detail the procedures for obtaining surface extrapolated hot-spot stress, in order to avoid the influence of stress singularities. As already mentioned, the author highlights that the hot-spot stress is not evaluated at the first nodal point under the weld (Figure 2). For this reason, the extrapolation is performed, taking into account the finite element widths determined according to the specific distance of the selected reference points for the stress evaluation. It is worth noting that the reference points vary in position according to the element’s geometry, extrapolation order, and the type of hot-spot stress to be performed.
It is important to mention that for the different types of joints, the same S-N curve is simply considered, formed by the amplitude of stresses on the vertical axis and the number of cycles on the horizontal axis. The fatigue life for 2 × 10⁶ cycles is described by Equation (1), where Δσhs is the variation of the hot-spot stress amplitude (in MPa), N is the number of cycles to failure, m is the slope of the curve S–N, and C is the design value of the fatigue strength of the joint.
Δ σ h s m . N = C
The hot-spot stress is determined using the reference points and the extrapolation equations as described in Figure 2. Furthermore, in the case of evaluating nodal stress at two reference points for linear extrapolation, with fine meshes of elements not greater than 0.4 tw, located at a distance of 0.4 tw and 1.0 tw from the edge of the weld bead, Equation (2) should be applied:
σ h s = 1.67 σ 0.4 tw 0.67 σ 1.0 tw
In the case of quadratic extrapolation in fine meshes of elements not exceeding 0.4 tw, the evaluations of nodal stresses are performed at three reference points located at distances of 0.4 tw, 0.9 tw, and 1.4 tw from the edge of the weld bead, according to Equation (3). This method is recommended for cases of a marked increase in the bending component of the structural stress. Like the previous method (linear extrapolation), the quadratic extrapolation method in fine meshes was adopted for analysis in the present work.
σ h s = 2.52 σ 0.4 tw 2.24 σ 0.9 tw 0.72 σ 1.4 tw

2.2. The Master S-N Curve

Based on IIW [41], the geometric configuration, the thickness variation, and the type of loading are key pieces of information for the calculation of fatigue resistance using the nominal stress method and the hot-spot stress method. However, it is worth noting that when using only the stress values (nominal or hot-spot) under the ordinate (Y) axis in an S-N diagram, the fatigue behaviour ends up not being fully described, because in this context, the key parameters are considered only through the proper choice of the resistance curve, and in some cases, through the correction of the curve for aspects not foreseen in the project [6].
In this regard, an equivalent equilibrium structural stress parameter can be obtained by normalizing the stress amplitude, considering that, in this way, the behaviour of several welded structural elements can be described, relying on a single master S-N curve, as proposed by Dong [34]. It is worth mentioning that in the case of a shell modelling, the structural stress can be evaluated directly in the region of the weld toe, as a linear stress distribution for the elements is assumed. To avoid inaccuracies caused by the stress distribution, the structural stress is calculated directly from the nodal forces and moments [39]. After the nodal forces and nodal moments have been determined for each local coordinate system, [F] and [M], the following step consists of solving Equations (4) and (5), by computing the inverse of a positive-defined symmetric interpolation matrix [L], based on work-equivalence principle [34], thus obtaining line forces [f] and line moments [m].
[ f ] = [ L ] 1 [ F ]
[ m ] = [ L ] 1 [ M ]
The matrix of membrane stresses, [σm], can be obtained by dividing the linear forces at each node (unit: N/m) by the plate thickness (unit: m), t, (or length of “integration” for partial through-thickness failure). The matrix of bending stresses, [σb], can be obtained by dividing the linear moments at each node (unit: Nm/m) by the bending elastic modulus per unit of length (unit: m3/m) of a rectangular section of height t:
[ σ m ] = 1 t [ f ]
[ σ b ] = 1 t 2 / 6 [ m ]
The matrix of structural stresses is defined as the sum of the membrane and bending stresses matrices at each node lying in the weld path:
[ σ s ] = [ σ m ] + [ σ b ]
In the case of applied cyclic structural stresses, one may multiply Equation (8) by (1 − R), where R is the load ratio, resulting the structural stress ranges column matrix:
[ Δ σ s ] = [ Δ σ m ] + [ Δ σ b ]

2.2.1. The Master S-N Curve (Mode I)

Based on a two-stage crack growth model, an equivalent stress parameter (ΔSS), taking into account both plate thickness and bending ratio effect, was proposed by Dong et al. [21] under the dominated Mode I loading condition (Equation (10)):
Δ S S = Δ σ s t 2 m 2 m I ( r b ) 1 m
where Δσs is the equilibrium equivalent structural stress range; m is the inverse slope of Paris–Law with a two-stage crack growth model, usually taken as 3.6; t* is a dimensionless plate thickness ratio about a unit thickness (t* = t/tref, with tref = 1 mm), thus handling the equivalent stress parameter with stress units (MPa); and the integral I(rb) is a dimensionless function of the bending ratio, rb, computed according to Equation (11):
r b = | Δ σ b | | Δ σ m | + | Δ σ b | .
Based on polynomial regression analysis, the following expressions for I(rb)1/m (Equations (12) and (13) were provided in SI units in [43]:
I ( r b ) 1 / m = 2.1549 r b 6 5.0422 r b 5 + 4.8002 r b 4 2.0694 r b 3 + 0.561 r b 2 + 0.0097 r b + 1.5426
for displacement-controlled conditions, and:
I ( r b ) 1 / m = 2.1549 r b 6 5.0422 r b 5 + 4.8002 r b 4 2.0694 r b 3 + 0.561 r b 2 + 0.0097 r b + 1.5426
for load-controlled conditions.
Dong et al. [28] verified the usefulness of Equation (10) in the form of equivalent structural stress range parameter, ΔSS, versus cycles to failure, N, for various types of joints, with different thicknesses, dimensions, and loading modes. The analysis demonstrated the capability to collapse several fatigue tests of welded components into a narrow band. The derived curve was then designated (according to Equation (14)) as the master S-N curve:
Δ S S = C N h
where C and h are parameters determined based on a linear regression analysis. ASME Sec VIII Div2 [43] provided the following parameters shown in Table 1 for fatigue analysis of welded joints under the Mode I dominated loading using the master S-N curve method.

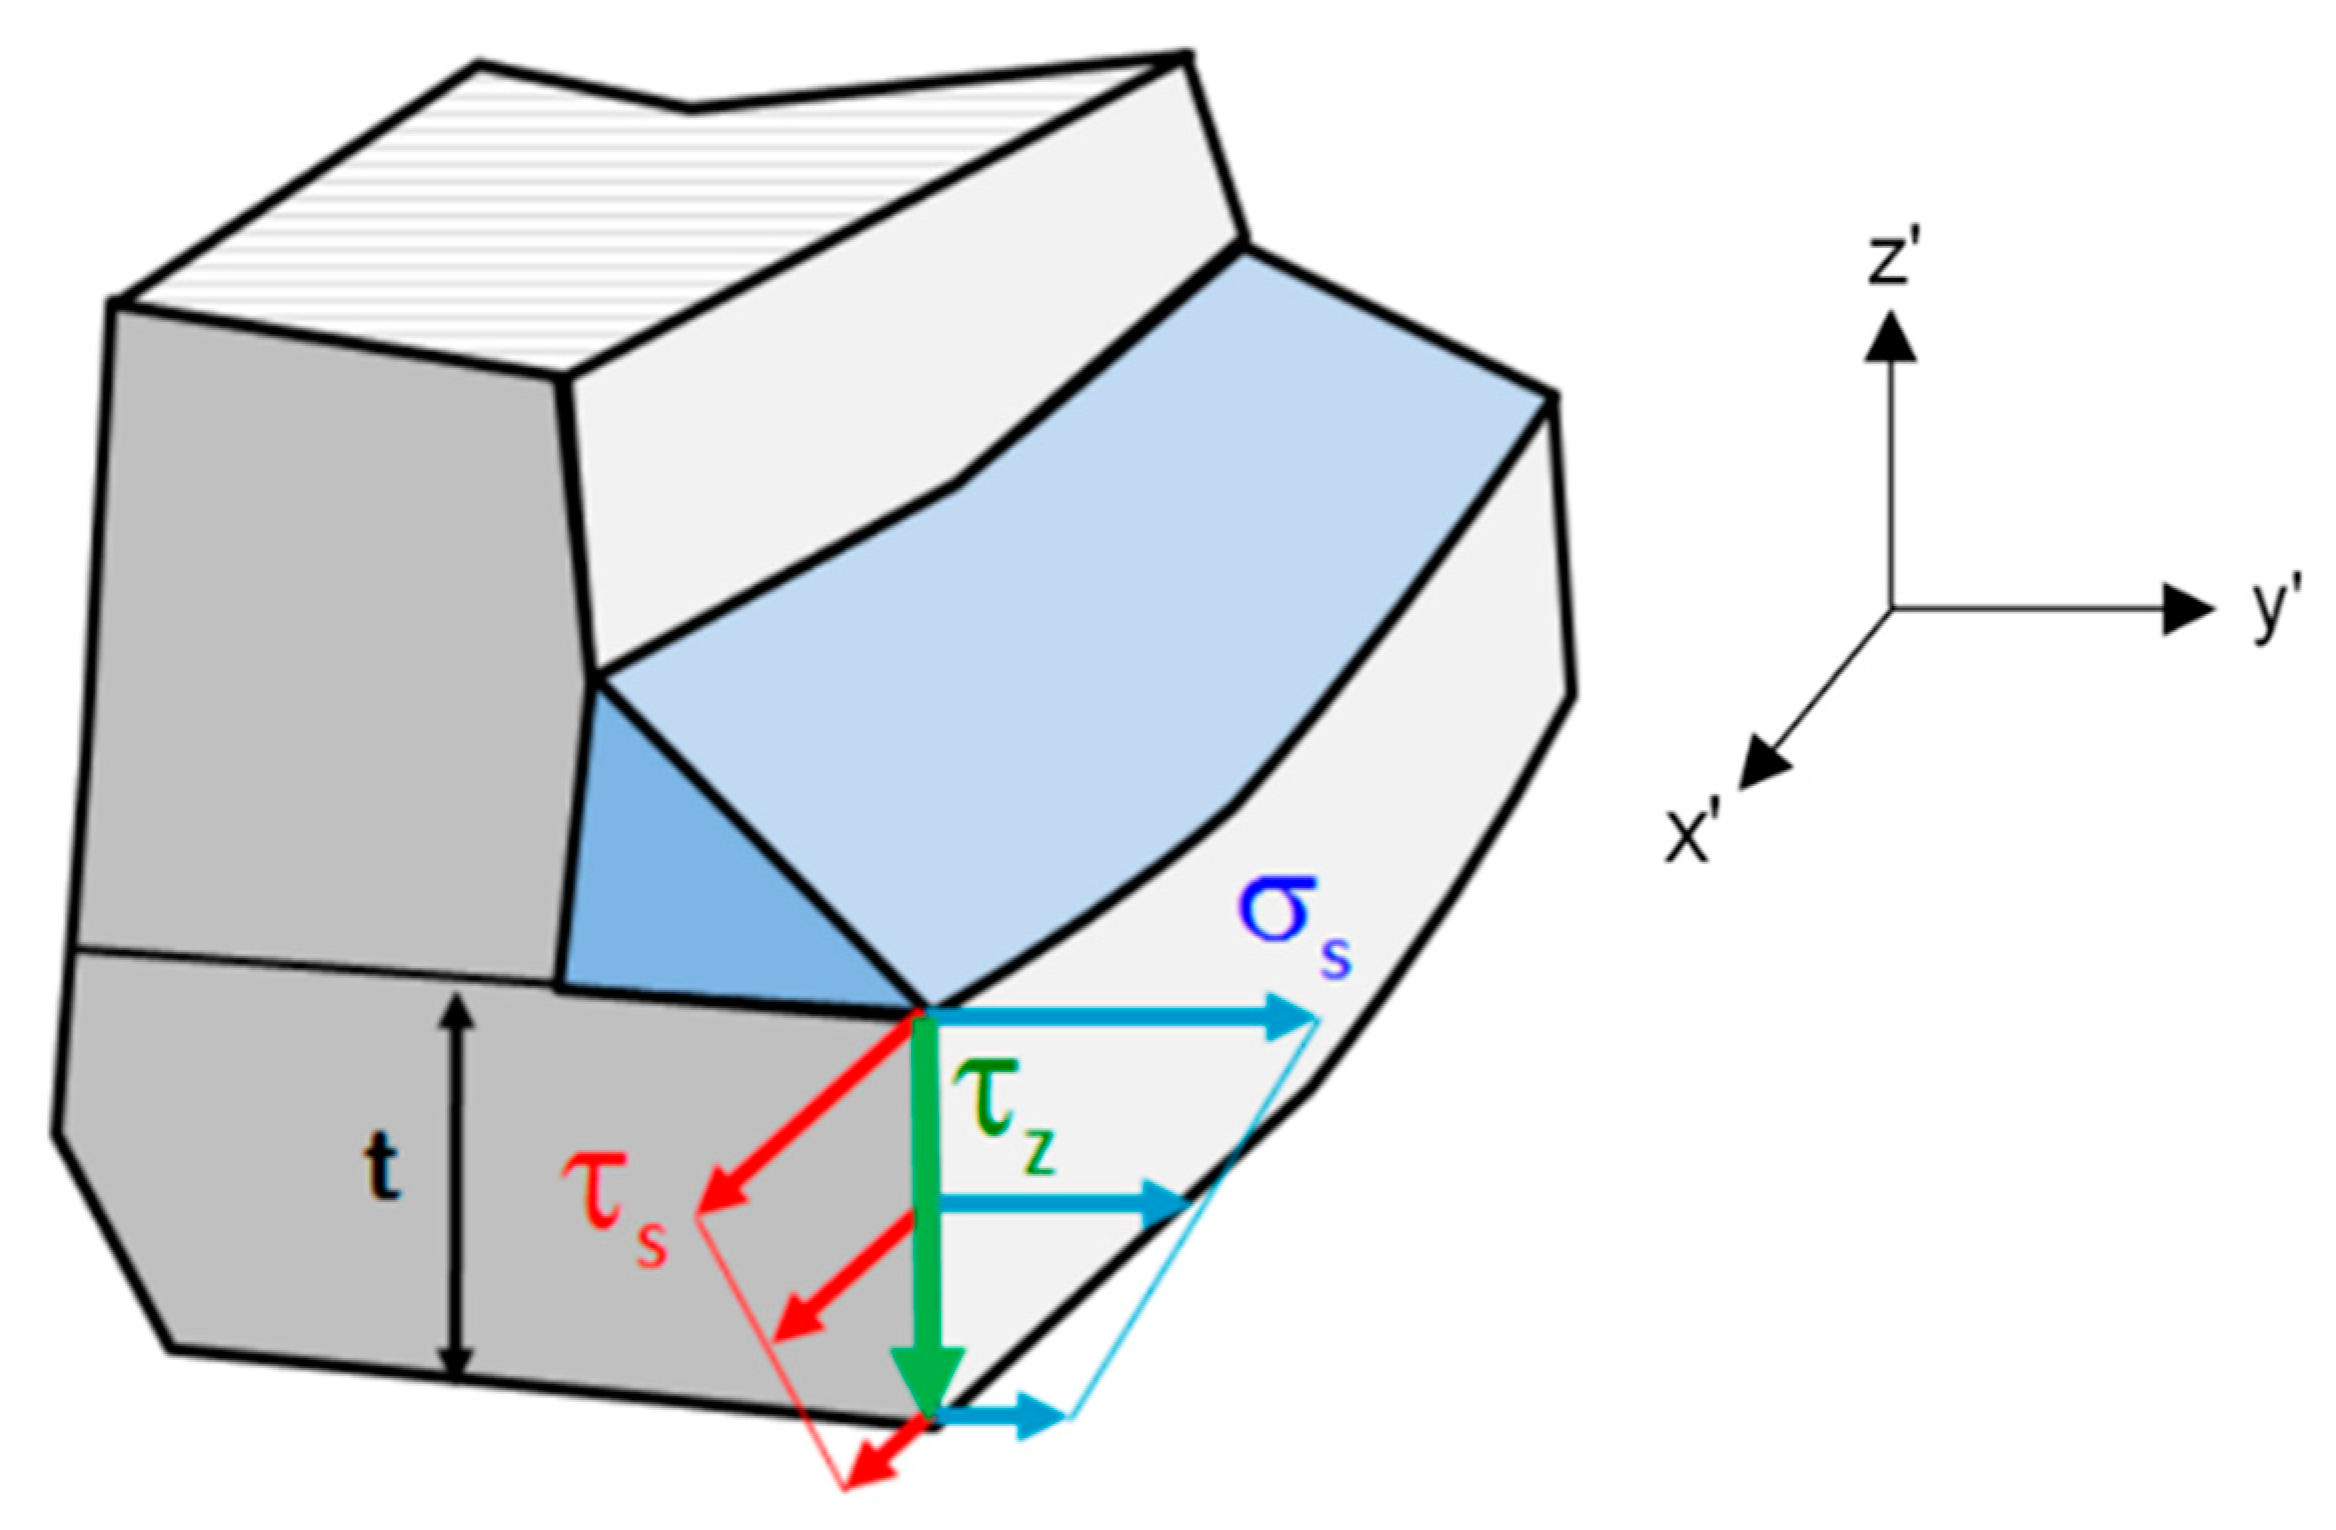
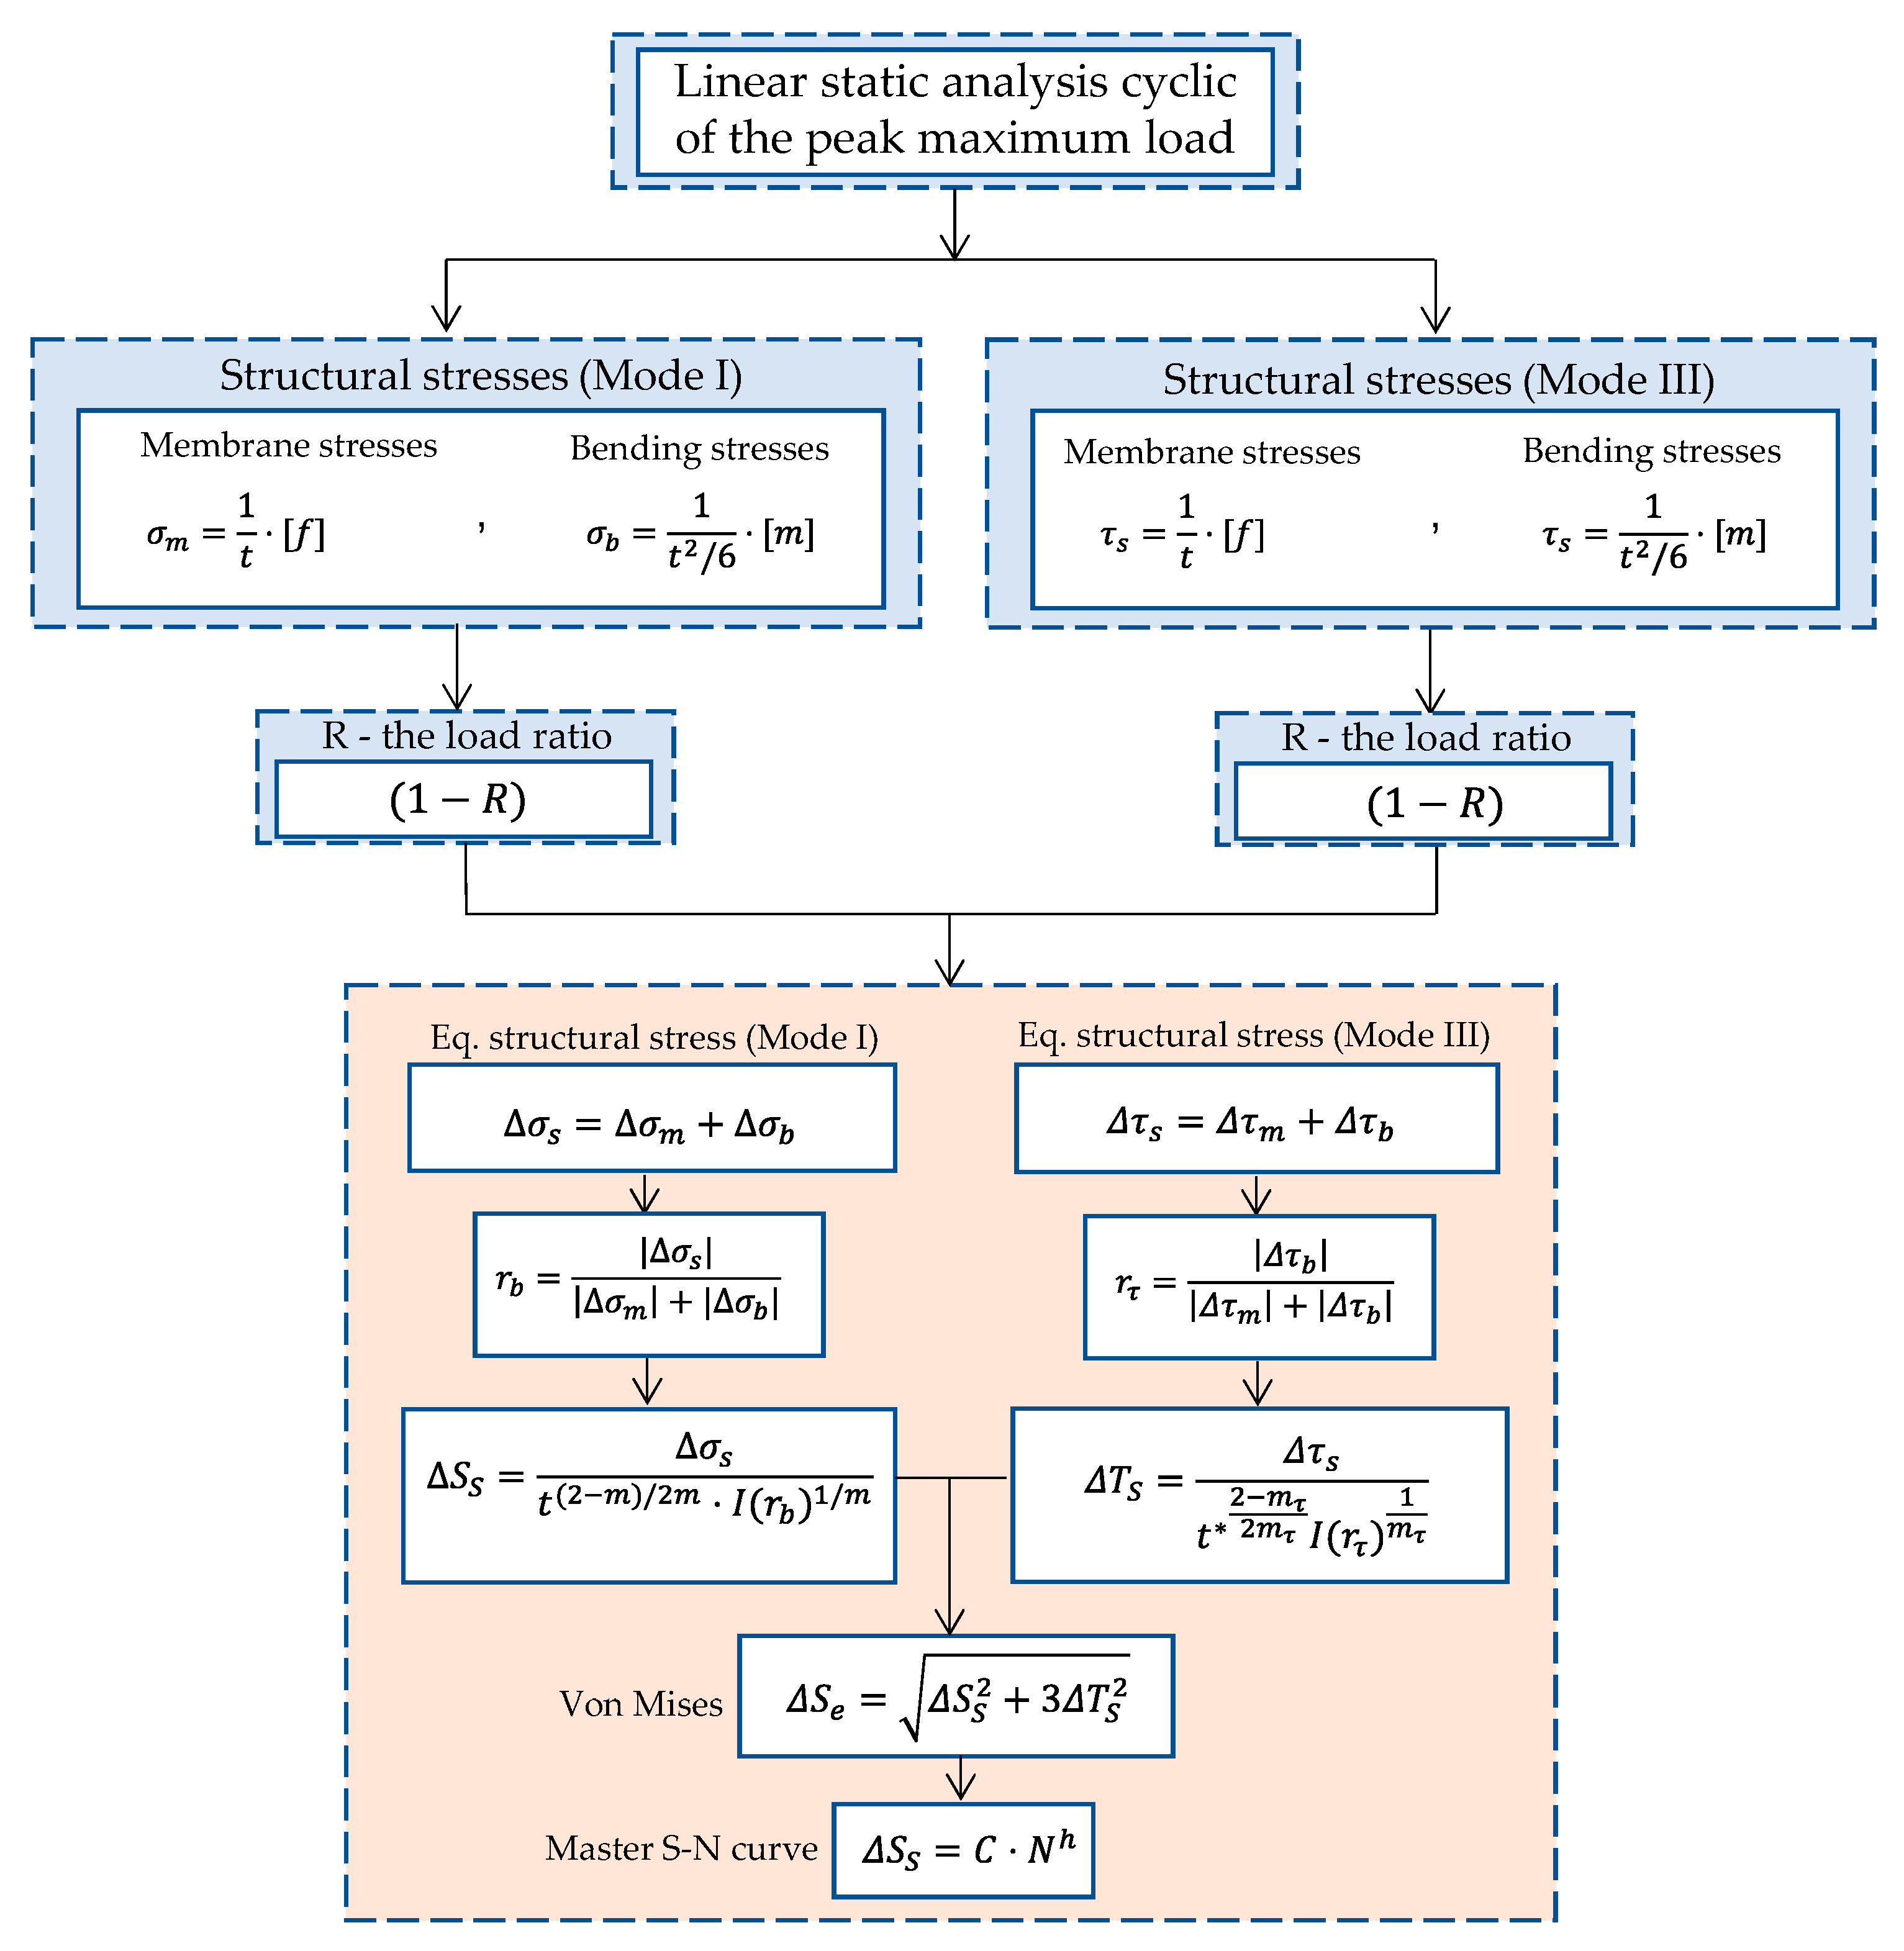
2.2.2. The Master S-N Curve Method for Multiaxial Fatigue Analysis (Mixed-Mode I + III)

In the case of multiaxial fatigue, based on the interaction of the normal structural stresses (Mode I) and in-plane structural shear stresses (Mode III) with the von Mises criterion, one may obtain an effective equivalent structural stress (EESS), ΔSe [44], parameter in the following form, Equation (15):
Δ S e = Δ S S 2 + 3 Δ T S 2
where ΔΤS is the equivalent in-plane shear structural stress parameter, accounting for Mode III contribution and defined as follows:
Δ T S = Δ τ s t 2 m τ 2 m τ I ( r τ ) 1 m τ
in which Δτs is computed according to Equation (19); mτ taken as equal to 5 is the inverse slope of the Paris–Law curve in a log–log scale with a two-stage crack growth model for specimens under pure Mode III loading; and I(rτ)1/mτ is a dimensionless 4th order polynomial taking into account the in-plane shear bending ratio effect, rτ, both proposed by Hong and Forte [44] as equal to:
I τ ( r τ ) 1 m τ = 51.21 r τ 4 39.813 r τ 4 + 12.638 r τ 2 + 0.0654 r τ + 1.245
r τ = | Δ τ b | | Δ τ m | + | Δ τ b |
The details of the formulation of I(rτ)1/mτ can be found in [44]. In this case, transverse shear (Mode II) is usually negligible for most applications in welded structures and hence neglected in the above formula. Proceeding in this form, the same fatigue strength parameters for the master S-N curve derived for Mode I, C, and h (Table 1), can be used for multiaxial purposes under Modes I + III with the employment of the effective equivalent structural stress parameter in the y-axis combined computed on the basis of the von Mises interaction criterion.
The previous stress recovery procedures had as a basis a hypothetical crack growing at the weld line, and the derived structural stresses acting on the planar faces of this hypothetical crack are responsible for leading to Mode I crack-opening mechanism, which is predominant for most applications in welded structures. However, for some applications under multiaxial loading, it may be necessary to investigate Mode III cracking mechanism and the interaction between Mode I and Mode III (Mixed-mode I + III), according to the following illustration (Figure 3). Transverse shear structural stress—Mode II—, τz, are usually neglected because they tend to be lower than the other structural stress components for welded structures.
Therefore, for Mode III, the main driving stresses are in-plane shear structural stress ranges, ΔτS, defined as the sum of in-plane membrane shear stress ranges, Δτm, and in-plane bending shear stress ranges Δτb, following Equation (19):
[ Δ τ s ] = [ Δ τ m ] + [ Δ τ b ]
Choosing the appropriate nodal forces and nodal moments at the weld line in the appropriate local coordinate systems, i.e., longitudinal nodal forces along x’ and nodal moments about y’ (refer to Figure 3) and the resolution is the same way as for Equations (5) and (7), for linear and quadratic elements, respectively, using the same baseplate thickness as reference. Then, the flowchart of the multiaxial fatigue analysis considering the two modes (mixed mode I + III) is presented (Figure 4).

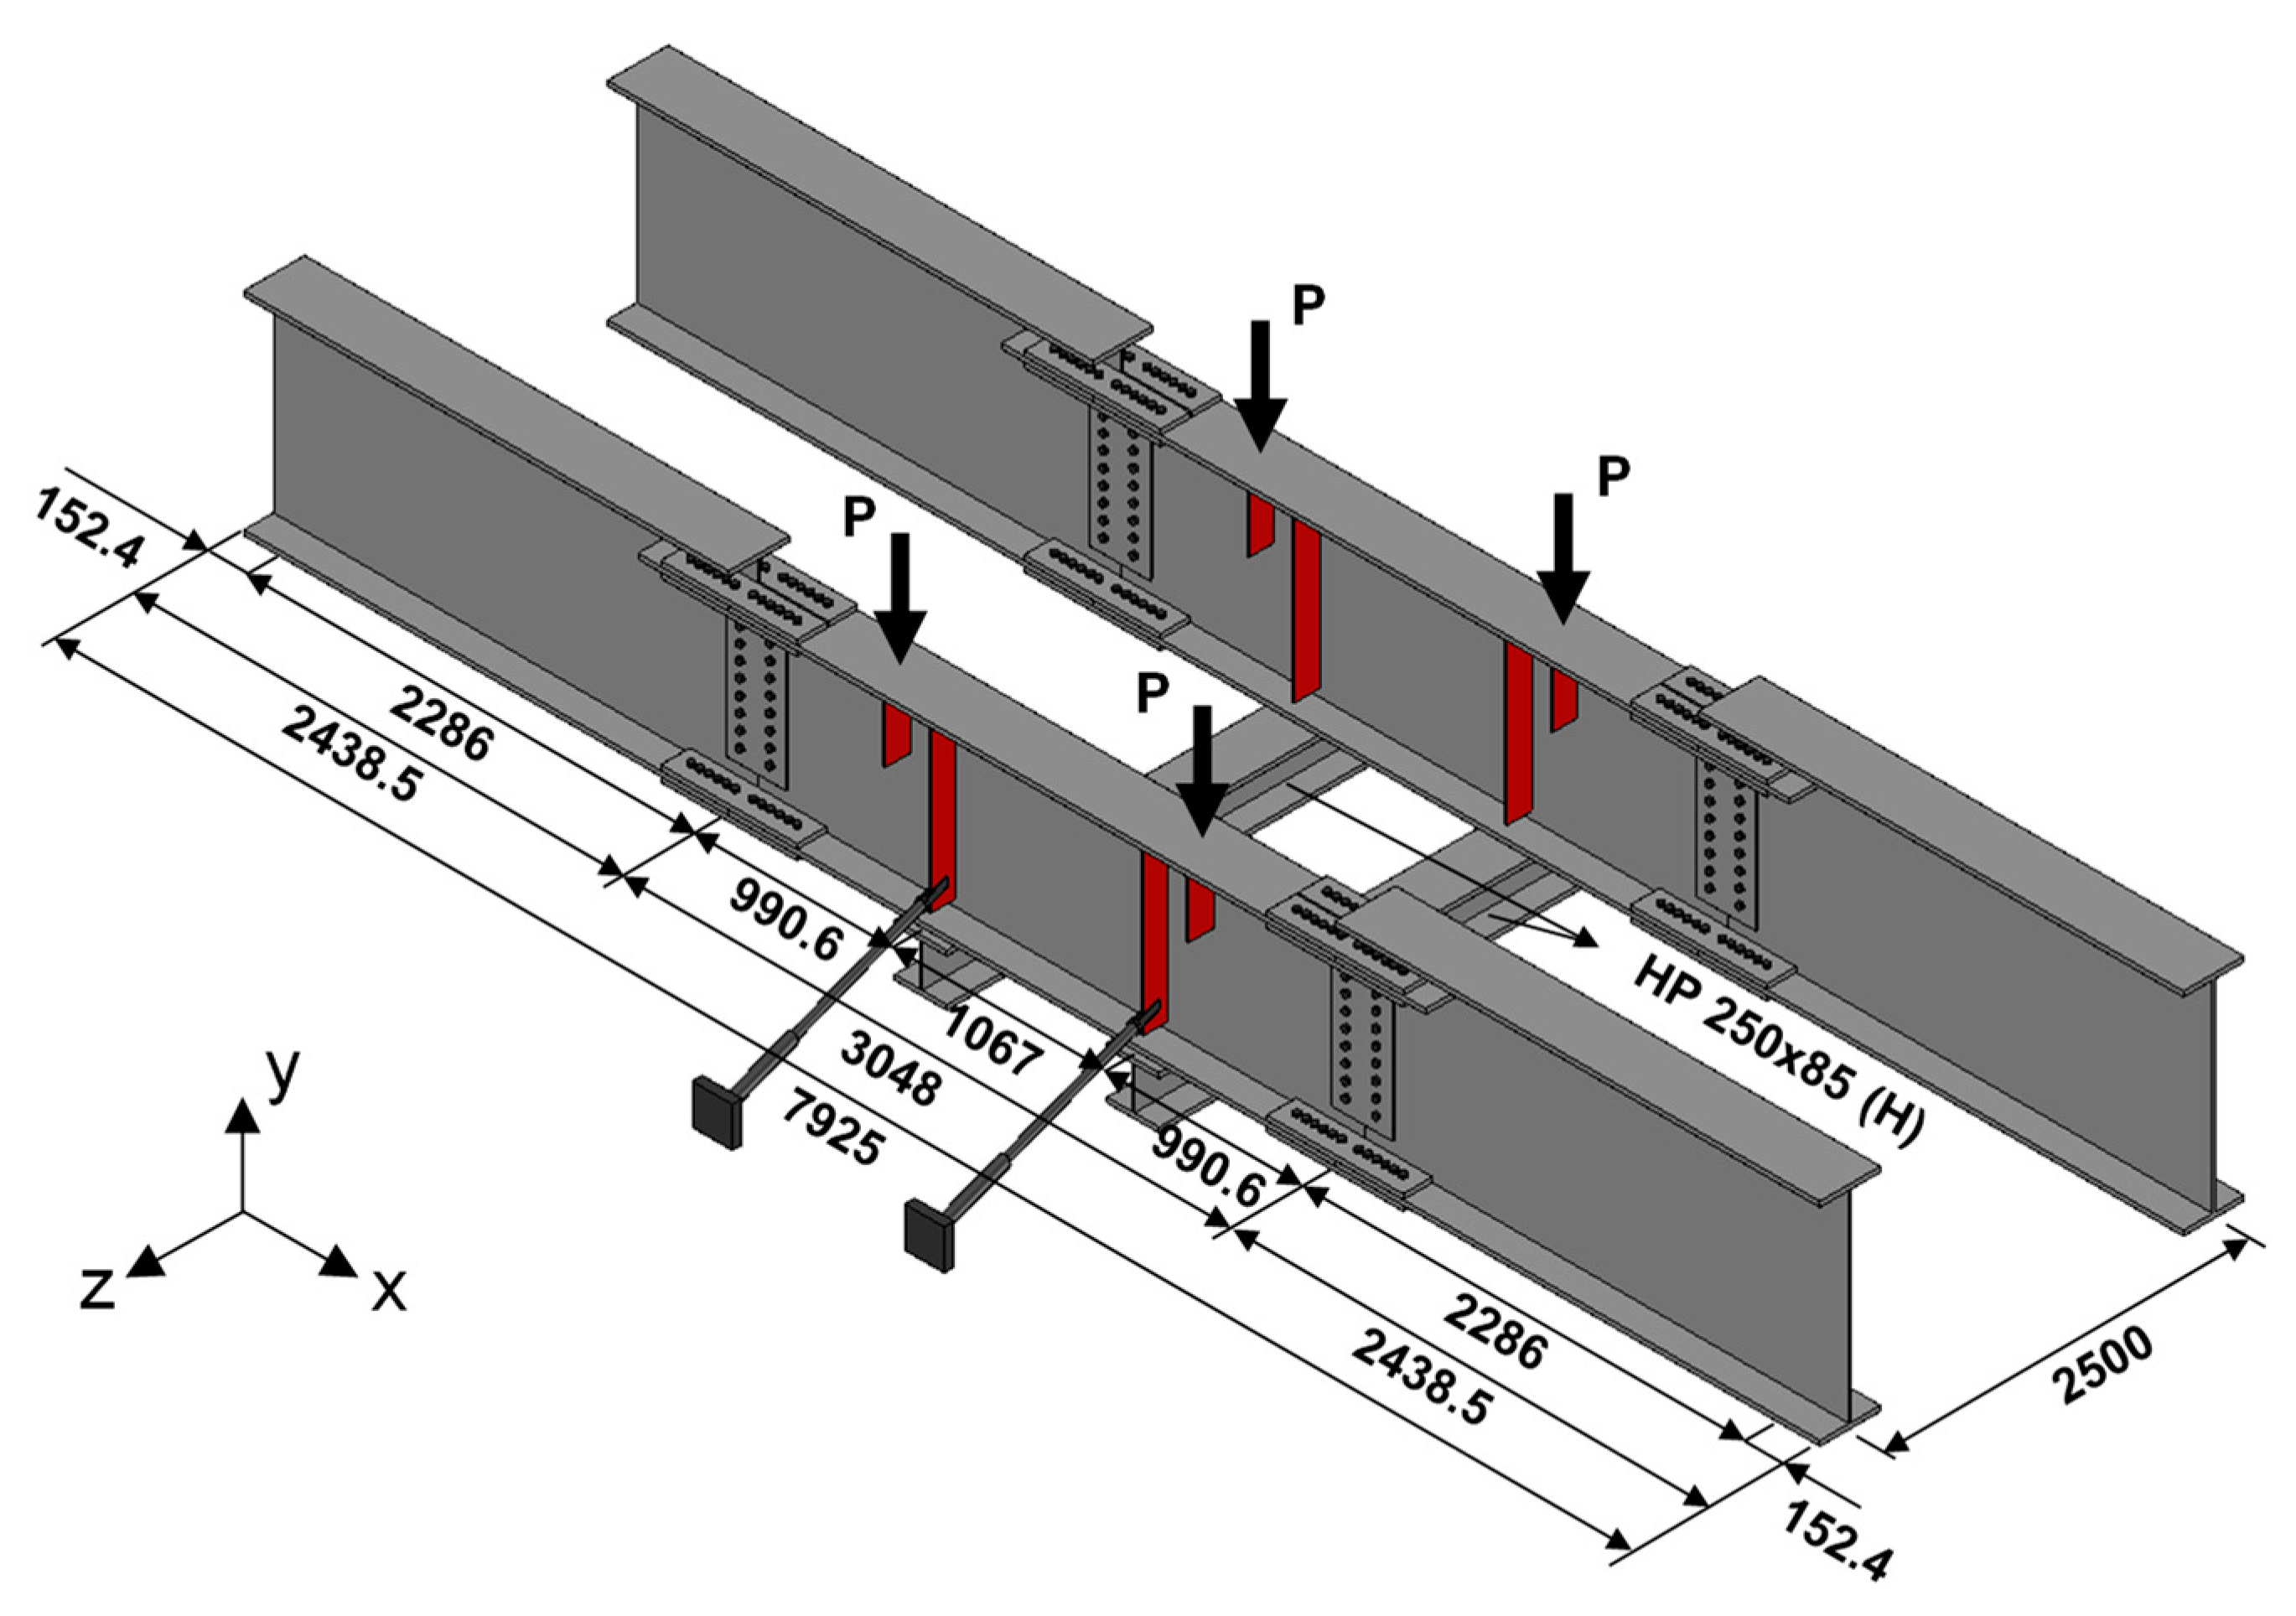
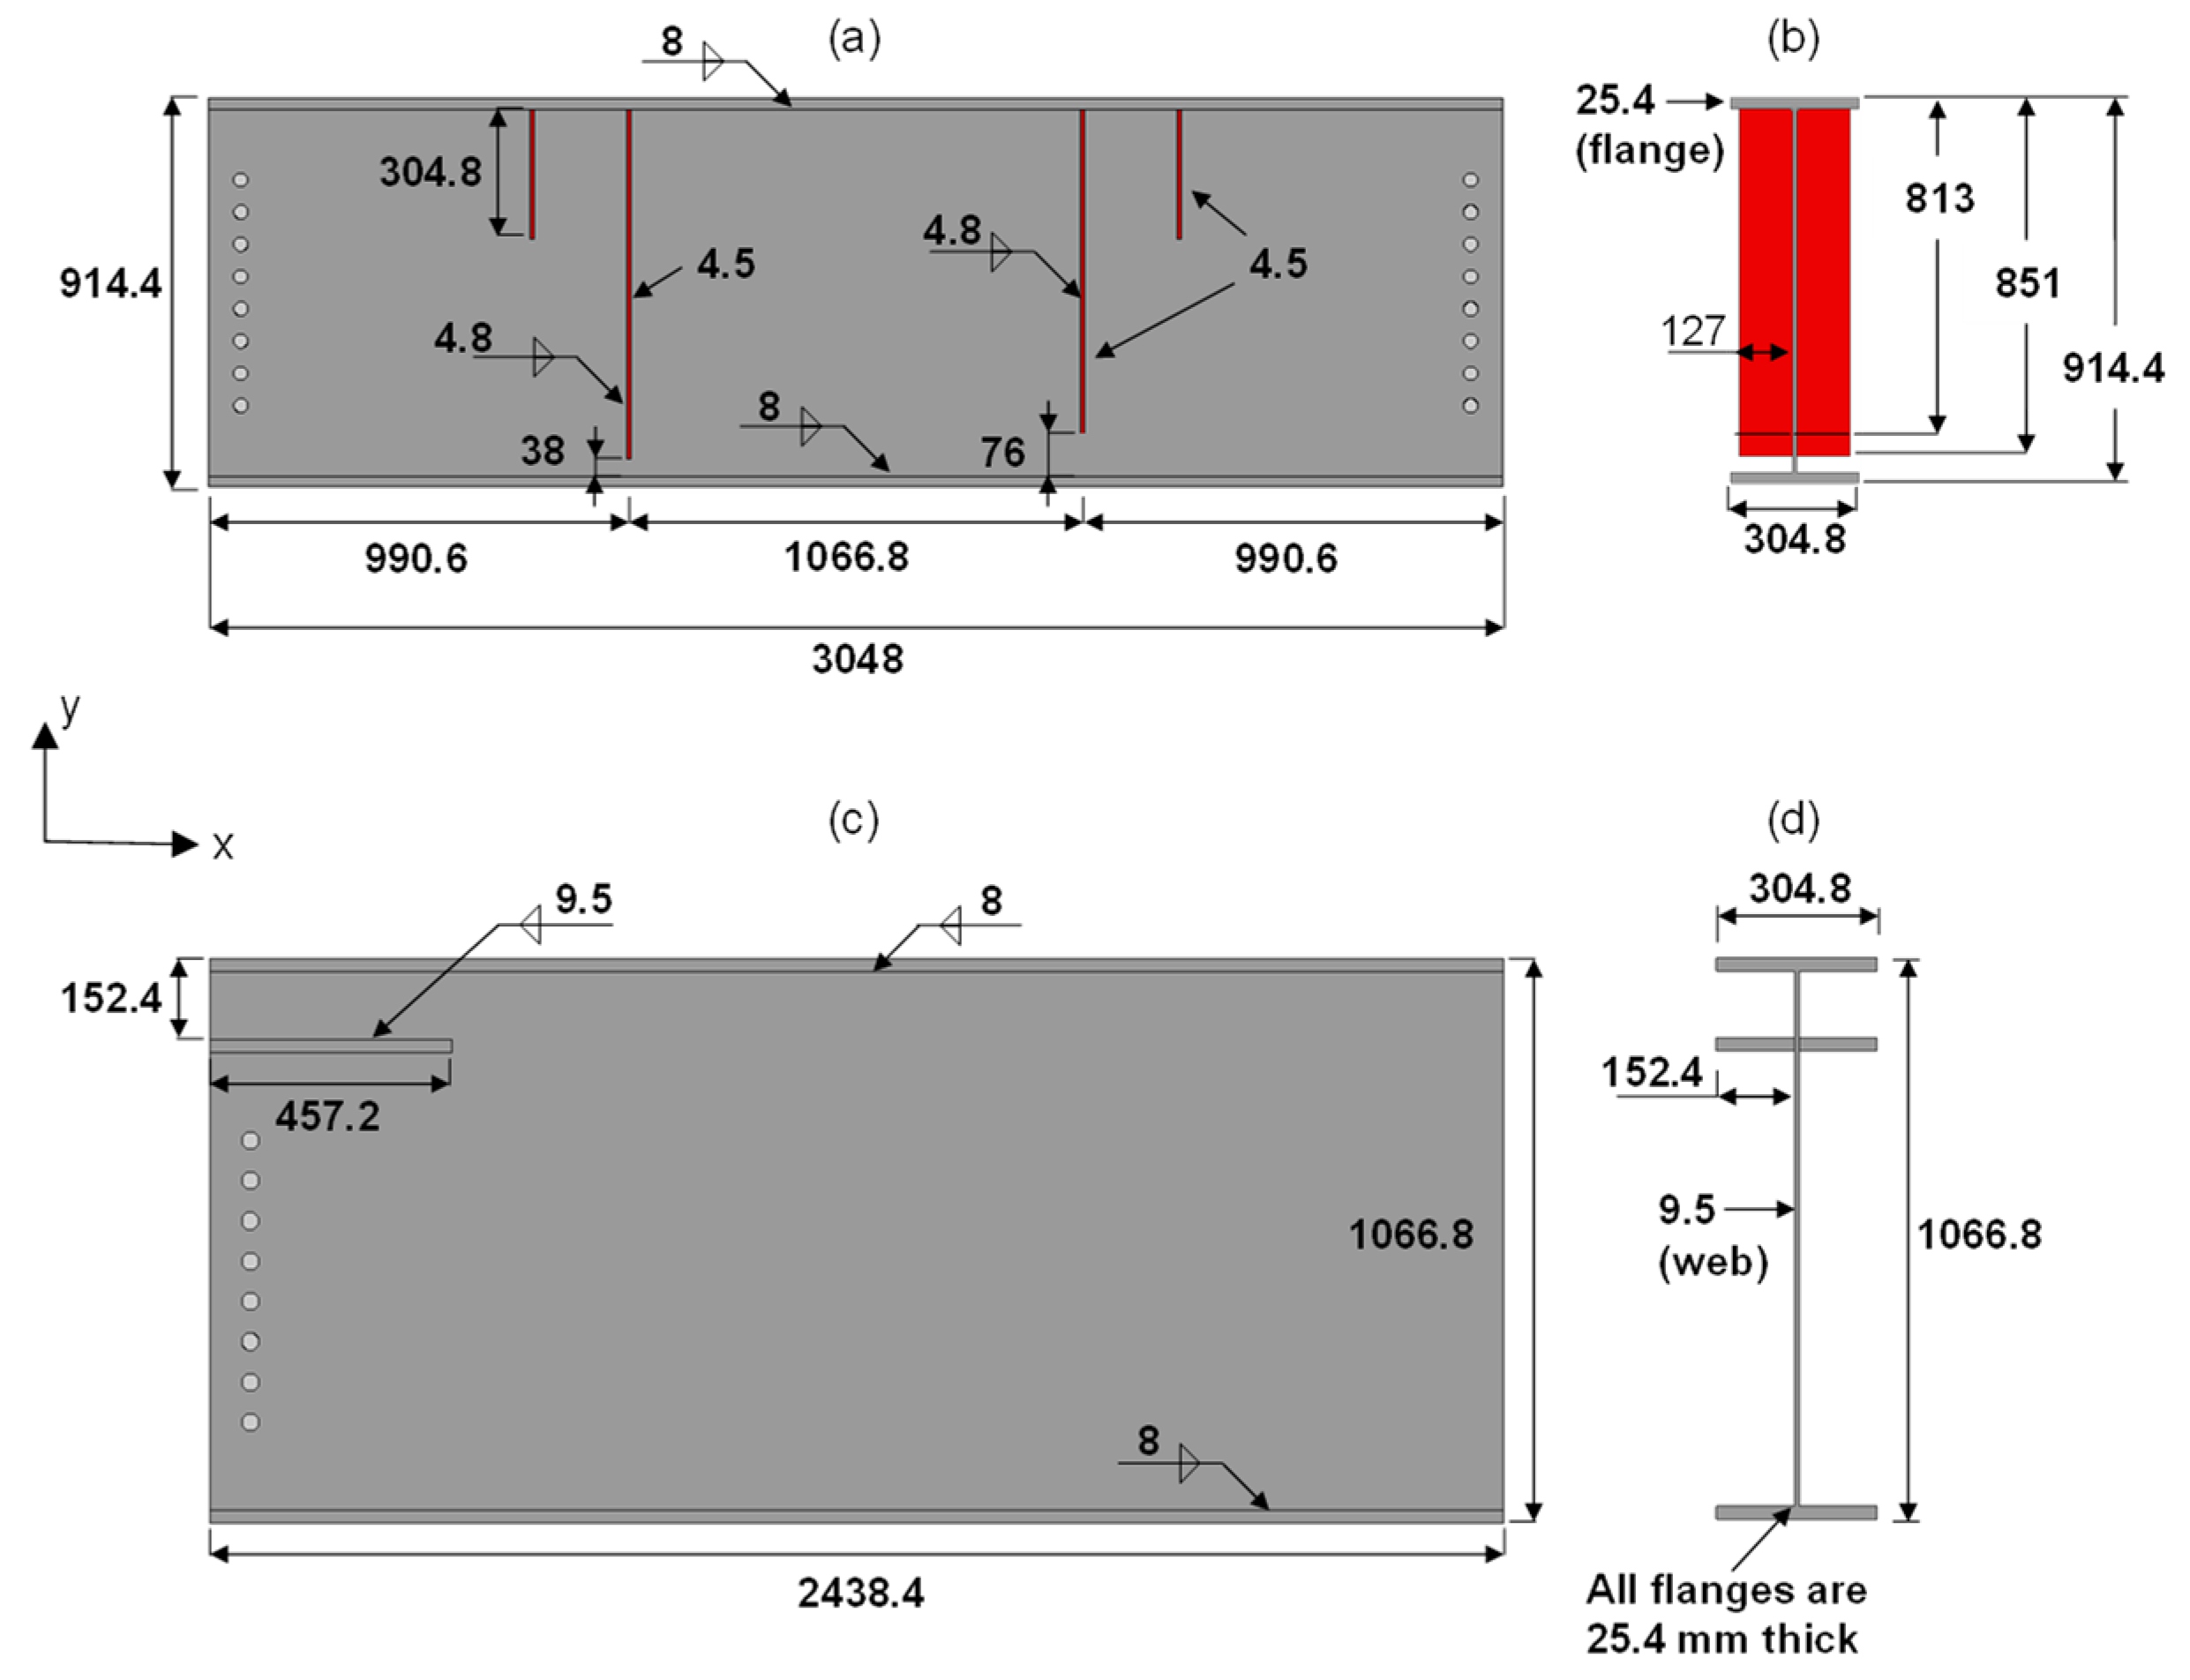
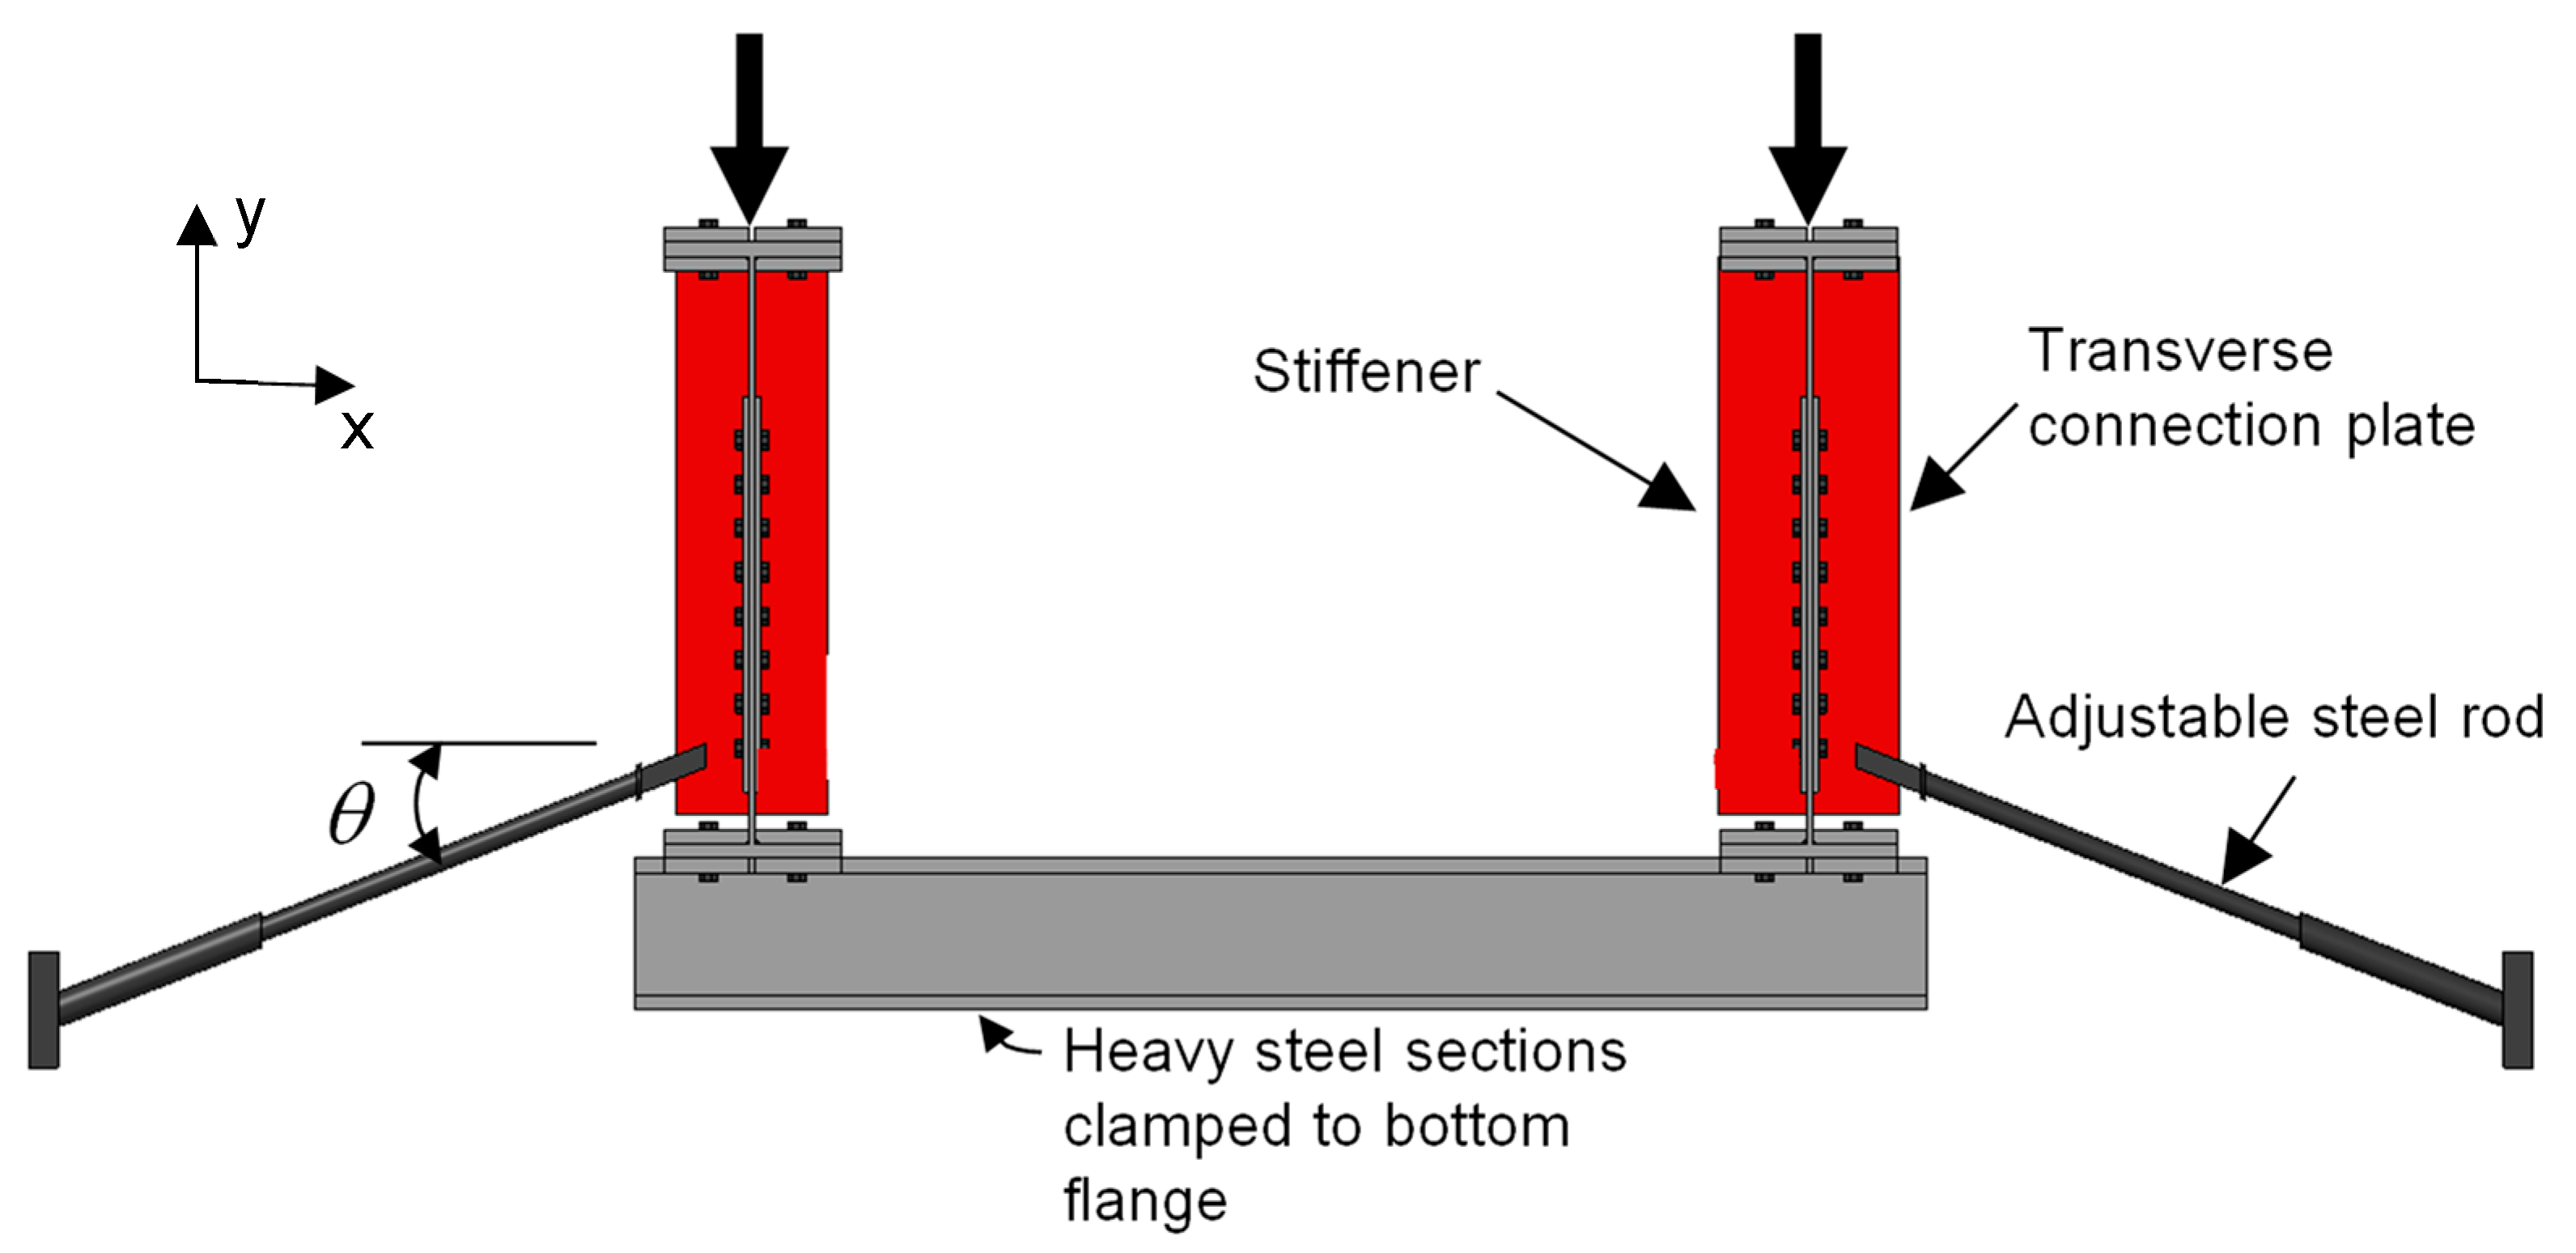
3. Description of the Fatigue Test Setup

The well-known NCHRP 336 [46] fatigue test program on distortion-induced fatigue was selected in this paper to validate the master S-N curve concept, which is a first step before the method, could be applied to distortion-induced fatigue sensitive details of welded steel bridges. This fatigue test program included a total of 12 full-size girders. An I profile beam (Figure 5) with transverse connection plates (stiffeners and supports) was considered for the study, composed of ASTM A370 steel, with a yield strength of 250 MPa. The girders were tested in pairs in order to impose out-of-plane distortion to the girder webs through passive bracings connected to the transverse stiffeners, which in turn reacted to the vertical cyclic loads. Heavy steel sections were clamped to the bottom flanges of the pair of girders aiming at simulating the effect of reinforced concrete (RC) slab decks in bridges top flanges; thus, preventing the bottom flanges from buckling and rotating about their own axes.
Each girder consisted of a 3048 mm long beam located in the middle (Figure 6a,b) and two end beams located at both ends (Figure 6c,d), which were reused for all tests. The end beams were attached to the test beams by means of bolted connections. The test beams were 914.4 mm deep and had 9.5 mm thick web plates. The web plates were welded to the 25.4 mm flange plates with 8 mm fillet welds. Each test beam had 9.5 mm thick transverse stiffeners welded to the web and the top flanges with a 4.8 mm fillet weld. The welds were placed on both sides of the stiffeners and all around the stiffener’s terminations. In the NCHRP 336 fatigue program, two nominal web gap sizes were investigated by Fisher and co-authors: 38 and 76 mm (Figure 6a), although their real dimensions may vary due to construction tolerances. The nominal size values were measured from the bottom edge of the transverse stiffeners to the top side of the bottom flanges. The bracings were made up of 63.5 and 76.2 mm threaded pipes, were adjustable, and placed on the external lateral edges of the beams, as shown in Figure 7.

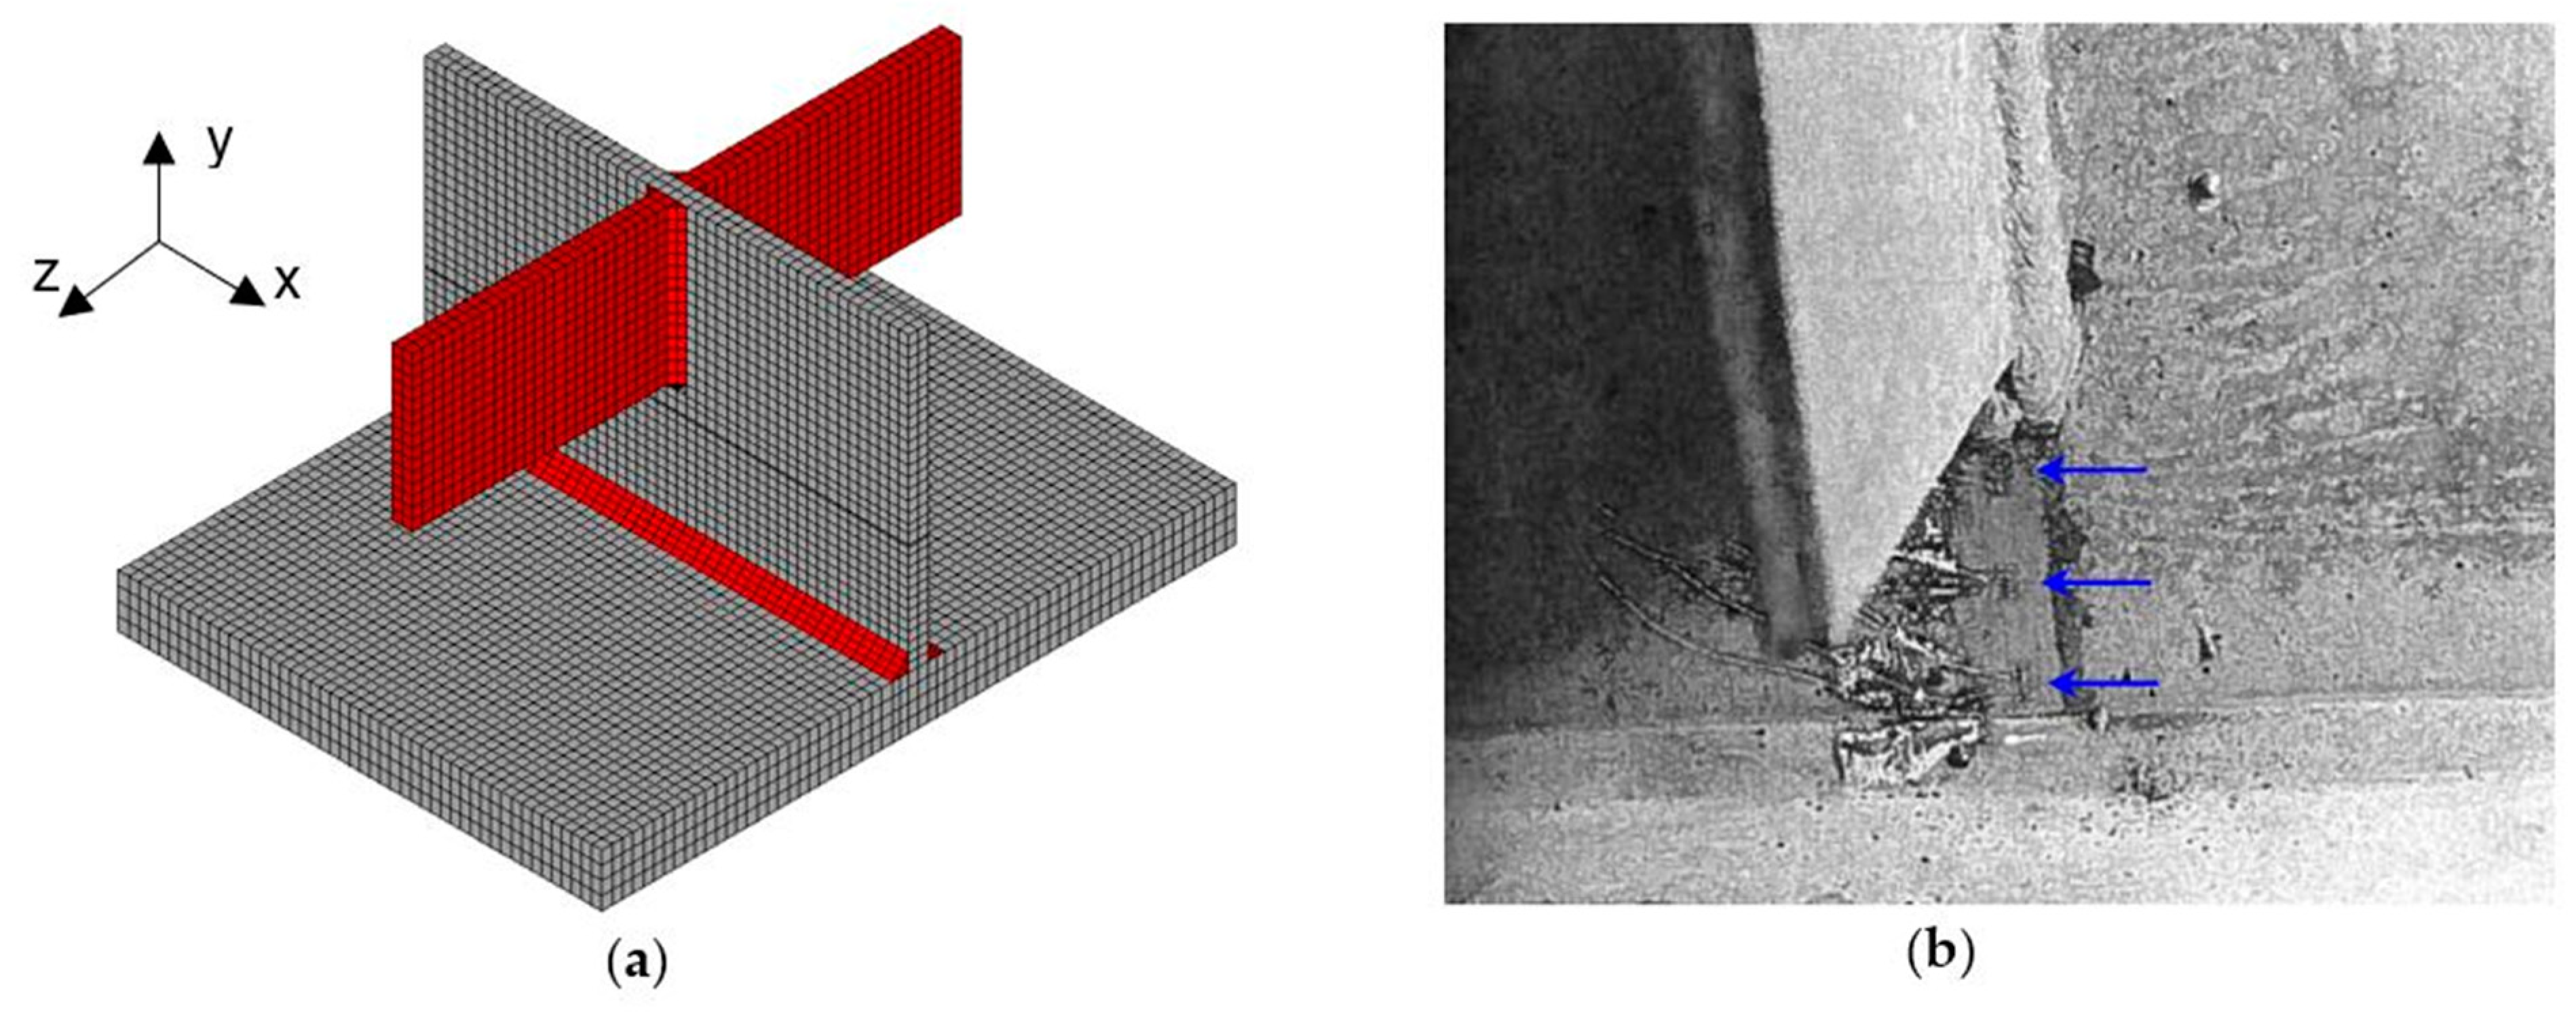
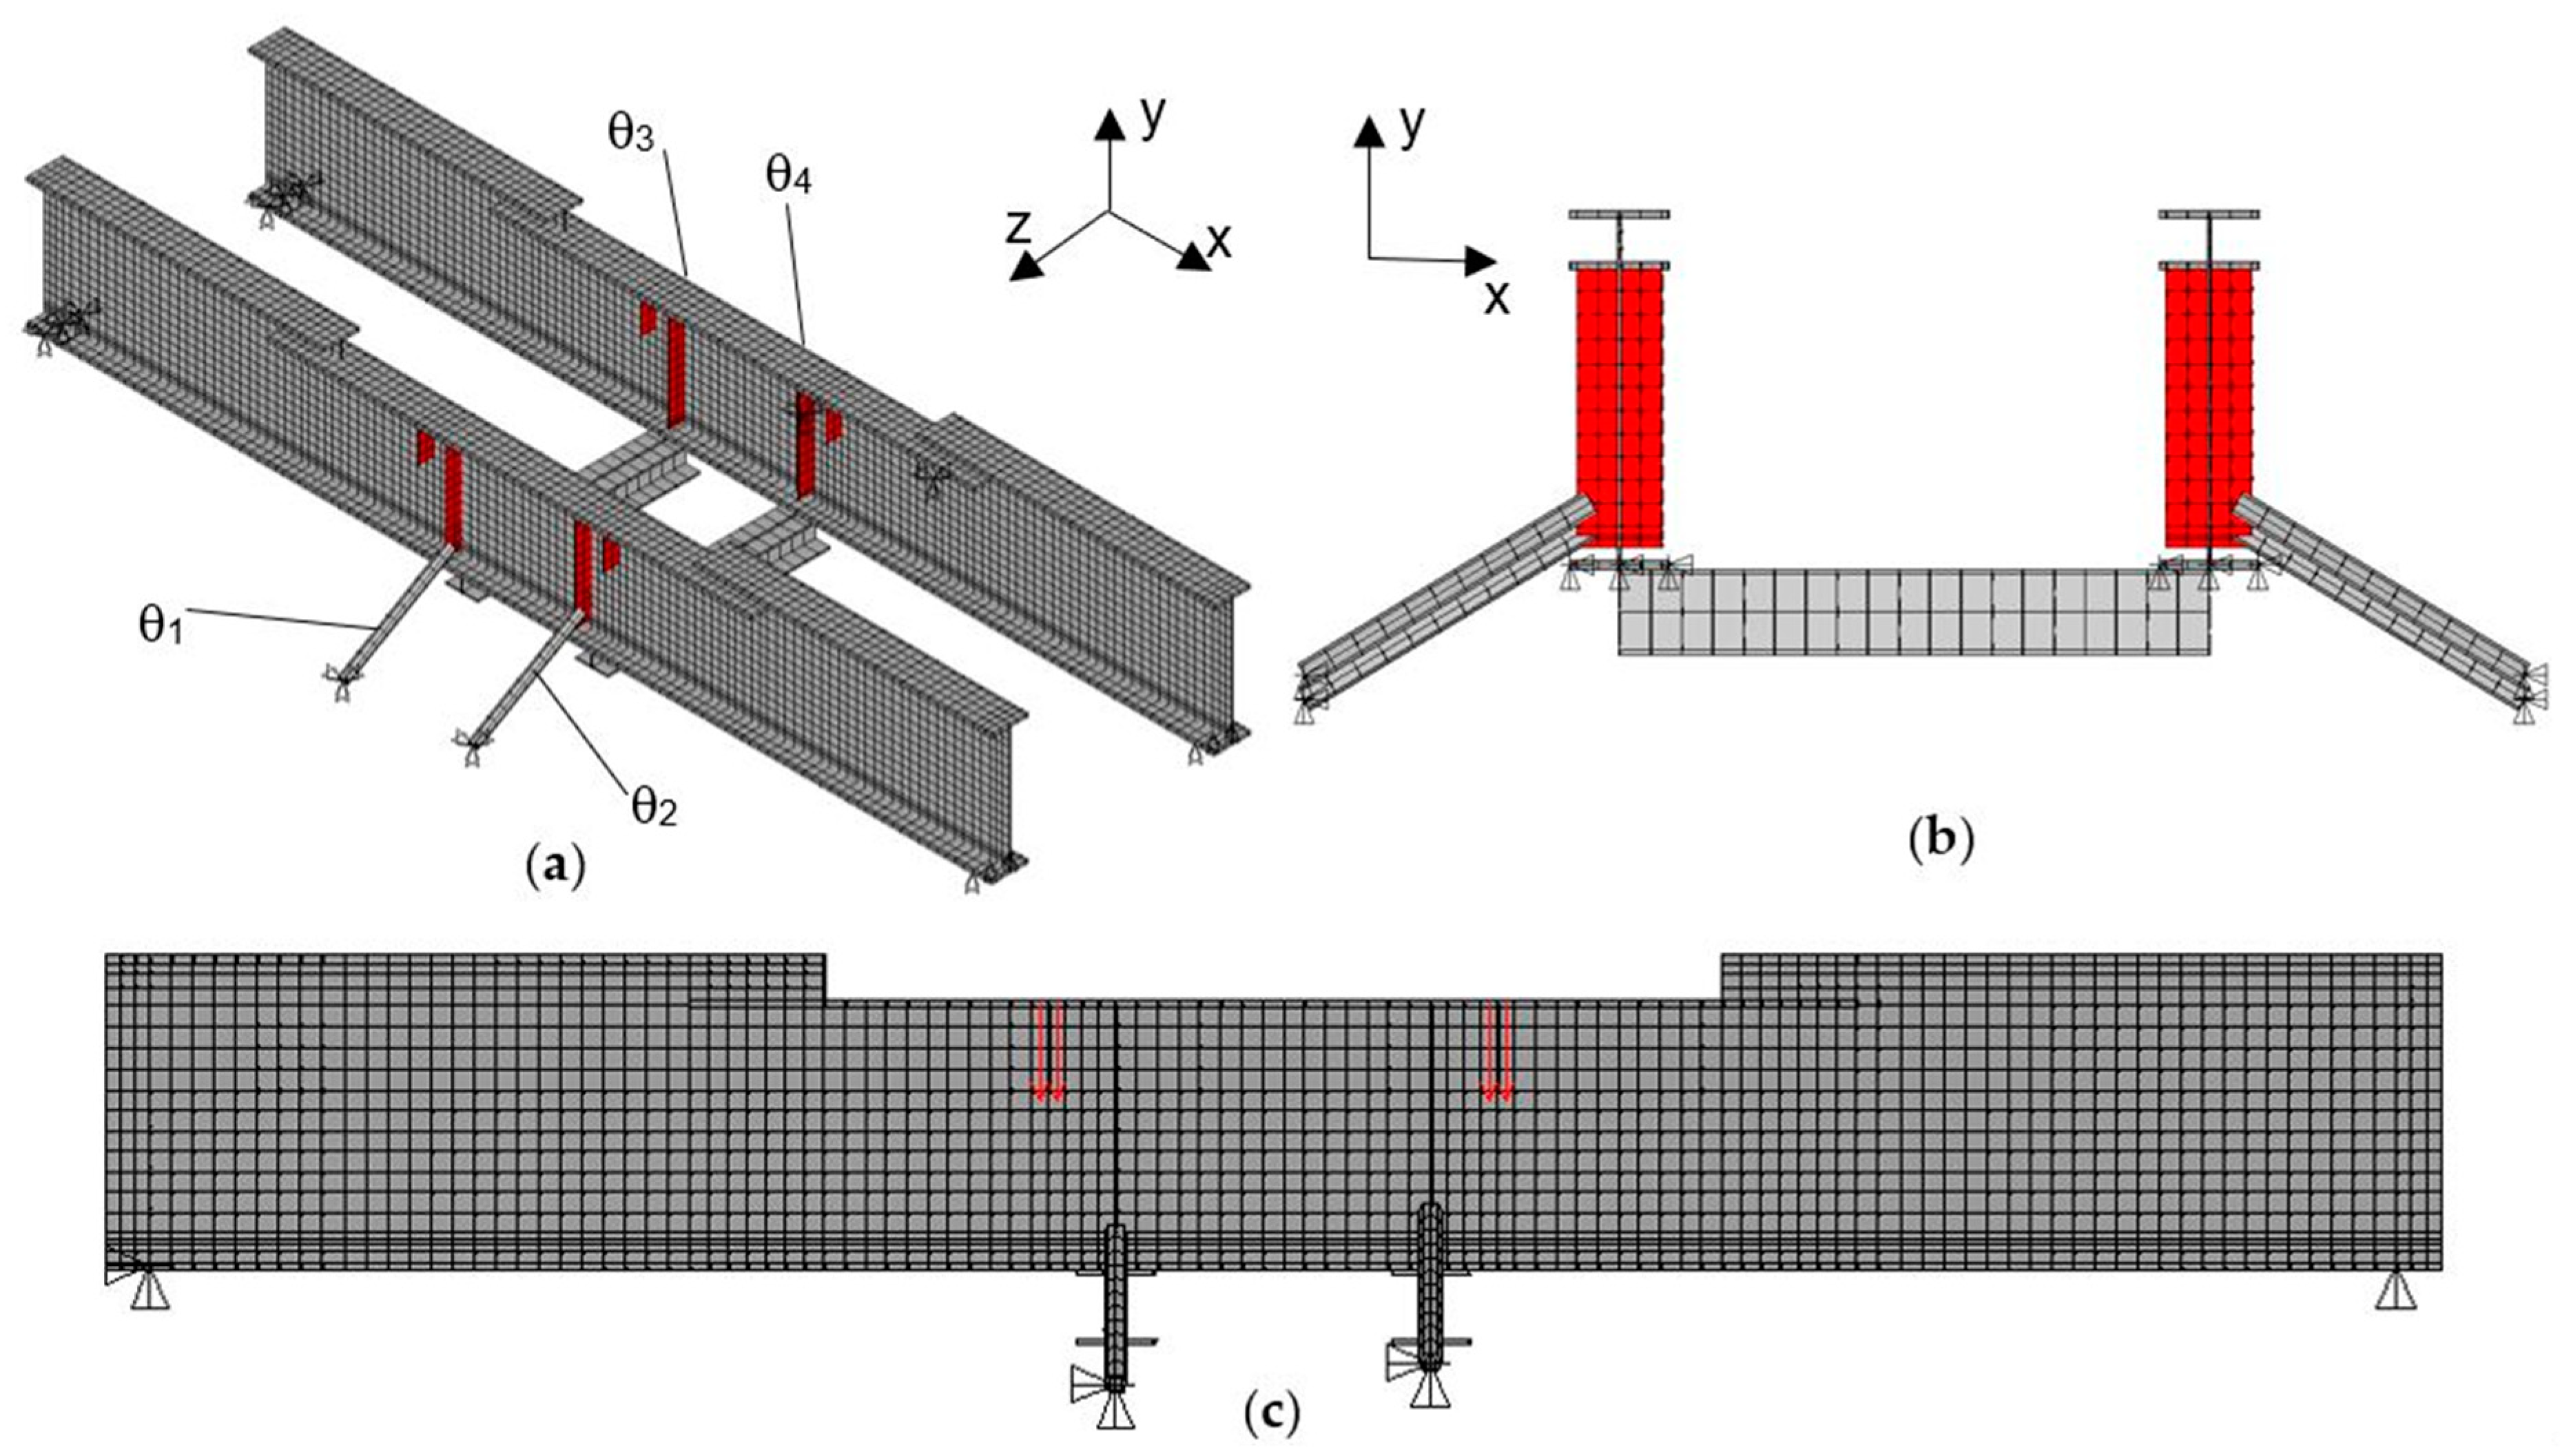
3.1. Description of the Numerical Models

The numerical model developed for the fatigue strength analysis of the welded joint detail of a beam was based on the finite element method and implemented in the ANSYS program. The elements that make up the structural system were represented by finite shell elements. It is noteworthy that the authors performed the model with this element (shell), since they have been widely used. In total, six shell global numerical models and seven local sub-models were created. A shell global FE model and a local solid sub-model are shown in Figure 8 and Figure 9, respectively. The modelling of the bolted connections was disregarded due to a lack of information on the report. The modelling strategies for the local sub-model and the bracings followed the same approaches described in previous sections. The concentrated loads were distributed over four areas of 264 × 114 mm dimensions each. For the tests performed for 41.36 MPa in-plane stresses at the midspan, loads P were set as equal to 122 kN, whereas for 82.74 MPa, they were set as equal to 230 kN.
The fatigue resistance of these web gap details was studied by Fisher and co-authors [47] by measuring the stresses parallel to the y-axis (Figure 9b) extrapolated to the weld toes of the gap with strain gauges. At the time of the herein referred NCHRP fatigue program (Fisher et al. [47]), the extrapolation rules to determine the hot-spot stress were not well established for plate-type structures. Therefore, Fisher and co-authors [47], have determined the fatigue resistance based on a modified extrapolation rule, which may vary per test, i.e., the exact location of the strain gauges used to measure stresses at the web gap cannot be derived from the reports for all tests, although the extrapolated stress is readily available for all S-N data points. Therefore, the fatigue resistance was expressed in terms of an extrapolated out-of-plane stress range, which was determined based on simple linear extrapolation of the measured stresses in the y-direction (Figure 9a). Herein, to differentiate these extrapolated values from the conventional hot-spot stresses, they are named ‘modified hot-spot stresses’.
For the FE model shown in Figure 8, a general mesh size of 50 mm was globally adopted, while for the solid sub-model the average size ranged from 5 mm for volumes with irregular geometry, e.g., weld corners, to 10 mm for regular parts. The local sub-model employed solid quadratic elements (Figure 9a), as stated above. Moreover, the other elements, as well as those already described, were all modelled using the finite element method, taking advantage of the information available in the literature. It should also be noted that initially the FE models were created based on the nominal design sizes specified in the steel structure drawings, which included the dimensions of the steel plates and the nominal sizes of the weld leg. All fillet welds and their corners have been modelled with a nominal 45-degree flank angle. Moreover, the material used was modelled with Hooke’s linear elastic law, assuming an isotropic behaviour, and as for the self-weight, this was disregarded since only the live load is relevant for the calculations in the fatigue analysis process. Regarding the boundary conditions, each girder was simply supported at both ends. The bracings were connected by means of a hinge to the stiffeners, while being fixed in the three translation directions (x, y, and z) in the other end.

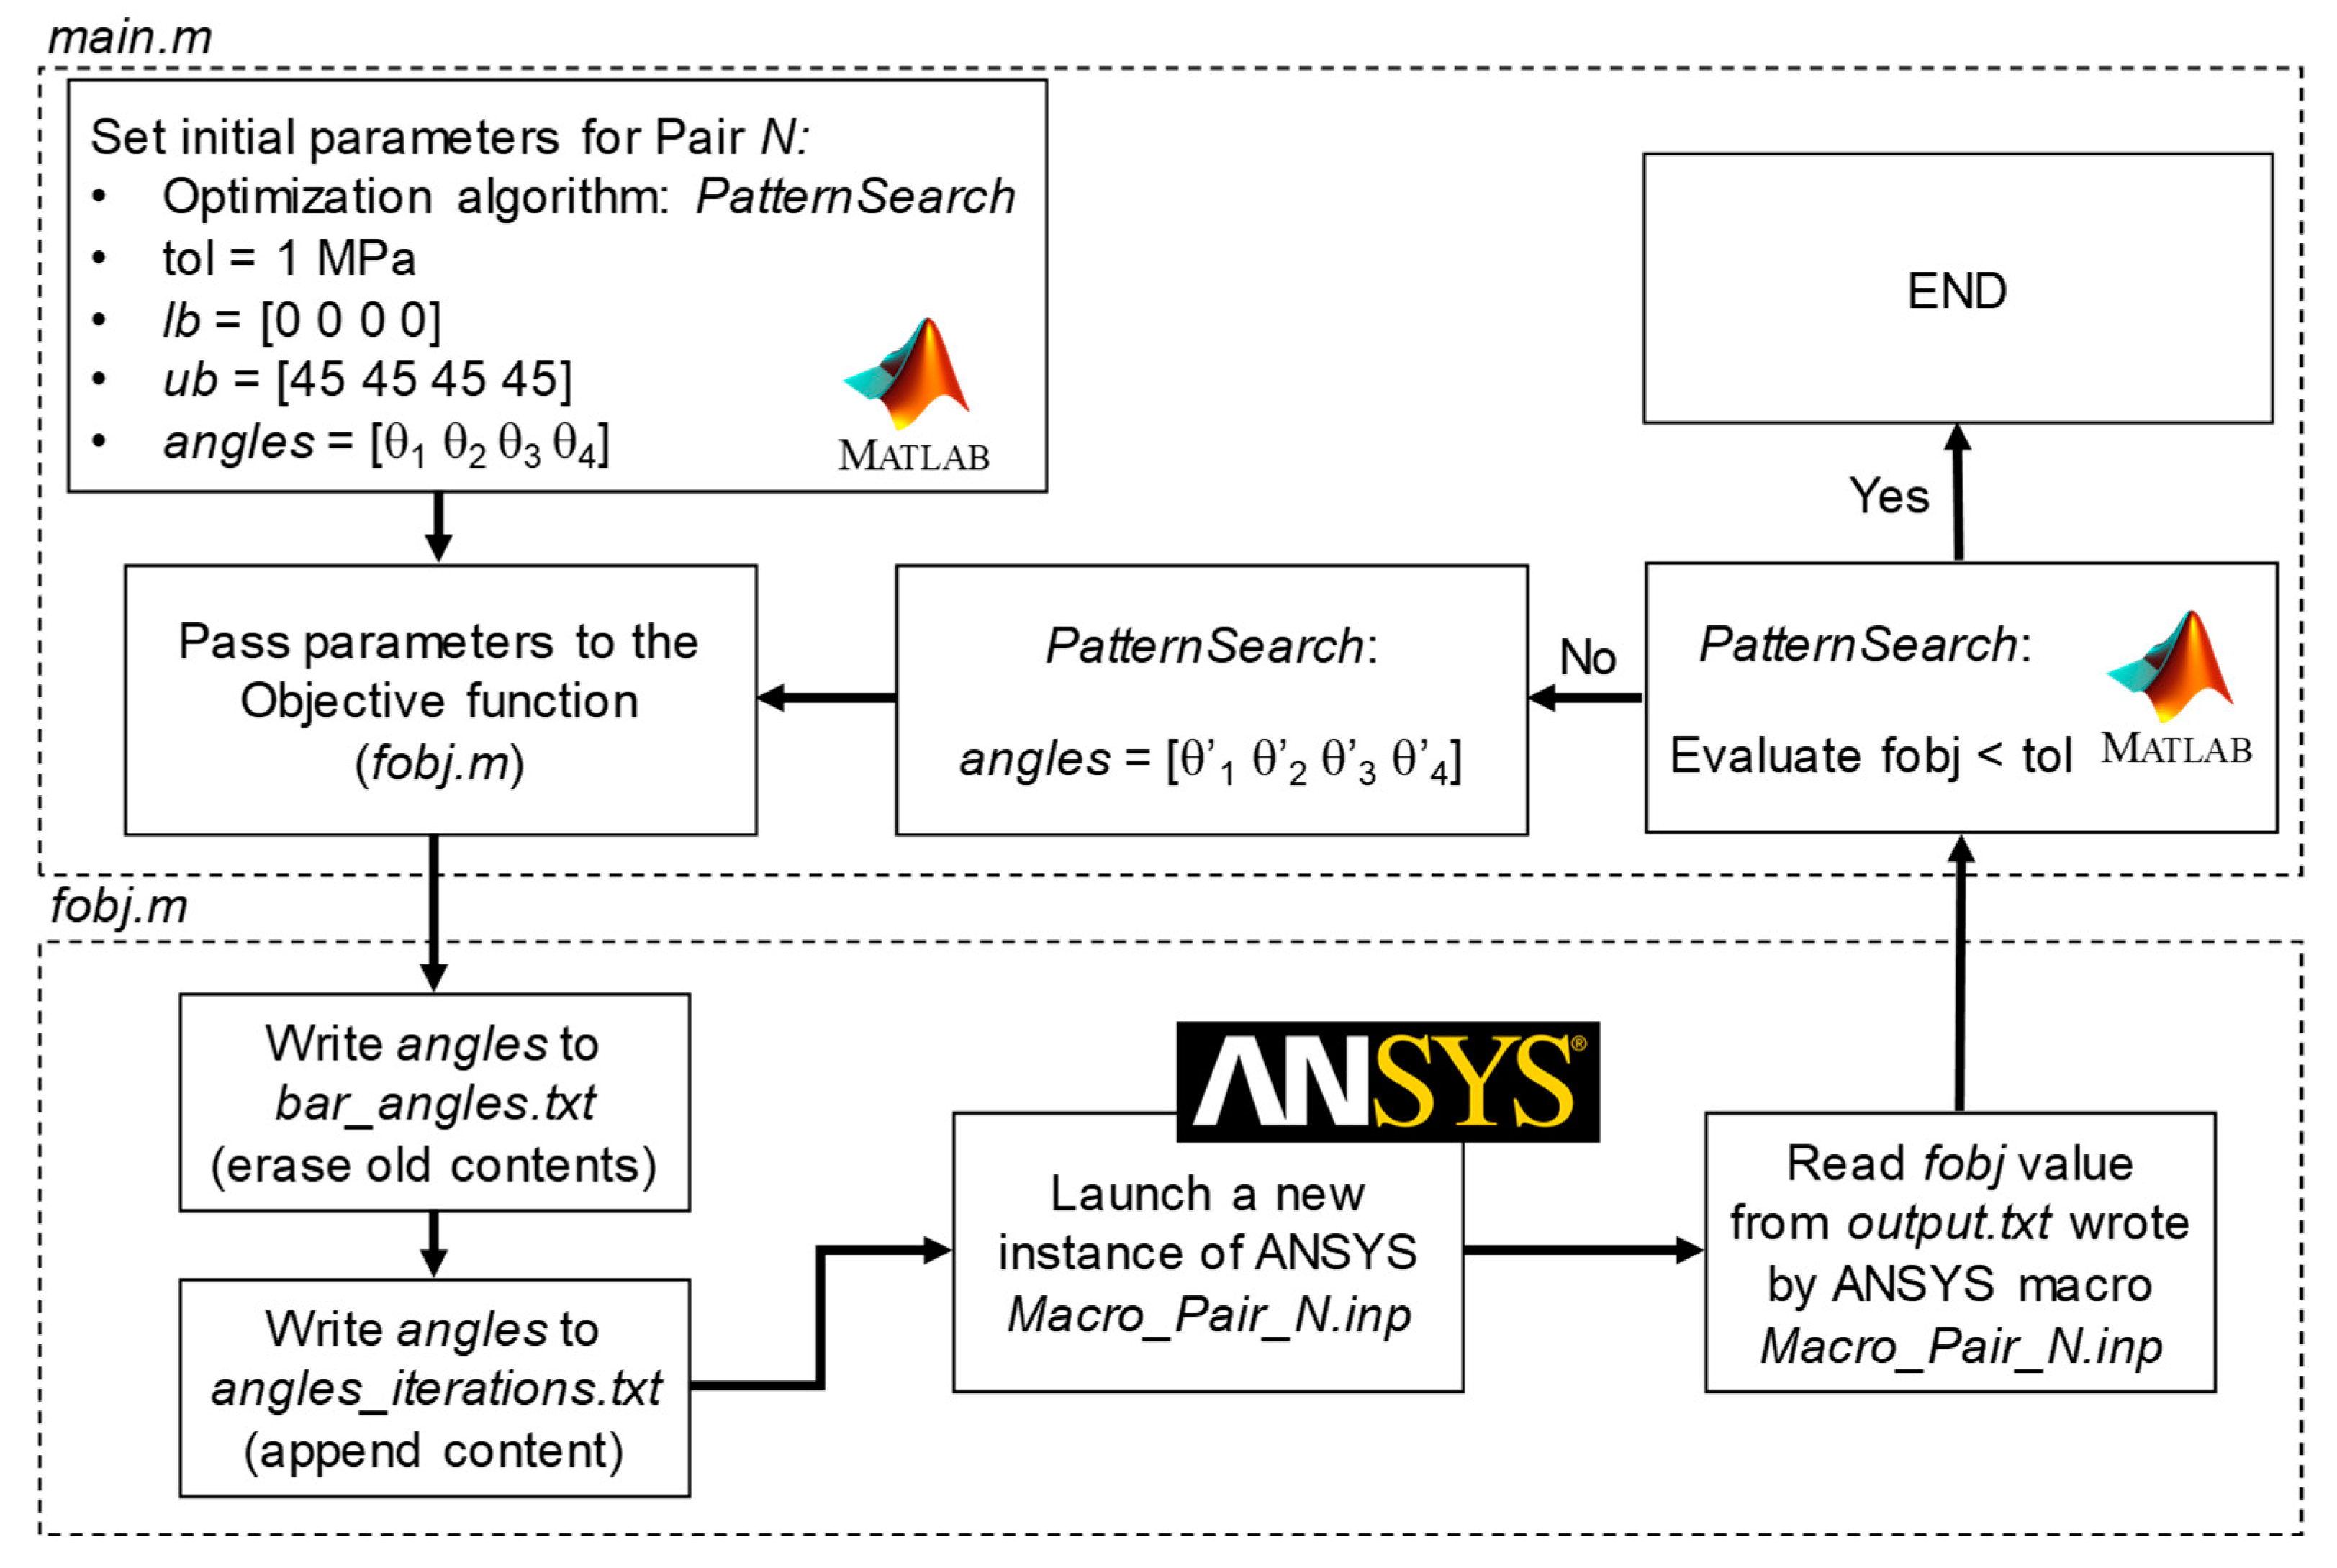
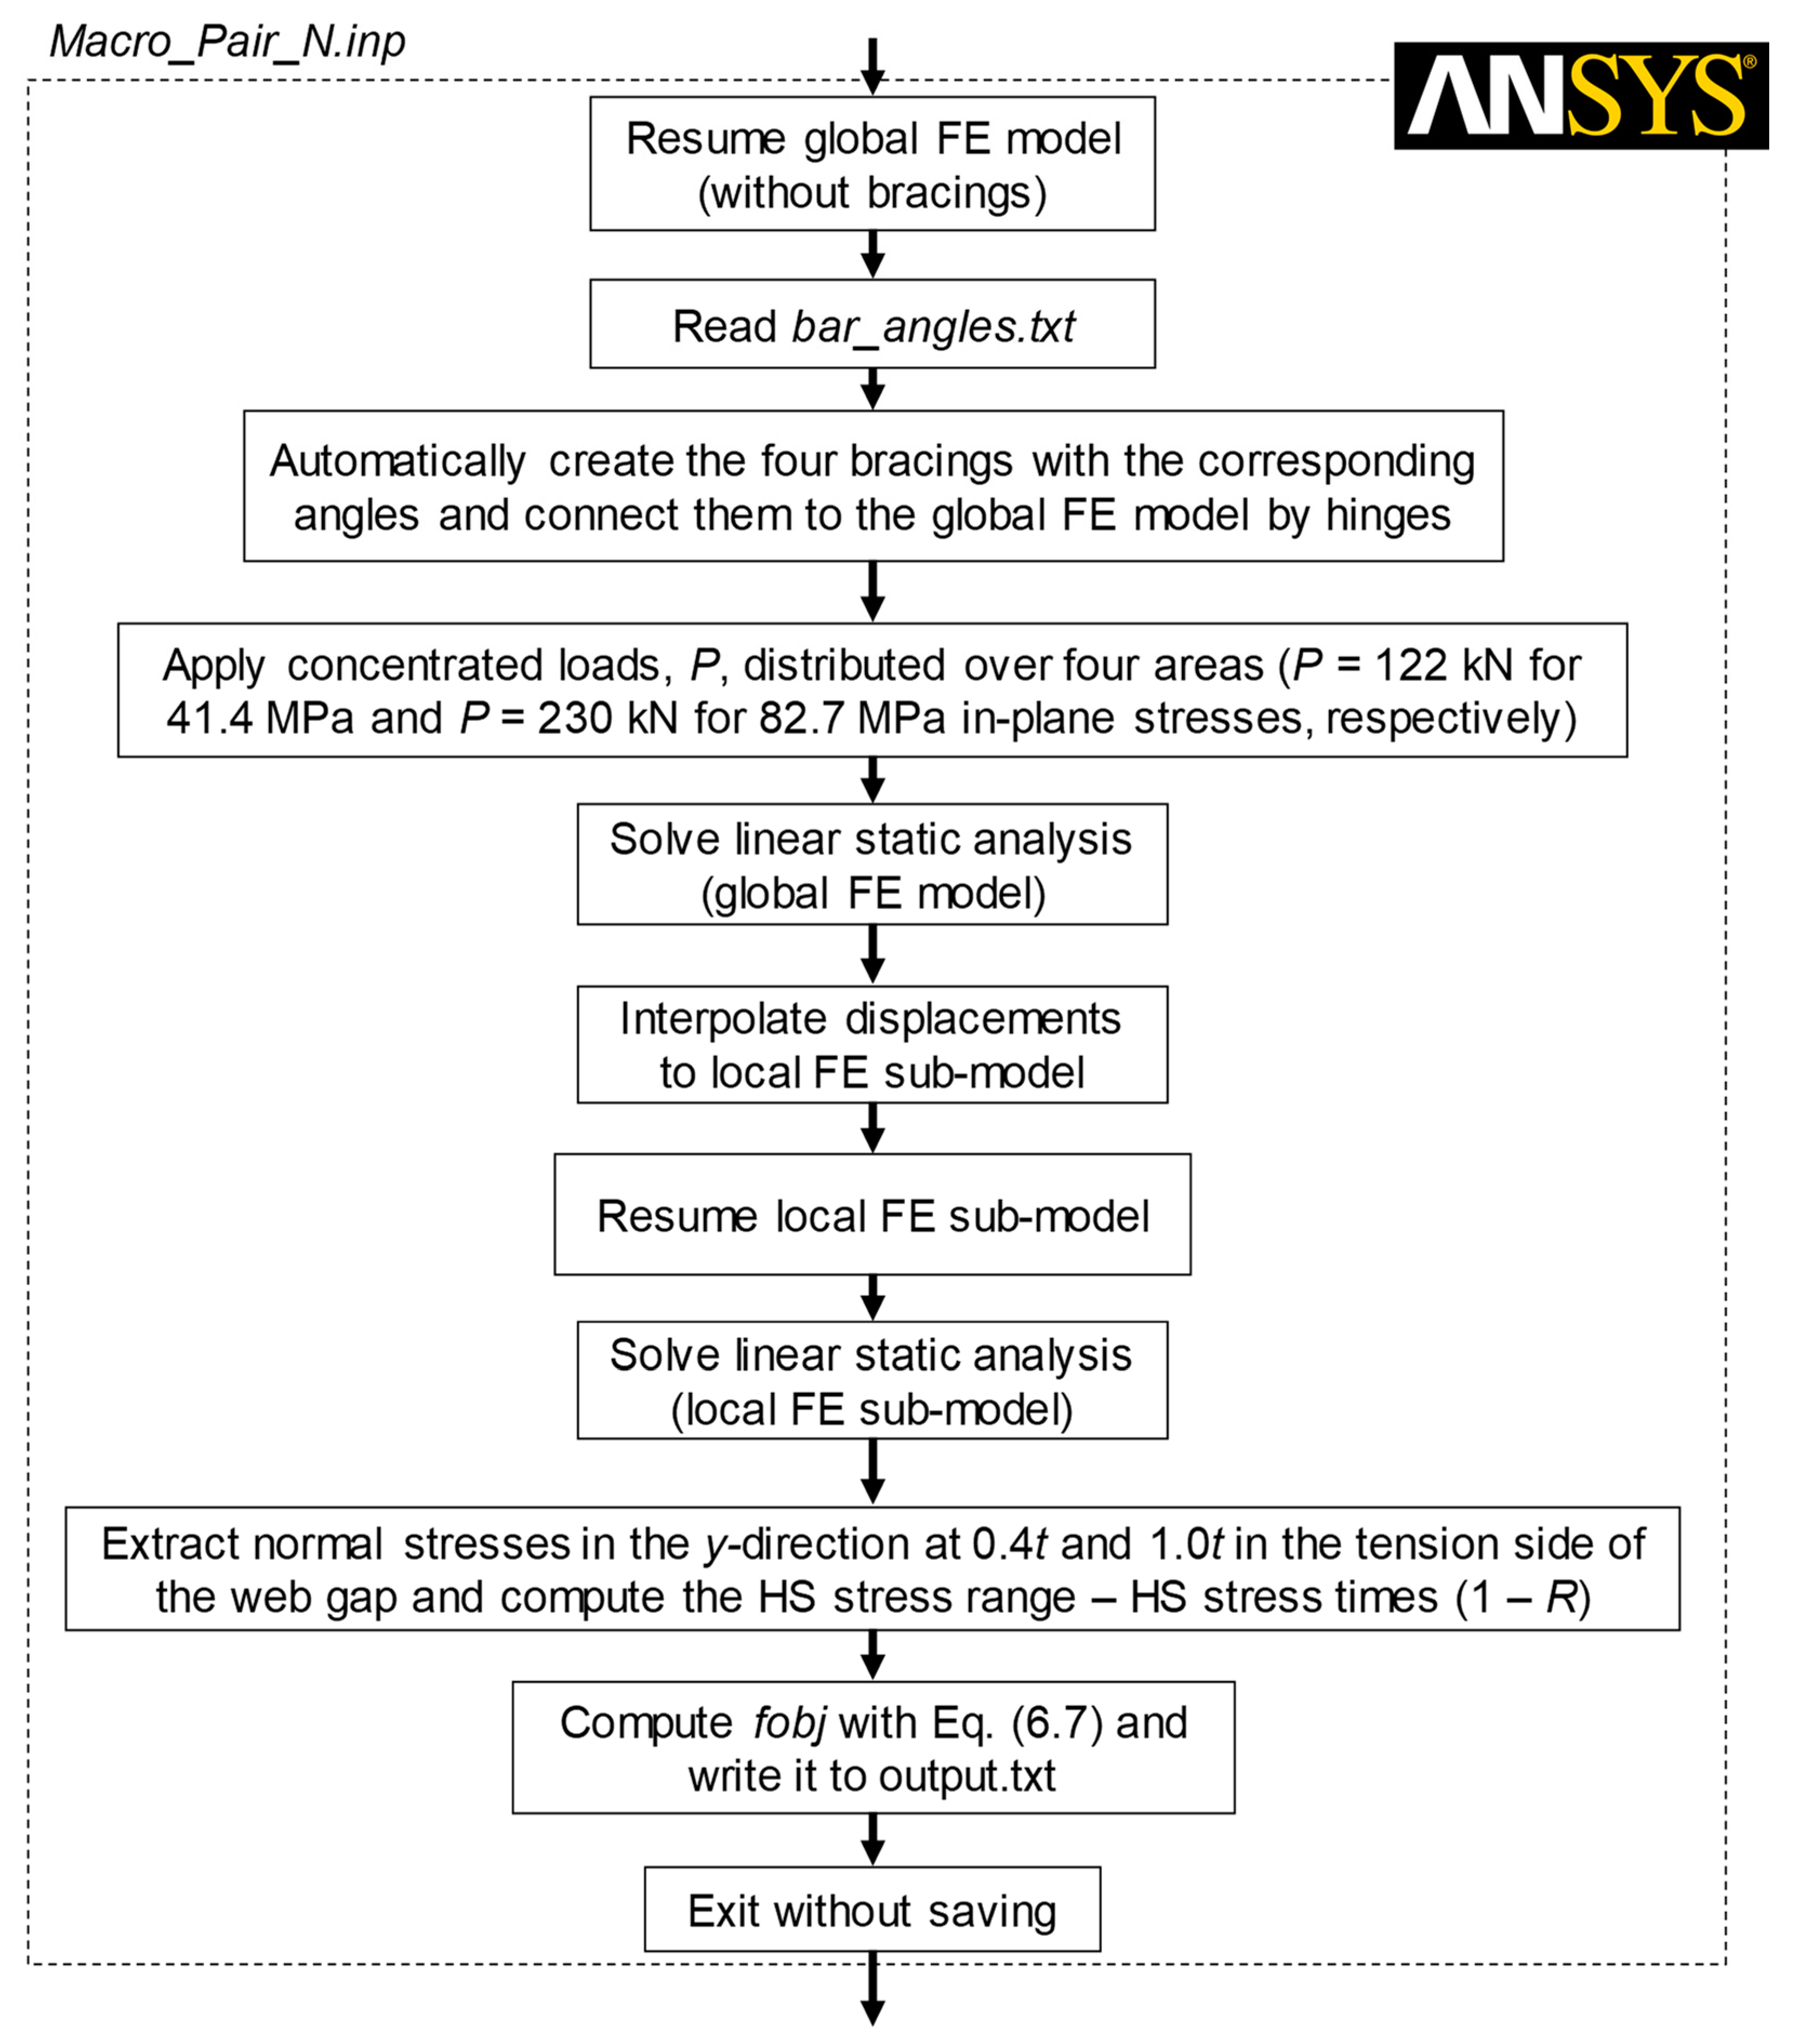
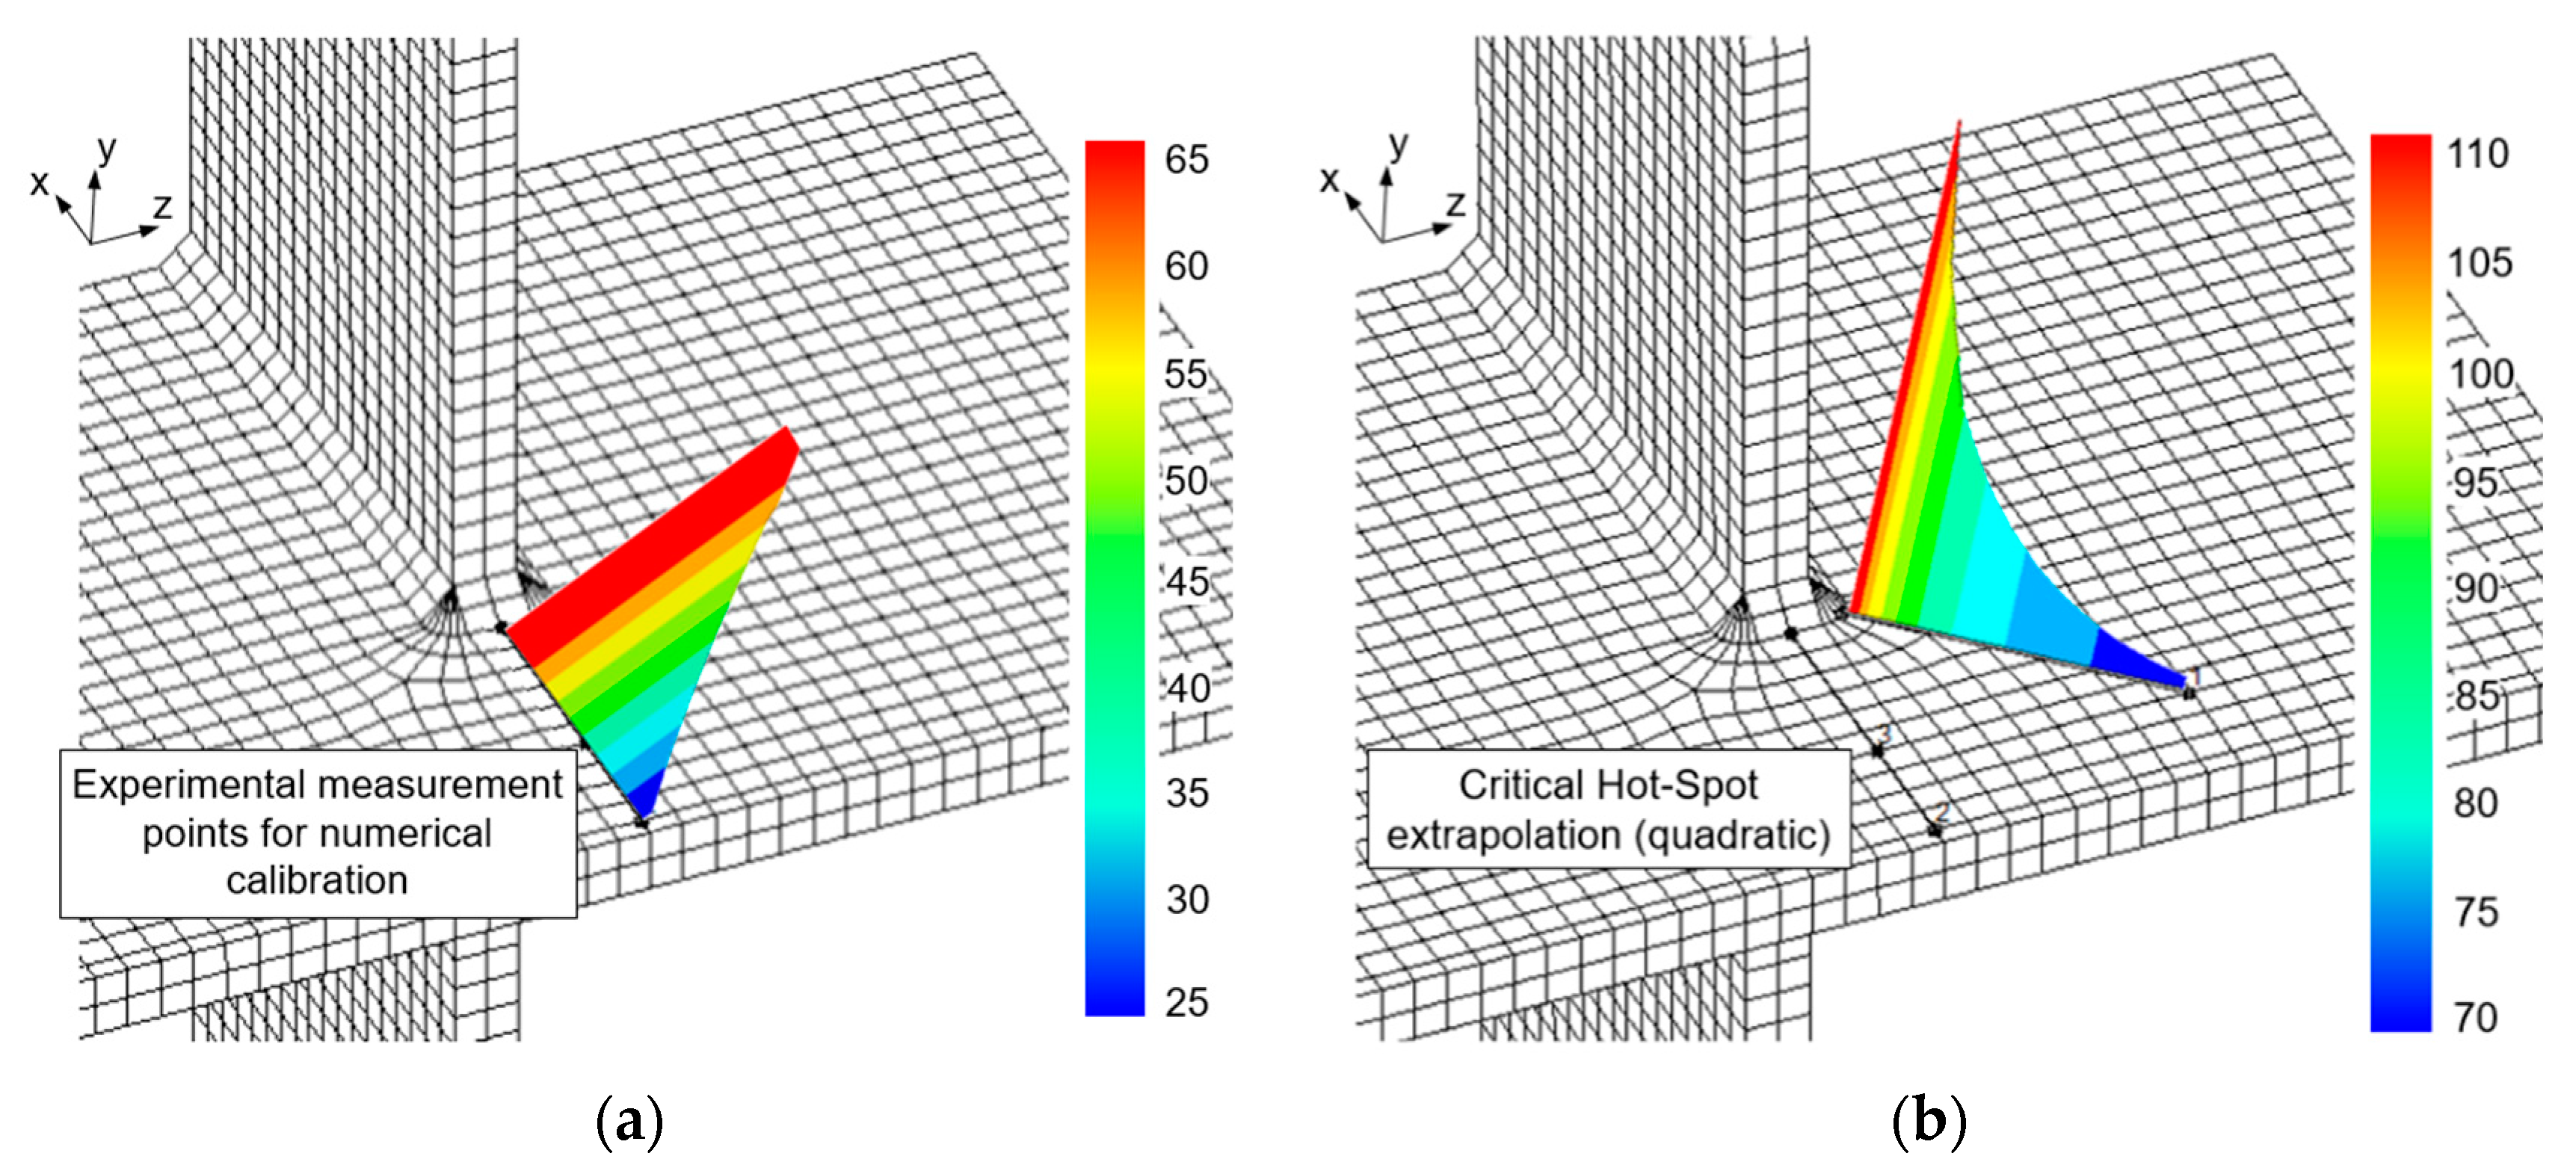
3.2. Numerical Model Calibration Methodology

In this section, the numerical calibration process performed in the present research is presented, taking into account Equation (20) aiming at identifying the bracings orientations (θ1 to θ4) which were not explicitly given in the NCHRP fatigue program report [47]. The process is based on a black-box numerical optimization algorithm available in MATLAB Optimization Toolbox (Figure 10), referred to as PatternSearch, which is suitable for dealing with problems without known derivatives (Audet and Kokkolaras, ref. [48]). The algorithm is put to work together with ANSYS Mechanical in a structured framework, aiming at minimizing the objective function defined by Equation (20) consisted of the sum of the squared differences between the observed and computed modified hot-spot stress ranges (MHS) which should be below a predefined tolerance of 1 MPa. In addition, the algorithms were designed to be able to apply a post-processor, developed by the authors in reference [6], for mesh insensitive or equilibrium equivalent structural stresses computation during fatigue induced distortion of welded joints.
f o b j = i = 1 N ( Δ σ M H S , O b s e r v e d Δ σ M H S , C o m p u t e d ) 2 Tol . = 1   MPa
At first, an initial set of angles for the bracings is indicated (θ1, θ2, θ3, and θ4) with values limited by the vectors lb and ub, standing for lower bound and upper bound, respectively, which were adopted between 0 and 45 degrees due to geometric constraints. These values are passed to “fobj.m”, which is responsible for erasing the contents and writing it to file “bar_angles.txt”. The set of angles in question is also appended to “angle_iterations.txt” for register purposes. Then, an instance of ANSYS Mechanical is launched with the macro “Macro_Pair_N.inp”, which may have different configurations for each pair of girders being calibrated (Figure 11). This macro is basically responsible for: (i) resuming a shell global FE model of the test setup without the bracings; (ii) reading the proposed angles and automatically model the bracings; (iii) performing static linear analysis in the global and local sub-models; and (iv) compute modified hot-spot stresses and apply Equation (20). The objective function value is then returned to the PatternSearch algorithm in MATLAB, which will evaluate the need to propose a new set of angles (θ′1, θ′2, θ′3, and θ′4) and restart the analysis if convergence is not verified. N is the number of the tested pair of beams. For each iteration step along the optimization process, the process described by Figure 10 and Figure 11 takes nearly 30 s. The number of iterations for each calibrated girder will be described in the next section.

4. Results and Discussion

The angles found in the optimization process for the seven reported failures of longer web gaps (76 mm) are reported in Table 2, in decimal degrees, together with the number of iterations needed to achieve convergence. In general, even small angles were responsible for creating high secondary stresses due to distortion at the welds in the web gap. Although the gauge locations were also not known, the best fit was adopted by minimizing the difference between the experimental extrapolated stress ranges, measured with nonstandard gauge locations in the tension side of the web, with linear extrapolations for stresses located between 0.4 tw and 1.0 tw of the weld toes. The optimization was performed separately for each girder taking advantage of the symmetry, which was carried out by pairs.
Regarding the local sub-models, it was hard to compute reliable stresses for the smaller web gaps with nominal values of 38 mm for two reasons: (i) although the requirement were for a 38 mm nominal web gap size, the actual size obtained during construction was even smaller, in the order of 20 mm, making it difficult to position at least three separated strain gauges within such a short gap, leading to unreliable extrapolated stresses. (ii) The very short length of the web gap is highly influenced by localized constrained plastic flow, high residual stresses due to the presence of two welds very near to each other (see Figure 9), and local notch effects of both welds. Both reasons make it hard to calibrate the 38 mm web gaps. Therefore, in this research, only the longer web gaps with a nominal size of 76 mm were reanalysed.
The optimization process was performed for each iteration, one for the global model and the other for the local sub-model. With the stress solution for these static analyses, the stress range was computed by multiplying them by (1 − R), where R is the load-ratio between the minimum to maximum applied loads. During the tests, the minimum applied load was defined such that tensile stress of 6.89 MPa (or one kilopound per square inch) was obtained in the lower flange at the midspan, for the test setup with lower or higher in-plane stress ranges, 41.4 and 82.7 MPa. This guaranteed the lowest possible load ratios R for both setups in practice, equal to 0.145 and 0.077 for 41.4 and 82.7 MPa in-plane stresses, respectively. Once the ‘optimum’ angles are determined with a small error about secondary stresses (<~1%), one may compute the equivalent structural stress ranges for each calibrated local sub-model, as shown in Table 3. The tenth column of Table 3 shows the calculations of the structural stress parameters according to Von Mises criteria, based on Equation (15).
Note that Table 3 also shows the computed and measured in-plane stresses, since the bar angles are responsible for also slightly changing the predefined in-plane stresses, although the differences demonstrated to be negligible. Furthermore, Table 3 shows the actual web gap size reported in Fisher and co-authors work [47], recalling that seven local sub-models were created to reproduce exactly the actual web gap size of each girder achieved in the actual structure, thus ensuring a more reliable stress field. A contour plot of the equivalent structural stress parameters, ΔSe, of a local web gap sub-model obtained with the developed post-processor tool [6] is shown in Figure 12a. In general, the overall pattern of the maximum values for the structural stress are in agreement with the expected fatigue crack growth behaviour (Figure 12b). The reassessment of the S-N data of transverse stiffeners web gap details in terms of hot-spot stress and Equation SS ranges was performed by using the values shown in Table 3.
As explained, the extrapolation of the hot-spot stress must be done, taking into account: (i) the surface on which the hot-pot is located; (ii) the type of approximation (linear or quadratic); (iii) the refinement of the mesh. The welded detail of the beam was evaluated after its calibration, obtaining the maximum stresses in the most critical regions (of the joint) from the linear (Figure 13a) and quadratic (Figure 13b) extrapolations of stresses in the neighbouring regions, considering the perpendicular direction of the maximum stress under the weld line.
After rejecting the small web gap S-N results, the results of the longer web gap are shown in Figure 14, in terms of the modified hot-spot stress range (refer to Figure 12a). Thus, based on the determination of the maximum stress acting perpendicular to the weld line, it can be observed that the points agree with a possible FAT 80 design curve.

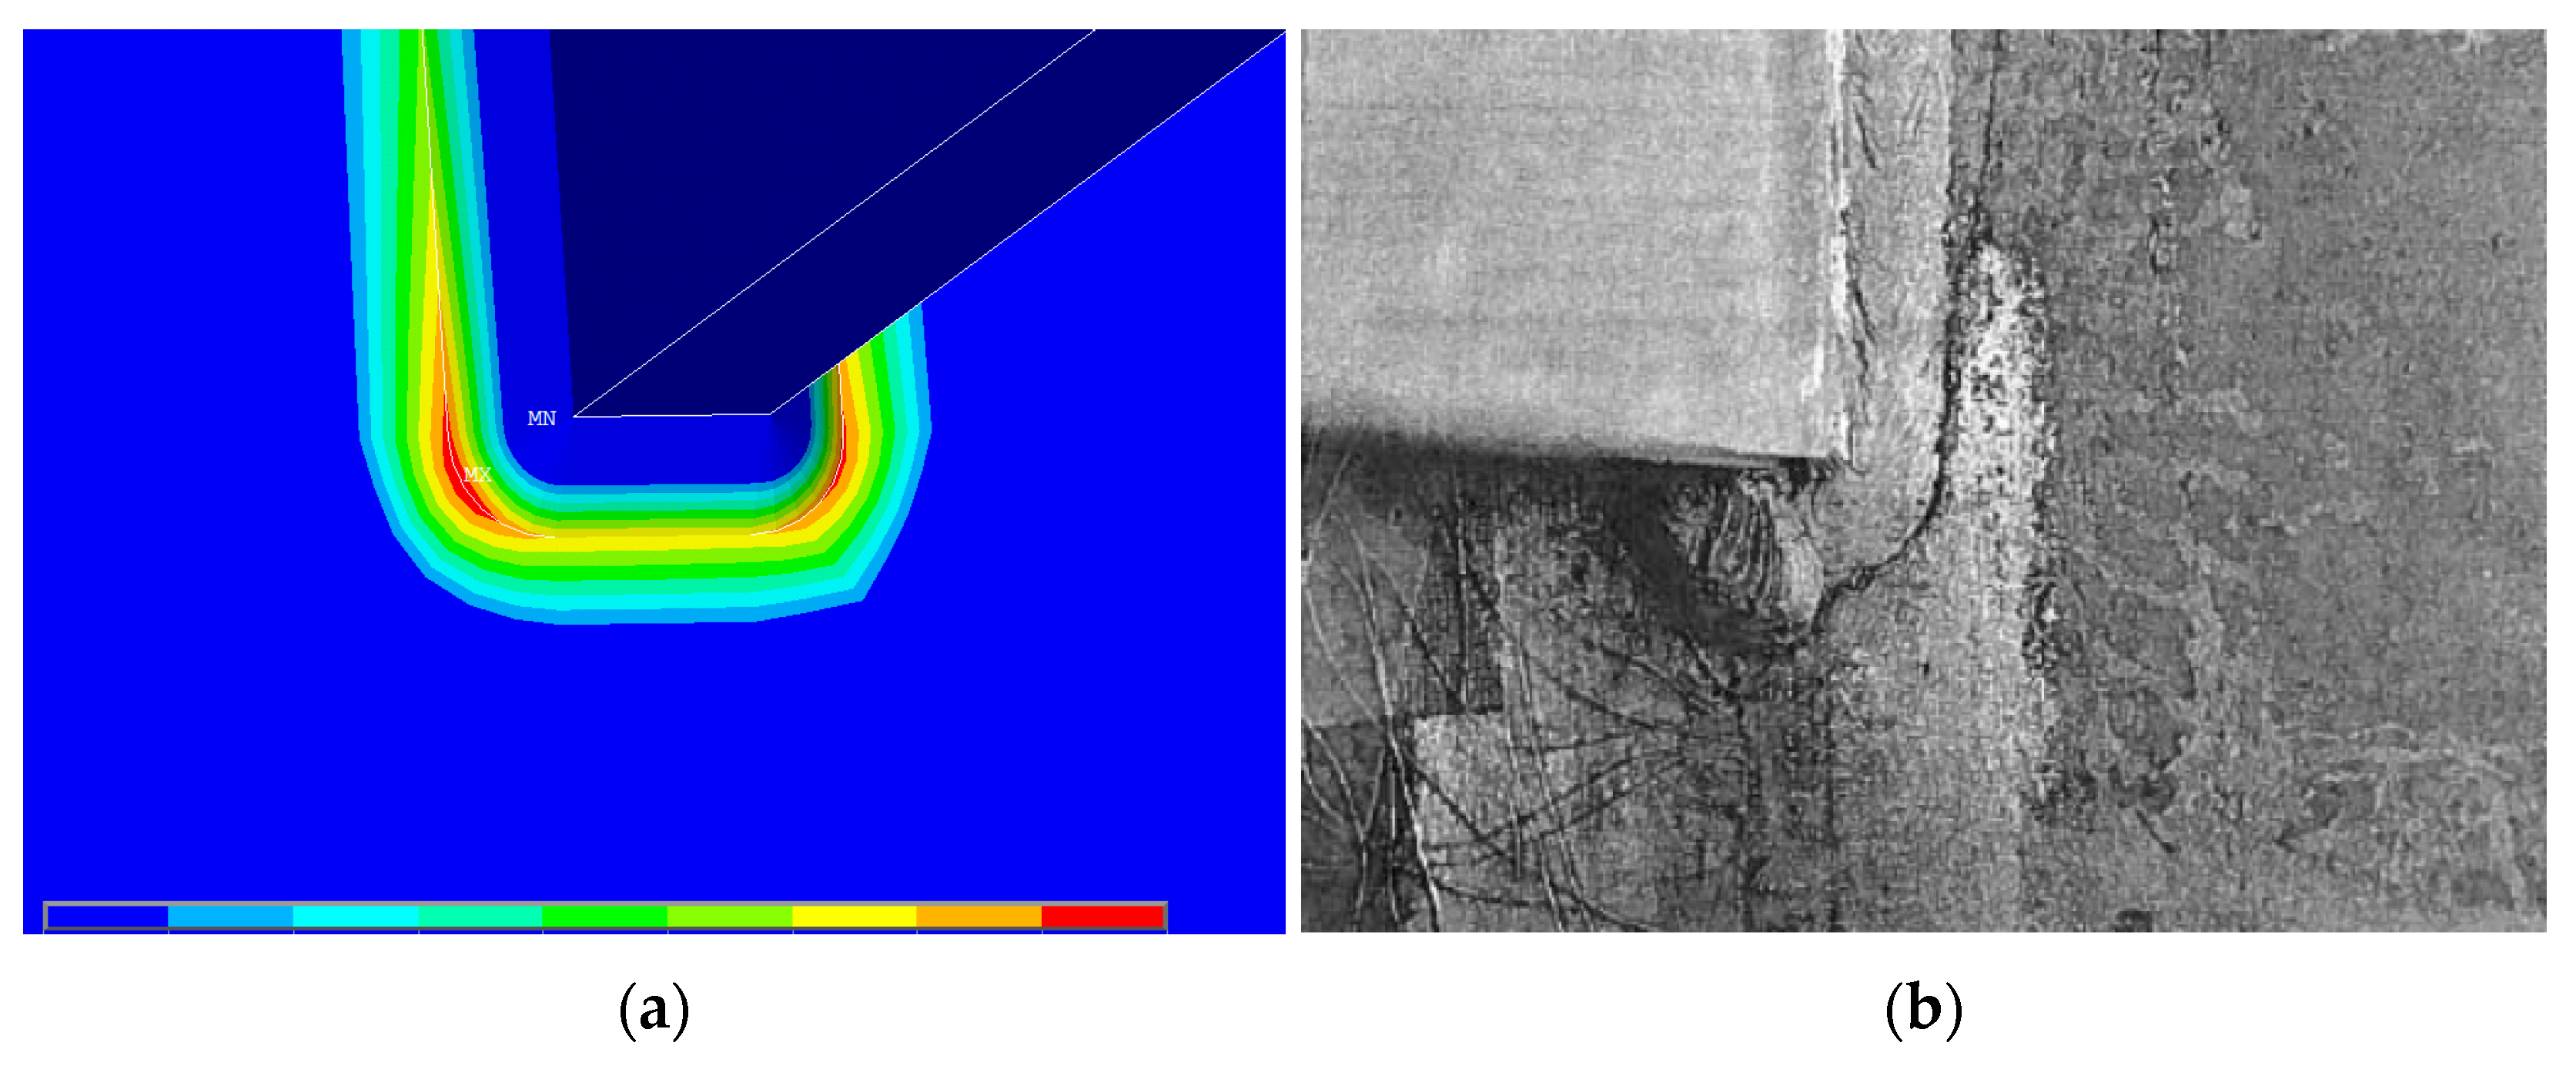
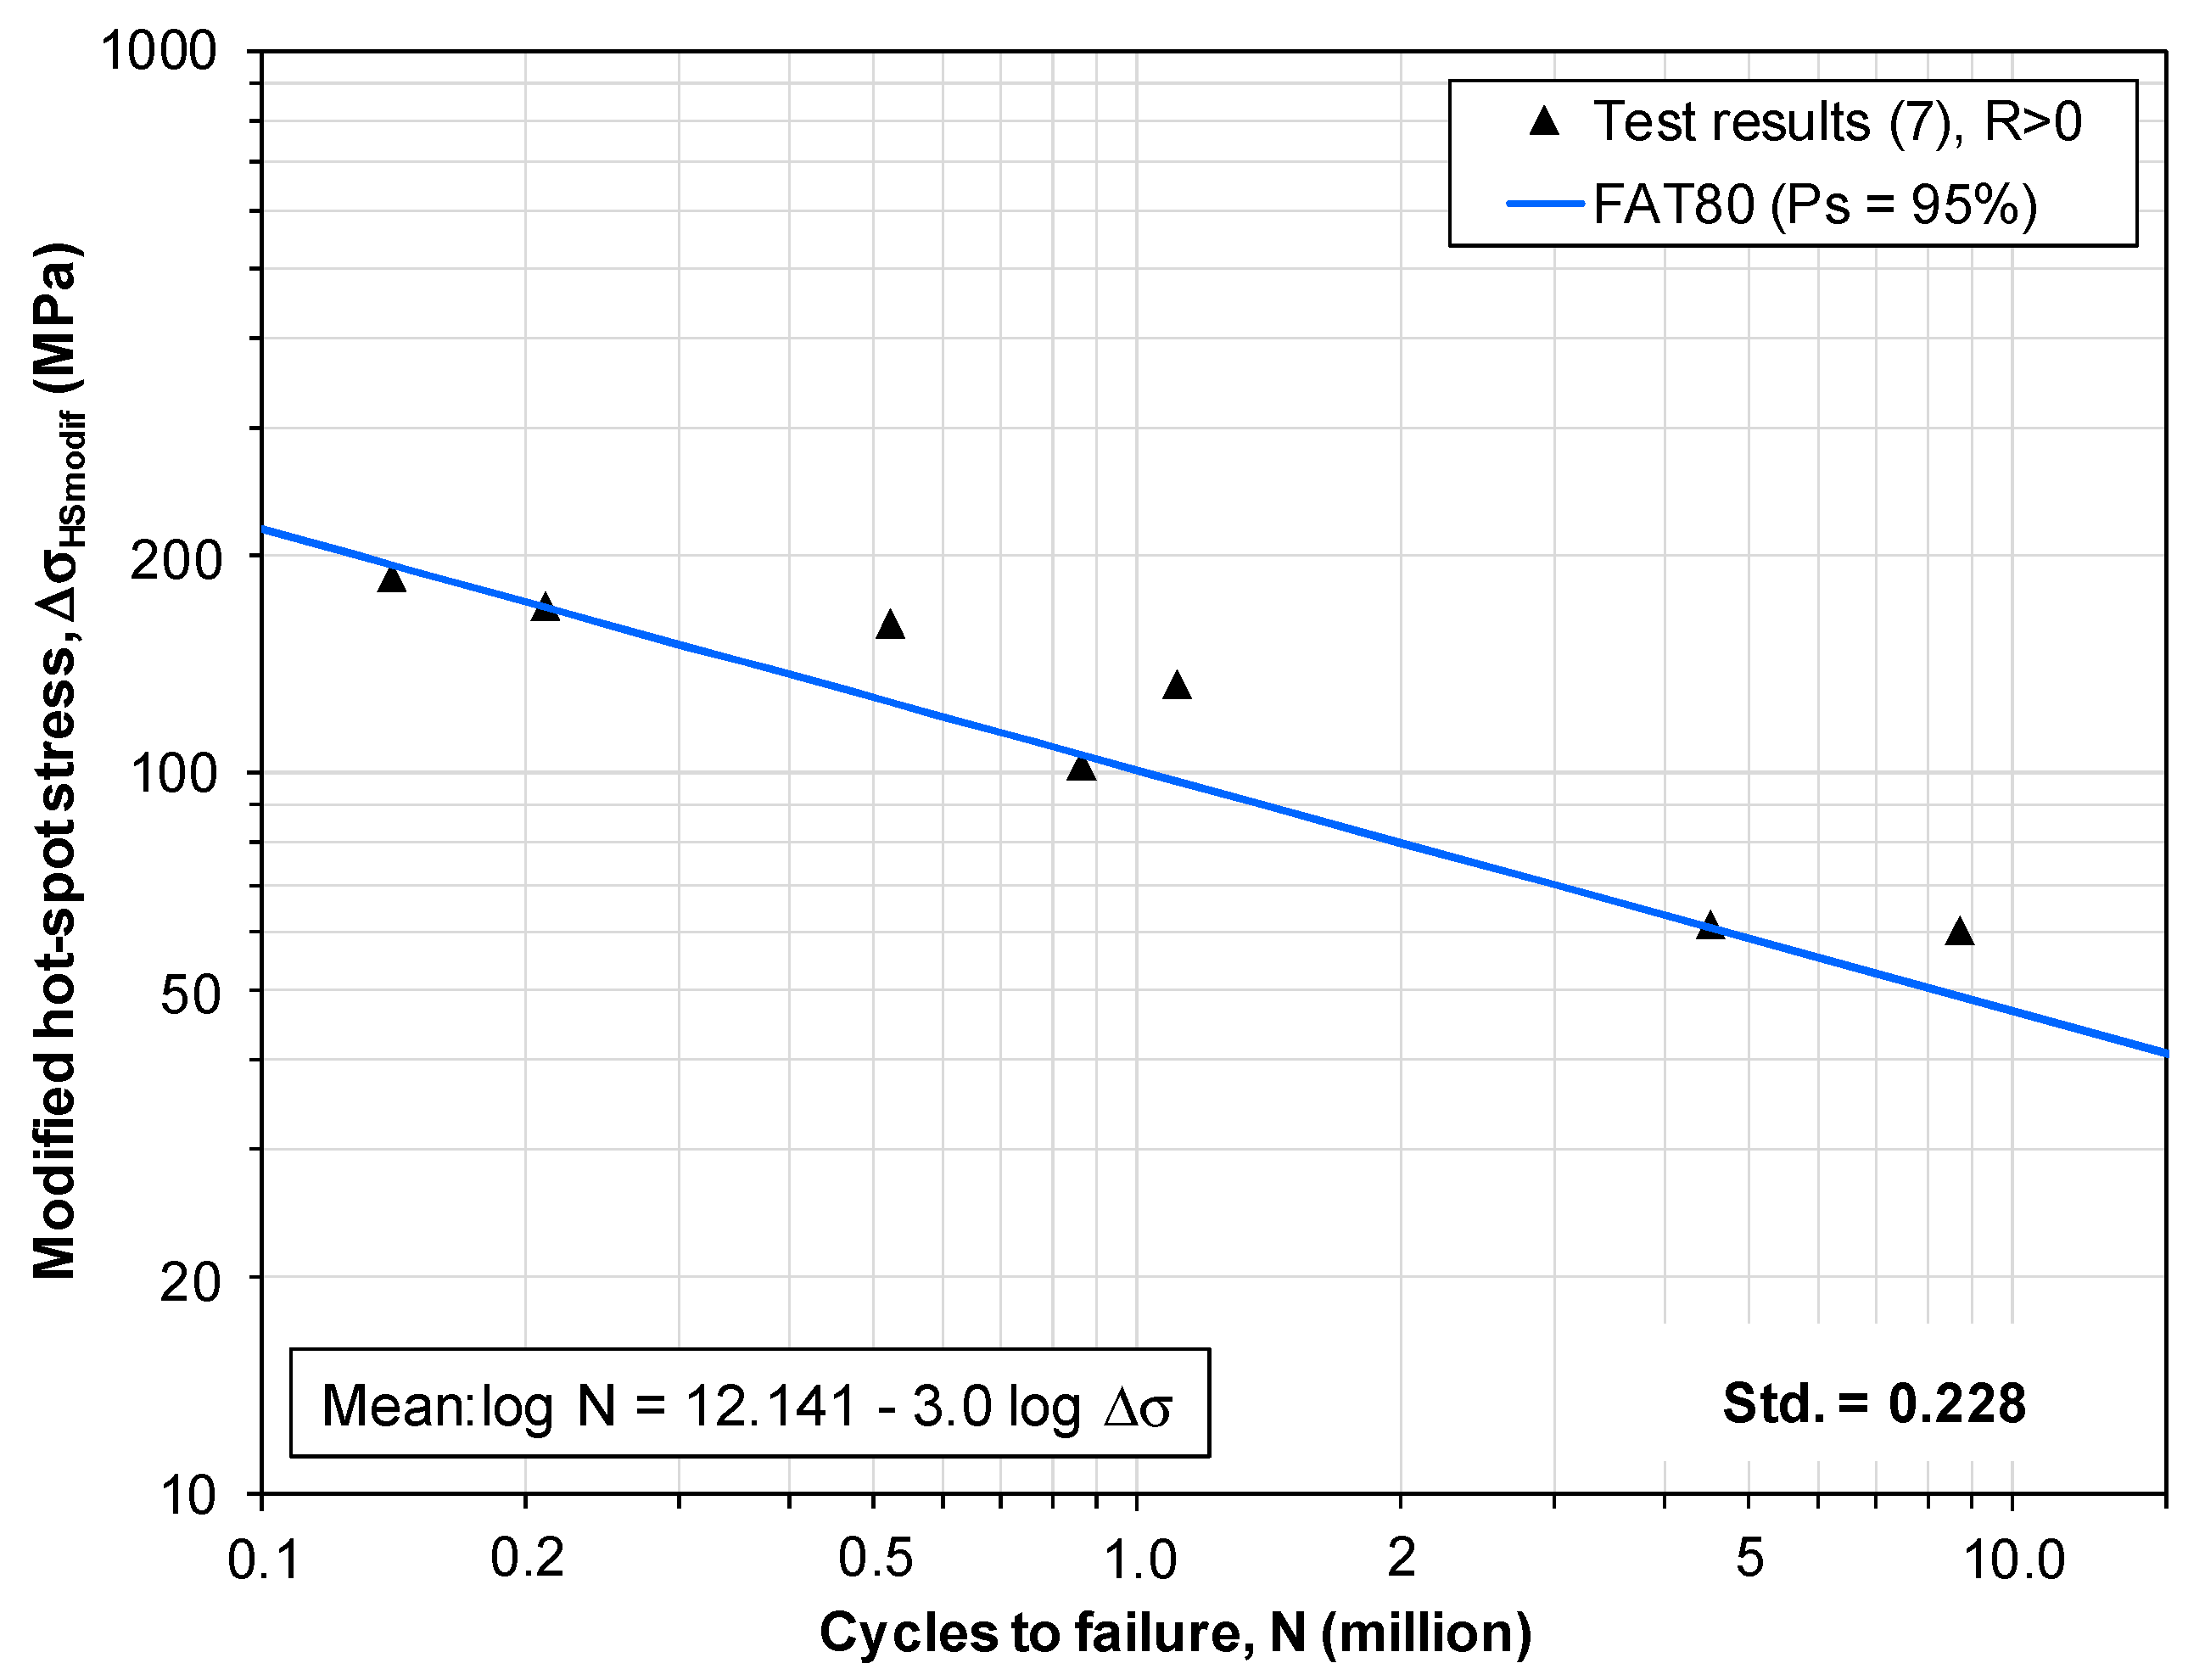
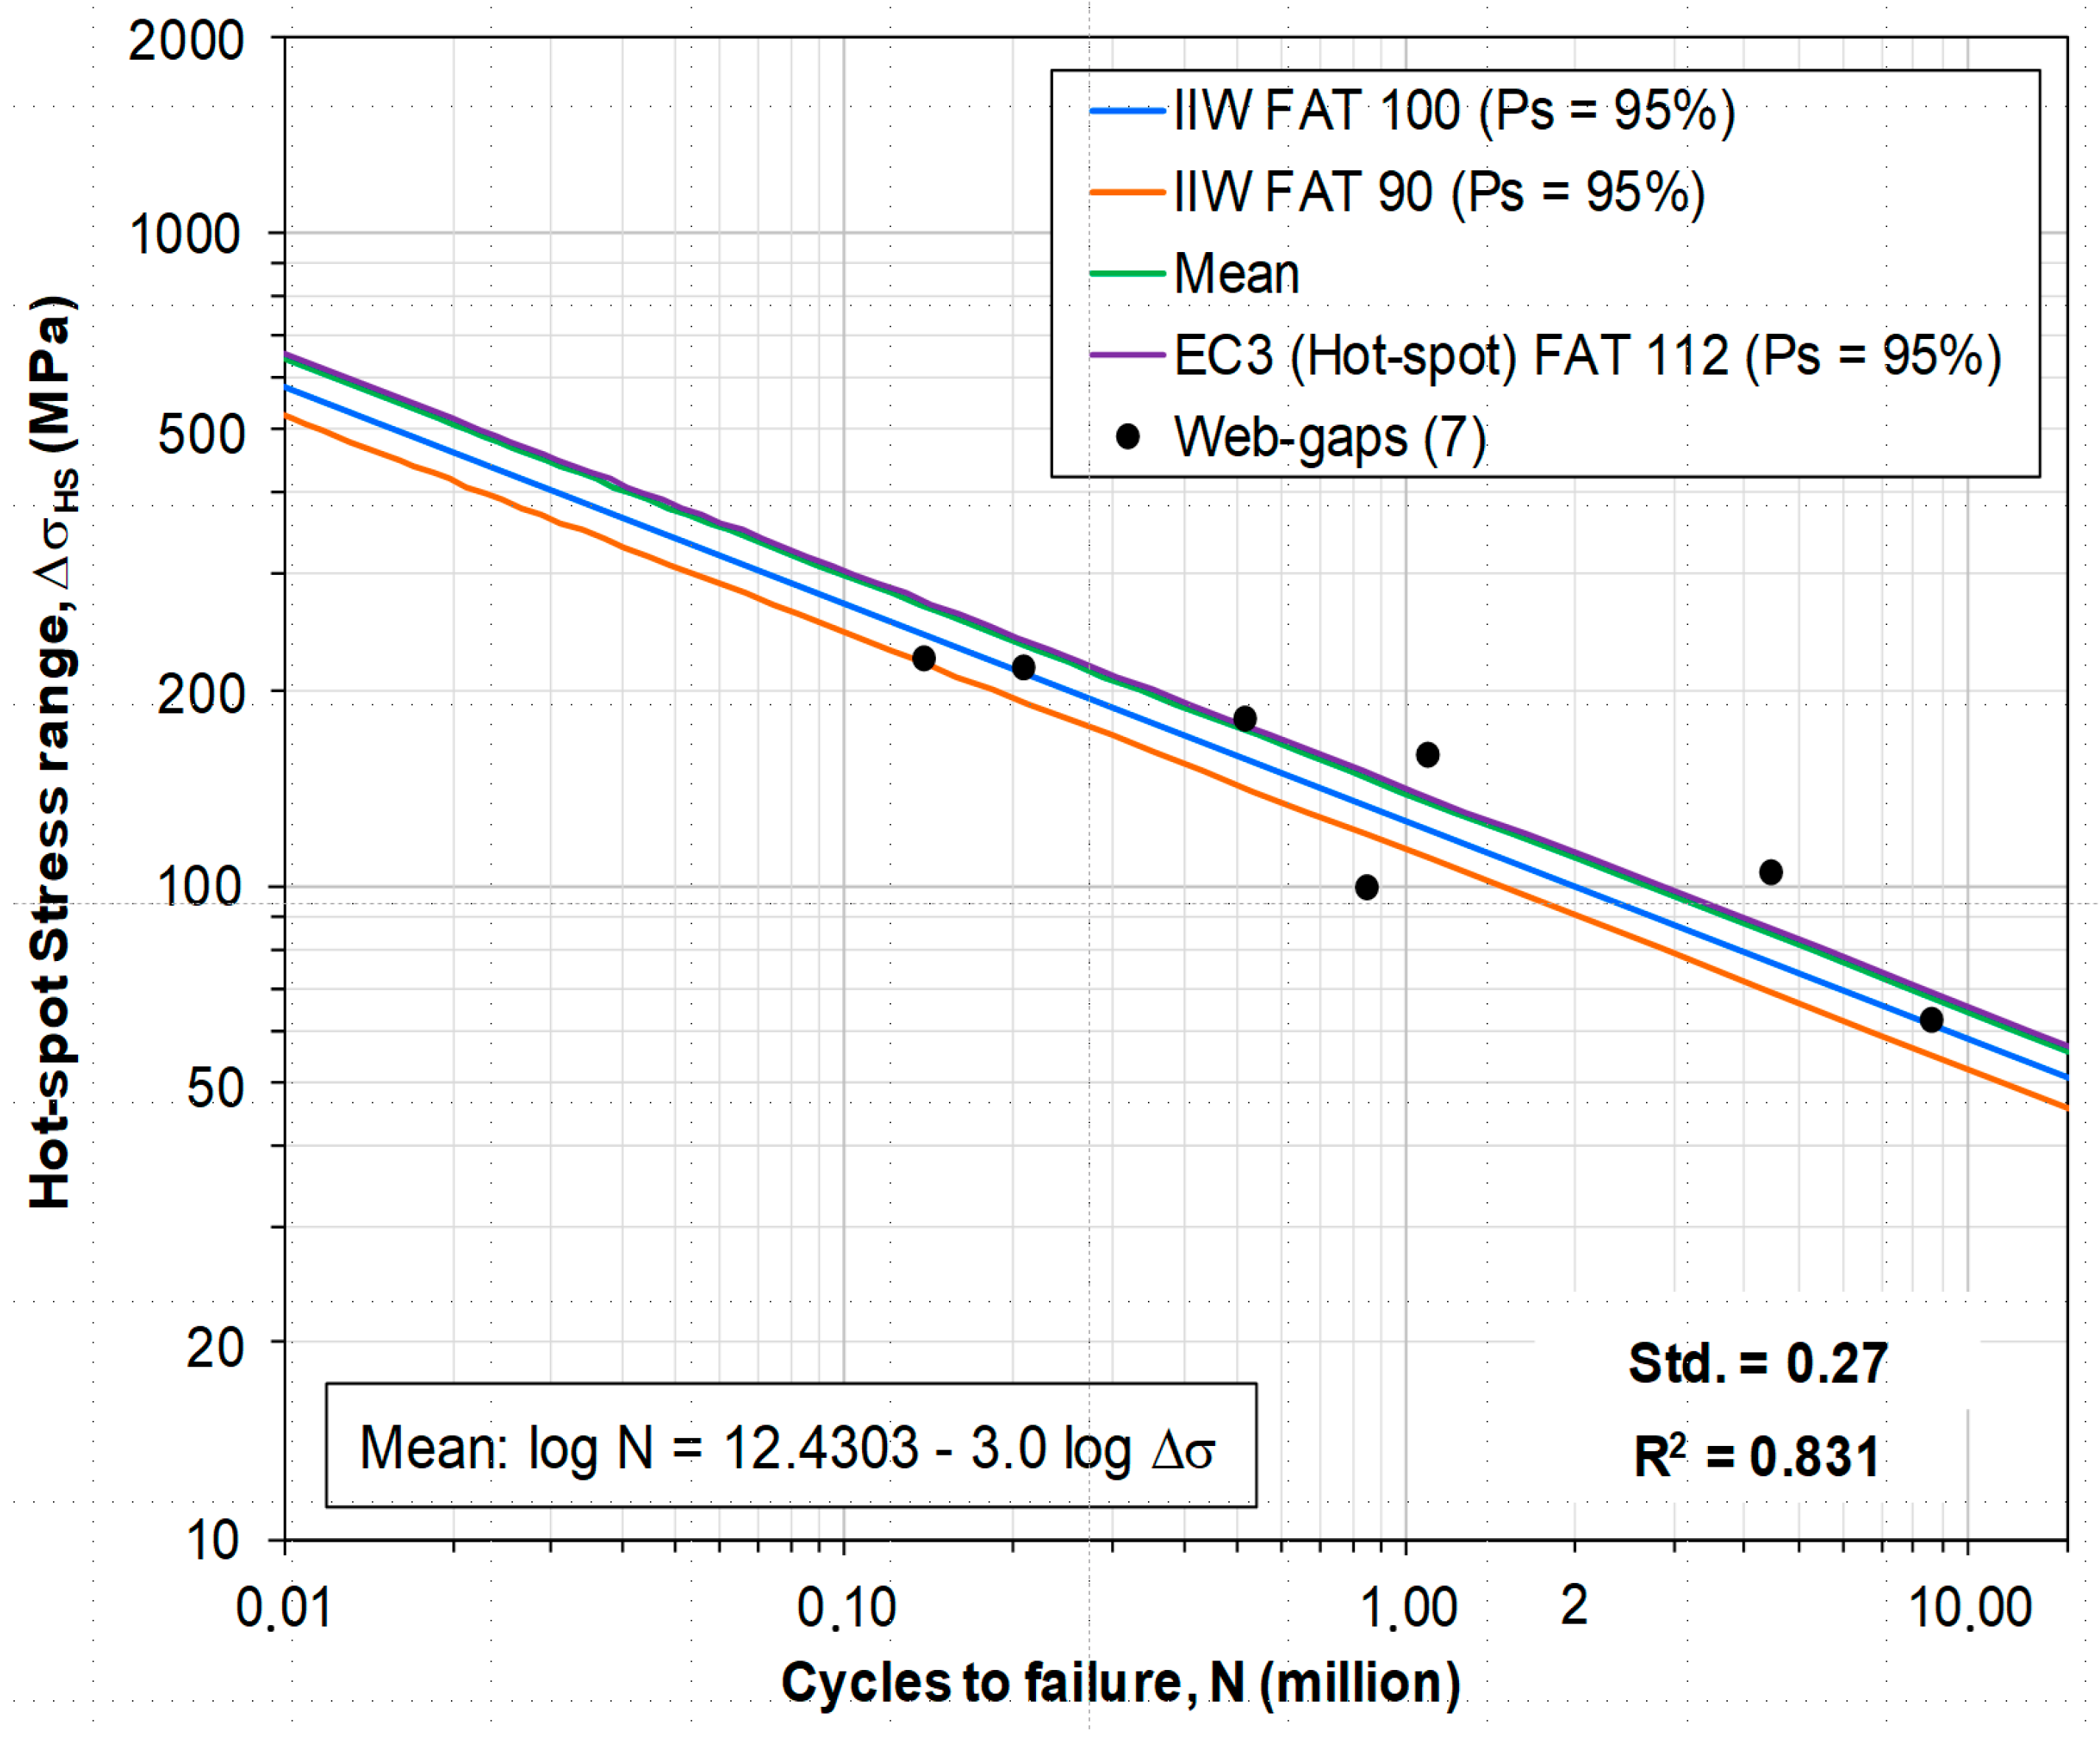
4.1. Validation of the S-N Hot-Spot Curve Approach for the Distortion-Induced Fatigue Program

In the case of the hot-spot stress method, according to IIW [41], it is necessary to include misalignment effects by dividing ΔσHS by 1.05, to cover their unfavourable influence on the fatigue life up to a margin of 5%. The reason is that the FE models are idealized geometries, and did not explicitly include the misalignments in solid modelling, which is not practical.
Quadratic stress surface extrapolation in xz-Cartesian coordinate (inclined), as shown in Figure 13b, was used to compute the highest surface-extrapolated hot-spot stress acting perpendicularly to the weld line. Next, the structural hot-spot stress results for the welded details, located in the side of the perpendicular fillet weld in the web gusset end, coinciding with the location of fatigue crack initiation in tests, as illustrated by Figure 12a, are plotted in Figure 15. However, as can be seen, for the most critical parameters (in the sloped region), the points are distributed, e.g., FAT 90, Figure 15, which is the lowest in terms of hot-spot stress, according to IIW [41]. Therefore, as in the case of the experimental measurement for linear numerical calibration, this method is acceptably validated.

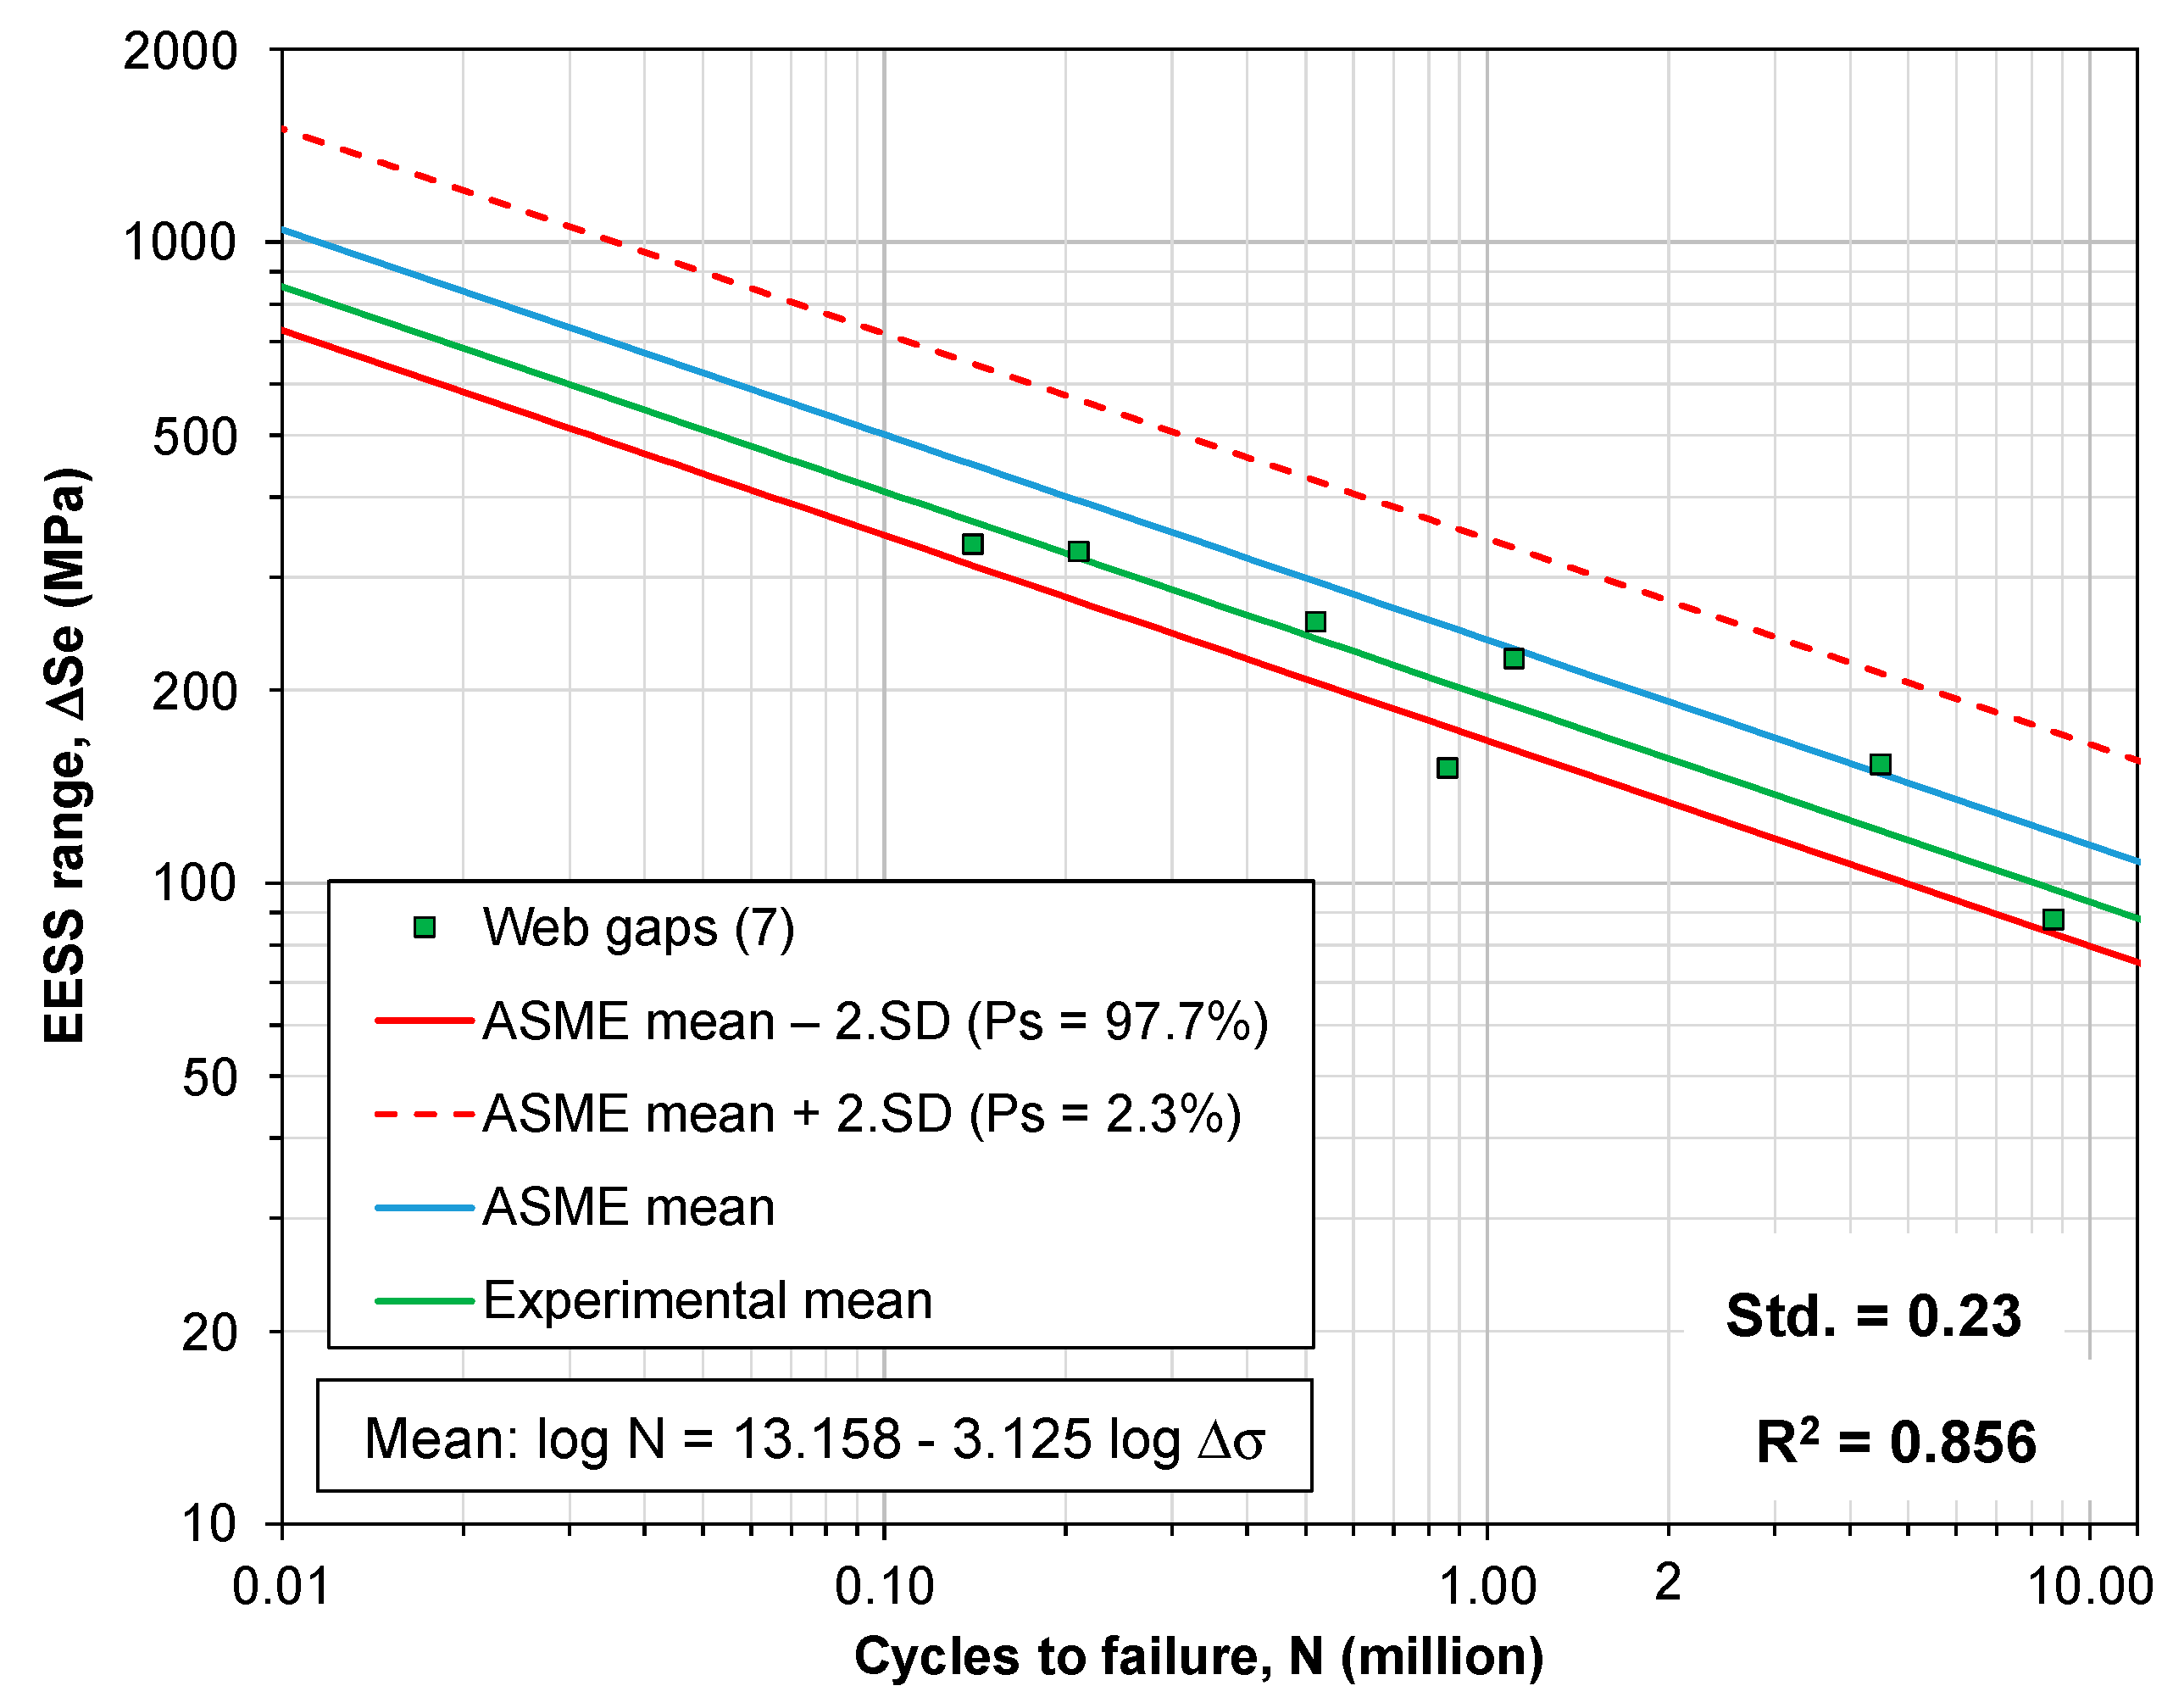
4.2. Validation of the Master S-N Curve Approach for the Distortion-Induced Fatigue Program

In this section, the S-N data are correlated with the equilibrium equivalent structural stress method, agreeing well within the ASME strength definition based on a probability of survival of 97.7% (see Figure 15). It can be said that, in the present study, the master S-N curve for piping and pressure vessels, recommended by ASME using the equilibrium-equivalent structural stress method, appears to have a reasonable agreement with the fatigue test results of the welded bridge detail (see Figure 16). The standard deviations and the R-squares obtained from the hot-spot and the equilibrium-equivalent structural stress methods, SD = 0.27, R2 = 0.831 and SD = 0.23, R2 = 0.856, respectively, are of the same magnitude, and the differences are negligible, on the order of 0.04 for SD, and 0.025 for R2. However, the possibility of using a unique S-N master curve for any details makes the usage of the equilibrium-equivalent structural stress method very attractive for bridge welded joints.
When considering the possibility of using Equation (10) SS range parameter (Mode I only), ΔSs, or an effective Equation (15) SS range parameter (mixed modes I + III), ΔSe, one may note that the computed differences were negligible for the herein studied case, remaining in the order of less 0.5%. This demonstrated that the studied example was mostly dominated by Mode I. An example of a welded detail that has a high influence of Mode III over the computed structural stresses and, hence, in the fatigue lives, can be seen in the work by Alencar et al. [6]; that is, a welded tube joint subjected simultaneously to bending and torsion.

5. Conclusions and Future Prospects

In the present study, two methods were validated for the assessment of distortion-induced fatigue strength in metallic bridge welded details using shell/solid finite element modelling and structural equivalent stresses. Although the hot-spot stress method has already been extensively validated for different types of loading and weld geometries in the literature, to our knowledge, this paper highlights the first application of the master S-N method for a distortion-induced bridge fatigue problem. The concerning validation was a previous step necessary for the application in a real bridge case study subjected to real traffic and variable-amplitude loading in the near future, thus giving a basis and a guarantee for this future application. The assessment study was based on available fatigue test data obtained experimentally by Fisher et al. [49], i.e., laboratory full-scale fatigue tests at Lehigh University, which are well-known as being the main work responsible for establishing the foundations of distortion-fatigue assessment based on the current nominal method available in different standards.
In regard to validating the master S-N curve, presented in this research, it was ensured that, from now on, this method could be applied in real cases, in view of the results obtained when compared with the experimental responses widely recognized by different engineers and researchers, making use of traditional damage accumulation laws and counting cycle algorithms. In other words, this article brings with it the support/foundation, so that future professionals and/or researchers can provide solutions in real cases or problems, specifically the very relevant problem of web gap cracking, which affects several ageing bridge structures subjected to increasing traffic demands and corrosion/deterioration environmental effects from many countries. Finally, the following conclusions can be made:
  • Based on the real system, it was modelled numerically in order to perform the computational analysis, and then a methodology for the calibration was proposed. In this way, it resulted that the local and global stresses were successfully determined, reaching a difference of less than 1%.
  • Both methods (hot-spot stress and master S-N curve) were successfully applied. With the hot-spot stress method, the points were distributed above FAT 90 and with respect to the S-N master curve method, the points collapsed within the narrow band (curves interval). Nevertheless, the master curve can be more attractive, taking into account the need for one S-N curve usage, even for structural details.
  • This study highlights the advantages of using the master curve and the structural equilibrium equivalent mesh insensitive structural stresses in the fatigue design of welded bridge details, even in cases of complex load transfer mechanisms. Moreover, the availability of a dedicated post-processor made the analysis quite effective.

Author Contributions

Conceptualization, V.Q. and G.A.; methodology, V.Q. and G.A.; software, G.A.; validation, V.Q. and G.A.; formal analysis, G.A.; investigation, V.Q.; resources, G.A.; data curation, V.Q. and G.A.; writing—original draft preparation, V.Q.; writing—review and editing, G.A., A.d.J.; supervision, A.d.J., R.C., and J.G.S.d.S.; project administration, J.G.S.d.S. All authors have read and agreed to the published version of the manuscript.

Funding

This research was funded by the Research Support Foundation of the State of Rio de Janeiro—FAPERJ (doctoral scholarship grant number E-26/202.588/2018).

Data Availability Statement

Not Applicable.

Conflicts of Interest

The authors declare no conflict of interest. The funders had no role in the design of the study; in the collection, analyses, or interpretation of data; in the writing of the manuscript, or in the decision to publish the results.

References

  1. Pang, J.C.; Li, S.X.; Wang, Z.G.; Zhang, Z.F. General relation between tensile strength and fatigue strength of metallic materials. Mater. Sci. Eng. A 2013, 564, 331–341. [Google Scholar] [CrossRef]
  2. Ye, X.W.; Su, Y.H.; Jin, T.; Chen, B.; Han, J.P. Master S-N Curve-Based Fatigue Life Assessment of Steel Bridges Using Finite Element Model and Field Monitoring Data. Int. J. Struct. Stab. Dyn. 2019, 19, 1940013. [Google Scholar] [CrossRef]
  3. Liu, N.; Xiao, J.; Cui, X.; Liu, P.; Lua, J. A continuum damage mechanics (Cdm) modeling approach for prediction of fatigue failure of metallic bolted joints. In AIAA Scitech 2019 Forum; Aerospace Research Central: Reston, VA, USA, 2019; pp. 1–11. [Google Scholar] [CrossRef]
  4. Luo, P.; Yao, W.; Li, P. A notch critical plane approach of multiaxial fatigue life prediction for metallic notched specimens. Fatigue Fract. Eng. Mater. Struct. 2019, 42, 854–870. [Google Scholar] [CrossRef]
  5. Alencar, G.; de Jesus, A.; da Silva, J.G.S.; Calcada, R. Fatigue cracking of welded railway bridges: A review. Eng. Fail. Anal. 2019, 104, 154–176. [Google Scholar] [CrossRef]
  6. Alencar, G.; de Jesus, A.; da Silva, J.G.S.; Calçada, R. A finite element post-processor for fatigue assessment of welded structures based on the Master SN curve method. Int. J. Fatigue 2021, 153, 106482. [Google Scholar] [CrossRef]
  7. Hobbacher, A. Recommendations for Fatigue Design of Welded Joints and Components; Springer: Cham, Switzerland, 2016; Volume 47. [Google Scholar]
  8. Méndez, G.T.; Cuamatzi-Meléndez, R.; Hernández, A.A.; Capula-Colindres, S.I.; Angeles-Herrera, D.; Velázquez, J.C.; Vazquez-Hernández, O. Correlation of stress concentration factors for T-welded connections–finite element simulations and fatigue behavior. Soldag. Inspeção 2017, 22, 194–206. [Google Scholar] [CrossRef] [Green Version]
  9. Motaleb, M.; Lindquist, W.; Ibrahim, A.; Hindi, R. Repair assessment for distortion-induced fatigue cracks in a seismically retrofitted double-deck bridge complex. Eng. Struct. 2019, 183, 124–134. [Google Scholar] [CrossRef]
  10. Dellenbaugh, L.; Kong, X.; Al-Salih, H.; Collins, W.; Bennett, C.; Li, J.; Sutley, E.J. Development of a distortion-induced fatigue crack characterization methodology using digital image correlation. J. Bridg. Eng. 2020, 25, 4020063. [Google Scholar] [CrossRef]
  11. Alencar, G.; Hong, J.K.; de Jesus, A.; da Silva, J.G.S.; Calçada, R. The Master SN curve approach for fatigue assessment of welded bridge structural details. Int. J. Fatigue 2021, 152, 106432. [Google Scholar] [CrossRef]
  12. Cavaco, J.A. Managing fatigue susceptible details on critical railway bridges at CN. In Proceedings of the Bridge Maintenance, Safety Management, Health Monitoring and Informatics-IABMAS’08, Seoul, Korea, 13–17 July 2008. [Google Scholar]
  13. Alencar, G.; de Jesus, A.M.P.; Calçada, R.A.B.; da Silva, J.G.S. Fatigue life evaluation of a composite steel-concrete roadway bridge through the hot-spot stress method considering progressive pavement deterioration. Eng. Struct. 2018, 166, 46–61. [Google Scholar] [CrossRef]
  14. Rikeros, D. Fatigue Assessment of Rail Track Detail on Movable Bridge in Estonia Based on 2D/3D Finite Element Modelling Using Hot-Spot Stresses. Master’s Thesis, Department of Structural Engineering, Delft University of Technology, Delft, The Netherlands, 2019. [Google Scholar]
  15. Aygül, M.; Al-Emrani, M.; Urushadze, S. Modelling and fatigue life assessment of orthotropic bridge deck details using FEM. Int. J. Fatigue 2012, 40, 129–142. [Google Scholar] [CrossRef]
  16. Aygül, M. Fatigue Analysis of Welded Structures Using the Finite Element Method; Chalmers Tekniska Hogskola: Gothenburg, Sweden, 2012; ISBN 1392881838. [Google Scholar]
  17. IIW. Recommendations for Fatigue Design of Welded Joints and Components; Hobbacher, A.F., Ed.; IIW Docume; International Institute of Welding (IIW): Kolkata, India, 2016; ISBN 9781855733152. [Google Scholar]
  18. Poutiainen, I.; Tanskanen, P.; Marquis, G. Finite element methods for structural hot spot stress determination—A comparison of procedures. Int. J. Fatigue 2004, 26, 1147–1157. [Google Scholar] [CrossRef]
  19. Iqbal, N.; Fang, H.; Naseem, A.; Kashif, M.; Backer, H. De A numerical evaluation of structural hot-spot stress methods in rib-to-deck joint of orthotropic steel deck. Appl. Sci. 2020, 10, 6924. [Google Scholar] [CrossRef]
  20. Niemi, E.; Fricke, W.; Maddox, S.J. Structural hot-spot stress approach to fatigue analysis of welded components. IIW Doc 2018, 13, 1800–1819. [Google Scholar]
  21. Dong, P.; Hong, J.K. The master SN curve approach to fatigue of piping and vessel welds. Weld. World 2004, 48, 28–36. [Google Scholar]
  22. Dong, P.; Hong, J.K. The master S-N curve approach to fatigue evaluation of offshore and marine structures. In Proceedings of the OMAE04-23rd International Conference on Offshore Mechanics and Arctic Engineering, Vancouver, BC, Canada, 20–25 June 2004; pp. 1–9. [Google Scholar]
  23. Alencar, G. Structural Stress-Based Methodologies for Fatigue Assessment of Welded Railway Bridges. Ph.D. Thesis, University of Porto, Porto, Portugal, 2021. [Google Scholar]
  24. ASME. ASME: API 579-1/ASME FFS-1 Fitness-For-Service, Secion VIII-Division 2: Rules for Construction of Pressure Vessels; American Society of Mechanical Engineers: New York, NY, USA, 2016; p. 96. [Google Scholar]
  25. Boiler, A. Rules for Construction of Pressure vessels; American Society of Mechanical Engineers: New York, NY, USA, 2013; ISBN 0791834727. [Google Scholar]
  26. Niu, C.; Xie, S.; Li, X.; Wang, W. Research on stress state level evaluation method of complex steel welded structures. Int. J. Struct. Integr. 2021, 12, 109–122. [Google Scholar] [CrossRef]
  27. Xie, S.; Li, C.; Wang, J.; Li, W.; Niu, C. Study on welded joints’ stress state grade of aluminum alloy EMU body. Int. J. Struct. Integr. 2021, 12, 123–137. [Google Scholar] [CrossRef]
  28. Dong, P.; Hong, J.K.; Osage, D.A.; Prager, M. Master S-N Curve Method for Fatigue Evaluation of Welded Components. 2002. Available online: https://scholar.google.com.hk/scholar?hl=zh-CN&as_sdt=0%2C5&q=Master+S-N+curve+method+for+fatigue+evaluation+of+welded+components&btnG= (accessed on 25 November 2021).
  29. Yaghoubshahi, M.; Alinia, M.M.; Milani, A.S. Master S-N curve approach to fatigue prediction of breathing web panels. J. Constr. Steel Res. 2017, 128, 789–799. [Google Scholar] [CrossRef]
  30. Fisher, J.W.; Barthelemy, B.M.; Mertz, D.R.; Edinger, J.A. Fatigue Behavior of Full-Scale Welded Bridge Attachments; Report No. 227; Transportation Research Board: Bethlehem, PA, USA, 1980. [Google Scholar]
  31. Viana, C.O. Avaliação Global-Local da vida em Fadiga de uma Junta Soldada do vão de Acesso da Ponte de Alcácer do Sal. Dissertação de Mestrado, Universidade Federal de Minas Gerais, Minas Gerais, Brasi, 2019. [Google Scholar]
  32. Radaj, D.; Sonsino, C.M.; Fricke, W. Recent developments in local concepts of fatigue assessment of welded joints. Int. J. Fatigue 2009, 31, 2–11. [Google Scholar] [CrossRef]
  33. Casavola, C.; Pappalettere, C. Discussion on local approaches for the fatigue design of welded joints. Int. J. Fatigue 2009, 31, 41–49. [Google Scholar] [CrossRef]
  34. Dong, P. A structural stress definition and numerical implementation for fatigue analysis of welded joints. Int. J. Fatigue 2001, 23, 865–876. [Google Scholar] [CrossRef]
  35. Niemi, E.; Fricke, W.; Maddox, S.J. Fatigue Analysis of Welded Components: Designer’s Guide to the Structural Hot-Spot Stress Approach; Woodhead Publishing: Swaston, UK, 2006; ISBN 1845696662. [Google Scholar]
  36. Marin, T.; Nicoletto, G. Fatigue design of welded joints using the finite element method and the 2007 ASME Div. 2 Master curve. Frat. Integrità Strutt. 2009, 3, 76–84. [Google Scholar] [CrossRef] [Green Version]
  37. Bijlaard, F.S.K. Eurocode 3: Design of steel structures-part 1-9: Fatigue. In Proceedings of the International Symposium on Fatigue and Fracture of Steel Structures, Singapore, 4 December 2007; Nanyang Technological University: Singapore, 2008; pp. 20–31. [Google Scholar]
  38. Saini, D.S.; Karmakar, D.; Ray-Chaudhuri, S. A review of stress concentration factors in tubular and non-tubular joints for design of offshore installations. J. Ocean Eng. Sci. 2016, 1, 186–202. [Google Scholar] [CrossRef] [Green Version]
  39. Doerk, O.; Fricke, W.; Weissenborn, C. Comparison of different calculation methods for structural stresses at welded joints. Int. J. Fatigue 2003, 25, 359–369. [Google Scholar] [CrossRef]
  40. Silveira, J.A.; Mezzomo, G.P.; Goedel, F. Evaluation of structural stress method and master curve for fatigue life prediction of a welded joint. Rev. Int. Metod. Numer. Para Calc. Y Disen. En Ing. 2017, 33. [Google Scholar] [CrossRef] [Green Version]
  41. Hobbacher, A. Recommendations for fatigue design of welded joints and components. IIW document XIII-2151-07. XV-1254r1-07, Paris2007. 2007. Available online: https://scholar.google.com.hk/scholar?hl=zh-CN&as_sdt=0%2C5&q=Recommendations+for+fatigue+design+of+welded+joints+and+components&btnG= (accessed on 25 November 2021).
  42. Heshmati, M. Fatigue Life Assessment of Bridge Details Using Finite Element Method; Chalmers University of Technology, Chalmers Tekniska Hogskola: Gothenburg, Sweden, 2012. [Google Scholar]
  43. ASME VIII Div2 Secion. VIII-Division 2: Rules for Construction of Pressure Vessels. ASME Boiler Pressure and Vessel Code; USA. 2013. Available online: https://scholar.google.com.hk/scholar?hl=zh-CN&as_sdt=0%2C5&q=43.%09ASME+VIII+Div2+Secion.+VIII-Division+2%3A+Rules+for+Construction+of+Pressure+Vessels%3B+ASME+Boiler+Pressure+and+Vessel+Code%3B+USA%2C+2013.&btnG= (accessed on 25 November 2021).
  44. Hong, J.K.; Forte, T.P. Fatigue evaluation procedures for multiaxial loading in welded structures using Battelle structural stress approach. In Proceedings of the ASME 2014 33rd International Conference on Ocean, Offshore and Arctic Engineering, San Francisco, CA, USA, 8–13 June 2014. American Society of Mechanical Engineers Digital Collection, 1 October 2014. [Google Scholar]
  45. Teixeira, G. Vibration Fatigue of Welded Joints-Case Studies Using Verity. In Proceedings of the Dassault Systèmes User Conference, Hanau, Germany, 4–6 December 2018. [Google Scholar]
  46. Fisher, J.W.; Albrecht, P.; Yen, B.T.; Klingerman, D.J.; McNamee, B.M. Fatigue strength of steel beams with welded stiffeners and attachments. NCHRP Rep. 1974. Available online: https://scholar.google.com.hk/scholar?hl=zh-CN&as_sdt=0%2C5&q=Fatigue+strength+of+steel+beams+with+welded+stiffeners+and+attachments&btnG= (accessed on 25 November 2021).
  47. Fisher, J.W.; Jin, J.; Wagner, D.C.; Yen, B.T. NCHRP Report 336: Distortion-Induced Fatigue Cracking in Steel Bridges; National Research Council of Washington: Washington, DC, USA, 1990.
  48. Audet, C.; Kokkolaras, M. Blackbox and Derivative-Free Optimization: Theory, Algorithms and Applications; Springer: New York, NY, USA, 2016; ISBN 1389-4420. [Google Scholar]
  49. Fisher, J.W.; Jin, J.W.; David, C.; Yen, B. Distortion-Induced Fatigue Cracking in Steel Bridges; Transportation Research Board: Washington, DC, USA, 1990; Volume 336, ISBN 0309048591. [Google Scholar]
Figure 1. (a) Linear hot-spot stress extrapolation [39]; (b) membrane components (σm) and bending (σb) of the structural stress (σs) at the weld toe [34], (adapted by the author [40]).
Metals 11 01952 g001
Figure 2. Extrapolation method. Adapted from: IIW [41] (adapted by the author [42]).
Metals 11 01952 g002
Figure 3. Structural stress components at the weld toe (adapted from [45]).
Metals 11 01952 g003
Figure 4. Flowchart of multiaxial fatigue analysis (mixed-mode I + III) using the master S-N curve method.
Metals 11 01952 g004
Figure 5. Global model of the structural system of beams; fatigue test of details sensitive to distortion-induced fatigue (units: millimetres).
Metals 11 01952 g005
Figure 6. Fatigue test of distortion-induced fatigue sensitive detail: (a,c) girders and (b,d) sections dimensions (units: millimetres).
Metals 11 01952 g006
Figure 7. Fatigue test of distortion-induced fatigue sensitive detail: section (units: millimetres).
Metals 11 01952 g007
Figure 8. The developed global numerical model of the fatigue test of the NCHRP [47] program for fatigue strength assessment of web gap details: (a) global view, (b) longitudinal view, and (c) side view.
Metals 11 01952 g008
Figure 9. (a) Local numerical models of the web gap detail: 76 mm web gap and (b) placement of strain gauges to measure the modified hot-spot stresses [47].
Metals 11 01952 g009
Figure 10. Flowchart for the calibration procedure of web gaps test setup for each girder pair: MATLAB/ANSYS framework.
Metals 11 01952 g010
Figure 11. Flowchart for the calibration procedure of web gap test setup: ANSYS Macro.
Metals 11 01952 g011
Figure 12. (a) Contour-plot of the Equation SS found after the calibration process for a girder specimen series and (b) crack pattern around the stiffener termination [49].
Metals 11 01952 g012
Figure 13. Surface extrapolated structural stresses computation with reference points: (a) linear extrapolation compatible with experimental measurements; (b) quadratic extrapolation at weld corner looking for critical hot-spot stresses.
Metals 11 01952 g013
Figure 14. Modified hot-spot S-N curve for transverse web stiffener (refer to Figure 12a).
Metals 11 01952 g014
Figure 15. Structural hot-spot stress results for welded bridge details (refer to Figure 12b).
Metals 11 01952 g015
Figure 16. Master S-N curve for welded bridge details.
Metals 11 01952 g016
Table 1. Master S-N curve parameters according to ASME BPVC Sec VIII Div 2 [43].
Statistical BasisCh
Mean19,930.2−0.3195
+2 SD28,626.5
−2 SD13,875.8
+3 SD34,308.1
−3 SD11,577.9
Table 2. Results of the optimization procedure to determine the slopes of the steel bracings.
Steel Bracings Slopes (Decimal Degrees °)No. of
Iterations
GirderLeft GirdersRight Girders
θ1θ2θ3θ4
G23.2110.9710.6512.8353
G58.2512.8212.105.7246
G64.5812.207.7613.9551
G84.4312.406.8814.5151
G106.2512.0912.037.8261
G114.6911.444.50 14.50 128
G124.50 14.50 10.726.7839
1 Defined as fixed slopes for these optimization simulations.
Table 3. Nominal and secondary stresses of the calibrated local FE sub-models.
GirderApplied FE Loads, Pmax (kN)Web Gap Length 2 (mm)In-Plane Stress Range 1, Δσ (MPa)
Δσ = σMAX × (1 − R)
Out-of-Plane Hot-Spot Stress
Range 2, ΔσHS (MPa)
Hot-Spot
(Inclined)
(MPa)
Computed
Quadratic
(Figure 12b)
EESS Range, ΔSe (MPa)
ΔσHS = σHSMAX × (1 − R)Modes I + III
Linear Rule (0.4 tw, 1.0 tw)
(Figure 12a)
ΔSe = SS × (1 − R)
MeasuredComputedMeasured 3ComputedErrorComputed
G2122.0445.9741.3641.2761.3661.780.68%109.57153.64
G5122.0449.0241.3641.2560.6761.281.01%65.0187.75
G6122.0449.5341.3641.22132.38132.000.29%165.29223.95
G8122.0451.0541.3641.20160.65160.150.31%188.38255.72
G10229.6251.3182.7483.54102.04101.430.60%104.19151.13
G11229.6253.5982.7483.10170.30169.610.41%225.28329.39
G12229.6248.2682.7482.43186.85186.520.18%233.66337.72
1 Measured in the bottom flange at the midspan. 2 Measured from the toes of stiffener-to-web and flange-to-web welds. 3 At the time the test was carried out, the stresses were measured using linear extrapolation with nonstandard positions for the strain gauges.
Publisher’s Note: MDPI stays neutral with regard to jurisdictional claims in published maps and institutional affiliations.

