2. Materials and Methods
A total of nine different soft nanocrystalline magnetic alloys were synthesized and characterized in this study to obtain a total of 11 samples.
Table 1 summarises all samples with their chemical composition and label. Four ferromagnetic alloys with nominal compositions of Fe
73.5Si
22.5−xB
xCu
1Nb
3 (x = 9, 11, 13 and 15) were manufactured by mechanical alloying to obtain powders. High purity (Fe 99.5 wt.%, Si 99.5 wt.%, B 98 wt.%, Cu 99 wt.% and Nb 99 wt.%) elemental metals were milled under inert argon atmosphere in a Retsch PM400 mill (RETSCH, Haan, Germany) at 350 rpm with a 30-min on and 30-min off cycle for 100 h. The elemental metals were placed in stainless steel containers with a ball to power ratio, BPR, of 5:1. These alloys were labelled B9, B11, B13, and B15 according to the atomic percentage of B in the alloy. Apart from the 100-h milled B9 sample, an additional B9 sample was manufactured. This second B9 sample was milled for 40 h instead of 100 h and was labelled as B9-40. The aim is to determine the effect of longer milling on the peak temperature for crystal growth and also the effects of B doping on the analysed properties. Additionally, a fifth alloy was produced following the same conditions as before for sample B9, however, substituting B for P (high purity P 98.9 wt.%) with a nominal composition of Fe
73.5Si
13.5P
9Cu
1Nb
3. As described before, two P9 samples were produced by milling the alloy for 40 and 100 h. The sample milled for 40 h was labelled as P9-40 while the sample milled for 100 h was labelled as P9. As both B and P are known elements that enhance the formation of nanocrystalline structures, thermal analysis will determine which element causes crystal growth to occur at lower temperatures. To complete the Fe-based alloys, two additional alloys were manufactured by mechanical alloying under similar conditions to those of the B and P samples. Nominal compositions of these two alloys are Fe
99Mn
1 and Fe
98Mn
2. Again, high purity (Fe 99.5 wt.% and Mn 99.95 wt.%) elemental metals were used to obtain the final alloys in powder form. The only difference was the milling length of 50 h instead of 100 h.
Thermal analysis of samples B9-40, B9, B11, B13, B15, P9-40, P9, Fe99Mn1, and Fe98Mn2 was carried out by Differential Scanning Calorimetry (DSC). DSC was performed using a TA Instruments Q2000 calorimeter (TA Instruments, New Castle, DE, USA)with a heating rate of 10 K min−1 for the seven samples between 450 K and 950 K. The selected temperature range ensures the detection of the peak temperature related to crystal growth. Heat flow increases when the sample reaches the crystal growth peak temperature. This technique will also measure if structural relaxations occur at lower temperatures.
The morphology of samples B9-40, B9-100, P9-40, P9-100, Fe99Mn1, and Fe98Mn2 was observed by Scanning Electron Microscopy (SEM) using a Zeiss DSM 960A device (Zeiss, Oberkochen, Germany). This device is also coupled with Energy Dispersive Spectroscopy (EDX) confirm the structural composition of the Fe99Mn1 and Fe98Mn2 alloys. The microstructural characterization of the B11, B13, B15, Fe99Mn1, and Fe98Mn2 alloys was performed by X-Ray Diffraction (XRD) in a Bruker APEX D8 Advance diffractometer (Bruker, Billerica, MA, USA) using Cu-Kα radiation with λ = 1.5406 Å. The diffractogram refinements were performed in MAUD software (accessed on 12 February 2020) applying the Rietveld refinement method.
The magnetic characterization of the as-milled powders (about 150 mg at each experiment) was performed by magnetometry at room temperature with magnetic hysteresis loops in a SQUID MPMS-XL device (Quantum Design; San Diego, CA, USA).
3. Results and Discussion
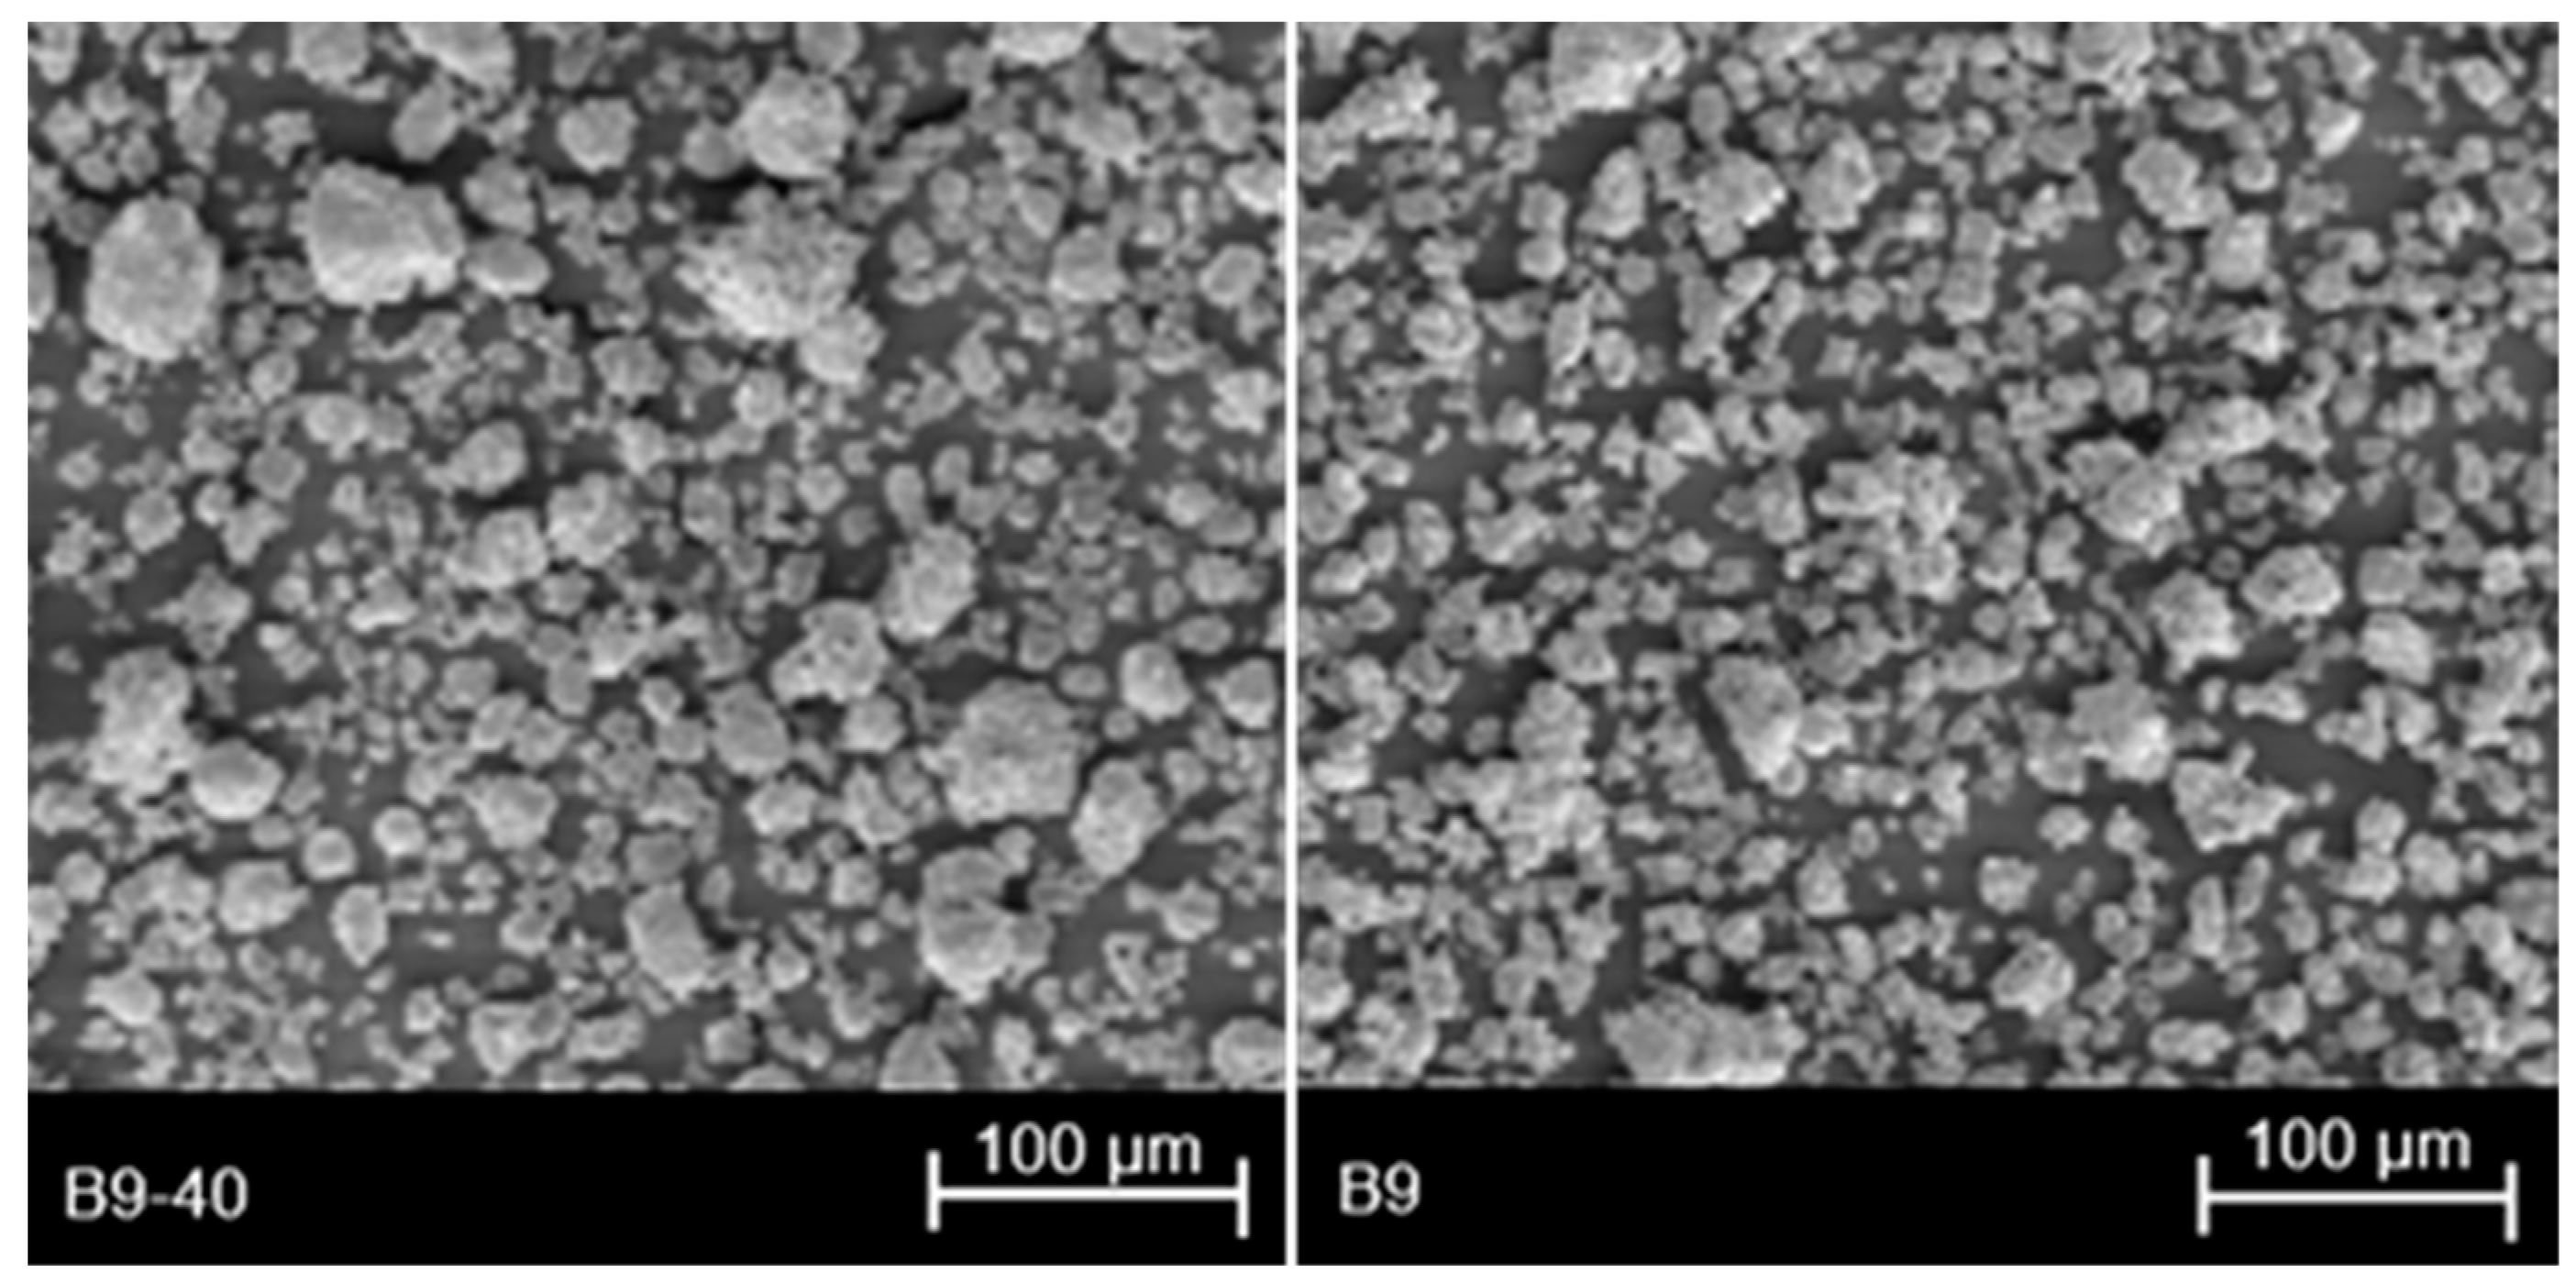
The morphology (SEM micrographs) for samples B9-40, B9, P9-40, and P9 are presented in
Figure 1 and
Figure 2. From the images of
Figure 1, a clear difference in the homogeneity of the particle size (micrometric range) can be observed for both milling lengths. By increasing the milling time, the homogeneity of the particle size also increases. For sample B9-40, particle size ranges from approximately 15 µm to 50 µm, while particle size for sample B9 ranges from 15 µm to 35 µm.
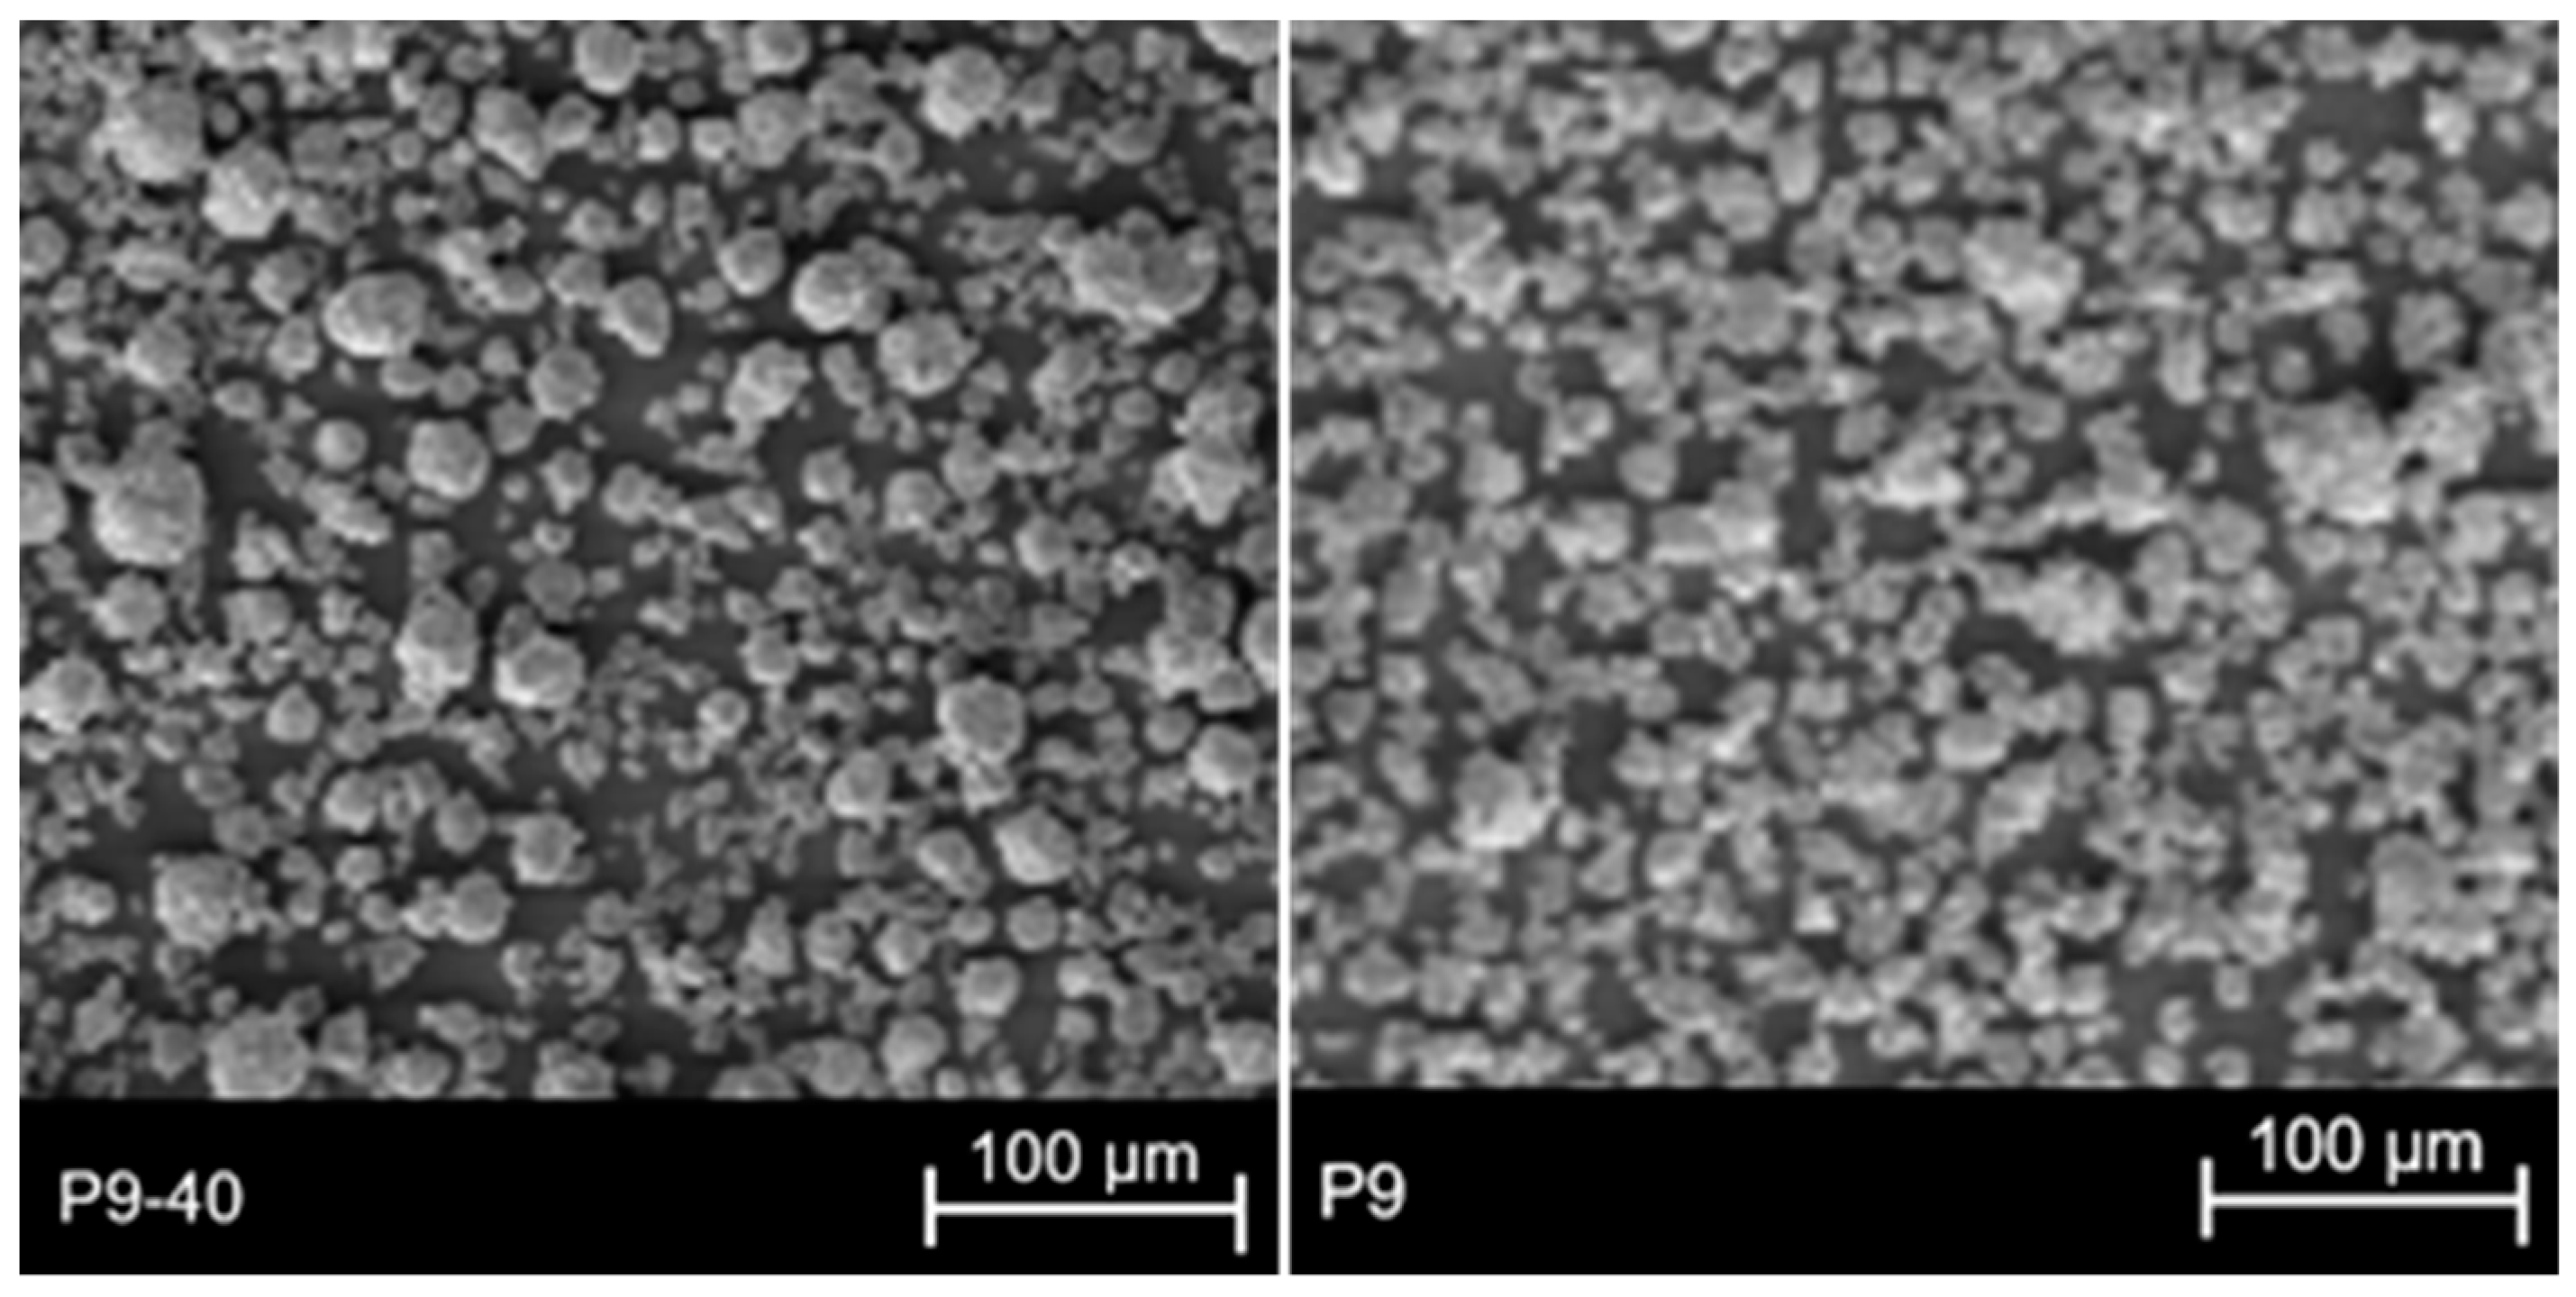
For samples P9-40 and P9, similar observations can be made to previous work. The homogeneity of particle size for sample P9, longer milling, is higher than that of sample P9-40, shorter milling. For sample P9-40, particle size ranges from 20 µm to 50 µm approximately while particle size for sample P9 ranges from 16 µm to 25 µm.
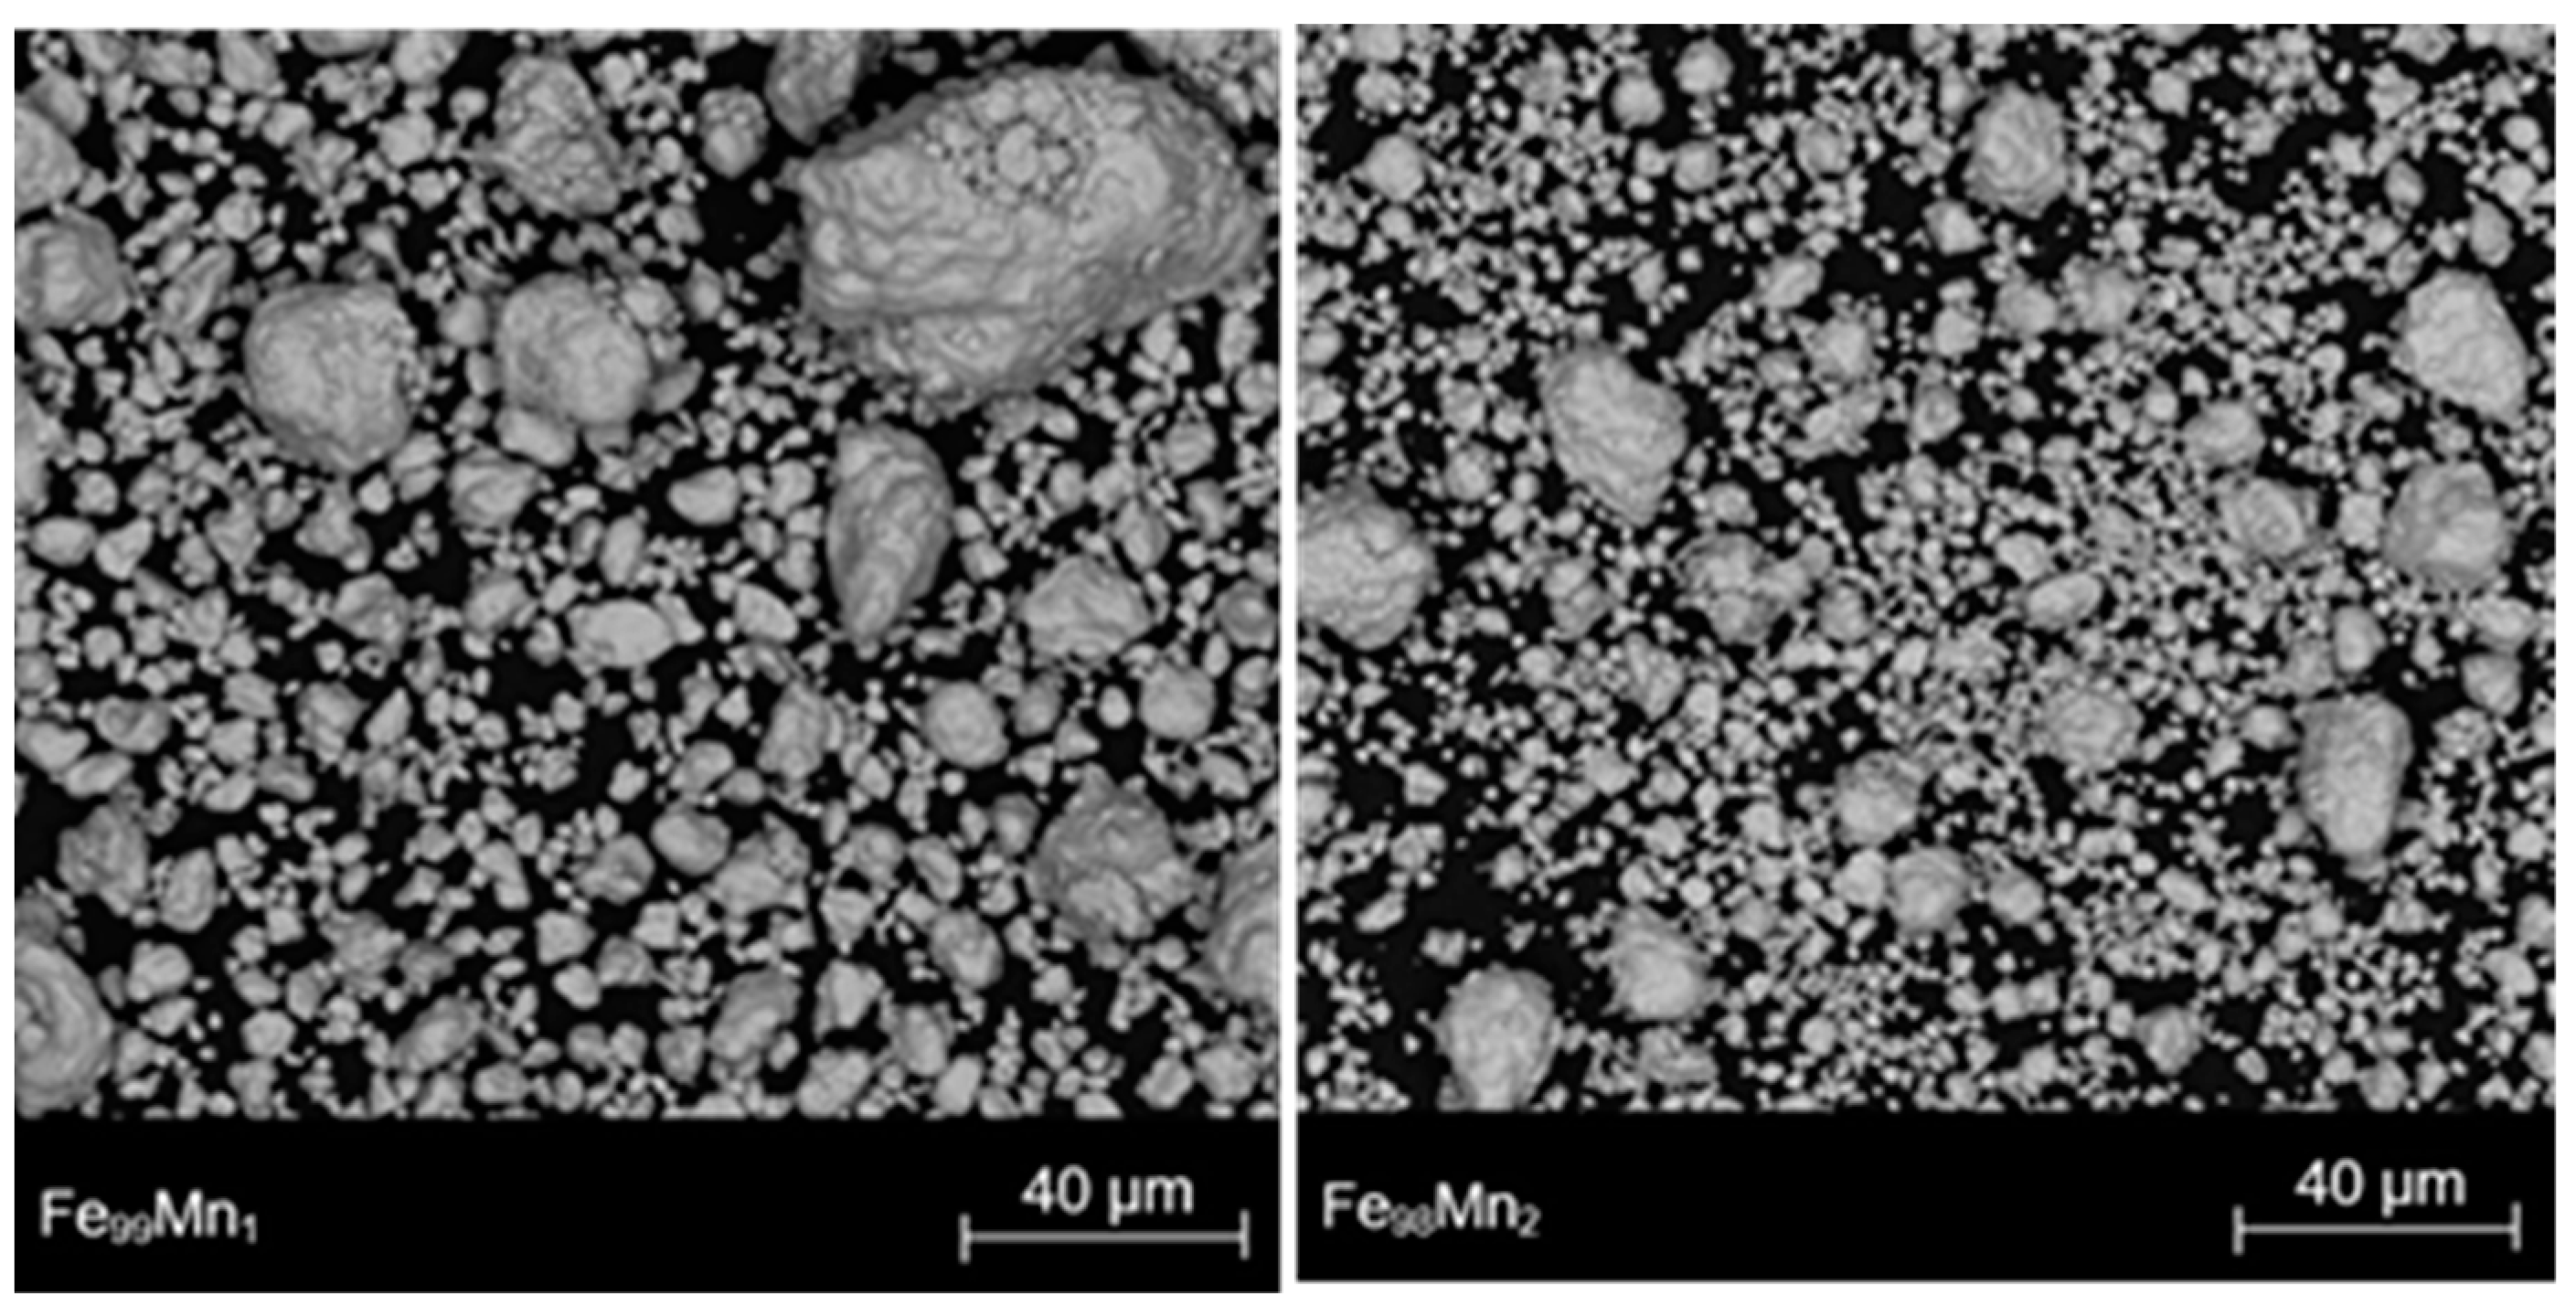
As mentioned previously, SEM analyses of samples Fe
99Mn
1 and Fe
98Mn
2 also include EDX to verify the chemical composition of the samples. From the SEM images (
Figure 3), similar observations can be made for both samples. The variability in particle size is notable especially for sample Fe
99Mn
1. However, the homogeneity of particle size for sample Fe
98Mn
2 is higher and similar to samples B9 and P9. For sample Fe
99Mn
1, particle size ranges from 5 µm to 65 µm approximately and, for sample Fe
98Mn
2, particle size ranges from 4 µm to 28 µm approximately.
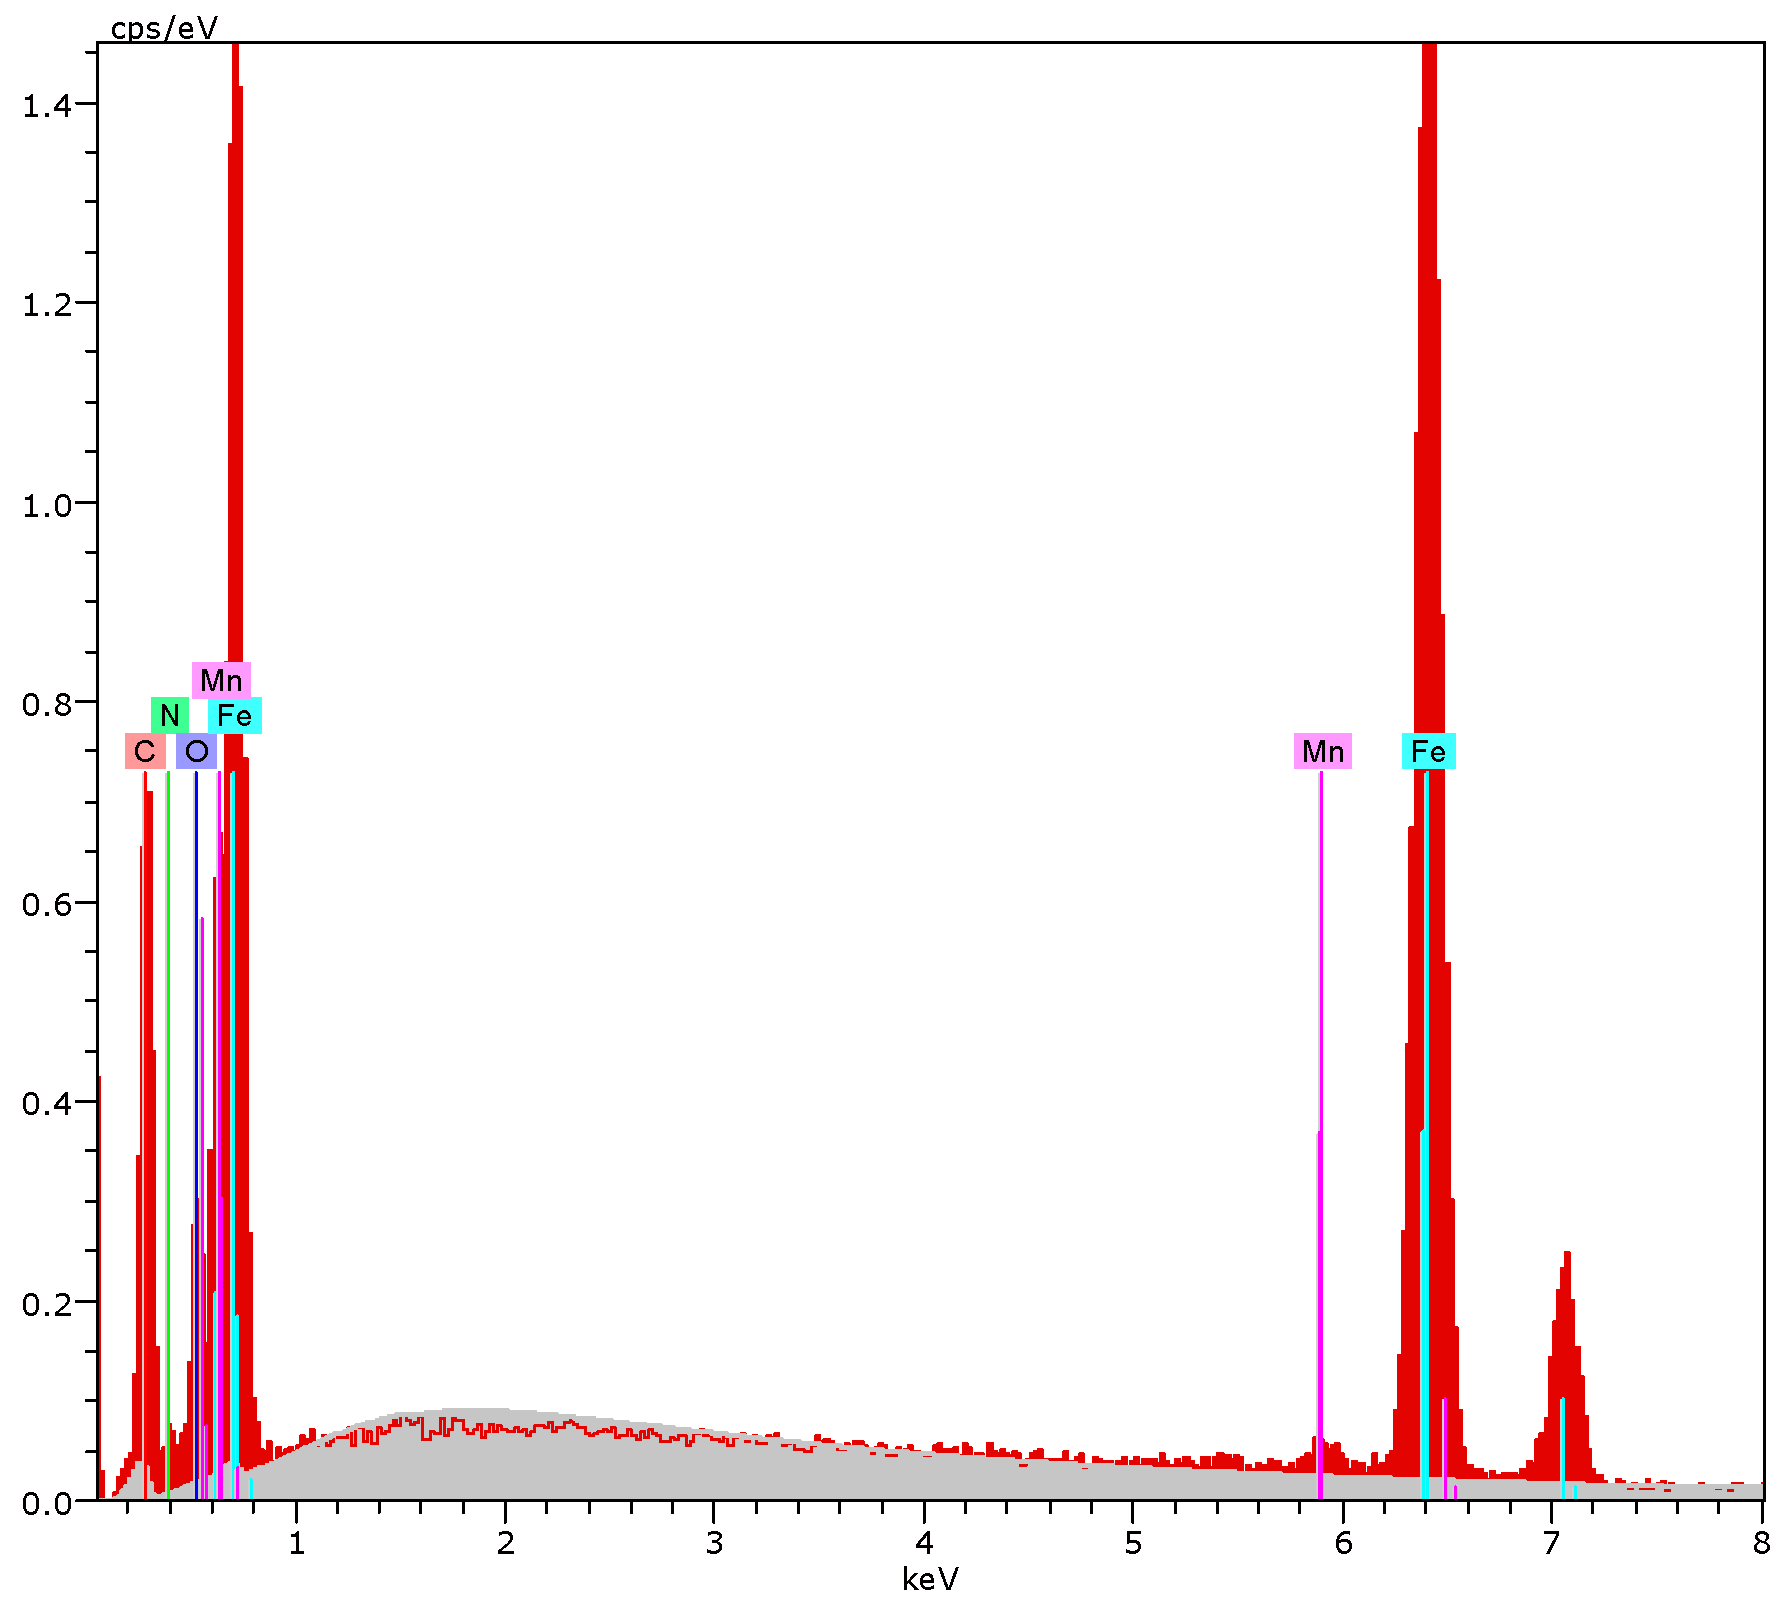
EDX results for both samples show how no impurities are detected in the samples. Despite the low percentage in manganese, EDX spectra confirm the presence of Mn. EDX results for sample Fe
99Mn
1 (
Figure 4) detect 98.5% in atomic weight of Fe and 1.5% of Mn. For sample Fe
98Mn
2, EDX results detect 97.3% in atomic weight of Fe and 2.7% of Mn. The variability in chemical compositions could be due to the EDX analysis itself as it is a semiquantitative technique. It is known that the lower detection limit depends on element and acquisition time [
15]. Due to the manufacturing conditions of mechanical alloying, Mn diffusion in the Fe matrix may not reach the necessary energetic conditions to achieve a homogenous Mn content within the alloys.
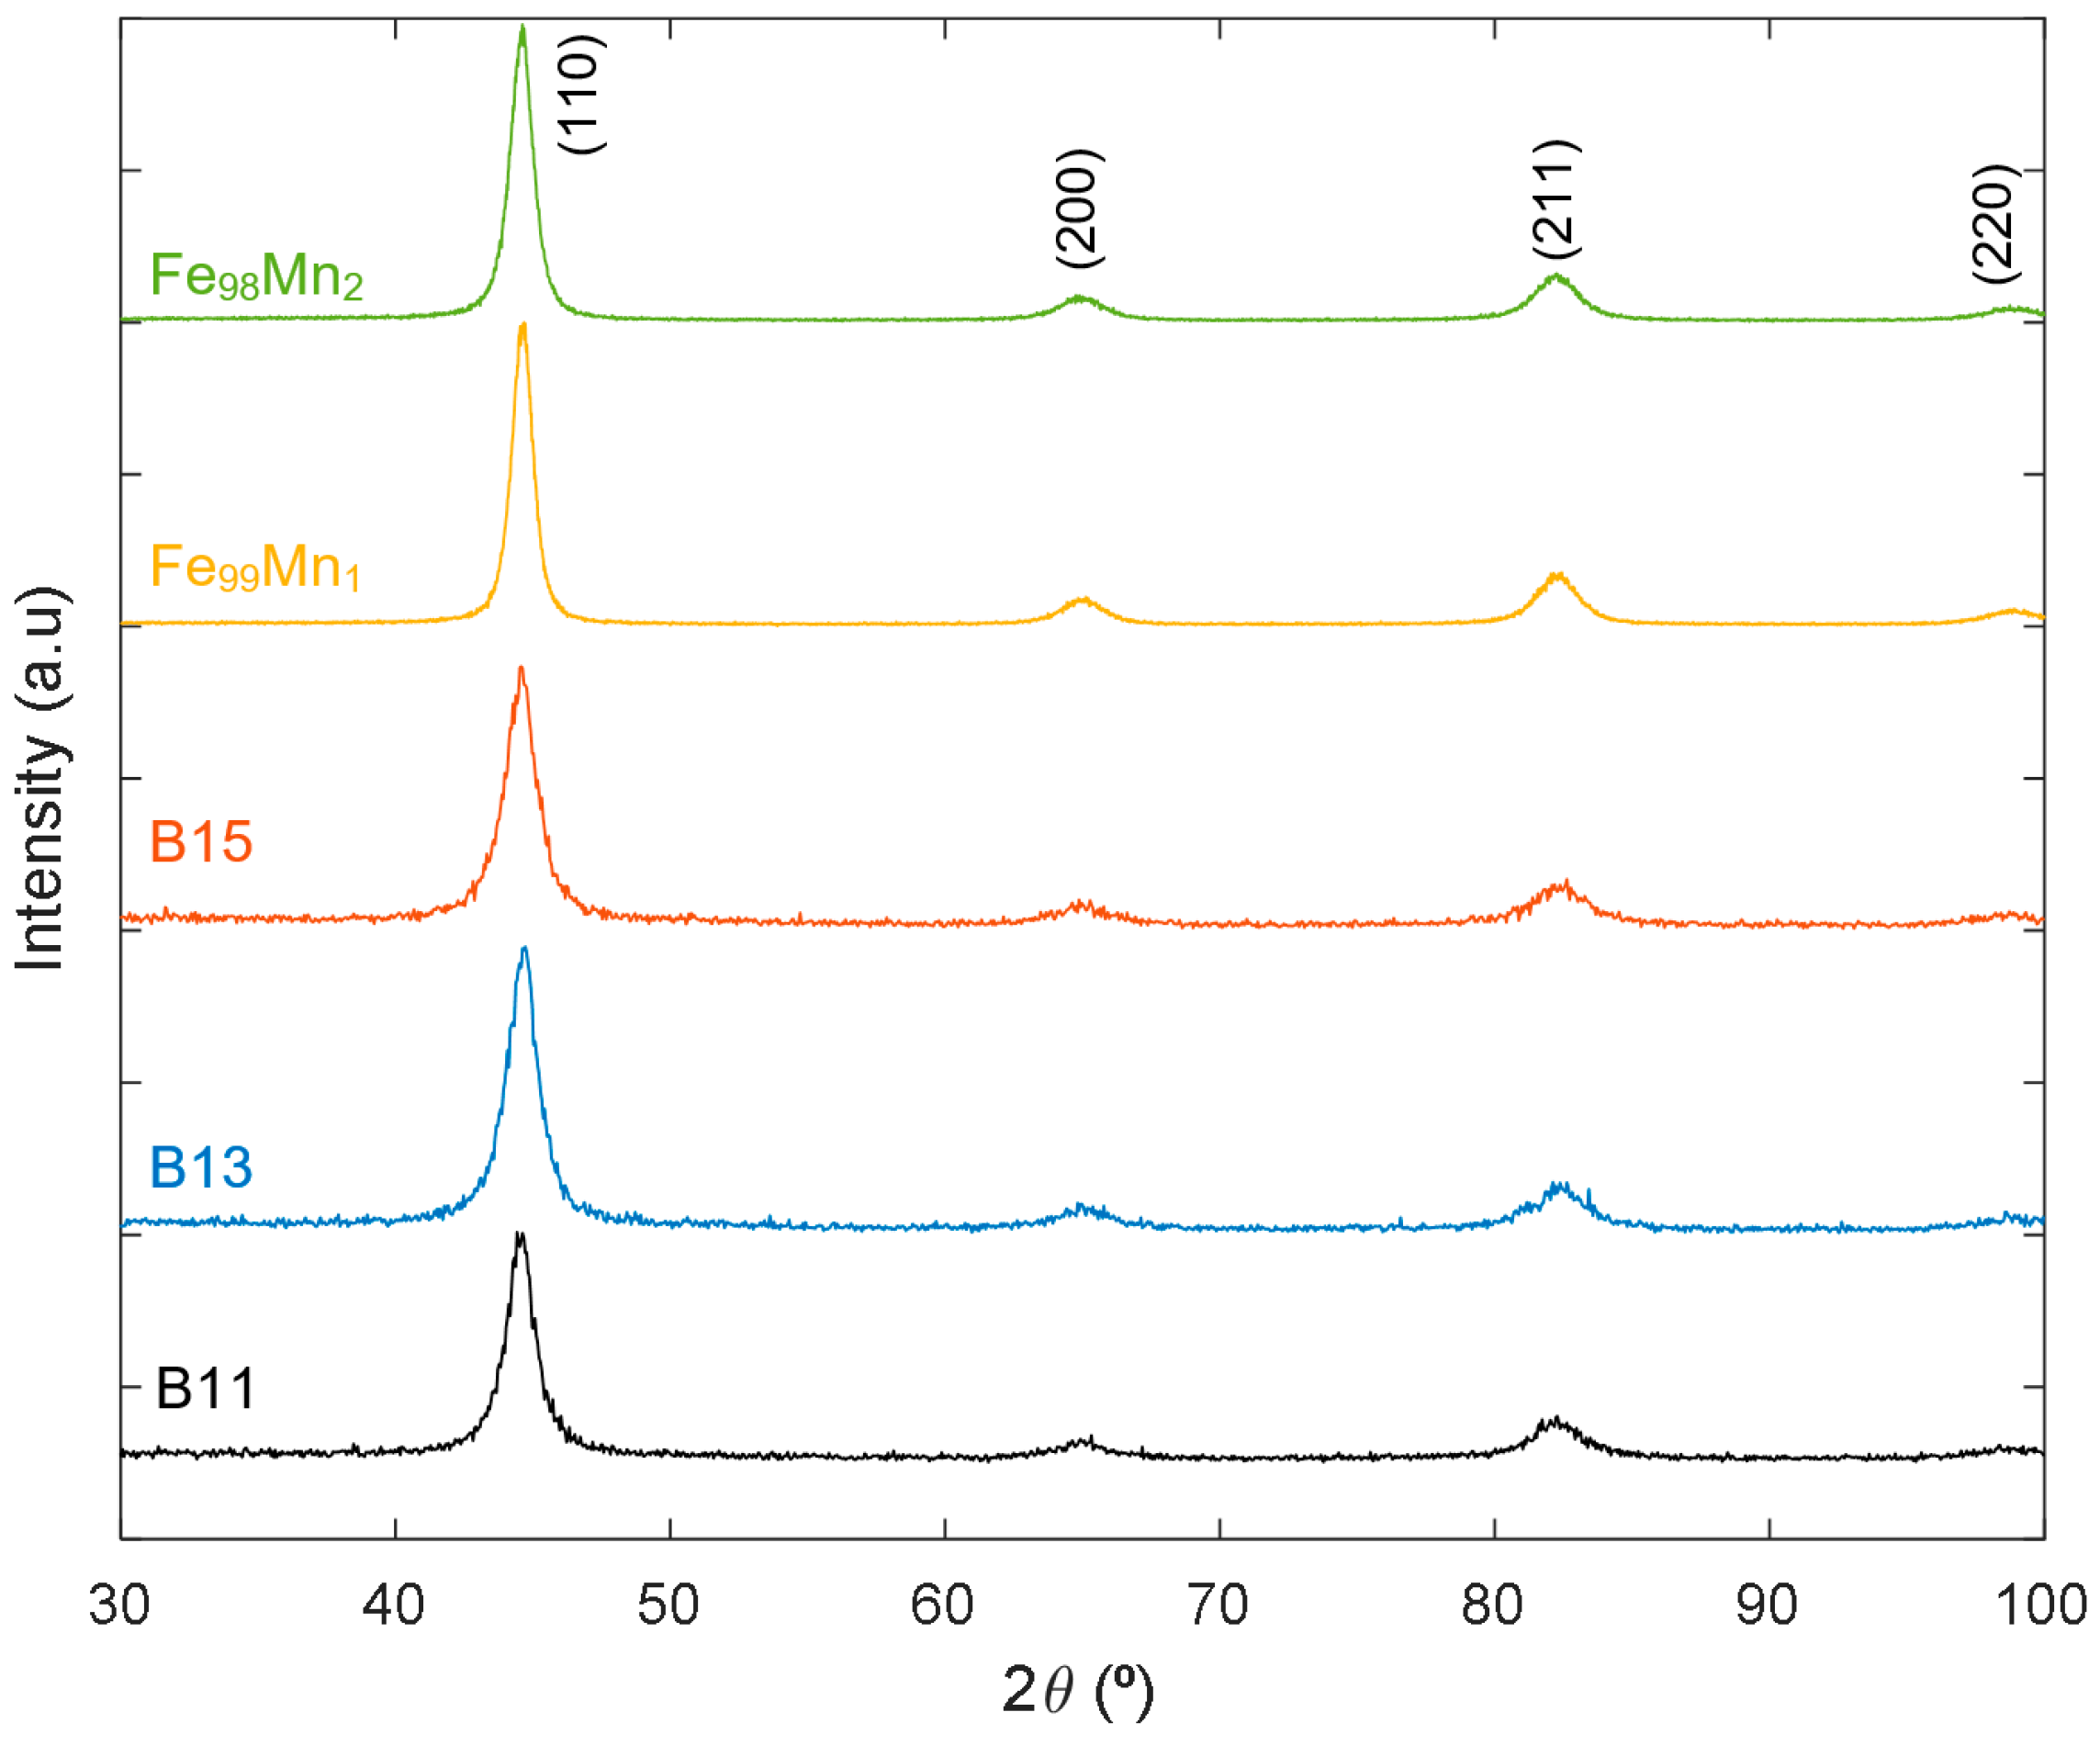
Regarding microstructure analysis, XRD was performed at room temperature on five samples: B11, B13, B15, Fe
99Mn
1, and Fe
98Mn
2. The diffractograms from the last two alloys are presented in
Figure 5. Rietveld refinement method was used on all five samples using scientific MAUD software (instrumental broadening corrected with Cagliotti method). The results indicate that the crystallographic structure of all the analysed samples correspond to a body-centred cubic (BCC) nanocrystalline structure. The maximum intensity peak was measured at an angle 2θ of approximately 44°. This peak corresponds to the (110) Miller Index related to the Fe BCC structure. The other identified peaks correspond to the (200), (211), (220), and (310) Miller indices.
Other results obtained include the cell parameter, crystal size, and microstrain index. The specific results for each sample are presented in
Table 2. Also, relevant refinement parameters are included. These parameters are the weighted residual (R
wp), expected residual (R
exp), and the goodness of fit (GoF).
The effects of B doping are clear for the obtained lattice parameters. As B doping increases, Si content in the alloy decreases, causing the cell parameter a to increase. This is related to the difference in ionic radii between B (Z = 5) and Si (Z = 14) atoms. The lattice parameter decreases from 2.867 Å for sample B11 (11% atomic weight of B) to 2.864 Å for sample B15.
As mentioned previously, the objective of adding elements such as B to a soft magnetic alloy is to obtain nanocrystalline structures that favour the magnetic behaviour of the alloy. The expected tendency, in the case of this study, would be to obtain smaller-sized crystals for higher concentration of B. According to the XRD results, this tendency is followed. Sample B11, with the smallest percentage in atomic weight of B, has the largest crystal size. As the percentage of B increases through samples B13 and B15, the crystal size obtained by Rietveld refinement decreases. Also, as mentioned in the DSC observations, an increase in B doping reduces the thermal stability of the alloy.
Samples Fe
99Mn
1 and Fe
98Mn
2 show different tendencies than the previous samples. Although the ionic radius of Mn (Z = 25) is slightly smaller than that of Fe (Z = 26), the corresponding cell parameter
a increases with the addition of Mn in the alloy. More specifically, lattice parameter increases from 2.870 Å for Fe
99Mn
1 to 2.871 Å for Fe
98Mn
2. A possible explanation for this tendency would be related to the stability of the valence orbitals of Mn and Fe. Fe has one more valence electron than Mn. Because of this, the atom of Fe will provide more energy to the valence electron in order to reach a higher energy orbital. For this reason, the ionic radius of Fe would be slightly higher, affecting, amongst others, the lattice parameter obtained by Rietveld refinement. The difference in crystal size is higher than those expected due to minor Mn addition. According to the results (
Table 2), the introduction of Mn into the alloy would decrease crystal size and, therefore, improve the magnetic behaviour of the alloy.
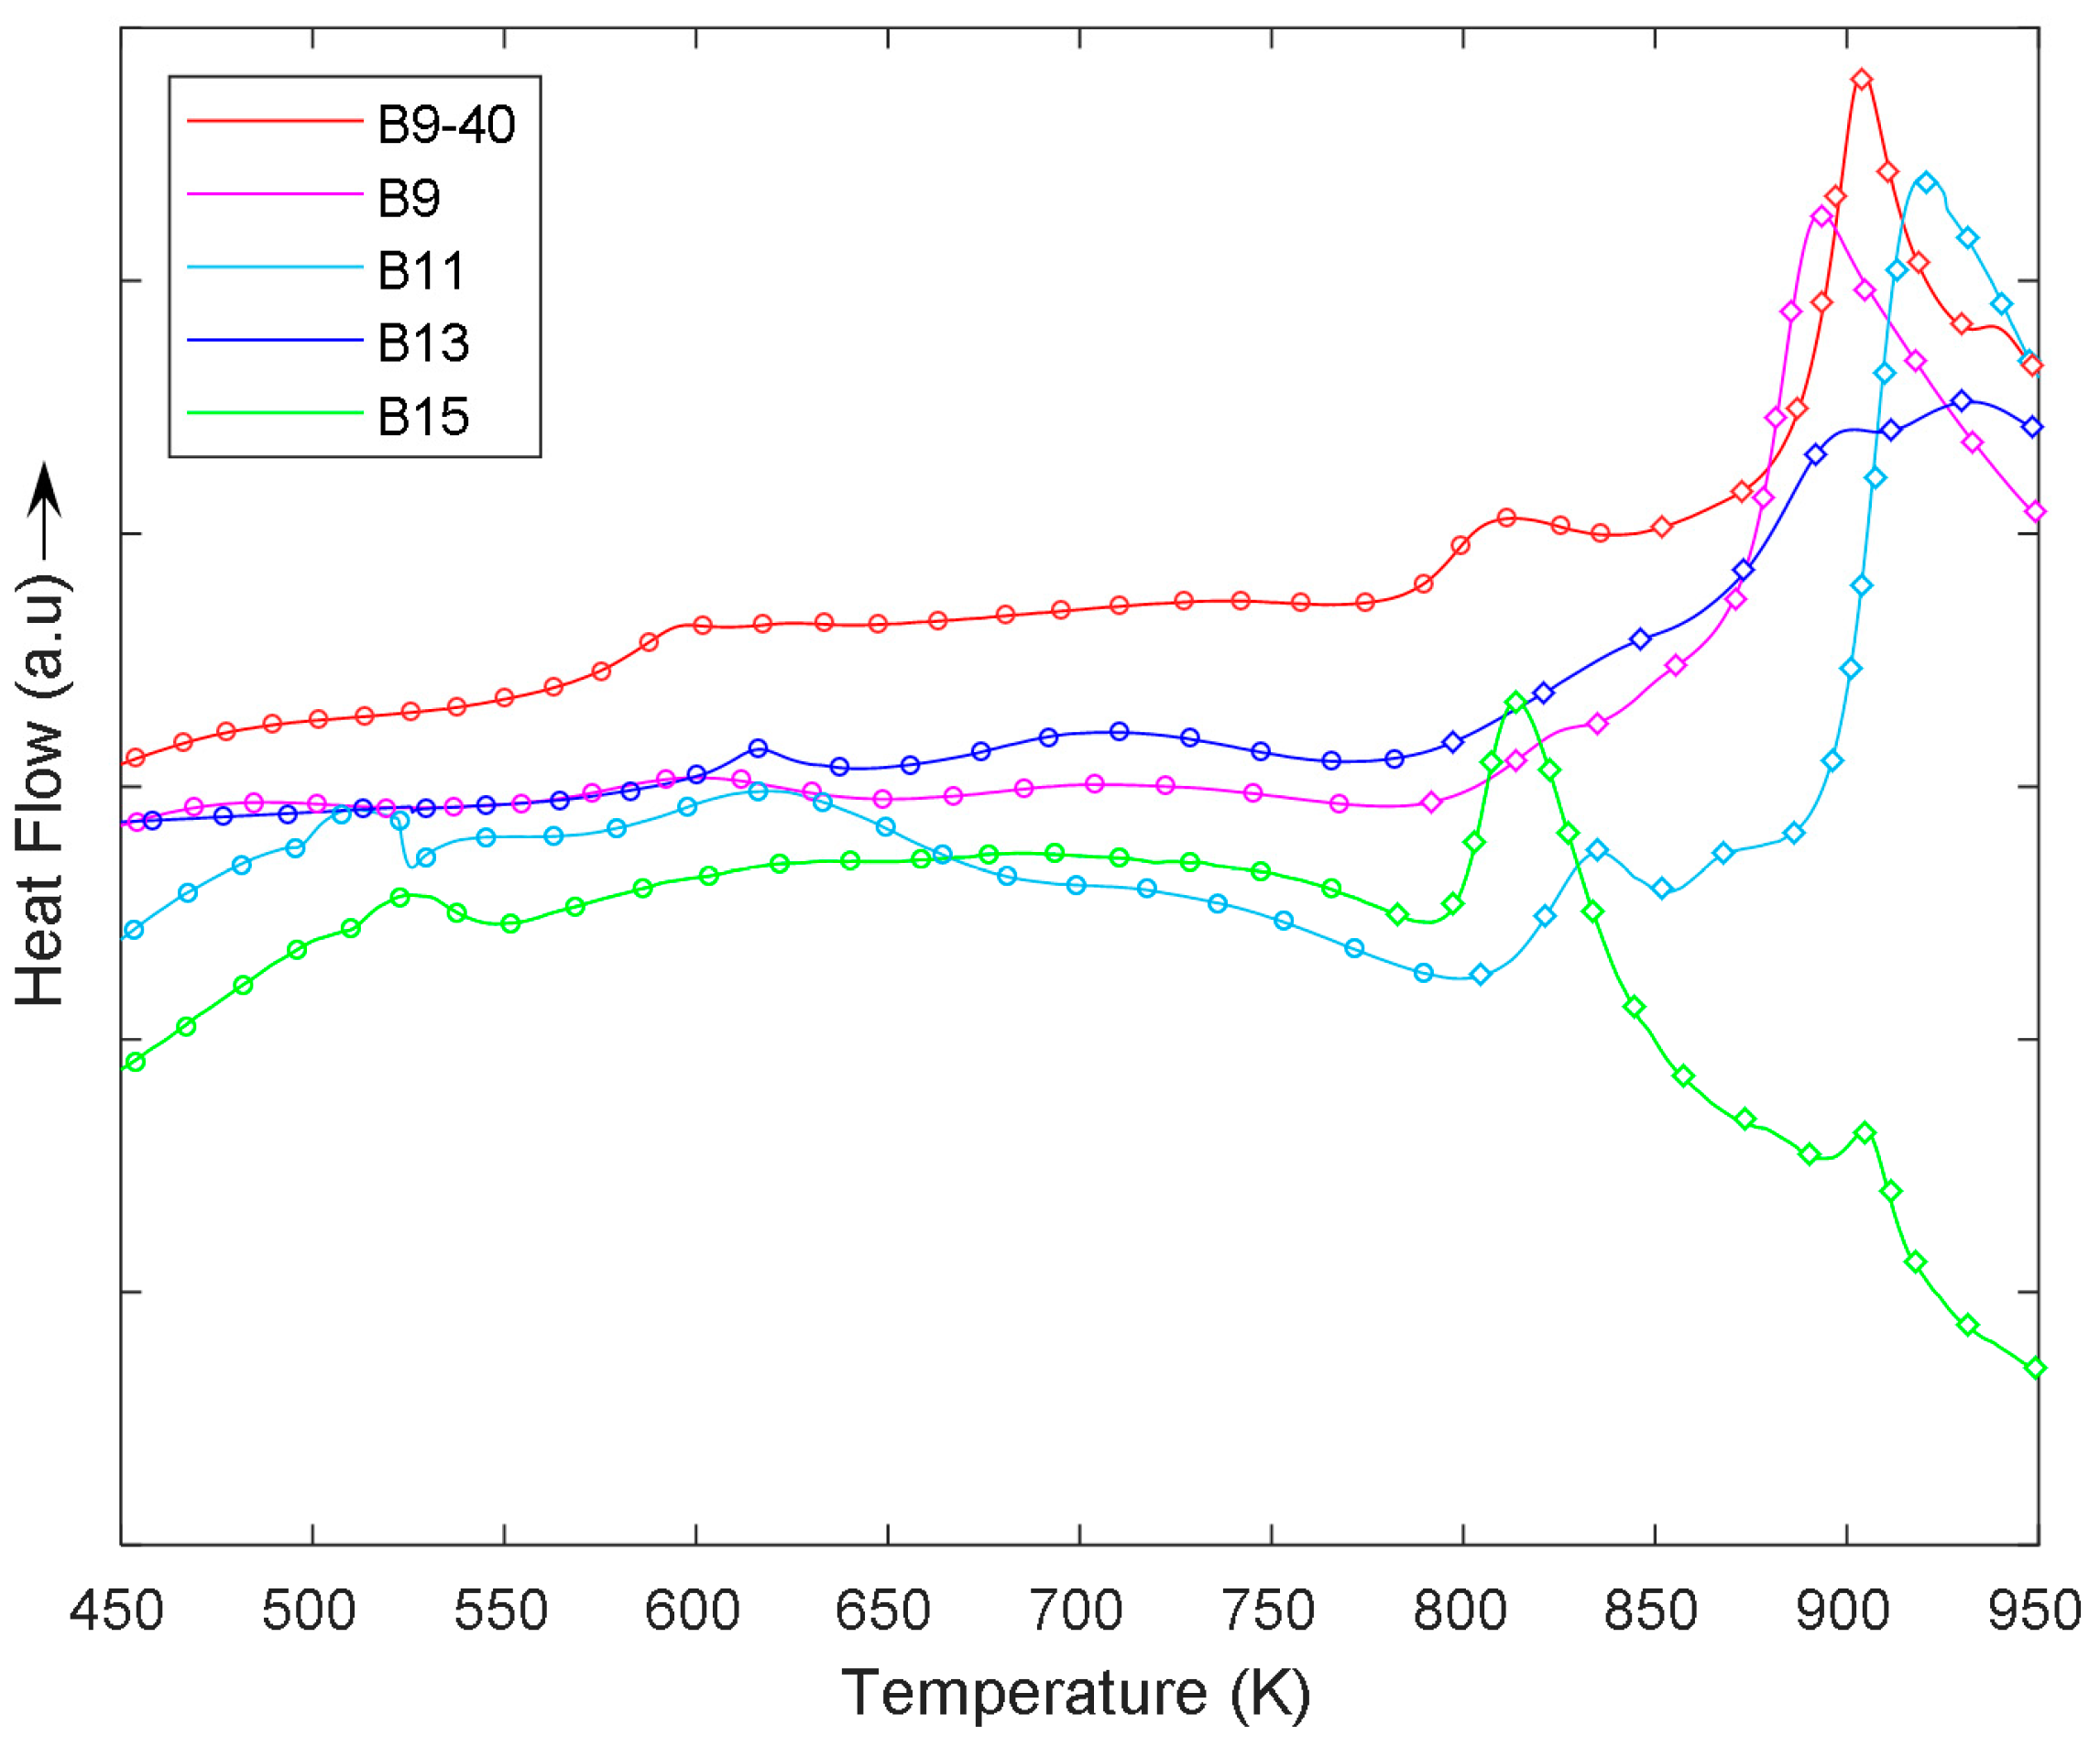
Thermal analysis (DSC) on milled samples B9-40, B9, B11, B13, and B15 is presented in
Figure 6. The results clearly show differences between all five samples. The variation of results does not only depend on chemical composition of the alloy but also on the production conditions. Taking into account previous literature of as-milled nanostructured alloys [
2,
16], we will assume that: (a) the broad exothermic processes at low temperature correspond to the internal structural relaxations of the milled powders and (b) the exothermic peaks correspond to the crystal growth peak of the nanocrystalline phase. These peaks define the ideal maximum temperature in which the corresponding alloys can be used. As stated previously, nanocrystalline phases are desired for the applicability of these Fe-based alloys. Therefore, crystal growth is not desired for the use of said Fe-based alloys.
The crystal growth peak for all samples, except sample B13, is well defined. In the cases of samples B9-40, B9, and B11, crystal growth peaks are detected at similar temperatures. For B9-40, this peak was detected at 905 K, for B9 at 896 K, and for B11 at 920 K. The temperature range for these peaks is of approximately 100 K for the three samples. Sample B13 does not present a well-defined peak. However, a clear change in the curve tendency is detected as 800 K. Although the crystal growth peak is not as clear for sample B13 as for the other samples, the change in tendency is also related to crystal growth. Finally, sample B15 presents a well-defined crystal growth peak at approximately 825 K. The temperature range for this peak is approximately 50 K. The results also show how the heat flow for B9-40 increases progressively at a temperature below the crystal growth peak, while for B9-100, heat flow variation is not significant before reaching the crystal growth peak temperature.
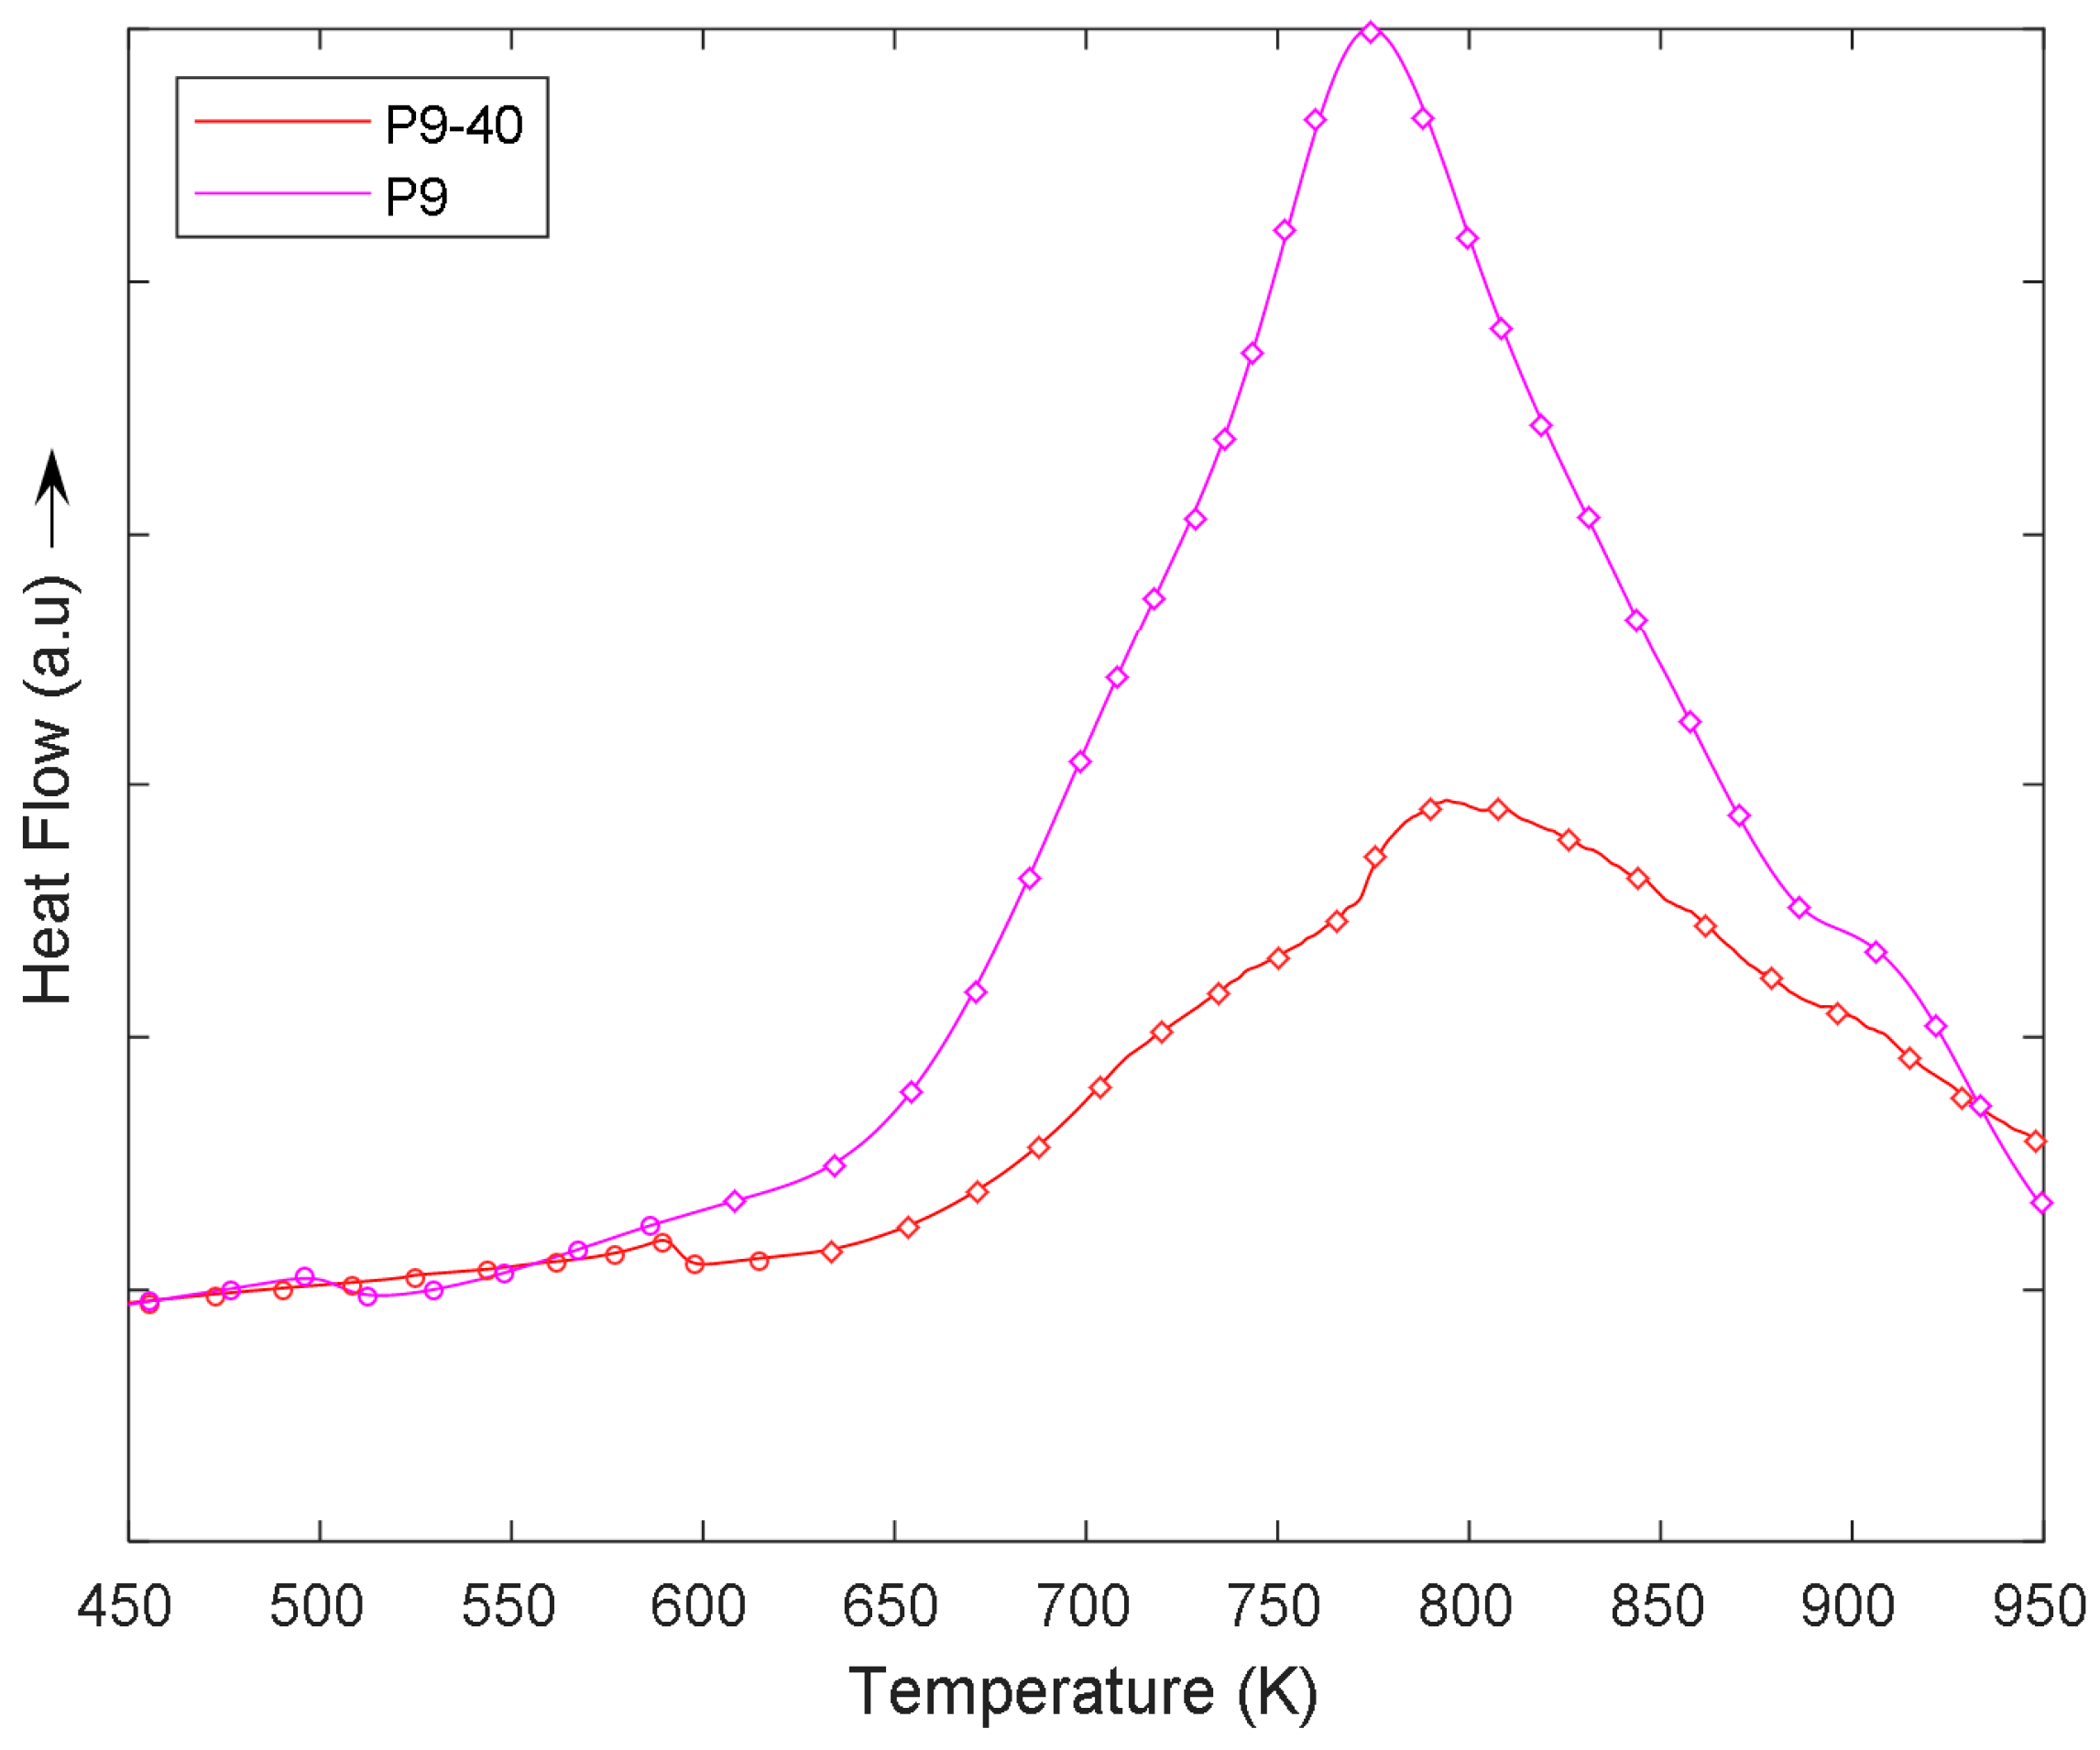
Samples P9-40 and P9 present similar results to B samples, however, crystal growth peaks were obtained at lower temperatures (
Figure 7). More specifically, P9-40 had its peak at 798 K and P9 at 777 K. The temperature range for the peaks measured for both samples is approximately 375 K. For both samples, heat flow variation at low temperatures is similar and not significant before reaching the corresponding crystal growth peak temperature.
The comparison between the B and P samples shows how crystal growth peaks occur at a higher temperature range for B samples (B9-40, B9, B11, B13, and B15) than P samples (P9-40 and P9). By observing
Figure 6 and
Figure 7, B stabilizes the alloys’ structure better than P with increasing temperature. The stability, however, depends on the atomic percentage of B, as for higher B doping, crystal growth peak temperature decreases to lower values. This implies that B samples present a higher working temperature range as crystal growth occurs at approximately 120 K above the crystal growth for samples P9-40 and P9. However, for sample B15, crystal growth occurs at similar temperatures to samples P9-40 and P9.
The activation energy of the samples should be taken into consideration when studying the possible applicability of the analysed alloys. A higher activation energy would imply that more energy is required to start crystal growth. The activation energy obtained by Kissinger linear method for samples B9 and P9 is also significantly different. For B9, activation energy was 156 kJ/mol, while for P9, activation energy was 231 kJ/mol. Despite P9 having a higher activation energy than B9, the range of applicability is defined by the crystal growth peak temperature and not by the activation energy. This is because sample B9 presents crystal growth at a much higher temperature than sample P9.
Also, from the results, it can be observed how longer milling of samples (B9 and P9) causes the peak temperatures to occur at lower temperatures than for the shorter milling samples (B9-40 and P9-40). Although differences in peak temperatures are low, approximately 10 K, for both alloys, the observation regarding the effects of the milling length is the same for both B and P samples.
Following with DSC analysis, the results for samples Fe
99Mn
1 and Fe
98Mn
2 are presented in
Figure 8. Scans for both samples are very similar. The main observation to be made from
Figure 8 is that no exothermic or endothermic peaks are detected. However, within the temperature range, heat flow continuously increases from higher temperatures. Because the detected process is not highly energetic, this continuous heat flow increase could be related to structural relaxations. This would imply that crystal growth for samples Fe
99Mn
1 and Fe
98Mn
2 would occur at higher temperatures above 950 K.
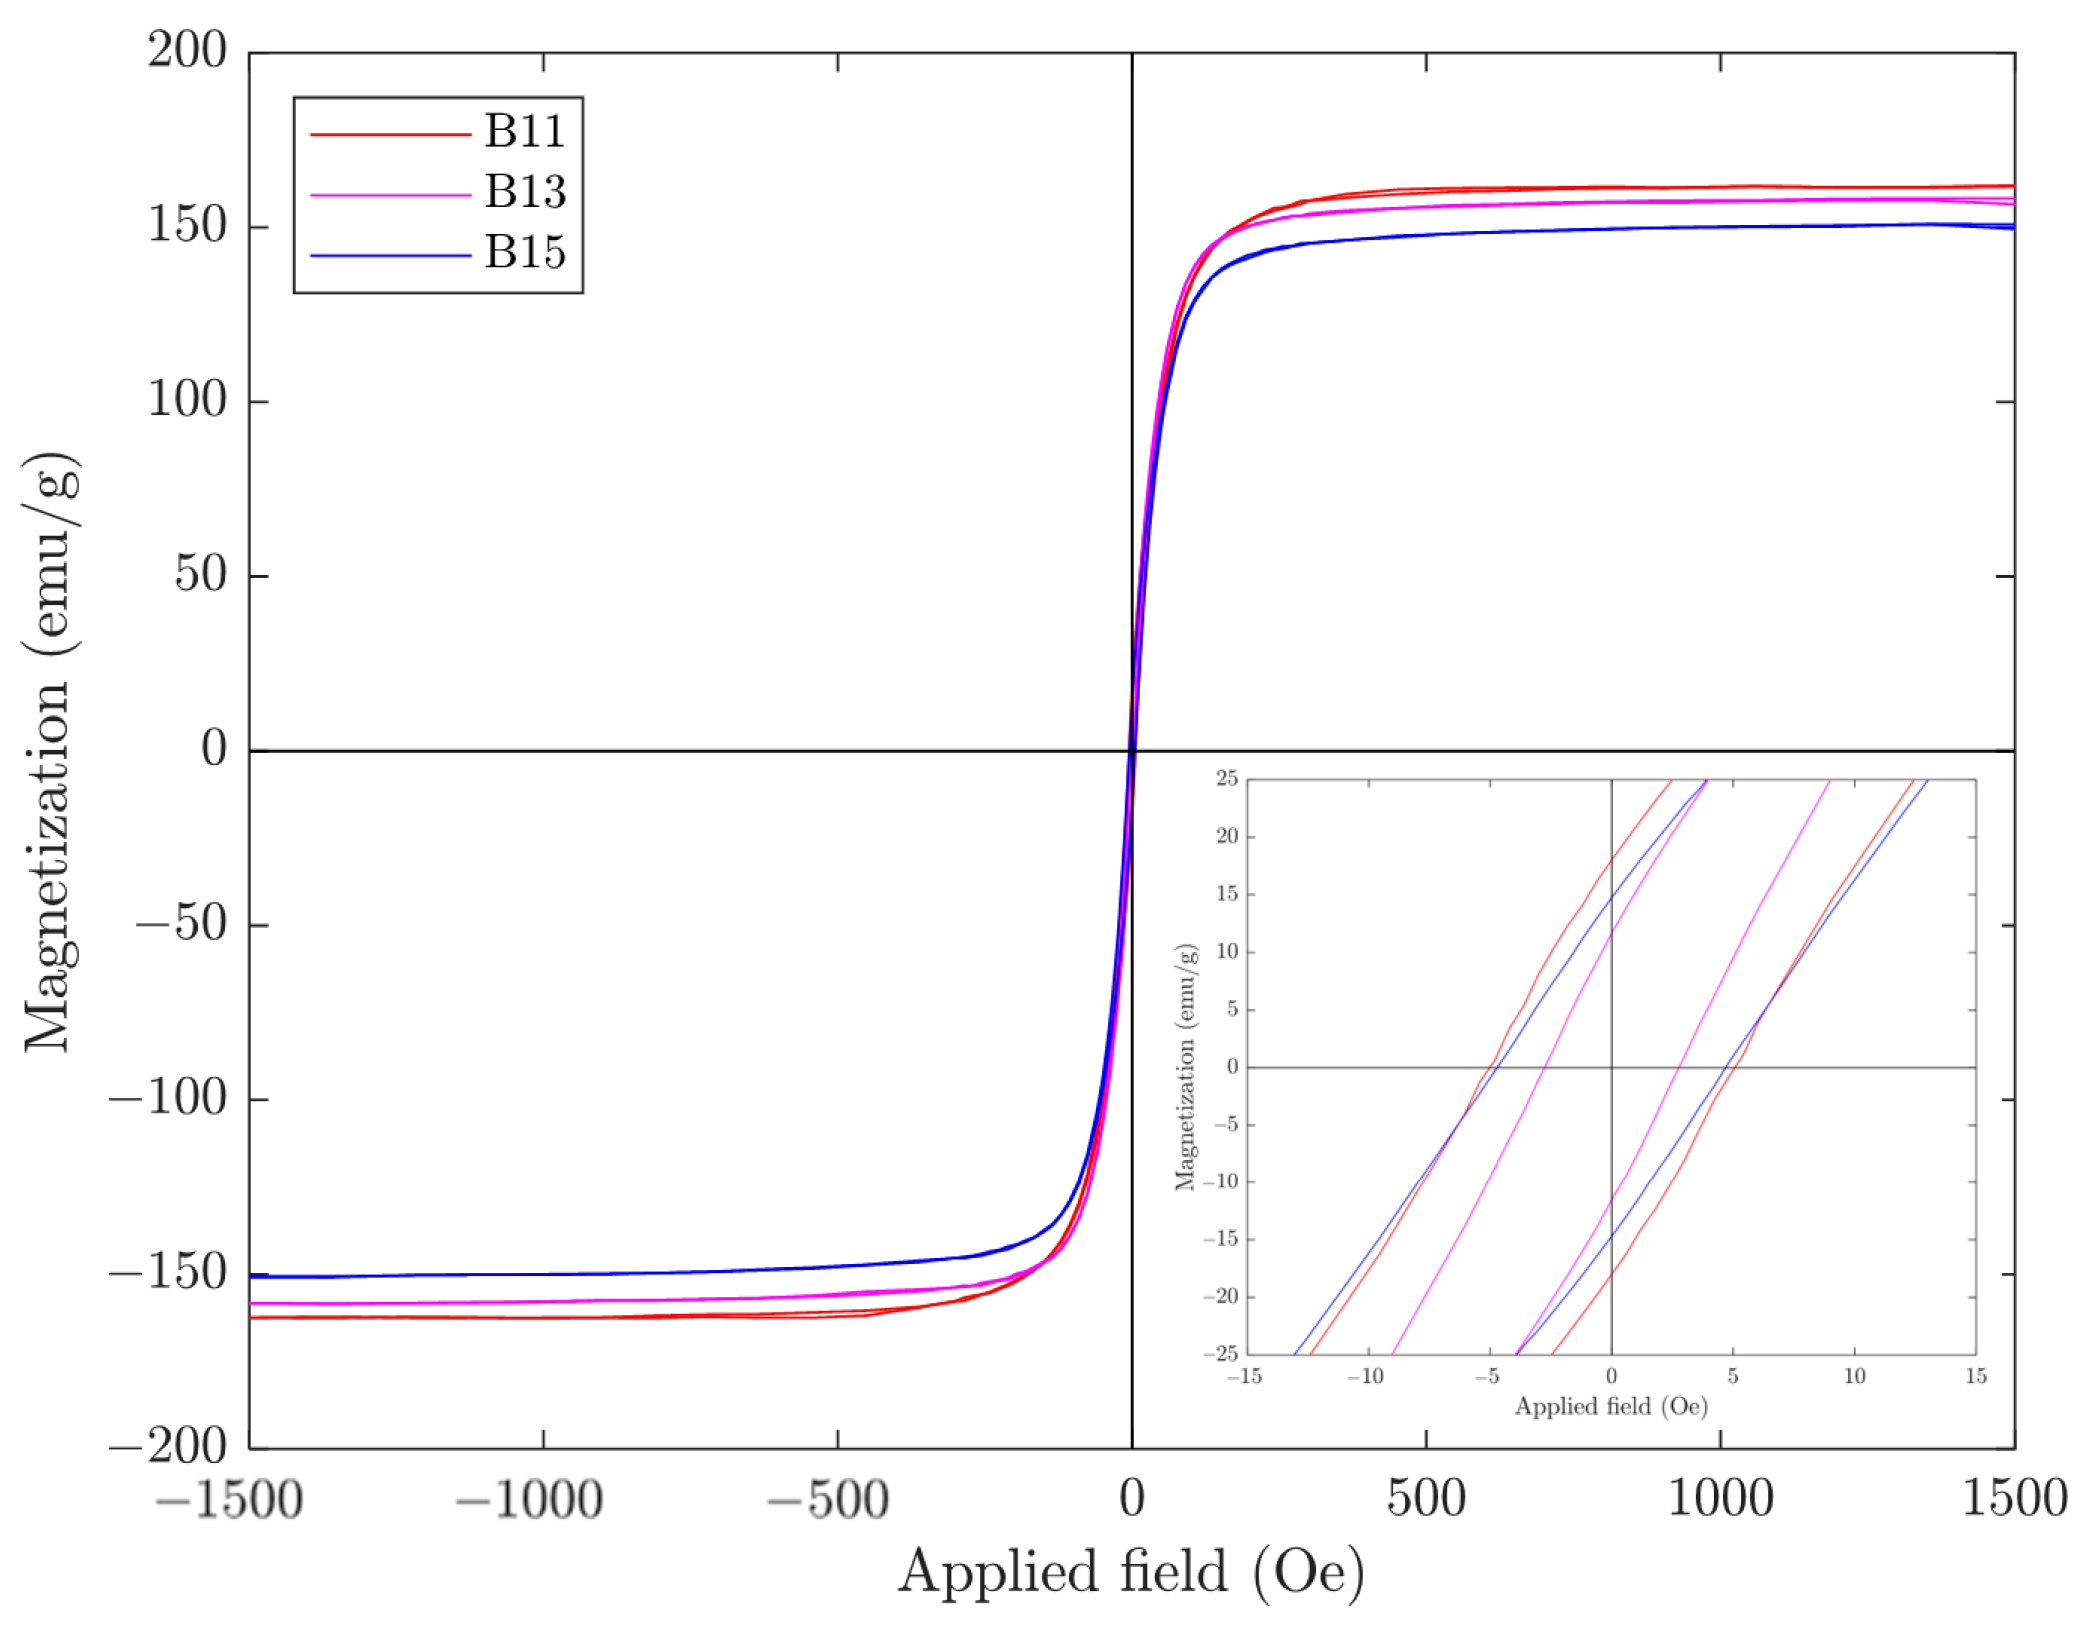
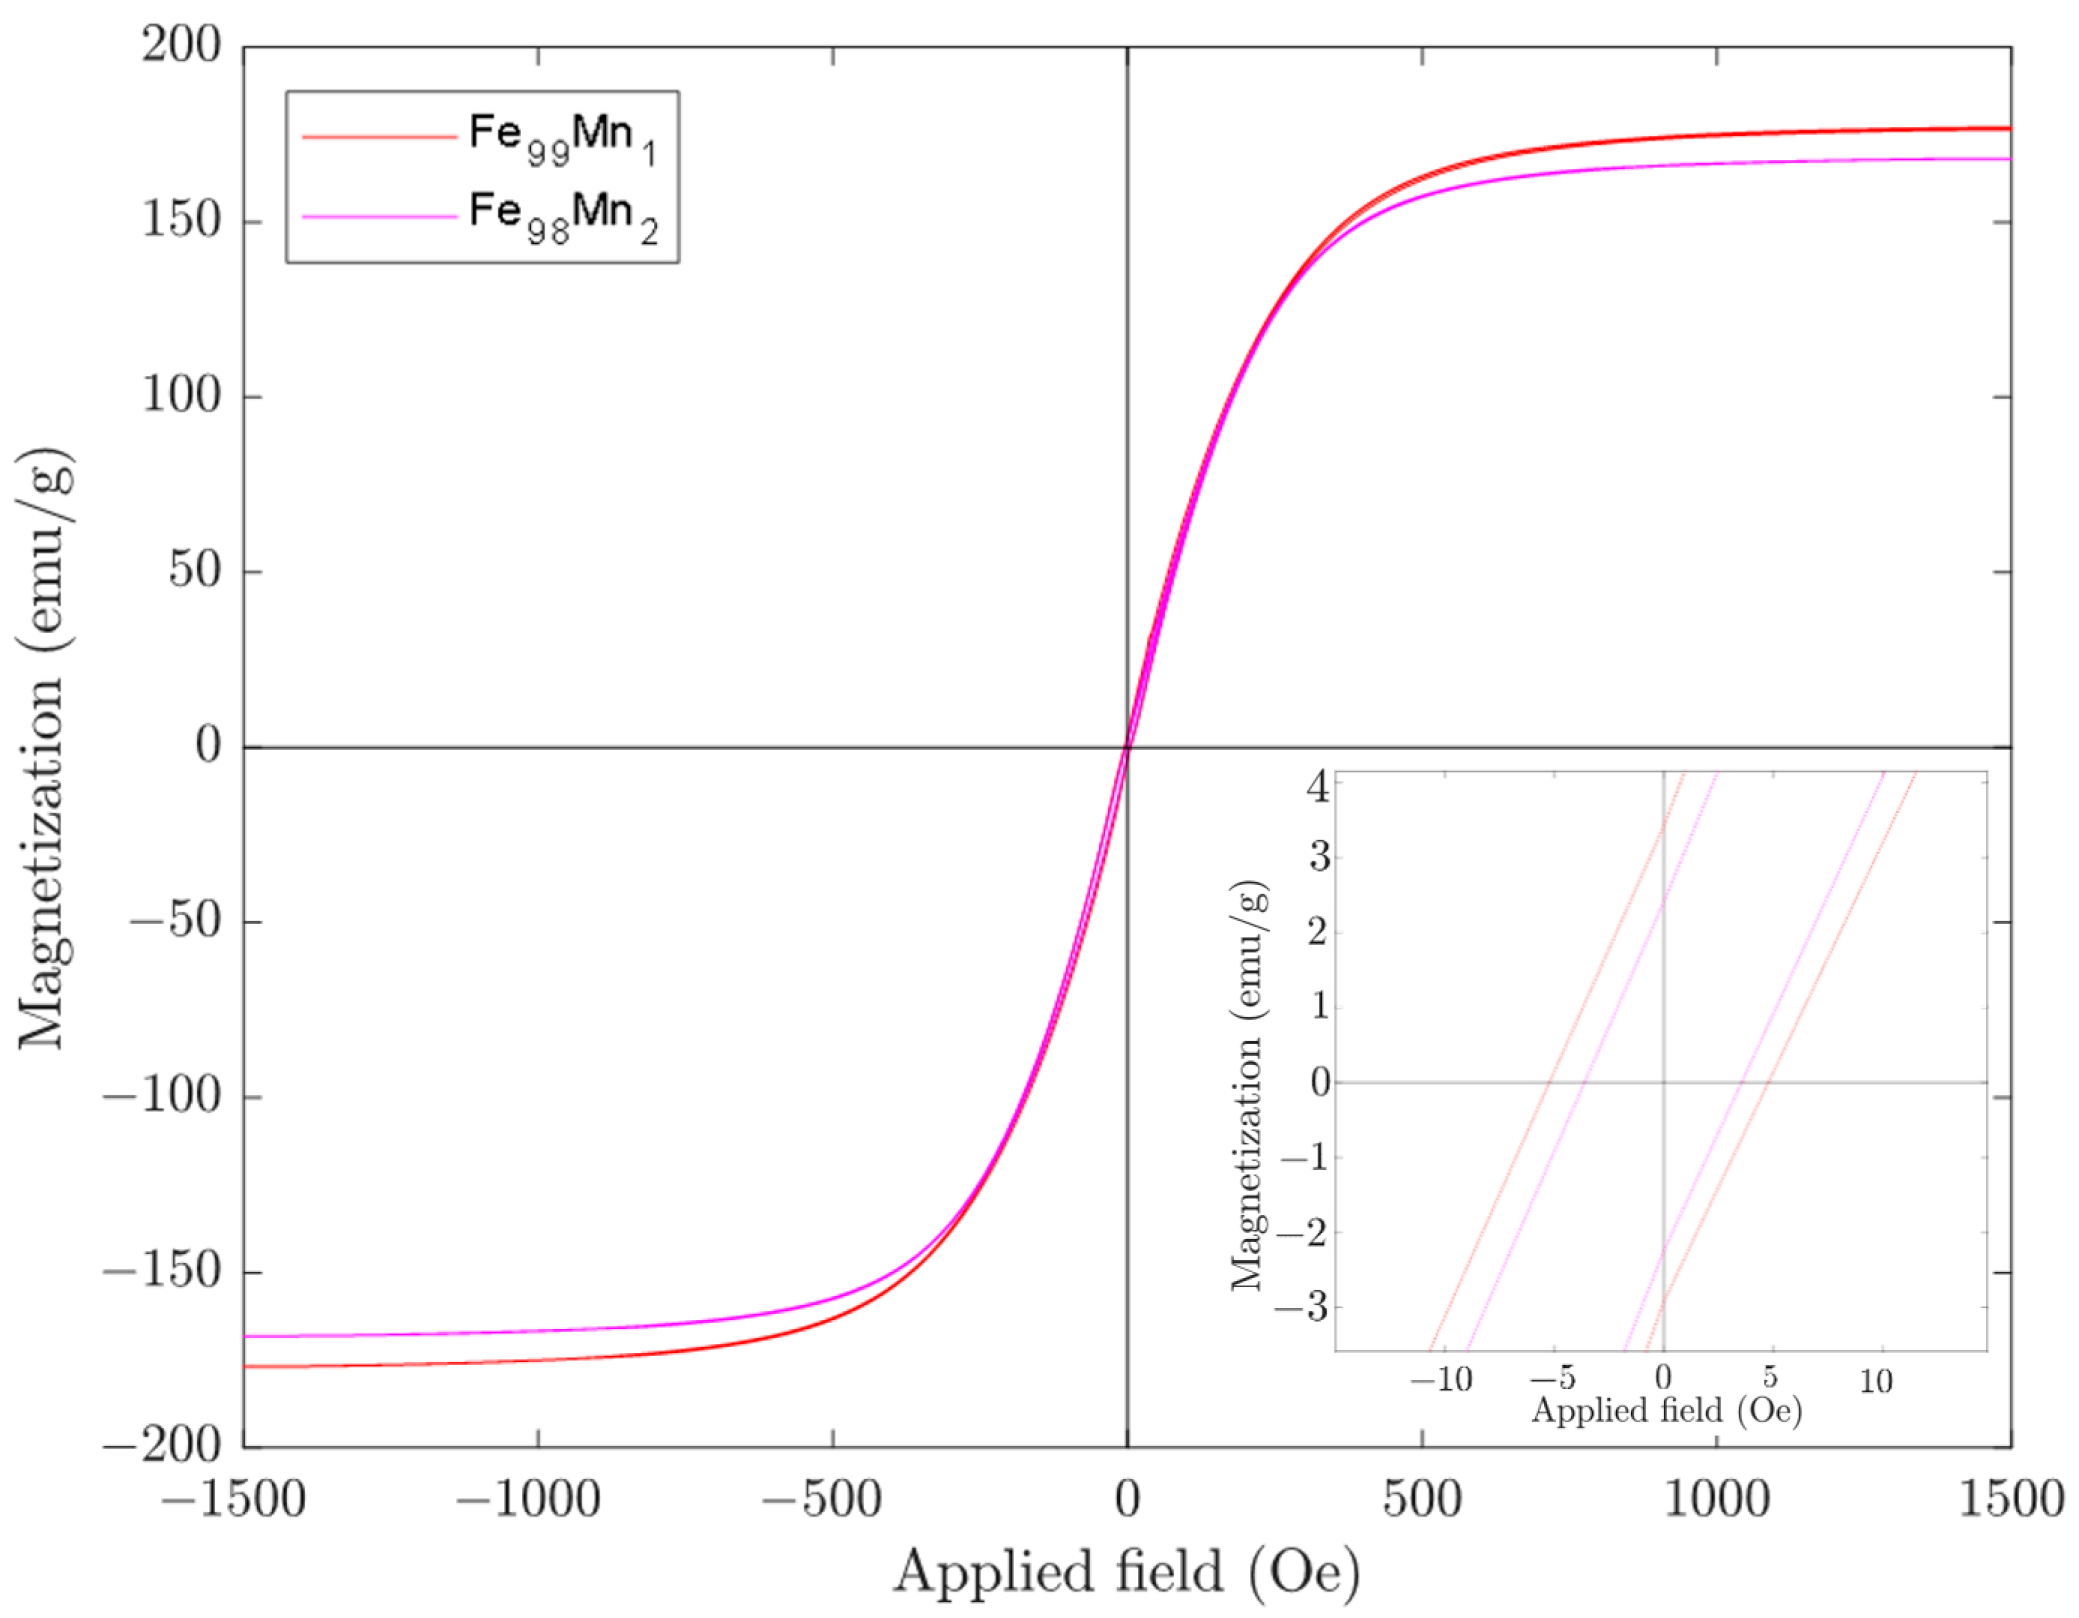
Regarding the magnetic response, the magnetic behaviour of as-milled samples B11, B13, B15, Fe
99Mn
1, and Fe
98Mn
2 is defined by the corresponding magnetic hysteresis loops (
Figure 9 and
Figure 10). These loops clearly indicate that the five alloys present a soft magnetic behaviour.
Table 3 summarizes the most relevant magnetic parameters: coercivity (H
c), remanent magnetisation (M
r), and the magnetization of saturation (M
s).
The effects of B on the magnetization are clear for the value of the saturation. Clearly, by adding B to the alloy, the atomic percentage of non-magnetic elements increases. Because of this, the saturation magnetization decreases as the atomic percentage of B increases. The other parameters in
Table 3 do not follow this tendency. As stated in
Table 3, the values of coercivity and remanent magnetisation are higher for sample B15 than for sample B13. This effect could be due to sample B15 forming a higher percentage of nanocrystalline phases in the alloy than sample B13. As observed in the structural analysis results (
Table 2), sample B15 presents a slightly smaller crystal size than sample B13, however, the quantity of nanocrystalline phases present in the alloy is not obtained. As mentioned previously, a higher quantity of nanocrystalline phases present in the alloy could improve the magnetic behaviour of the sample.
Magnetic behaviour of samples Fe
99Mn
1 and Fe
98Mn
2 is also clearly soft magnetic (
Table 3). With the exception of the remanent magnetization, all magnetic parameters are similar in value to the three B samples analysed previously. Remanent magnetization for both samples is significantly lower than B samples while the saturation magnetization is higher. The effects of Mn are also clear. As the atomic percentage of Mn increases, magnetic parameters decrease in value in a proportion higher in coercivity than those expected by Mn content, probably due to the lower size of the nanocrystals.
In general, if the grain sizes are small enough, the structural distortions associated with surfaces/interfaces reduce the magnitude of saturation magnetization, owing to the deviation of the interatomic spacings in the interfacial region and favoring lower values than those expected [
17].


