Article

Microstructural Evolution and Electrochemical Behavior of Solution Treated, Hot Rolled and Aged MgDyZnZr Alloy

by
Bruno Xavier de Freitas
1,
Leonardo A. Antonini
1,
Paula L. C. T. Cury
1,
Viviane L. F. da Silva
1,
Nabil Chaia
1,2,
Célia R. Tomachuk
1,
Stéphane Mathieu
3,
Gilberto C. Coelho
1,
Claudinei dos Santos
4,* and
Carlos A. Nunes
1
1
Departamento de Engenharia de Materiais, Escola de Engenharia de Lorena, Universidade de São Paulo, Polo Urbo Industrial, Gleba AI-6, Lorena 12602-810, SP, Brazil
2
Instituto de Ciência e Tecnologia, Universidade Federal de Alfenas, Rodovia José Aurélio Vilela, 11999, Poços de Caldas 37715-400, MG, Brazil
3
Institut Jean Lamour, UMR7198, Université de Lorraine–CNRS, 2 Allée André Guinier, BP 50840, CEDEX, 54011 Nancy, France
4
Faculdade de Tecnologia de Resende, Universidade do Estado do Rio de Janeiro, Rodovia Presidente Dutra km 298, Polo Industrial de Resende, Resende 27537-000, RJ, Brazil
*
Author to whom correspondence should be addressed.
Metals 2021, 11(11), 1855; https://doi.org/10.3390/met11111855
Submission received: 23 October 2021 / Revised: 10 November 2021 / Accepted: 13 November 2021 / Published: 18 November 2021
(This article belongs to the Special Issue Innovations in Metallic Biomaterials)

Abstract

:
In order to develop a potential route to fabricate plates and clips for orthopedic applications, a Mg–3.4Dy–0.2Zn–0.4Zr (wt.%) alloy was produced and analyzed in different conditions: solution treated at 525 °C for 3 h, hot rolled and hot rolled and aged at 250 °C. The aging behavior of the rolled alloy was investigated during isothermal aging at 250 °C, and a significant peak was observed at 10 h. The electrochemical behavior was evaluated in 0.9 wt.% NaCl solution at 37 ± 0.5 °C by potentiodynamic polarization and electrochemical impedance spectroscopy. The 525 °C-3 h and hot rolled specimens exhibited corrosion rates of 2.0 and 1.7 mm/year, respectively. The hot rolled and aged at 250 °C for 10 h specimen presented a grain size of 11.8 ± 1.7 μm with an intense macrotexture of the basal {0002} plane, hardness of 73 ± 3 HV and higher impedance modulus and obtained the highest corrosion resistance with a corrosion rate of 0.9 mm/year.

1. Introduction

Studies on magnesium (Mg) alloys containing zinc (Zn) and rare earth elements (REEs) are important for several applications, including bioabsorbable implants, due to their biocorrosion and biocompatibility properties [1,2]. It is well described in the literature that the presence of Mg 2 + and Zn 2 + cations are essential to the vital functions of the human body [3], and the normal Mg content in the blood is in the range of 1.7–2.22 mg/dL [4]. When these elements are in excess, they can be excreted out through the urinal route [3,5].
It has been reported that REEs should be used with caution in the human body [6]. However, investigations have shown that the dysprosium cation (Dy 3 + ) exhibits good cytocompatibility according to an in vitro study of cytotoxicity as well as an acceptable inflammatory response [7] with a half-lethal dose (LD 50 ) value of dysprosium chloride at 585 mg/kg [6,8]. Moreover, Dy 3 + may replace calcium (Ca) in hydroxyapatite, and Dy phosphate can be formed as a degradation product [9,10,11]. Another aspect is that Dy compounds might be used as negative contrast agents for high field magnetic resonance imaging [12], which may help to monitor the implant degradation in the human body.
According to the binary Mg–Dy phase diagram, Dy has an important solubility in α -Mg, with a maximum of 6.16 at.% reached at 560 °C, the highest of all REEs. However, it presents low solubility at room temperature [13]. Thus, Mg–Dy alloys are susceptible to microstructural modifications by thermomechanical processes. It has been reported that microalloying with Dy has positive effects in both mechanical and corrosion properties [6,14,15], and the control of second phases precipitation is one of the critical steps during thermomechanical processing and heat treatments of these alloys.
Generally, for Mg–REEs alloys, the solid solution decomposition during aging heat treatments at low temperatures proceeds in the following sequence: Mg supersaturated solution → β β β 1 β , where β , β and β 1 are metastable phases and β is only the stable one, with stoichiometry of Mg 24 Dy 5 [16,17]. In addition, during the early stages of aging heat treatments, the β -phase precipitation is common and is characterized by a D0 19 -type structure [18]. The β precipitation in the α -Mg matrix is responsible for the peak of hardness of aged alloys [19] and presents an orthorhombic unit cell [20] with Mg 7 Dy stoichiometry.
Regarding the corrosion process of Mg–Dy alloys, a pitting corrosion mode takes place when the Dy content is increased [6], which is generally caused by galvanic corrosion between α -Mg matrix and intermetallic phases [21]. Previous studies involving a Mg–5Dy (wt.%) alloy demonstrated a filiform corrosion mode with a corrosion rate of 0.5 mm/year in 0.9 wt.% NaCl aqueous solution [6]. During the corrosion process, Dy is oxidized and incorporated into corrosion films [6,11]. Dy 2 O 3 and Dy(OH) 3 have been observed as corrosion products in a Mg-10Dy (wt.%) alloy [11], where Dy(OH) 3 is mainly distributed at the outer and Dy 2 O 3 at the inner corrosion layer.
In this work, a MgDyZnZr alloy was produced from pure elements by a melting/casting process and a plate was manufactured by hot rolling. Possible precipitation strengthening and the electrochemical behavior were investigated in order to evaluate the potential of the material as plates and clips for orthopedic applications or as a substrate for drug delivery devices.

2. Materials and Methods

2.1. Alloy Fabrication and Heat Treatments

A Mg–3.4Dy–0.2Zn–0.4Zr (wt.%) (named MgDyZnZr) alloy was produced using high-purity Mg (min. 99.97%), Dy (min. 99.9%), Zn (min. 99.9%) and Zr (min. 99.8%). The raw materials were induction melted in a water-cooled copper crucible under argon atmosphere, producing an ingot of dimensions near 30 mm diameter by 30 mm length. The as-cast ingot was solution treated at 525 °C for 3 h (named as “H525 °C-3 h”) under argon flux and then slowly furnace cooled to room temperature.
A small plate of 14 mm thickness was removed longitudinally from the ingot, pre-heated at 450 °C for 0.5 h and then hot rolled to a thickness of 2.2 mm (84.2% of reduction) after multiple passes. Between rolling passes, the material was heated at 450 °C for 5 min. The hot rolled specimens are named “rolled” hereafter. Specimens cut from the final hot rolled plate were aged at 250 °C under an argon atmosphere for different times and named, e.g., “aged-10 h”, for a specimen aged for 10 h.

2.2. Vickers Hardness

The hardness values of the different specimens were determined using a Vickers hardness tester (Buehler MicroMet 6020) with load of 100 gf and holding time of 15 s. For each specimen 20 points were randomly measured.

2.3. Microstructural Characterizations

The different MgDyZnZr alloy specimens were characterized in terms of chemical composition, microstructure and macro-texture. For chemical composition analysis, scanning electron microscopy (SEM) (Hitachi TM3000) in the backscattered electron mode (BSE) equipped with X-ray energy-dispersive spectrometer (EDS) was used. X-ray diffraction (XRD) (PANalytical, Empyrean) was performed with Cu-K α radiation, at 40 kV and 30 mA; 2 θ ranging from 20° to 60°, step size of 0.02° and counting time of 150 s per step. The macro-texture of aged-10 h specimens was determined by measuring pole figures of {10 1 ¯ 0}, {0002} and {10 1 ¯ 1} using XRD (PANalytical, Empyrean) with Mo-K α radiation at 40 kV and 30 mA, and the data was compiled with ATEX software [22].
The grain sizes of the different specimens were determined using light optical microscopy (LOM) (Leica DM 4000 M) applying the line intercept method [23]. The specimens for LOM observations were ground, polished and etched in a 6 g picric acid, 100 mL ethanol and 10 mL H 2 O solution.

2.4. Electrochemical Tests

Electrochemical measurements of the H525 °C 3 h, rolled and aged-10 h specimens were carried out in an aqueous solution of 0.9 wt.% NaCl at 37.0 ± 0.5 °C in order to simulate human body conditions. The tests were performed using a SOLARTRON 1287A potentiostat/galvanostat equipment model 1287A equipped with a SOLARTRON 12587S impedance analyzer module and a three-electrode cell formed by a saturated silver chloride Ag|AgCl (KCl sat.) reference electrode, platinum counter electrode and a working electrode with 1.5 cm 2 of exposed area. Prior to the tests, the specimens were ground through successive grades of silicon carbide (SiC) abrasive papers from 320 grit to 2400 grit using isopropyl alcohol as lubricating liquid.
The Open Circuit Potential (OCP) value was measured prior to each Electrochemical Impedance Spectroscopy (EIS) test. The EIS tests were performed at OCP, and they were carried out at specific moments (30 min, 50 min and 70 min) after electrolyte immersion. An AC amplitude of 10 mV over the frequency range of 100 kHz to 0.02 Hz was used. The ZView and ZPlot softwares were used for obtaining and fitting the impedance data, respectively.
Potentiodynamic polarization curves were obtained using a scan rate of 1 mV/s. The polarization started from cathodic potential of −0.5 V relative to the last OCP value and interrupted when the current reached 0.1 A. For every condition, a minimum of two trials were conducted.

3. Results and Discussion

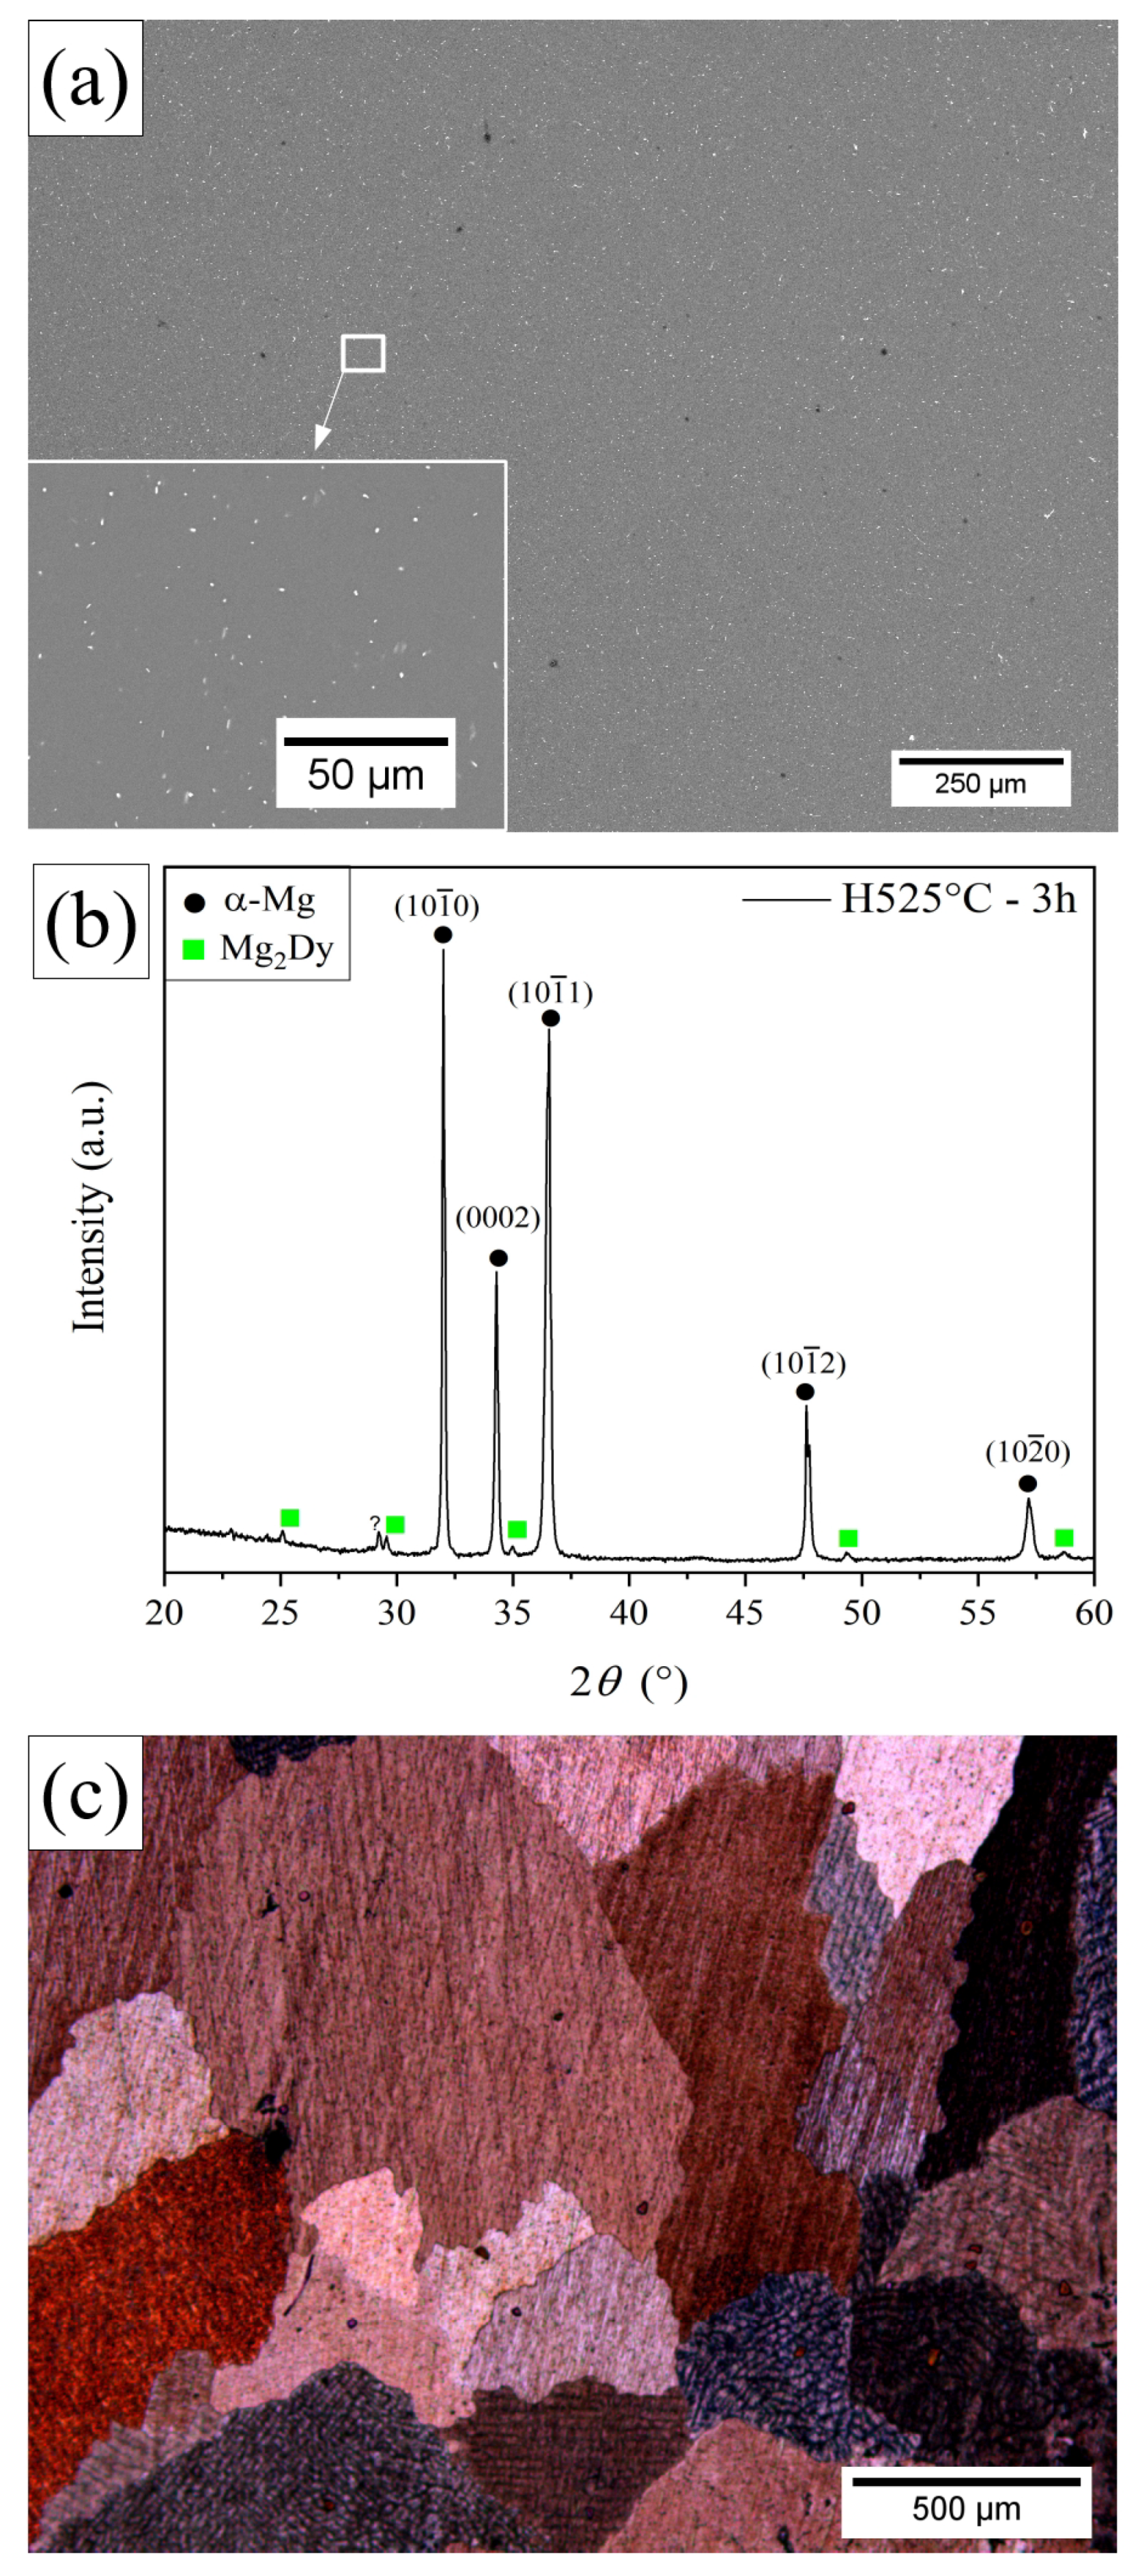
3.1. Microstructural Characterization of the H525 °C-3 h Specimen

Figure 1a shows a SEM/BSE micrograph from the H525 °C-3 h specimen. Thin Mg x Dy precipitates were observed homogeneously distributed in the α -Mg matrix. According to the XRD pattern exhibited in Figure 1b, these precipitates were composed mostly of Mg 2 Dy. The Mg 2 Dy precipitate is thermodynamically stable as reported in the Mg–Dy phase diagram [13] and was found in a similar Mg–2.08Dy–2Sr–1Zr (wt.%) alloy [24]. LOM analyses indicated coarse equiaxed grains with an average grain size of 326 ± 91 μ m as shown in the micrograph of Figure 1c. The hardness value was 53 ± 3 HV.

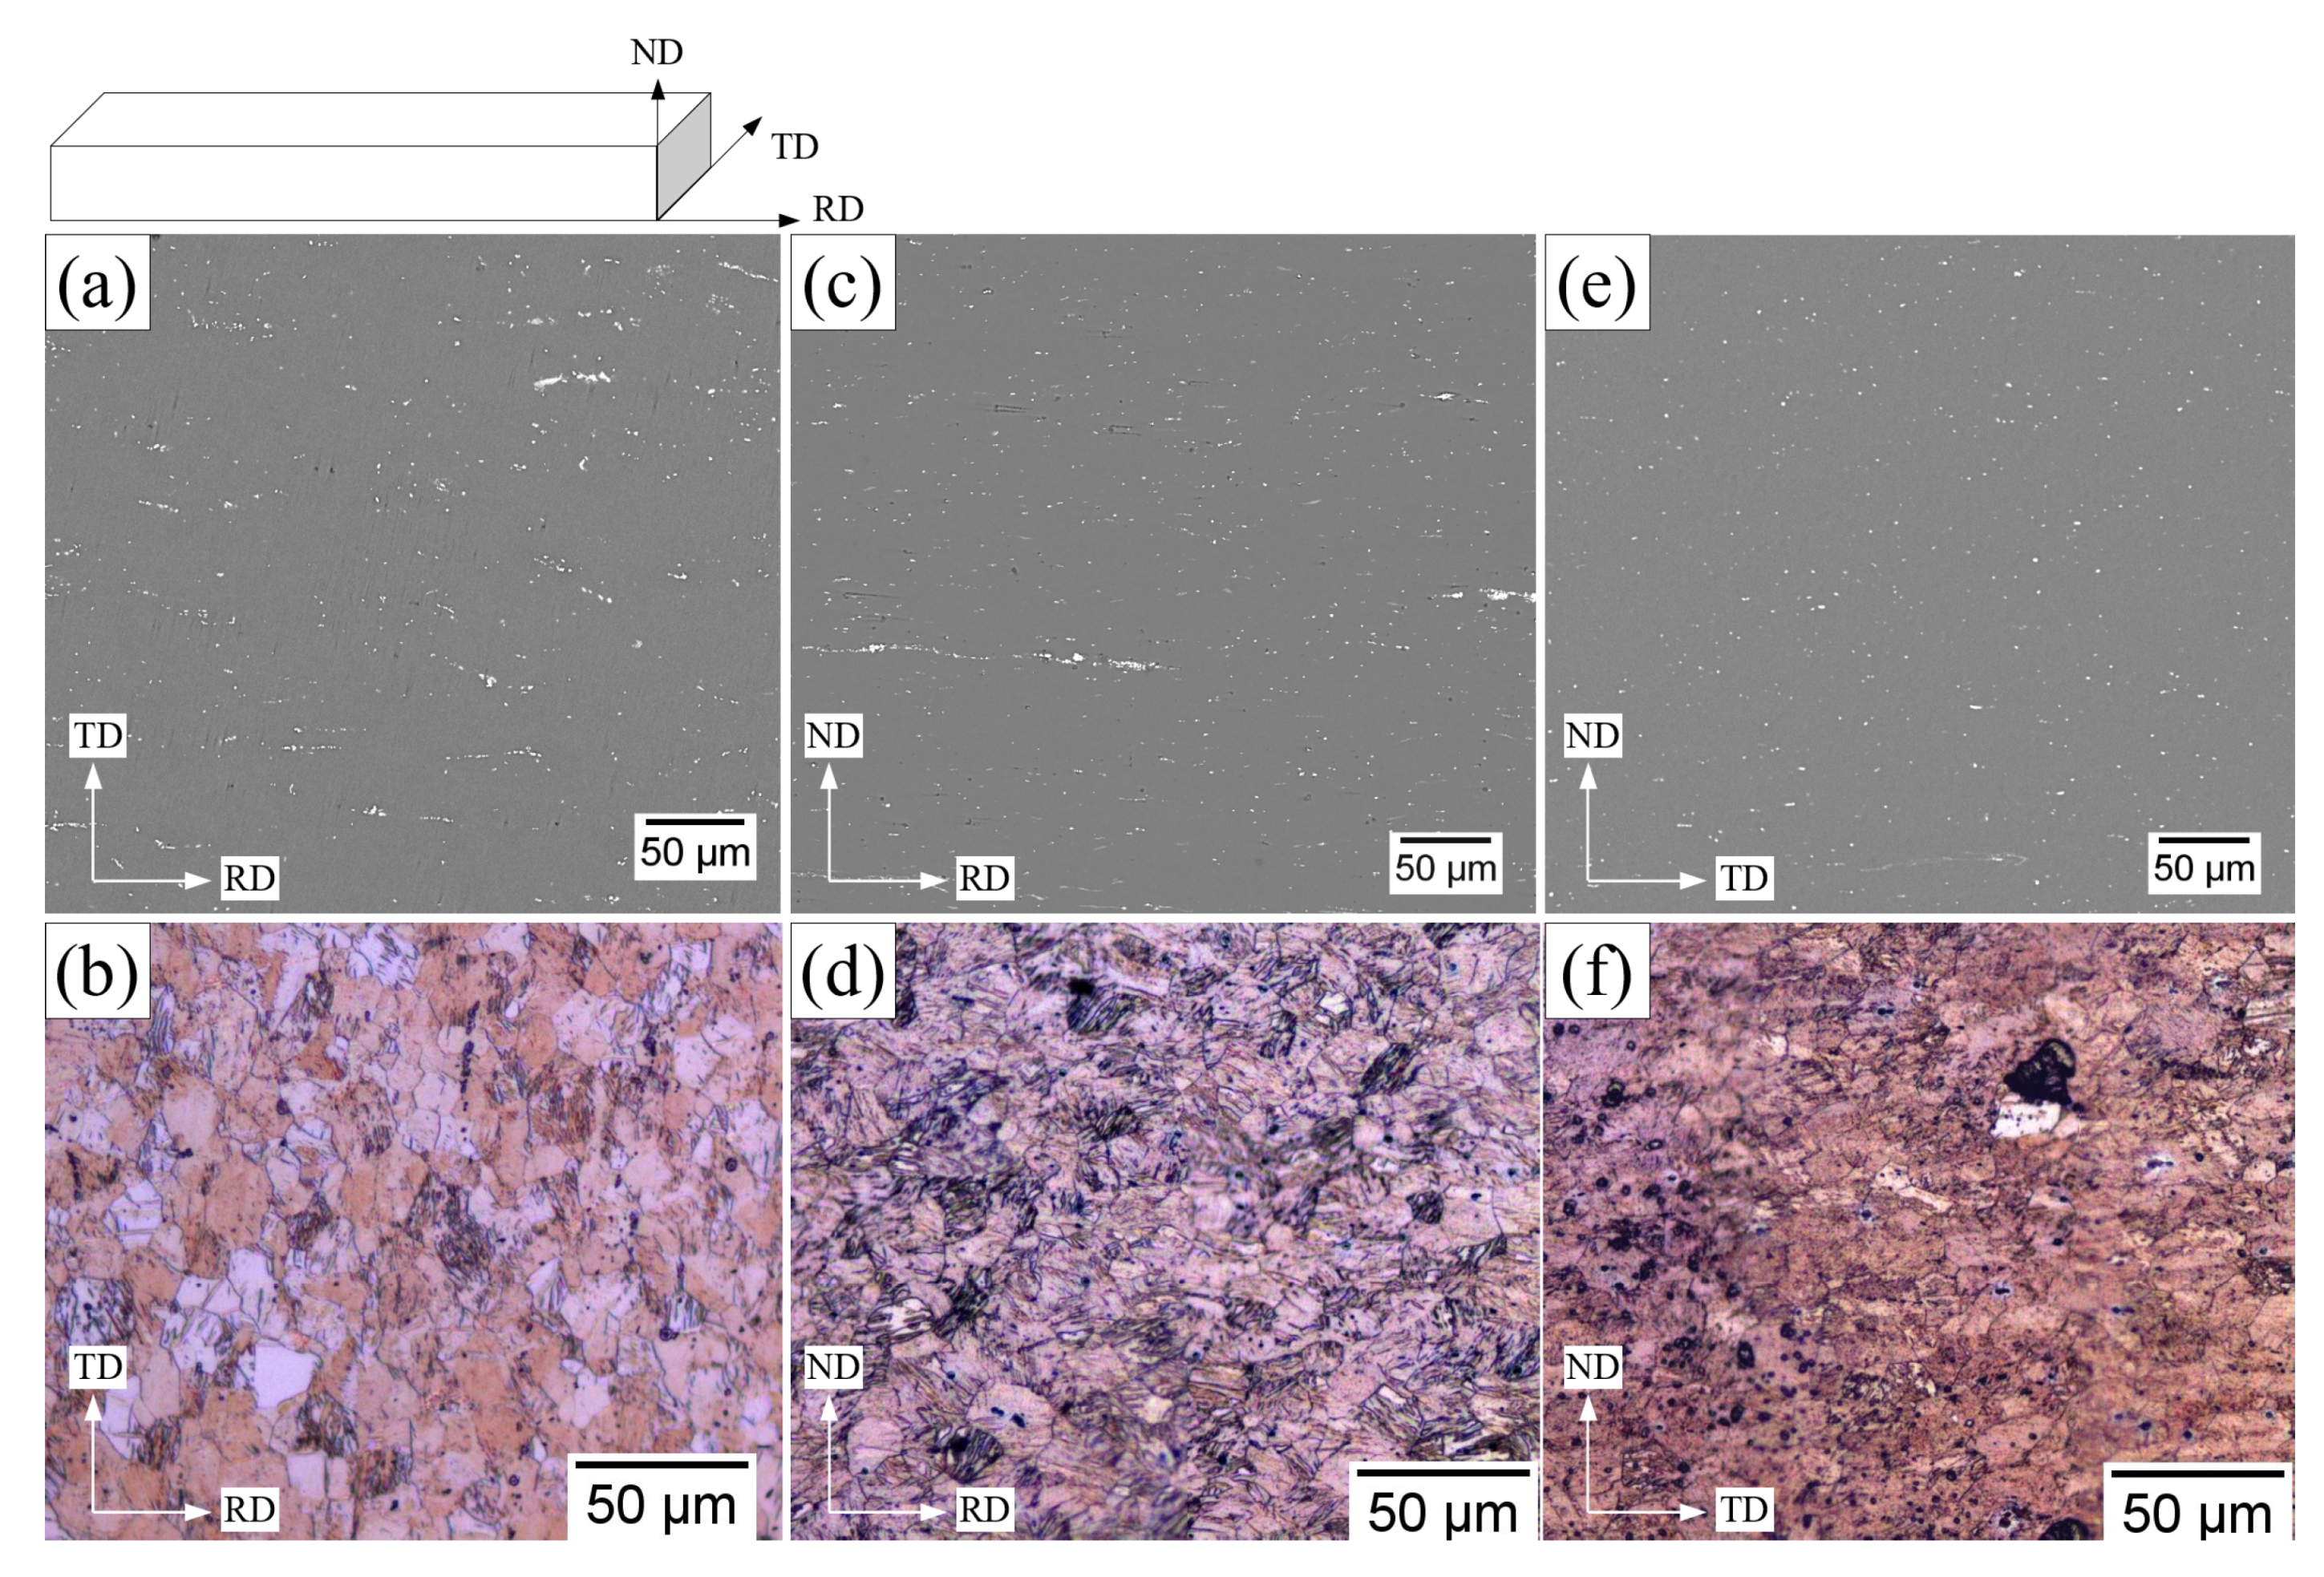
3.2. Microstructural Characterization of Rolled Specimen

Figure 2 shows a schematic plate with indication of the rolling direction (denoted as RD), transversal rolling direction (denoted as TD) and the normal rolling direction (denoted as ND), which were used to refer to the different regions of the plate. The hot rolled process promoted thin precipitates randomly distributed along the microstructure (Figure 2a,c,e) and recrystallized grains, with an average grain size of 8.7 ± 1.5 μ m, approximately 40 times smaller than that of the H525 °C-3 h specimen. Furthermore, we observed similar grain shapes in different directions, indicating a homogeneous microstructure, as shown by the LOM micrographs in Figure 2b,d,f.
The XRD pattern (Figure 3) of the rolled specimen showed small peaks of β in addition to those of the Mg 2 Dy and α -Mg matrix phase. This metastable β precipitation with a D0 19 -type structure likely occurred during the heating period between the rolling passes. Additionally, an intensification of peaks associated with the (0002) and (10 1 ¯ 1) planes has been observed, and this would have been caused by slip plane activation during the hot rolling process. The plate in the as-rolled condition exhibited a hardness value of 60 ± 6 HV.

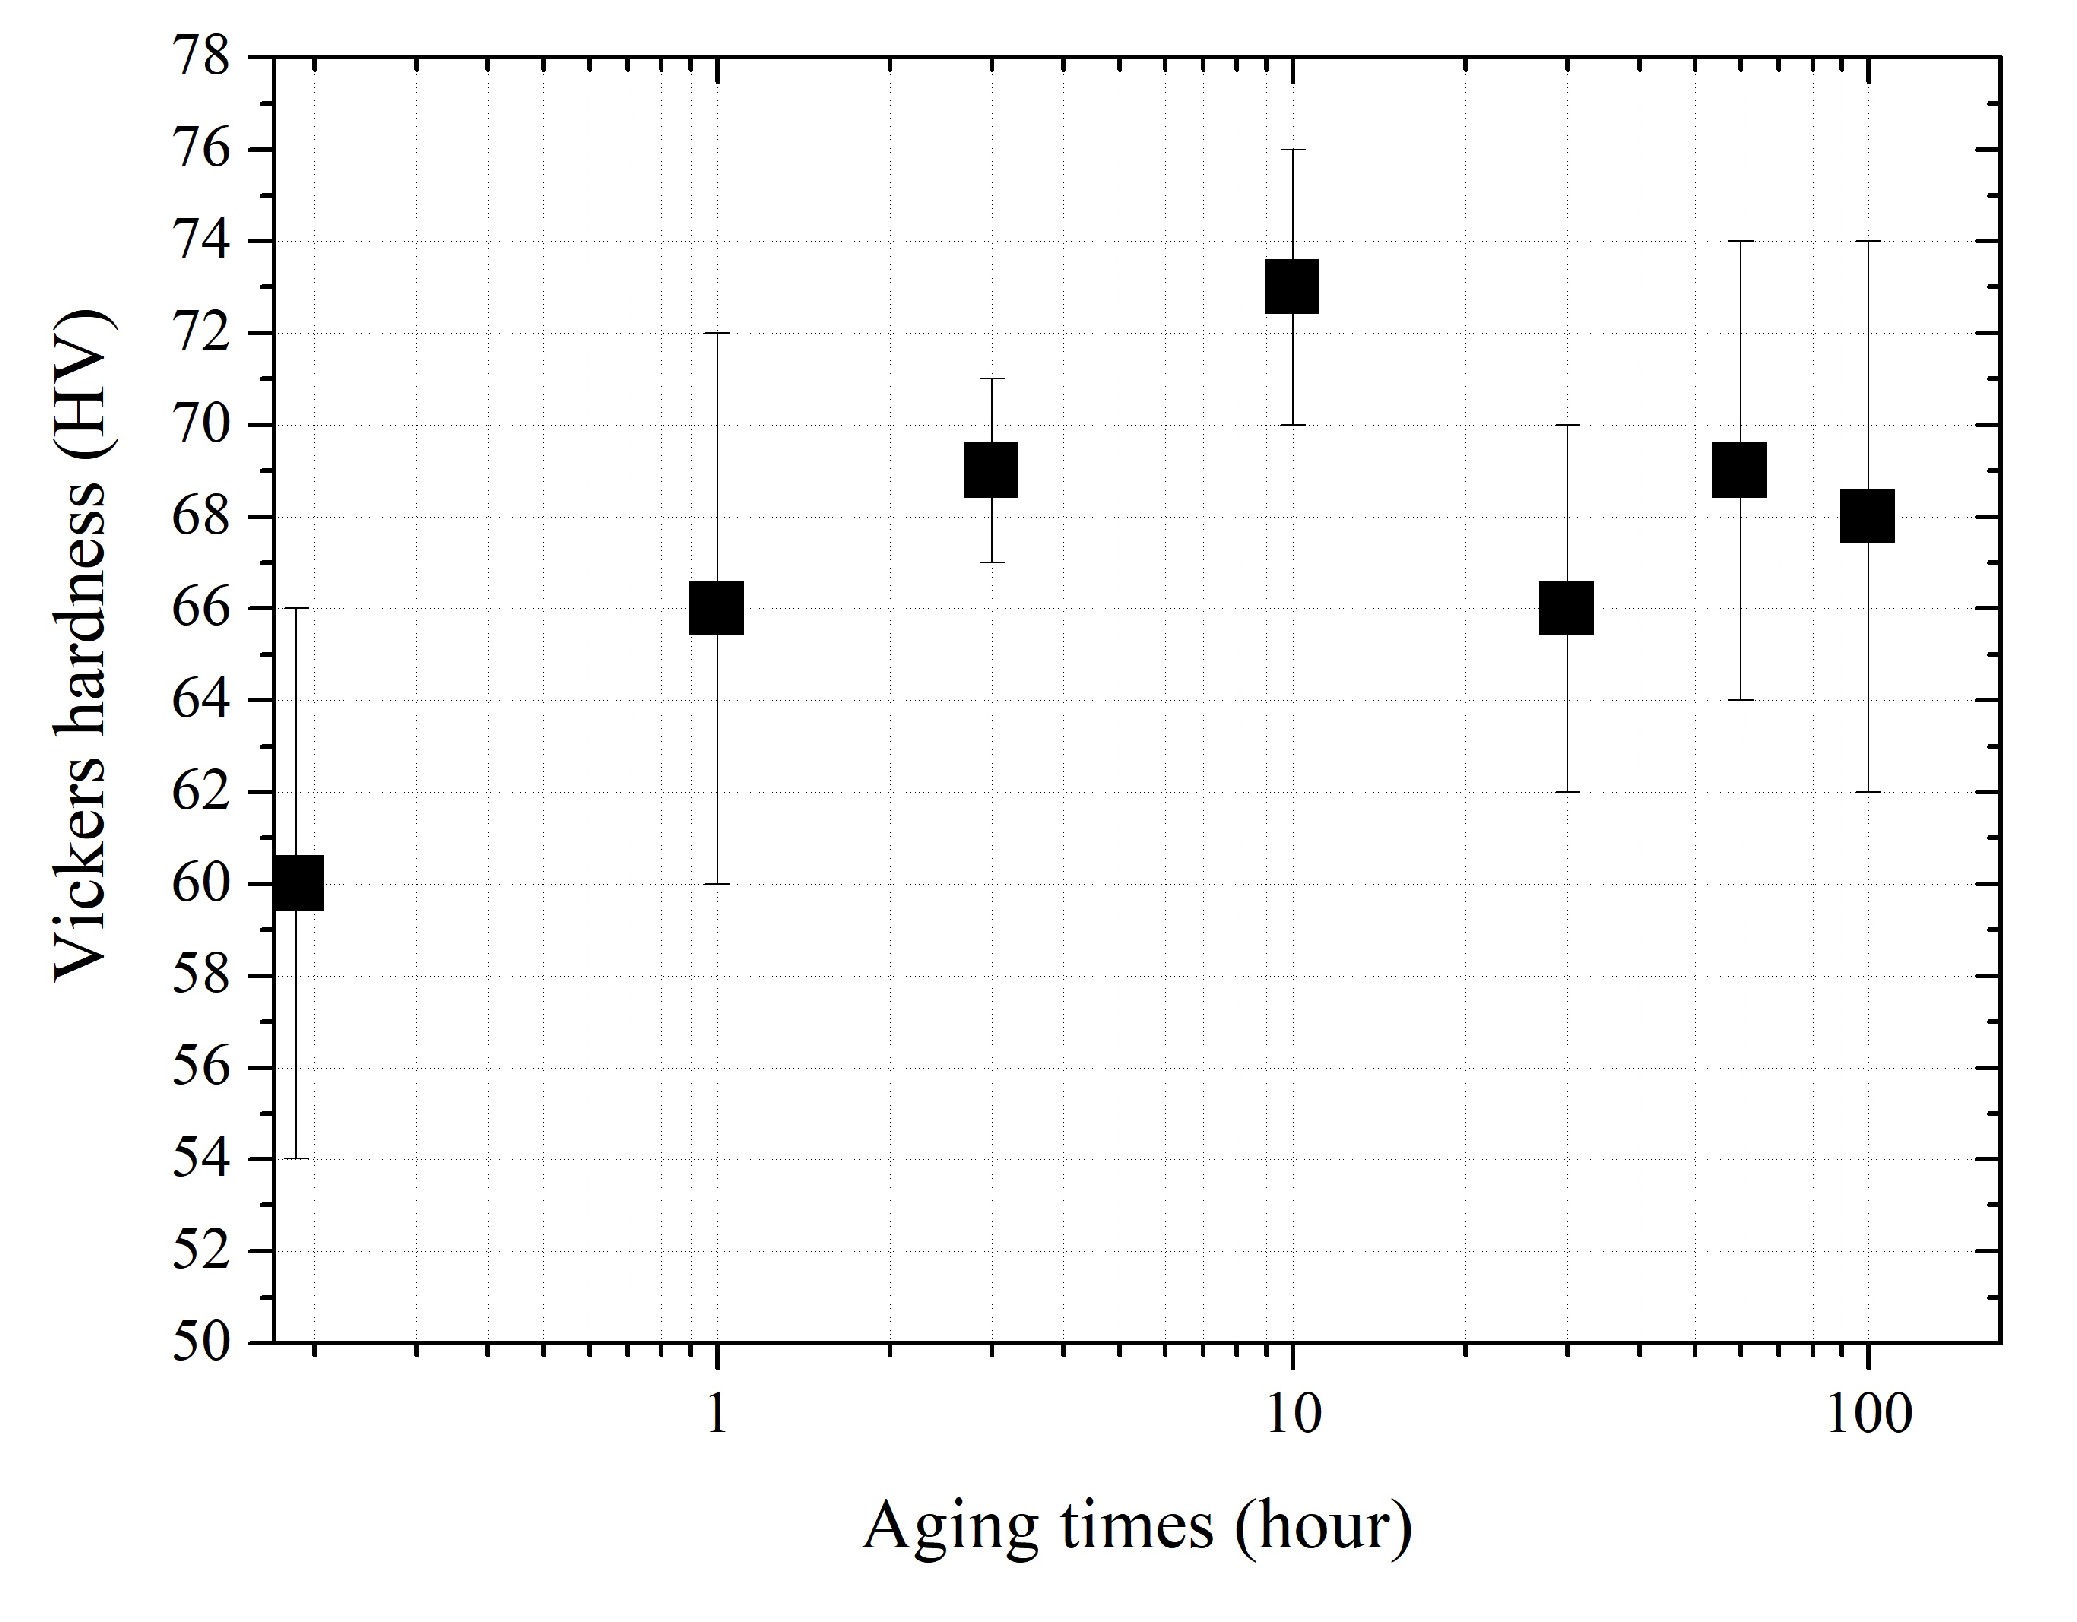
3.3. Aging Hardening Behavior of the Alloy

Figure 4 shows the age-hardening response of the alloy after hot rolling at 250 °C. The specimen aged for 10 h (named aged-10 h) had the maximum hardness recorded of 73 ± 3 HV, a 22% increase compared to that of the rolled specimen. Subsequently, the hardness values decreased with prolonged aged.
The XRD patterns of the aged specimens (Figure 3) clearly exhibited an intensification of the peaks related to β and the β phase peaks increase in intensity up to 10 h of aging, then decreased with prolonged aged. These metastables β and β precipitates are expected for Mg–REEs alloys when aged in range of 190–300 °C [17,25,26]. Generally, β phases may be observed at the beginning of aging and further aging will result in the transformation of these β precipitates to β precipitates [27].
Gao et al. [16] informed that after some aging hours the β phase tends to transform to β 1 phase and takes more than 2000 h to transform β 1 to β when aged at 250 °C for Mg–15Gd–0.5Zr (wt.%) alloy. Although the peaks of β and β phases became less intense for longer aging times, β 1 and β could not be identified in the XRD patterns (Figure 3). Likely, the small amount of Dy in the MgDyZnZr alloy contributed to a low volume fraction of β 1 phase. In addition, the aging times at 250 °C used in this work would likely have been very short to achieve precipitation of the β stable phase.
Apps et al. [17], who investigated the aging–hardening behavior of Mg–7Dy–2.25Nd–0.6Zr (wt.%) and Mg–7Gd–2.25Nd–0.6Zr (wt.%) alloys, found similar results to those obtained in this work. A significant aging response at 300 °C could be attributed to the rapid formation of β and possibly β , precipitates during the early stages of aging for the alloy with Gd. Saito et al. [18] showed the aging–hardening response for Mg–21.79Dy (wt.%) alloy, and, as in cases of Mg–Gd and Mg–Y alloys, β precipitation occurred and increased the age-hardening effects. In addition, for longer aging times, the β precipitates became larger.
Therefore, it is suggested that a combination of β precipitation and the transformation of β β during the 10 h of aging promoted the age-hardening response for the alloy investigated in this work.
Figure 5a,c,e shows micrographs from different regions of the aged-10 h specimen, with a similar microstructure observed for all regions with an average grain size of 11.8 ± 1.7 μ m (Figure 5b,d,f) that are not much higher than that of the rolled specimen condition. Possibly, β / β precipitates may have restrained the grain growth so that the strengthening contribution from the grain refinement was preserved during the aging process [28].
Wan et al. [29] reported that a small Dy addition in Mg–1Zn–0.6Zr–0.6Dy (wt.%) alloy enhanced ductility promoted by a finer grain structure and weaker texture, where grain refinement caused the strengthening of the material. Regarding the macrotexture, the pole figures shown in Figure 5 exhibited a strong basal {0002} texture. However, an intense texture of the {10 1 ¯ 0} planes was also observed, evidencing the activation of slip prismatic planes during the hot rolling process.

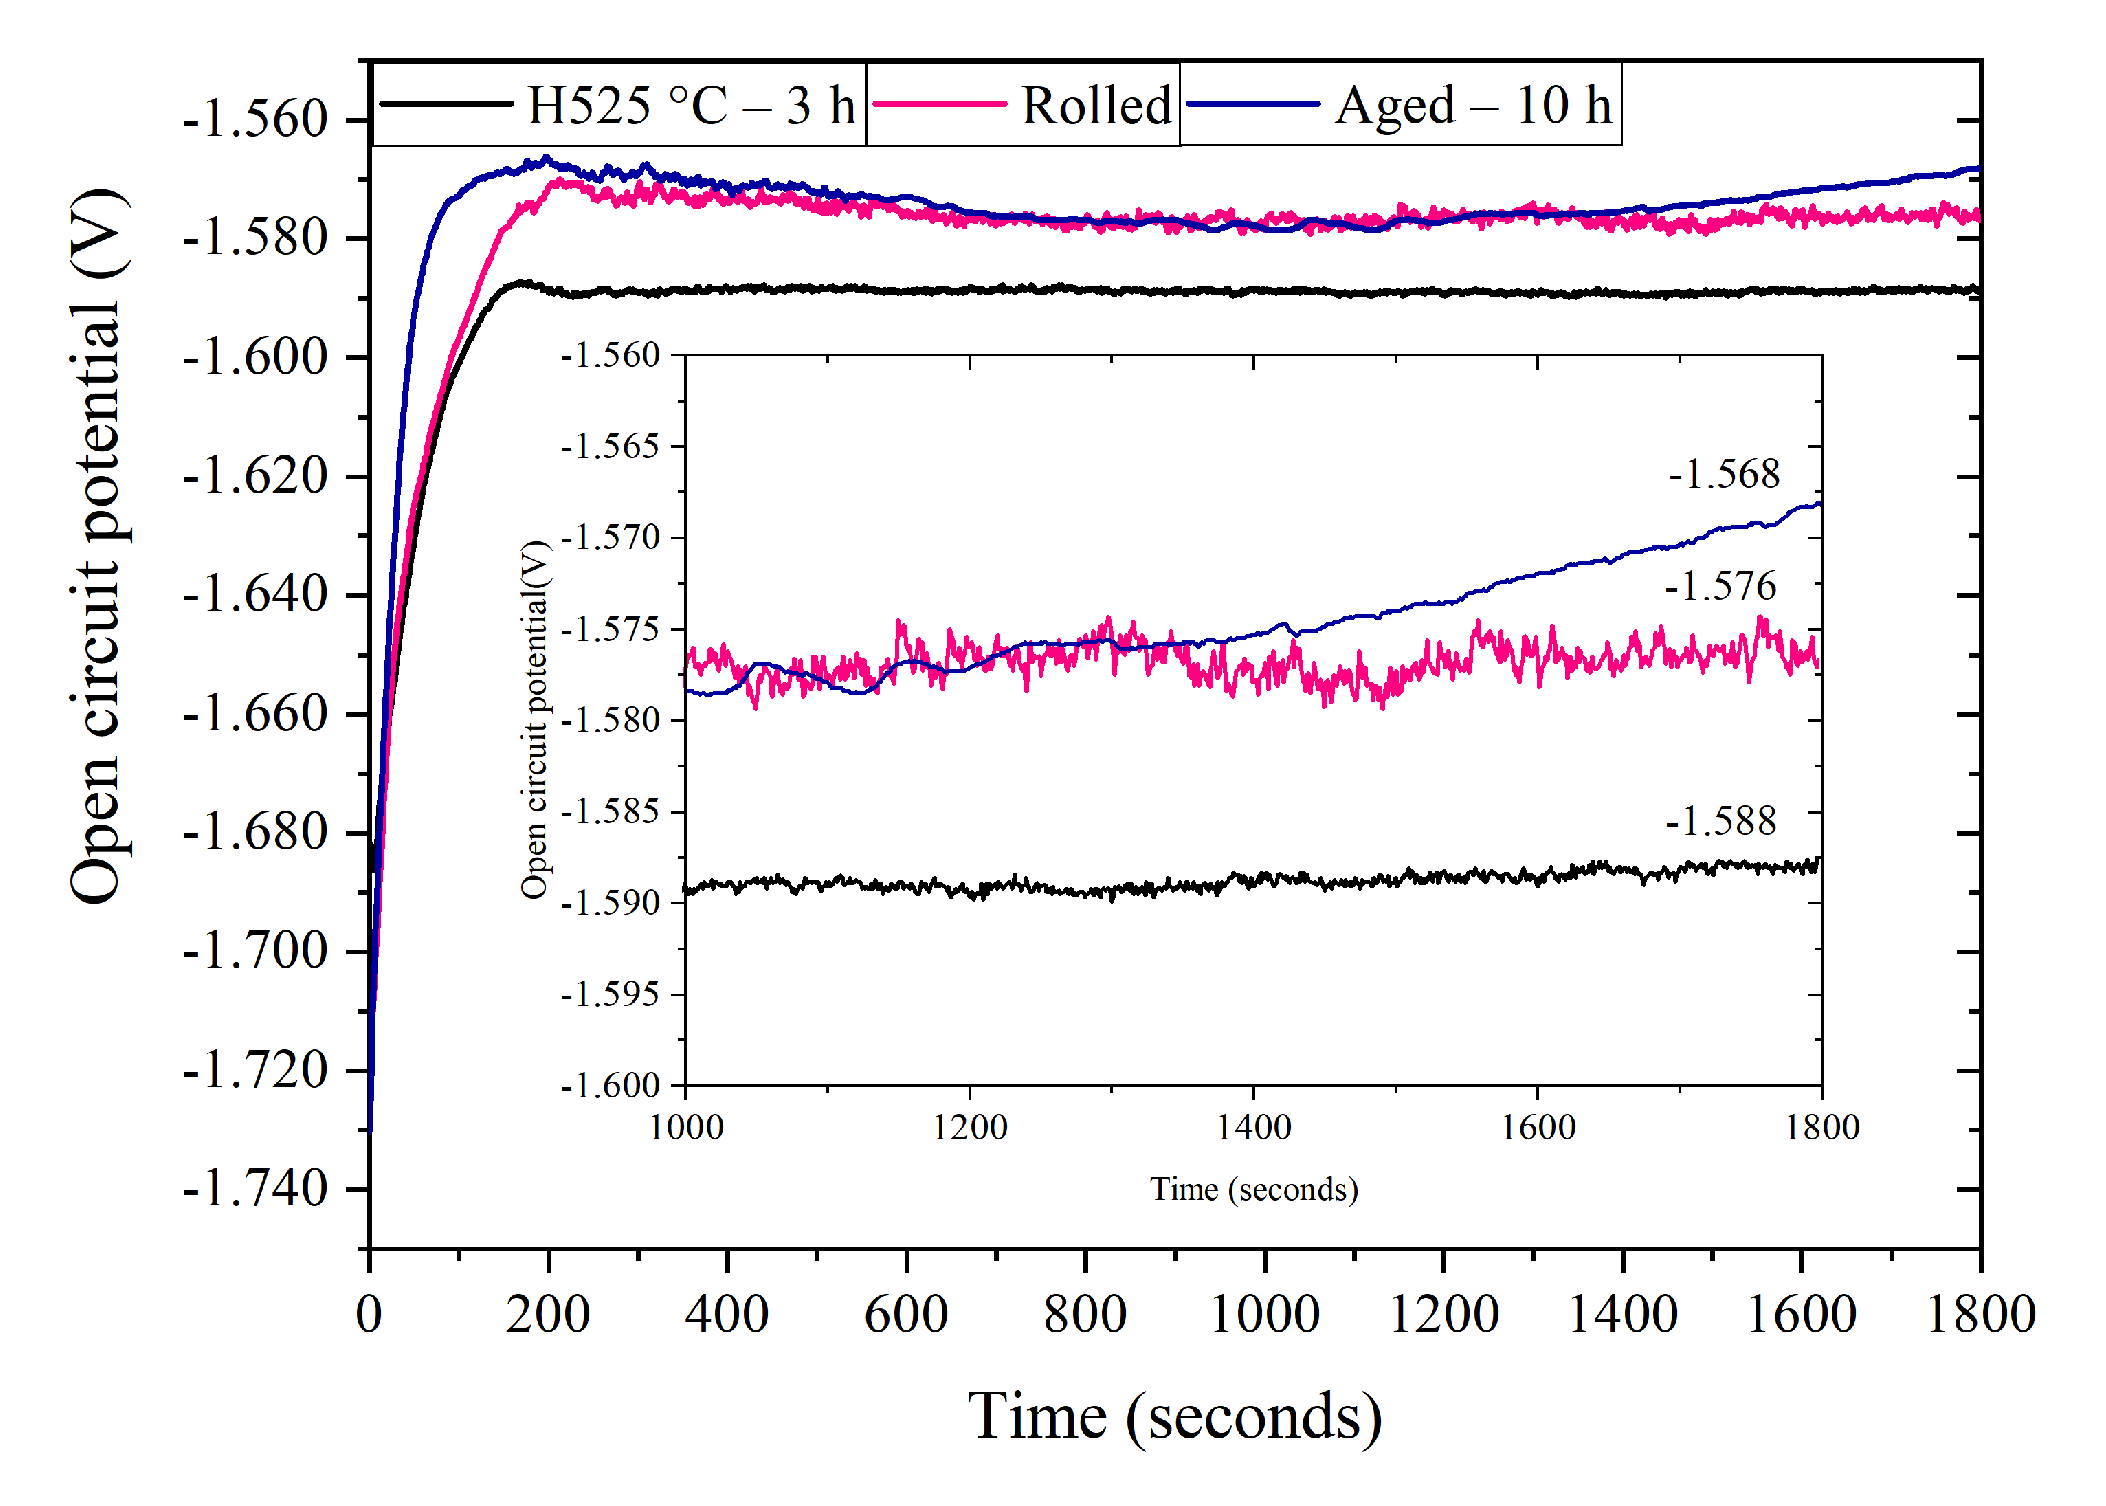
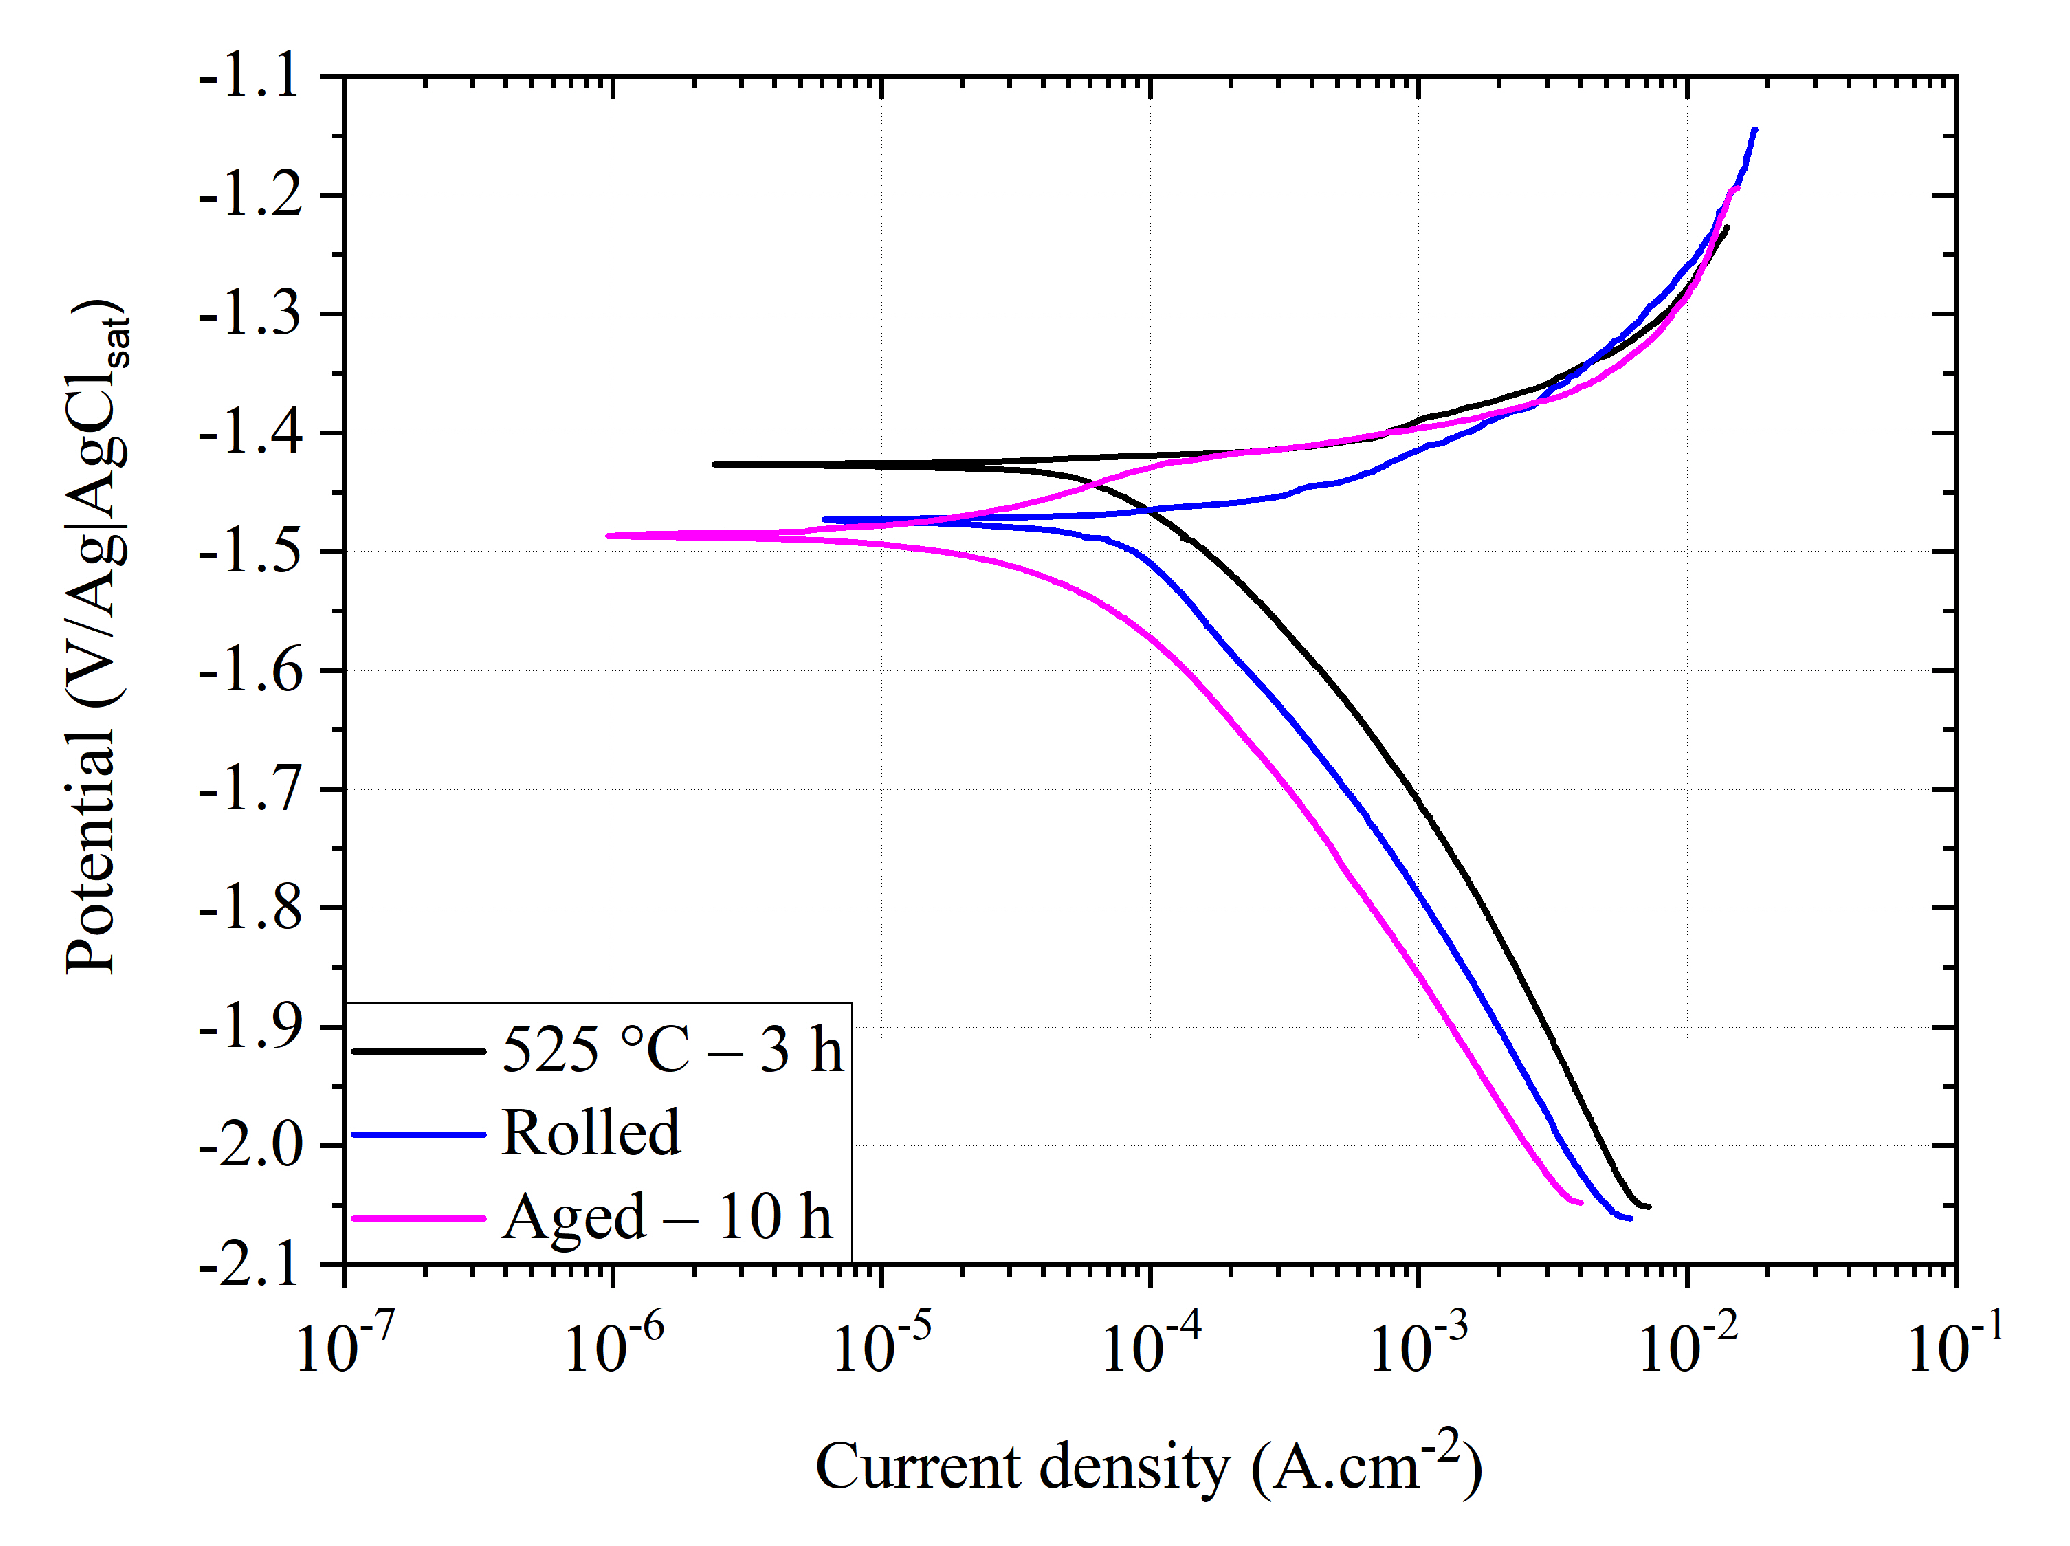
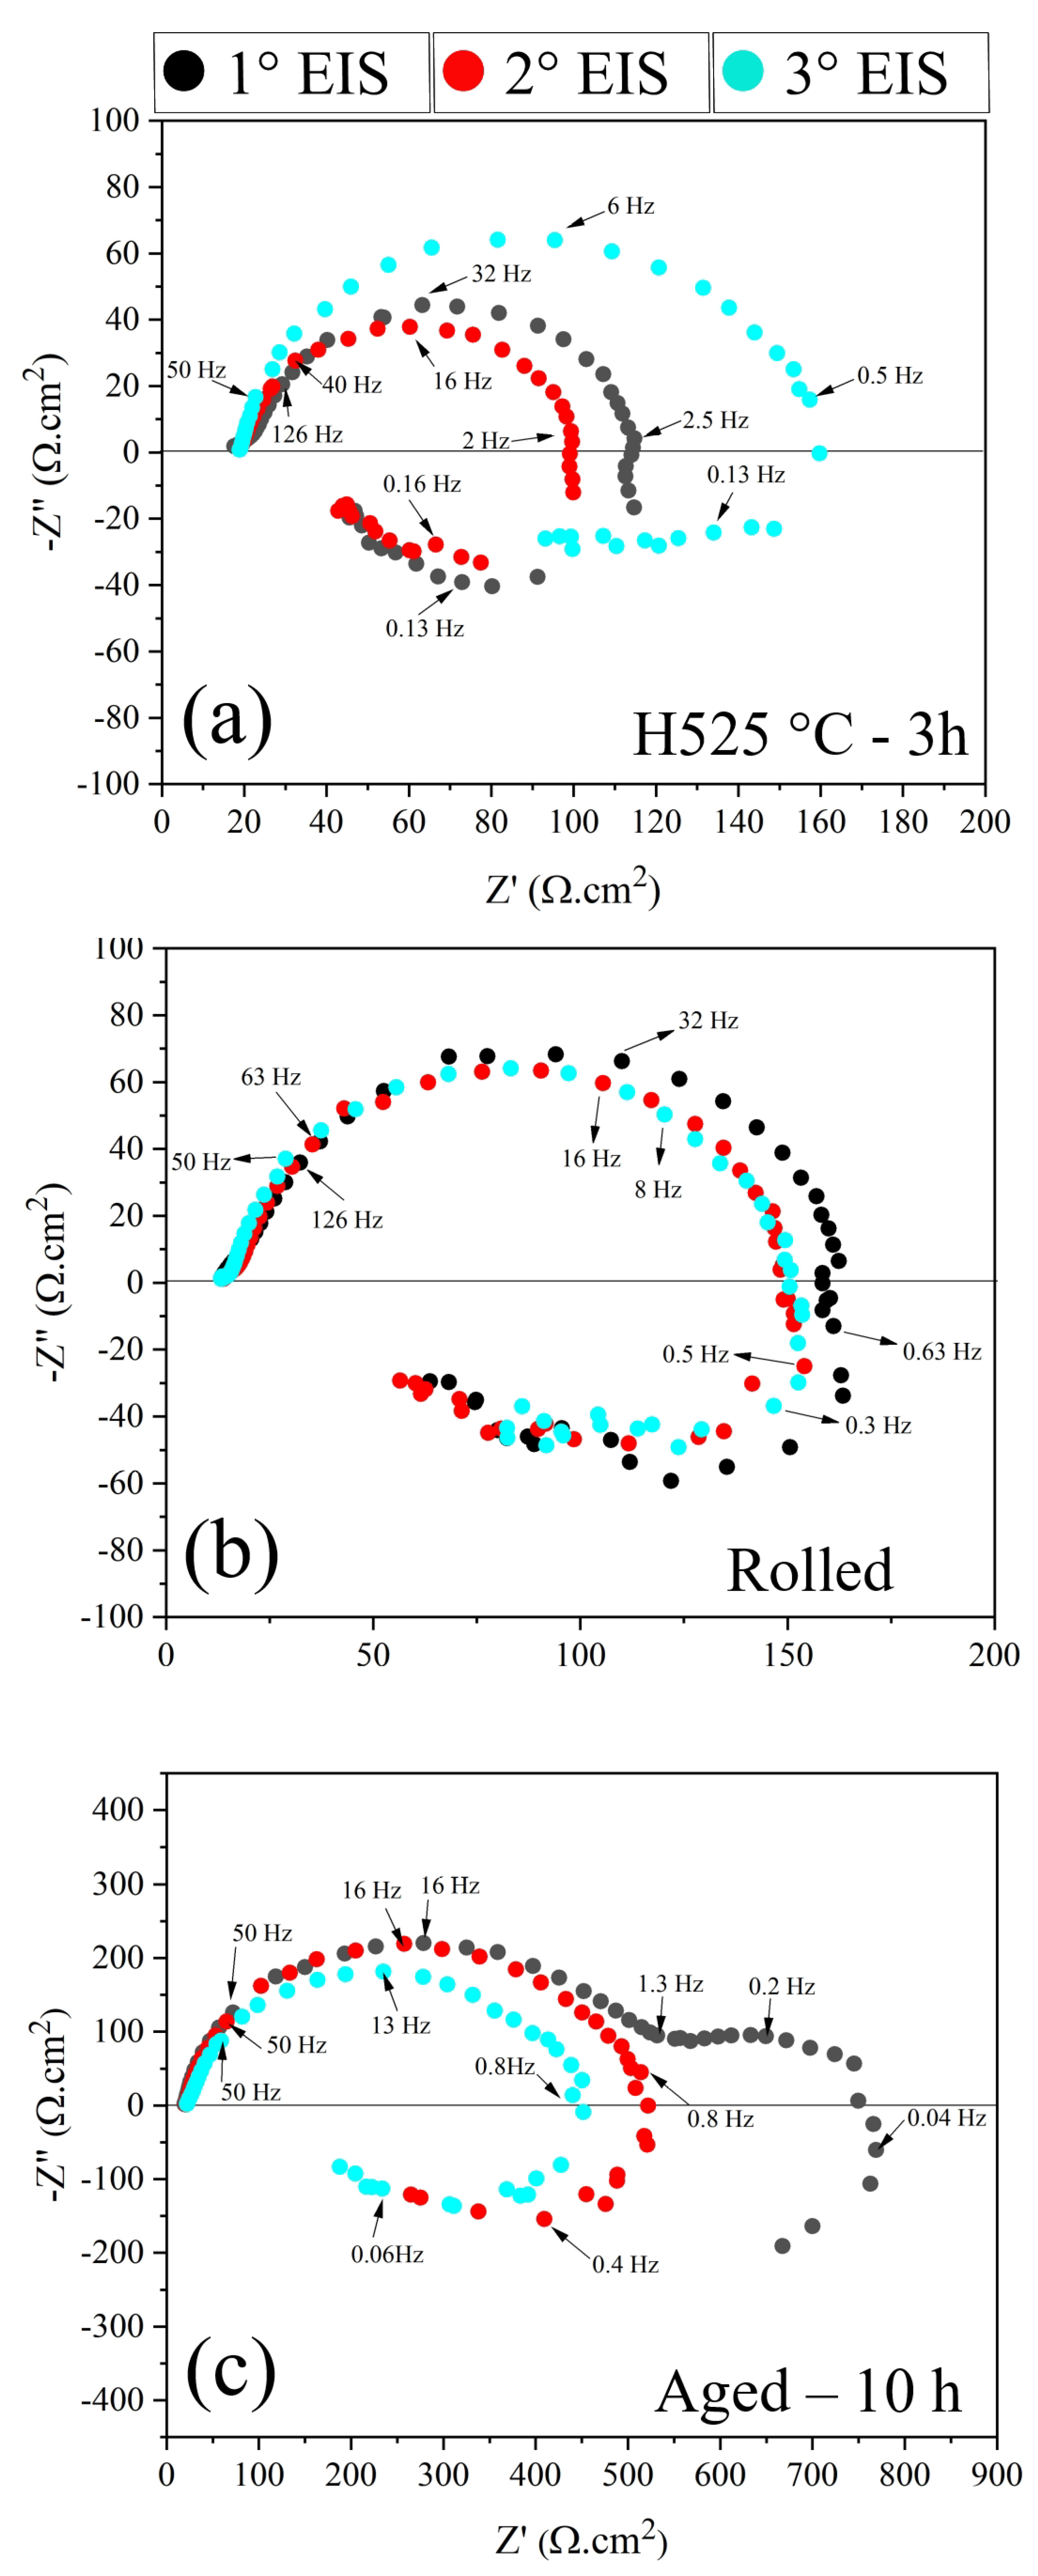
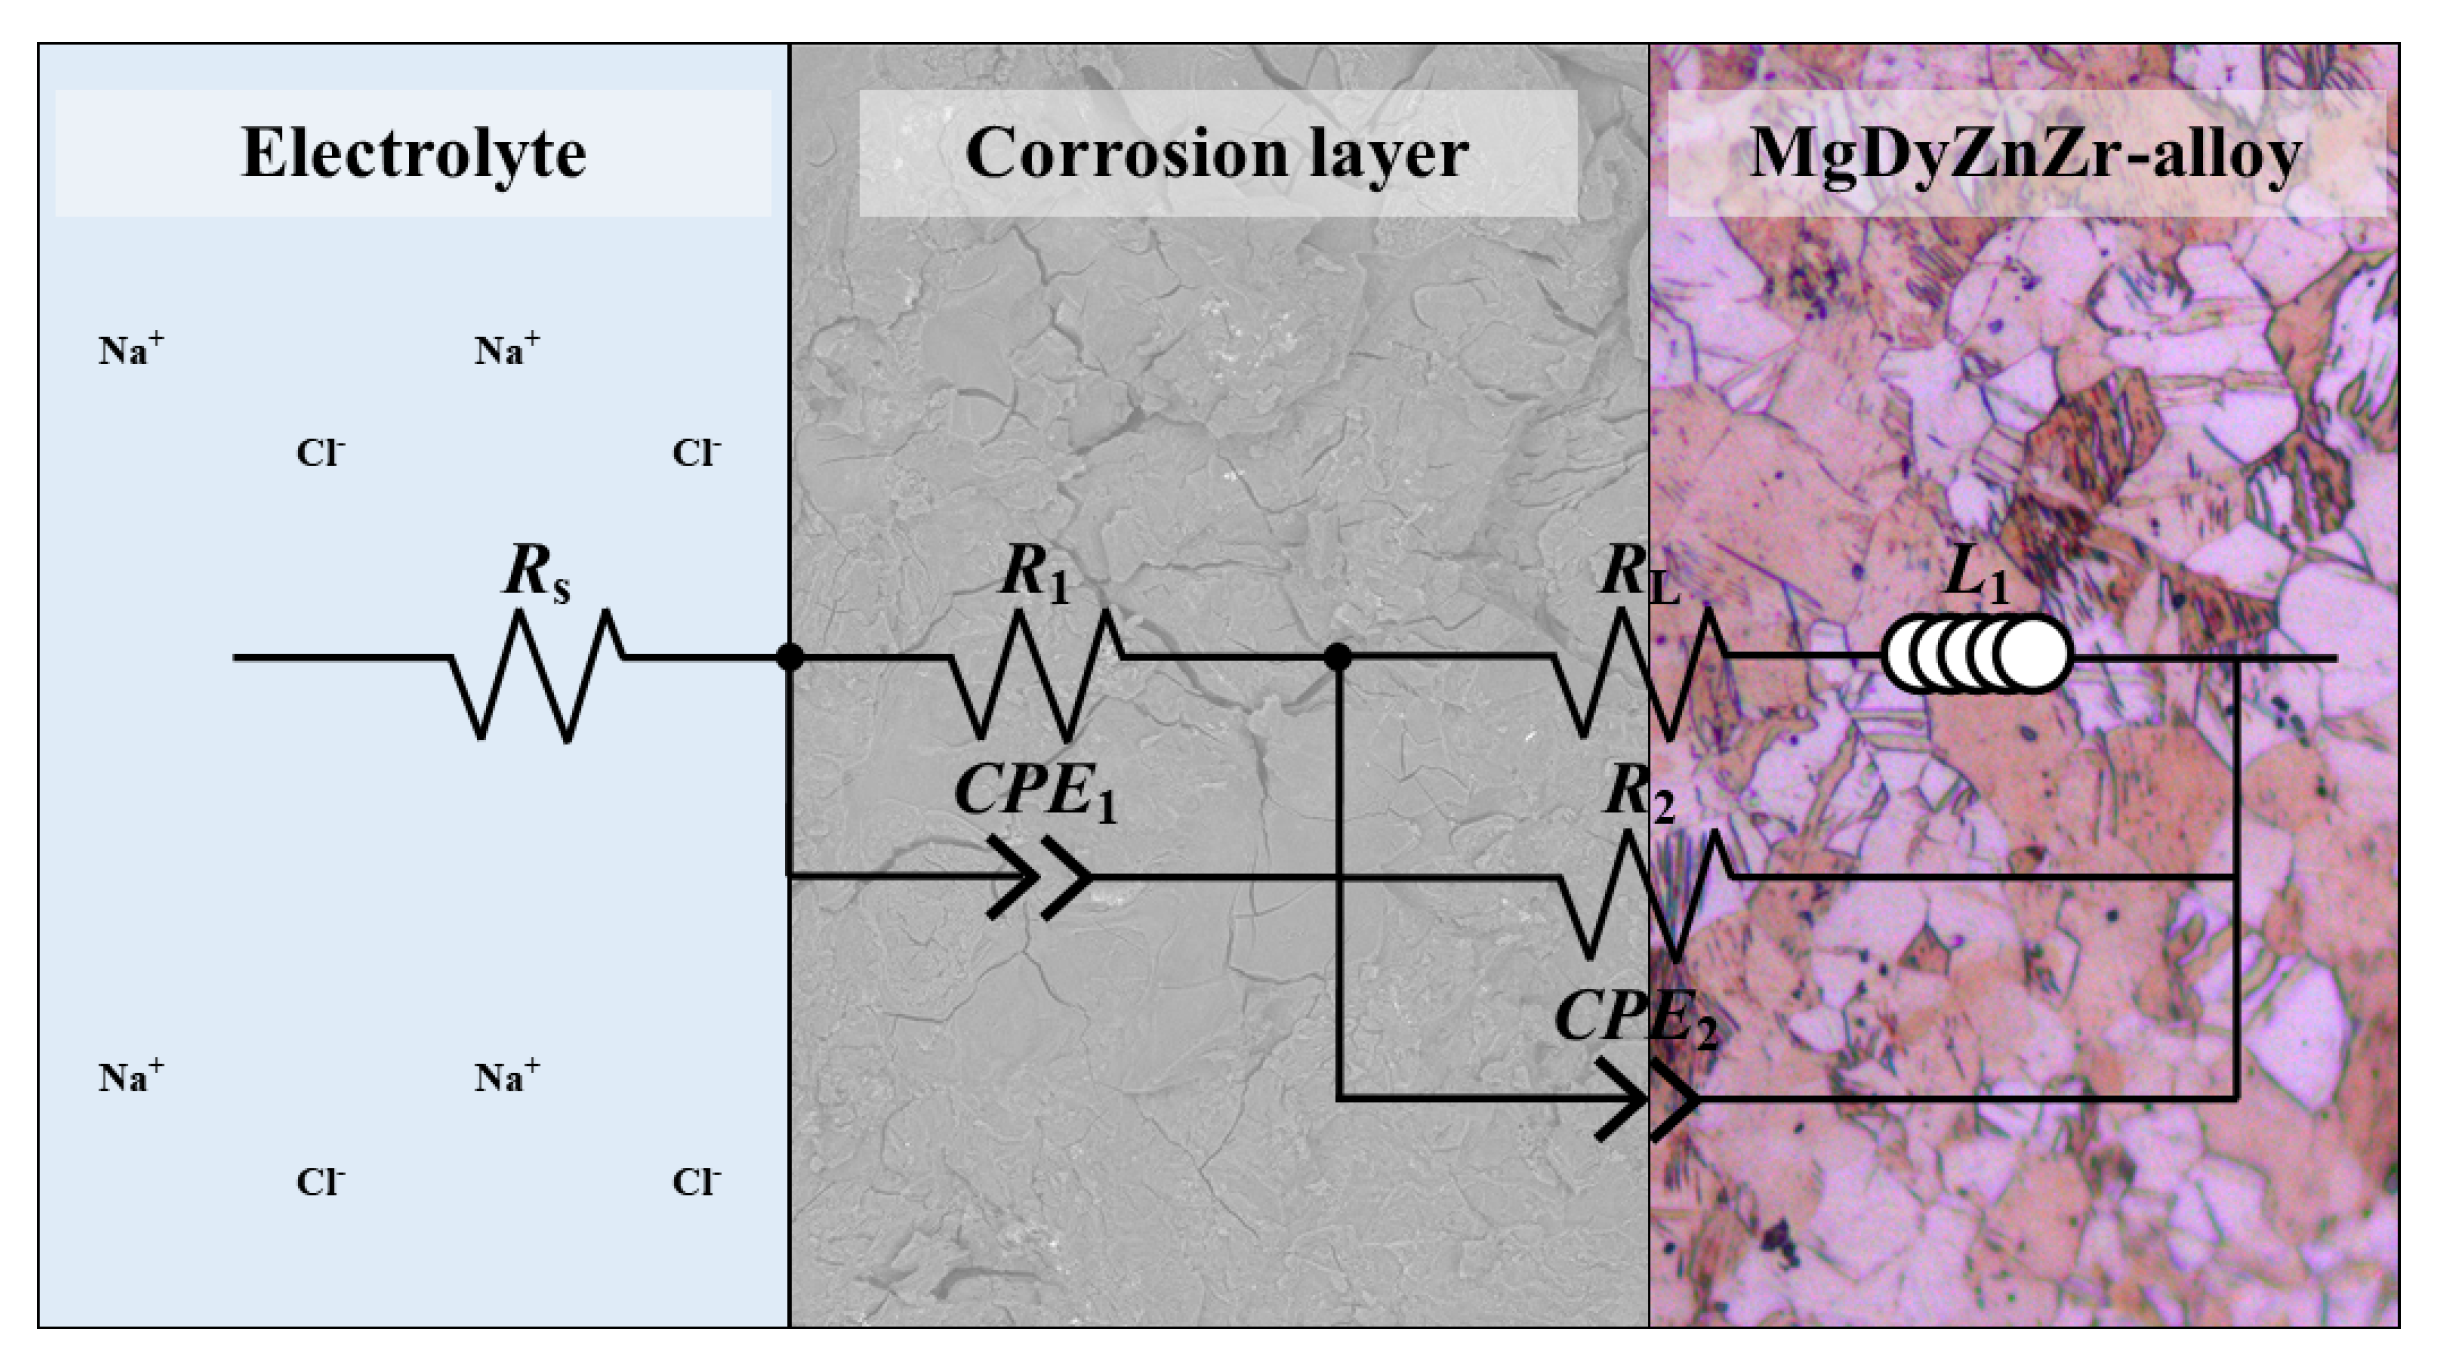
3.4. Electrochemical Characterization

Figure 6 depicts the curves of open-circuit potential for the electrochemical tests in 0.9 wt.% NaCl aqueous solution at 37.0 ± 0.5 °C. At the final stage of the test, the OCP data of the H525 °C-3 h, rolled and aged-10 h specimens stabilize on values of −1.568 V, −1.576 V and −1.588 V, respectively. Other Mg alloys, such as Mg–1Ca wt.% [30], WE43 [31] and Mg–6Al–1Zn 0.5Mn–1Ce wt.% [32], as shown in the literature, obtained an OCP stabilized within a small range of −1.62, −1.62 and −1.59 V, respectively.
Figure 7 shows the potentiodynamic polarization curves of the H525 °C – 3 h, rolled and aged-10 h specimens. The results revealed close values for E c o r r for the H525 °C –3 h, rolled and aged-10 h specimens of −1.429 V/Ag|AgCl s a t , −1.475 V/Ag|AgCl s a t and −1.479 V/Ag|AgCl s a t , respectively. Table 1 presents the corrosion potential (E c o r r ), current density (i c o r r ) and the corrosion rate (CR), which was calculated using Equation (1).
C R = C M i c o r r n ρ
where C is a constant, which includes the Faraday constant and any other conversion factor for units = 0.00327 (mm year 1 ), M is the standard atomic weight of Mg = 24.301 g mol 1 , ρ is the density of the alloy (g cm 3 ), i c o r r is the current density ( μ A cm 2 ), and n is the number of electrons involved in the corrosion reaction.
The aged-10 h specimen exhibited the lowest corrosion rate of 0.9 mm/year against 2.0 and 1.7 mm/year for the H525 °C-3 h and rolled specimens, respectively. The combination of grain refinement and micrometric precipitates is suggested to be the cause of corrosion resistance improvement. Table 2 shows the corrosion rates of several Mg–REEs alloys for comparisons. Similar corrosion rates were observed when compared to as-cast, solution treated, hot rolled and extruded alloys. A Mg–1Y (wt.%) alloy in the rolled condition presented a corrosion rate of 1.65 mm/year in SBF [33]. Binaries Mg– x Dy ( x = 5 and 10 wt.%) alloys exhibited after heat treatments at 520 °C–24 h a corrosion rate of 0.5 and 0.9 mm/year, respectively [27]. The JDBM (Mg–3.1Nd–0.2Zn–0.4Zr wt.%) alloy extruded and aged at 200 °C for 10 h showed a corrosion rate of 0.18 mm/year in SBF solution [5].
Figure 8 and Figure 9 show the results of the EIS tests (Nyquist, Bode and phase angle plots). From the Nyquist diagrams (Figure 8a) of the H525 °C-3 h specimen after 30, 50 and 70 min of immersion times revealed a non-monotonous variation with a decrease for 50 min and then an increase for 70 min of high-frequency capacitive loops, in addition to an inductive loop at low frequencies. For the rolled specimen (Figure 8b), a decrease of high-frequency capacitive loop results was observed with longer immersion times. These phenomena may be connected to an increase of the active surface area promoted by corrosion layer formation [37] during the 70 min of immersion time.
Figure 8c exhibits the aged-10 h specimen data with three loops on the first impedance measurements, two capacitive loops and one inductive loop. The high frequency capacitive loop is typically attributed to the charge transfer resistance [38]. The medium frequency capacitive loop may be related to the relaxation of mass transport in the solid phase [38,39]. This loop disappears after a long immersion time as shown by the second and third impedance curves. The inductive loop at the low frequency is attributed to the relaxation processes of adsorbed species, such as Mg(OH) + and Mg(OH) 2 on the specimen surface [38,40] and also related to pit formation [40].
Figure 9 shows Bode plots and phase angles comparing data from the three conditions analyzed, and a qualitative analysis of these plots shows that the shape of experimental diagrams was quite similar for all conditions. In the range of the swept frequency, the impedance modulus, |Z|, at medium frequencies shifted towards higher positive values. With further corrosion from 30 to 70 min, the impedance value reduced, manifesting that the corrosion resistance gradually worsened. The same behavior was observed for extruded Mg–6.0Zn–1.0Ca wt.% and Mg–6.0Zn–1.0La/Ce wt.% alloys tested in SBF for 30 h [41]. This behavior suggests that the aged-10 h specimen exhibited better corrosion resistance when compared to H525 °C-3 h and rolled specimens as also indicated by the potentiodynamic polarization data shown previously.
Figure 10 shows the equivalent electrical circuit used [31] to model the experimental impendance data, which includes, as the main components, the solution resistance (R s ), a constant phase element (CPE 1 ) and a resistor (R 1 ), associated with the double layer and charge transfer resistor (substrate/electrolyte interface) [42,43]. The (CPE 2 ) and the resistance (R 2 ) are characteristic of the corrosion process at the metal surface through the corrosion layer and the release of Mg ions.
The constant phase elements (CPE) have been used instead of a capacitance, due to the possible microscopic roughness or the heterogeneities of the alloy surfaces and is defined in terms of n where n is an empirical exponent that ranges from 0 to 1. A perfectly smooth surface corresponds to n equal to unity, which decreases with increasing surface roughness [44]. R L and L 1 represent the pitting corrosion resistance [45] and inductive behavior associated with the anodic reaction of magnesium oxidation accompanied by local hydrogen evolution.
Table 3 showcases the electrical parameters of the various components of the fitted equivalent circuit based on the EIS data of the different condition of the MgDyZnZr alloys. The results evidently confirmed that the aged-10 h specimen exhibited much better corrosion performance than the H525 °C-3 h and rolled specimens since the polarization resistance (R p = R 1 + R 2 ) and the pitting corrosion resistance (R L ) had significantly higher values.

4. Conclusions

In the present work, through observing the microstructure and investigating the corrosion behavior of Mg–3.4Dy–0.2Zn–0.4Zr (wt.%) alloys in 0.9% NaCl solution at 37 ± 0.5 °C after homogenization heat treatment, hot rolling and aging. The following conclusions can be drawn:
-
Homogenization heat treatments at 525 °C for 3 h successfully avoided any inhomogeneity that otherwise occurred during the melting process.
-
The hot rolling process with multiple passes promoted a homogeneous grain-refined microstructure for all rolling directions with a basal {0002} texture.
-
A combination of hot rolling and aging heat treatments at 250 °C for 10 h promoted an alloy with a small grain size with thin, dispersed precipitates.
-
These precipitates dispersed after aging at 250 °C for 10 h collaborated for an increase in the strength of the alloy as shown by the hardness increase.
-
These characteristics of grain refinement and thin, dispersed precipitates led to a better corrosion resistance of aging at 250 °C for 10 h specimens as shown by a lower corrosion rate.

Author Contributions

Conceptualization, B.X.d.F. and C.A.N.; investigation, B.X.d.F., L.A.A., V.L.F.d.S., P.L.C.T.C., C.R.T., S.M. and N.C.; resources, C.A.N. and G.C.C.; writing—original draft preparation, B.X.d.F., C.d.S. and C.R.T.; writing—review and editing, C.A.N., G.C.C. and S.M.; supervision, C.d.S., N.C. and G.C.C.; project administration, C.A.N.; funding acquisition, C.A.N. and G.C.C. All authors have read and agreed to the published version of the manuscript.

Funding

This research was funded in part by the Coordenação de Aperfeiçoamento de Pessoal de Nível Superior (CAPES)—Brasil—Finance Code 001. B. X. FREITAS acknowledges the Conselho Nacional de Pesquisa e Desenvolvimento (CNPq) for his scholarship (grant n° 142337/2019-6). L. A ANTONINI and V. L. F. SILVA acknowledge Fundação de Amparo à Pesquisa do Estado de São Paulo (FAPESP) (grants #2017/17257-5 and #2018/20375-2, respectively).

Conflicts of Interest

The authors declare no conflict of interest.

References

  1. Witte, F. The history of biodegradable magnesium implants: A review. Acta Biomater. 2010, 6, 1680–1692. [Google Scholar] [CrossRef]
  2. Liu, D.; Yang, D.; Li, X.; Hu, S. Mechanical properties, corrosion resistance and biocompatibilities of degradable Mg-RE alloys: A review. J. Mater. Res. Technol. 2019, 8, 1538–1549. [Google Scholar] [CrossRef]
  3. Nayak, S.; Bhushan, B.; Jayaganthan, R.; Gopinath, P.; Agarwal, R.; Lahiri, D. Strengthening of Mg based alloy through grain refinement for orthopaedic application. J. Mech. Behav. Biomed. Mater. 2016, 59, 57–70. [Google Scholar] [CrossRef]
  4. Lowe, T.; Valiev, R. Frontiers for bulk nanostructured metals in biomedical applications. In Advanced Biomaterials and Biodevices; Tiwari, A., Nordin, A.N., Eds.; Wiley-Blackwell: Oxford, UK, 2014; pp. 1–52. [Google Scholar]
  5. Zhang, X.; Yuan, G.; Mao, L.; Niu, J.; Fu, P.; Ding, W. Effects of extrusion and heat treatment on the mechanical properties and biocorrosion behaviors of a Mg–Nd–Zn–Zr alloy. J. Mech. Behav. Biomed. Mater. 2012, 7, 77–86. [Google Scholar] [CrossRef] [PubMed]
  6. Yang, L.; Huang, Y.; Peng, Q.; Feyerabend, F.; Kainer, K.U.; Willumeit, R.; Hort, N. Mechanical and corrosion properties of binary Mg–Dy alloys for medical applications. Mater. Sci. Eng. B 2011, 176, 1827–1834. [Google Scholar] [CrossRef]
  7. Feyerabend, F.; Fischer, J.; Holtz, J.; Witte, F.; Willumeit, R.; Drücker, H.; Vogt, C.; Hort, N. Evaluation of short-term effects of rare earth and other elements used in magnesium alloys on primary cells and cell lines. Acta Biomater. 2010, 6, 1834–1842. [Google Scholar] [CrossRef] [PubMed] [Green Version]
  8. Haley, T.J.; Koste, L.; Komesu, N.; Efros, M.; Upham, H. Pharmacology and toxicology of dysprosium, holmium, and erbium chlorides. Toxicol. Appl. Pharmacol. 1966, 8, 37–43. [Google Scholar] [CrossRef]
  9. Zaichick, S.; Zaichick, V.; Karandashev, V.; Nosenko, S. Accumulation of rare earth elements in human bone within the lifespan. Metallomics 2011, 3, 186–194. [Google Scholar] [CrossRef]
  10. Zaichick, V. Chemical elements of human bone tissue investigated by nuclear analytical and related methods. Biol. Trace Elem. Res. 2013, 153, 84–99. [Google Scholar] [CrossRef]
  11. Yang, L.; Ma, L.; Huang, Y.; Feyerabend, F.; Blawert, C.; Höche, D.; Willumeit-Römer, R.; Zhang, E.; Kainer, K.U.; Hort, N. Influence of Dy in solid solution on the degradation behavior of binary Mg-Dy alloys in cell culture medium. Mater. Sci. Eng. C 2017, 75, 1351–1358. [Google Scholar] [CrossRef]
  12. Bottrill, M.; Kwok, L.; Long, N.J. Lanthanides in magnetic resonance imaging. Chem. Soc. Rev. 2006, 35, 557. [Google Scholar] [CrossRef]
  13. Du, Z.; Yang, X.; Ling, G.; Liu, H. Thermodynamic assessment of the Dy–Mg system. Z. für Met. 2004, 95, 1115–1119. [Google Scholar] [CrossRef]
  14. Ma, N.; Peng, Q.; Pan, J.; Li, H.; Xiao, W. Effect of microalloying with rare-earth on recrystallization behaviour and damping properties of Mg sheets. J. Alloys Compd. 2014, 592, 24–34. [Google Scholar] [CrossRef]
  15. Liu, H.H.; Ning, Z.L.; Yi, J.Y.; Qian, M.; Sun, H.C.; Huang, Y.J.; Sun, J.F. Effect of Dy addition on microstructure and mechanical properties of Mg-4Y-3Nd-0.4 Zr alloy. Trans. Nonferrous Met. Soc. China 2017, 27, 797–803. [Google Scholar] [CrossRef]
  16. Gao, X.; He, S.M.; Zeng, X.; Peng, L.; Ding, W.J.; Nie, J.F. Microstructure evolution in a Mg–15Gd–0.5Zr (wt.%) alloy during isothermal aging at 250 °C. Mater. Sci. Eng. A 2006, 431, 322–327. [Google Scholar] [CrossRef]
  17. Apps, P.; Karimzadeh, H.; King, J.; Lorimer, G. Precipitation reactions in magnesium-rare earth alloys containing yttrium, gadolinium or dysprosium. Scr. Mater. 2003, 48, 1023–1028. [Google Scholar] [CrossRef]
  18. Saito, K.; Yasuhara, A.; Nishijima, M.; Hiraga, K. Structural changes of precipitates by aging of an Mg-4 at% Dy solid solution studied by atomic-scaled transmission electron microscopy. Mater. Trans. 2011, 52, 1009–1015. [Google Scholar] [CrossRef] [Green Version]
  19. Nishijima, M.; Hiraga, K.; Yamasaki, M.; Kawamura, Y. Characterization of β′ phase precipitates in an Mg-5 at% Gd alloy aged in a peak hardness condition, studied by high-angle annular detector dark-field scanning transmission electron microscopy. Mater. Trans. 2006, 47, 2109–2112. [Google Scholar] [CrossRef] [Green Version]
  20. Honma, T.; Ohkubo, T.; Hono, K.; Kamado, S. Chemistry of nanoscale precipitates in Mg–2.1 Gd–0.6 Y–0.2 Zr (at.%) alloy investigated by the atom probe technique. Mater. Sci. Eng. A 2005, 395, 301–306. [Google Scholar] [CrossRef]
  21. Zeng, R.; Dietzel, W.; Witte, F.; Hort, N.; Blawert, C. Progress and challenge for magnesium alloys as biomaterials. Adv. Eng. Mater. 2008, 10, B3–B14. [Google Scholar] [CrossRef]
  22. Beausir, B.; Fundenberger, J. Analysis Tools for Electron and X-ray Diffraction, ATEX Software. 2017. Available online: www.atex-software.eu (accessed on 11 August 2021).
  23. ASTM E112. Standard test methods for determining average grain size. Heyn Linear Intercept Procedure. 2013.
  24. Ding, Y.; Lin, J.; Wen, C.; Zhang, D.; Li, Y. Mechanical properties, corrosion, and biocompatibility of Mg–Zr–Sr–Dy alloys for biodegradable implant applications. J. Biomed. Mater. Res. Part B Appl. Biomater. 2018, 106, 2425–2434. [Google Scholar] [CrossRef]
  25. Honma, T.; Ohkubo, T.; Kamado, S.; Hono, K. Effect of Zn additions on the age-hardening of Mg–2.0 Gd–1.2 Y–0.2 Zr alloys. Acta Mater. 2007, 55, 4137–4150. [Google Scholar] [CrossRef]
  26. Nie, J.F.; Muddle, B.C. Characterisation of strengthening precipitate phases in a Mg–Y–Nd alloy. Acta Mater. 2000, 48, 1691–1703. [Google Scholar] [CrossRef]
  27. Yang, L.; Huang, Y.; Feyerabend, F.; Willumeit, R.; Kainer, K.U.; Hort, N. Influence of ageing treatment on microstructure, mechanical and bio-corrosion properties of Mg–Dy alloys. J. Mech. Behav. Biomed. Mater. 2012, 13, 36–44. [Google Scholar] [CrossRef] [PubMed]
  28. Guangli, B.; Jiang, J.; Zhang, F.; Daqing, F.; Yuandong, L.; Ying, M.; Yuan, H. Microstructure evolution and corrosion properties of Mg-Dy-Zn alloy during cooling after solution treatment. J. Rare Earths 2016, 34, 931–937. [Google Scholar]
  29. Wan, Y.; Jiang, S.; Liu, C.; Wang, B.; Chen, Z. Effect of Nd and Dy on the microstructure and mechanical property of the as extruded Mg–1Zn–0.6Zr alloy. Mater. Sci. Eng. A 2015, 625, 158–163. [Google Scholar] [CrossRef]
  30. Hou, R.Q.; Ye, C.Q.; Chen, C.D.; Dong, S.G.; Lv, M.Q.; Zhang, S.; Pan, J.S.; Song, G.L.; Lin, C.J. Localized corrosion of binary Mg–Ca alloy in 0.9 wt% sodium chloride solution. Acta Metall. Sin. (Engl. Lett.) 2016, 29, 46–57. [Google Scholar] [CrossRef] [Green Version]
  31. Ascencio, M.; Pekguleryuz, M.; Omanovic, S. An investigation of the corrosion mechanisms of WE43 Mg alloy in a modified simulated body fluid solution: The influence of immersion time. Corros. Sci. 2014, 87, 489–503. [Google Scholar] [CrossRef]
  32. Zhu, S.; Liu, Z.; Qu, R.; Wang, L.; Li, Q.; Guan, S. Effect of rare earth and Mn elements on the corrosion behavior of extruded AZ61 system in 3.5 wt% NaCl solution and salt spray test. J. Magnes. Alloy. 2013, 1, 249–255. [Google Scholar] [CrossRef] [Green Version]
  33. Gu, X.; Zheng, Y.; Cheng, Y.; Zhong, S.; Xi, T. In vitro corrosion and biocompatibility of binary magnesium alloys. Biomaterials 2009, 30, 484–498. [Google Scholar] [CrossRef]
  34. Zhang, X.; Yuan, G.; Mao, L.; Niu, J.; Ding, W. Biocorrosion properties of as-extruded Mg–Nd–Zn–Zr alloy compared with commercial AZ31 and WE43 alloys. Mater. Lett. 2012, 66, 209–211. [Google Scholar] [CrossRef]
  35. Kubásek, J.; Vojtěch, D. Structural and corrosion characterization of biodegradable Mg–RE (RE = Gd, Y, Nd) alloys. Trans. Nonferrous Met. Soc. China 2013, 23, 1215–1225. [Google Scholar] [CrossRef]
  36. Willbold, E.; Gu, X.; Albert, D.; Kalla, K.; Bobe, K.; Brauneis, M.; Janning, C.; Nellesen, J.; Czayka, W.; Tillmann, W.; et al. Effect of the addition of low rare earth elements (lanthanum, neodymium, cerium) on the biodegradation and biocompatibility of magnesium. Acta Biomater. 2015, 11, 554–562. [Google Scholar] [CrossRef]
  37. Leleu, S.; Rives, B.; Caussé, N.; Pébère, N. Corrosion rate determination of rare-earth Mg alloys in a Na2SO4 solution by electrochemical measurements and inductive coupled plasma-optical emission spectroscopy. J. Magnes. Alloy. 2019, 7, 47–57. [Google Scholar] [CrossRef]
  38. Srinivasan, A.; Blawert, C.; Huang, Y.; Mendis, C.; Kainer, K.; Hort, N. Corrosion behavior of Mg–Gd–Zn based alloys in aqueous NaCl solution. J. Magnes. Alloy. 2014, 2, 245–256. [Google Scholar] [CrossRef] [Green Version]
  39. Baril, G.; Pebere, N. The corrosion of pure magnesium in aerated and deaerated sodium sulphate solutions. Corros. Sci. 2001, 43, 471–484. [Google Scholar] [CrossRef]
  40. Anik, M.; Celikten, G. Analysis of the electrochemical reaction behavior of alloy AZ91 by EIS technique in H3PO4/KOH buffered K2SO4 solutions. Corros. Sci. 2007, 49, 1878–1894. [Google Scholar] [CrossRef]
  41. Chu, J.; Tong, L.; Jiang, Z.; Zou, D.; Wang, Q.; Liu, S.; Zhang, H. A comparison study of Ce/La and Ca microalloying on the bio-corrosion behaviors of extruded Mg-Zn alloys. J. Magnes. Alloy. 2020, 8, 1269–1280. [Google Scholar] [CrossRef]
  42. González-Murguía, J.L.; Veleva, L.; Rodríguez-Gattorno, G.; Figueroa-Torres, M.Z.; Feliu, S. Mg–Ca0.3 Electrochemical Activity Exposed to Hank’s Physiological Solution and Properties of Ag-Nano-Particles Deposits. Metals 2021, 11, 1357. [Google Scholar] [CrossRef]
  43. Dinodi, N.; Shetty, A.N. Alkyl carboxylates as efficient and green inhibitors of magnesium alloy ZE41 corrosion in aqueous salt solution. Corros. Sci. 2014, 85, 411–427. [Google Scholar] [CrossRef]
  44. Liu, J.; Yang, L.; Zhang, C.; Zhang, B.; Zhang, T.; Li, Y.; Wu, K.; Wang, F. Significantly improved corrosion resistance of Mg–15Gd-2Zn-0.39Zr alloys: Effect of heat-treatment. J. Mater. Sci. Technol. 2019, 35, 1644–1654. [Google Scholar] [CrossRef]
  45. Alateyah, A.; Aljohani, T.A.; Alawad, M.O.; El-Hafez, H.A.; Almutairi, A.; Alharbi, E.; Alhamada, R.; El-Garaihy, B.; El-Garaihy, W. Improved Corrosion Behavior of AZ31 Alloy through ECAP Processing. Metals 2021, 11, 363. [Google Scholar] [CrossRef]
Figure 1. (a) SEM/BSE micrograph, (b) XRD pattern and (c) LOM micrograph of the H525 °C-3 h specimen.
Metals 11 01855 g001
Figure 2. Schematic directions in the rolled plate and SEM/BSE micrographs (a,c,e) and LOM micrographs (b,d,f) of the rolled specimen.
Metals 11 01855 g002
Figure 3. XRD diffractograms of rolled and aged specimens.
Metals 11 01855 g003
Figure 4. Aging hardening behavior at 250 °C after hot rolling.
Metals 11 01855 g004
Figure 5. SEM/BSE (a,c,e) and LOM micrographs (b,d,f) of aged-10 h specimen; and pole figures of {10 1 ¯ 0}, {0002} and {10 1 ¯ 1} planes.
Metals 11 01855 g005
Figure 6. Open circuit potential curves of H525 °C-3 h, rolled and aged-10 h specimens in 0.9 wt.% NaCl aqueous solution at 37.0 ± 0.5 °C.
Metals 11 01855 g006
Figure 7. Potentiodynamic polarization curves of H525 °C-3 h, rolled and aged −10 h specimens in 0.9 wt.% NaCl aqueous solution at 37.0 ± 0.5 °C.
Metals 11 01855 g007
Figure 8. Nyquist curves after 30 min (1°EIS), 50 min (2°EIS) and 70 min (3°EIS) of immersion times (a) H525 °C-3 h, (b) rolled and (c) aged-10 h specimens in 0.9 wt.% NaCl aqueous solution at 37.0 ± 0.5 °C.
Metals 11 01855 g008
Figure 9. (a) Bode curves and (b) phase angle of H525 °C-3 h, rolled and aged-10 h specimens in 0.9 wt.% NaCl aqueous solution at 37.0 ± 0.5 °C.
Metals 11 01855 g009
Figure 10. Equivalent electric circuit used to model the experimental impedance data of MgDyZnZr alloy specimens immersed in 0.9 wt.% NaCl solution at 37 ± 0.5 °C.
Metals 11 01855 g010
Table 1. Electrochemical parameters of H525 °C-3 h, rolled and aged-10 h specimens: corrosion potential (E c o r r ), current density (i c o r r ) and corrosion rate (CR).
ConditionE corr (V/Ag|AgCl sat )i corr ( μ A cm 2 )CR (mm Year 1 )
H525 °C-3 h−1.423 ± 0.01185.2 ± 3.02.0 ± 0.1
Rolled−1.475 ± 0.02074.4 ± 3.11.7 ± 0.1
Aged-10 h−1.479 ± 0.02135.4 ± 9.70.9 ± 0.2
Table 2. Comparison of corrosion rate of H525 °C-3 h, rolled and aged-10 h specimens with data from the literature.
Alloy (wt.%)ConditionSolutionCR (mm Year 1 )Ref.
Mg–3.4Dy–0.2Zn–0.4Zr525 °C-3 h0.9 wt.% NaCl2.0This work
Mg–3.4Dy–0.2Zn–0.4ZrRolled0.9 wt.% NaCl1.7This work
Mg–3.4Dy–0.2Zn–0.4ZrAged-10 h0.9 wt.% NaCl0.9This work
Mg–3.1Nd–0.2Zn–0.4ZrExtruded–Aged 10 hSBF0.18[5]
WE43ExtrudedSBF0.125[34]
Mg–5Dy520 °C—24 h0.9 wt.% NaCl0.5[27]
Mg–10Dy520 °C—24 h0.9 wt.% NaCl0.9[27]
Mg–3Gd–1YAs-cast9 g L 1 NaCl3.16[35]
Mg–4Nd520 °C—20 h9 g L 1 NaCl0.62[35]
Mg–1YRolledSBF1.65[33]
Mg–2.13NdAs-castSBF1.25[36]
Mg–1.27CeAs-castSBF1.84[36]
Mg–0.69LaAs-castSBF2.15[36]
Table 3. Fit of the equivalent circuit parameters of H525 °C-3 h, rolled and aged-10 h specimens.
Condition Ω EISR s ( Ω ·cm 2 )R 1 ( Ω ·cm 2 )CPE 1 ( Ω 1 ·s n ·cm 2 )n 1 R 2 ( Ω ·cm 2 )CPE 2 ( Ω 1 ·s n ·cm 2 )n 2 R L ( Ω ·cm 2 )
H525 °C-3 h15.99 ± 1.0689.25 ± 2.134.5 × 10 5 ± 3.89 × 10 6 0.98 ± 0.019.18 ± 2.731.88 × 10 6 ± 2.17 × 10 7 0.60 ± 0.048.06 ± 0.02
H525 °C-3 h1.02 ± 0.0884.86 ± 1.427.17 × 10 5 ± 4.45 × 10 6 0.93 ± 0.0118.20 ± 0.205.30 × 10 9 ± 4.75 × 10 10 0.70 ± 0.0312.99 ± 0.14
H525 °C-3 h0.52 ± 0.09142.4 ± 1.309.53 × 10 5 ± 2.98 × 10 6 0.93 ± 0.0118.62 ± 0.112.59 × 10 9 ± 2.76 × 10 10 0.70 ± 0.0213.76 ± 0.12
Rolled12.79 ± 0.16144.6 ± 1.212.13 × 10 5 ± 4.07 × 10 7 0.95 ± 0.028.95 ± 1.006.86 × 10 6 ± 1.30 × 10 7 0.74 ± 0.058.21 ± 0.83
Rolled12.87 ± 0.13135.5 ± 0.733.40 × 10 5 ± 3.26 × 10 7 0.95 ± 0.026.46 ± 0.242.82 × 10 6 ± 3.90 × 10 7 0.60 ± 0.046.03 ± 0.20
Rolled12.27 ± 0.14137.6 ± 0.944.78 × 10 5 ± 1.24 × 10 6 0.95 ± 0.014.32 ± 0.192.28 × 10 6 ± 4.60 × 10 7 0.60 ± 0.014.17 ± 0.17
Aged-10 h19.74 ± 0.1117,361.0 ± 16073.66 × 10 4 ± 5.54 × 10 5 0.95 ± 0.03477.2 ± 7.868.81 × 10 6 ± 2.08 × 10 7 0.91 ± 0.01462.4 ± 7.21
Aged-10 h21.25 ± 0.15402.3 ± 20.01.44 × 10 5 ± 6.15 × 10 7 0.95 ± 0.02106.9 ± 20.62.58 × 10 5 ± 3.59 × 10 6 0.70 ± 0.0565.54 ± 5.97
Aged-10 h21.66 ± 0.20335.3 ± 20.82.28 × 10 5 ± 1.46 × 10 6 0.95 ± 0.0398.09 ± 23.71.25 × 10 5 ± 1.80 × 10 6 0.66 ± 0.0461.66 ± 6.95
Publisher’s Note: MDPI stays neutral with regard to jurisdictional claims in published maps and institutional affiliations.

