Article

Defectoscopic and Geometric Features of Defects That Occur in Sheet Metal and Their Description Based on Statistical Analysis

1
Department of Industrial Automation, Ternopil National Ivan Puluj Technical University, Rus’ka Str. 56, 46001 Ternopil, Ukraine
2
Department of Technology, Materials and Computer Supported Production, Faculty of Mechanical Engineering, Technical University of Košice, Mäsiarska 74, 040 01 Košice, Slovakia
*
Author to whom correspondence should be addressed.
Metals 2021, 11(11), 1851; https://doi.org/10.3390/met11111851
Submission received: 22 October 2021 / Revised: 15 November 2021 / Accepted: 16 November 2021 / Published: 18 November 2021
(This article belongs to the Special Issue Renovation of Parts to Save Metals)

Abstract

:
Features of the defect class “scratches, attritions, lines”, their geometric structure, and their causes are analyzed. An approach is developed that defines subclasses within this class of technological defects based on additional analysis of morphological features. The analysis of the reasons for these subclasses allows additional information to be obtained about the rolling process, identifying additional signs of defects, regulating the rolling conditions of steel strips more accurately, and diagnosing the equipment condition.

1. Introduction

The quality of sheet metal produced by rolling techniques is determined by the presence or absence of defects [1,2,3]. Changes in technology and wear and tear of the rolling equipment affect the quality of the sheet metal surface, which is an important problem in mass production. At present, optical–digital control of the rolled strip surface is used in production [4,5]. However, new methods for obtaining and processing images have new requirements for detecting and localizing defects and determining their size, shape, and potential hazard, in order to identify which rolled strips should be rejected [6]. One of the problems is identifying and classifying a wide range of defects that are similar in their geometry [7]. This issue is addressed in many studies and requires further attention.
Another problem is distinguishing subclasses and evaluating defect parameters within one class. The increased sensitivity of optical–digital systems allows the geometry of defects to be estimated with high accuracy and their geometric features to be identified. This allows defect parameters to be estimated within one class and enables the defects to be allocated to subclasses using additional morphological features [8,9]. This allocation to subclasses makes it possible to find the causes of the defects, determine their size and geometry, and identify the conditions in which they are formed and the patterns of their formation. By changing the processing conditions of the sheet billet, one can control the behavior of the defects that occur in the finished strip [10]. However, this approach is only possible with a detailed analysis of the defect shape based on the comparison with technological factors. This will improve the production technology of flat rolling and reduce the number of surface defects by:
Identifying technological reasons for the formation of defects during rolling;
Studying and systematizing the morphological description of defects of different shapes and determining their description’s parameter ranges.
Unfortunately, despite a significant number of studies dedicated to defect recognition in metallurgical equipment, there is no commonly accepted system for the morphological description of defects of different types and their quantitative classification, taking into account their shapes and geometric dimensions. A system of this kind would allow a wide range of defects that occur in practice to be standardized. In addition, it would allow the cost of equipment for their recognition to be optimized, while ensuring the highest possible level of defectoscopy and defectometry. The urgency of this problem is constantly increasing because, apart from applications in metallurgy, such a system could be used to assess the defects of coatings, sensor surfaces, and more.
In automatic defect detection, segmentation is important as it allows a binary map of the surface defects to be created. Segmentation is performed by various methods. Statistical methods (Markov random fields, Otsu’s method, Bayesian segmentation, gray level co-occurrence matrix, etc.) are based on the spatial distribution of the image pixel intensity. Methods based on the use of filters (discrete Fourier transform, Gabor method, wavelet transform, etc.) collect the feature maps of the desired objects by using a bank of filters. Since 2015, the main trend in the segmentation of surface defects has been towards machine learning methods, because these can overcome both the many shortcomings of manual detection and the excessive practical complexity of statistical and filter-based methods. Systems based on CNNs are already found in many industrial areas, such as monitoring of metal surfaces, semiconductor plates, fabric inspection, pavement damage detection, inspection of railway tracks, and more.
Metal surface defects can vary in size, shape, and texture, and often have similarities to surface artifacts that are not defects. Convolutional neural networks allow a complete set of the features inherent in the damage to be built during training, to effectively detect defects. Therefore, for segmentation, we used a CNN based on the UNet architecture, which is well established in the field of image segmentation and object detection.
To date, most studies have been limited to the location and classification of surface defects. However, this does not allow for their quantitative assessment or for making an express analysis of the results.
The purpose of this study was to develop a method for recognizing and identifying the morphological features of subclasses of rolled defects caused by the friction of solid objects against a metal sheet. For this purpose, a statistical analysis of parameters that describe their morphology was performed, and a classifier model based on the random forest algorithm was built. In this study, to test the proposed ideas, the researchers limited themselves to defects of the linear type, which are allocated to one class including scratches, lines, and attritions but have morphological differences and can be divided into subclasses [11,12]. For defectoscopic analysis, it is necessary to identify the defect on the surface of the rolled product and to delineate its boundaries, in order to analyze its morphology. Statistical and machine learning methods were used for the image analysis to solve these problems.

2. Technological and Morphological Prerequisites for Classification

Technological Defects and Causes of Their Occurrence

According to GOST 9045-80, a rolled strip belongs to quality group I if its front side (the best surface quality) contains only small individual scratches with length less than 20 mm. The reverse side should not contain any scratches with a depth exceeding half the deviation of the sheet thickness.
A strip of quality group II has a surface without any lines and scratches of length up to 50 mm or depth exceeding the maximum deviation of the sheet thickness. Lines and scratches are not allowed on the reverse side. Contamination stains are allowed.
A strip of quality group III should not contain lines, scratches, or attritions on the surface. Only contamination stains are allowed.
GOST 9045-80 allows the surface quality characteristics of individual groups to be specified based on approved specimens (standards). The surfaces of sheets of all groups, except for the front side of group I strips, may be cleared of defects by grinding, using fine-grained emery, or using felt circles with abrasive paste.
The unreasonably low requirements of GOST 9045-80 and GOST 16523-70 for the depth of scratches, lines, and attritions are of particular note. In strips of groups II and III, defects with a depth of up to half the allowable deviation in the sheet thickness are extremely rare, as evidenced by industrial practice. However, scratches, lines, and attritions with a depth of 0.02–0.03 mm significantly impair the appearance of sheet products and complicate the use of such metal products by consumers (in the process of pressing, such defects may cause cracks).
The main reason for defects of type “scratches, lines, attritions” is strip slippage on the roller guide [13]. The emerging optical–digital methods allow new surface quality characteristics to be established and the existing ones to be refined. For instance, it is promising to specify the size of permissible defects and their subclasses. In particular, GOST 9045-93 and GOST 16523-97 allow for small lines on the strip surface. Distinguishing between such subclasses as “lines”, “attritions”, and “scratches” would allow for a better understanding of the requirements for the surface, as well as quantifying their parameters and relative surface areas. Periodic grinding of rollers helps to avoid recurrent scratches and lines [14]. Synchronous rotation of the rollers with the speed of the conveyor belt helps to avoid strip displacements and attritions.

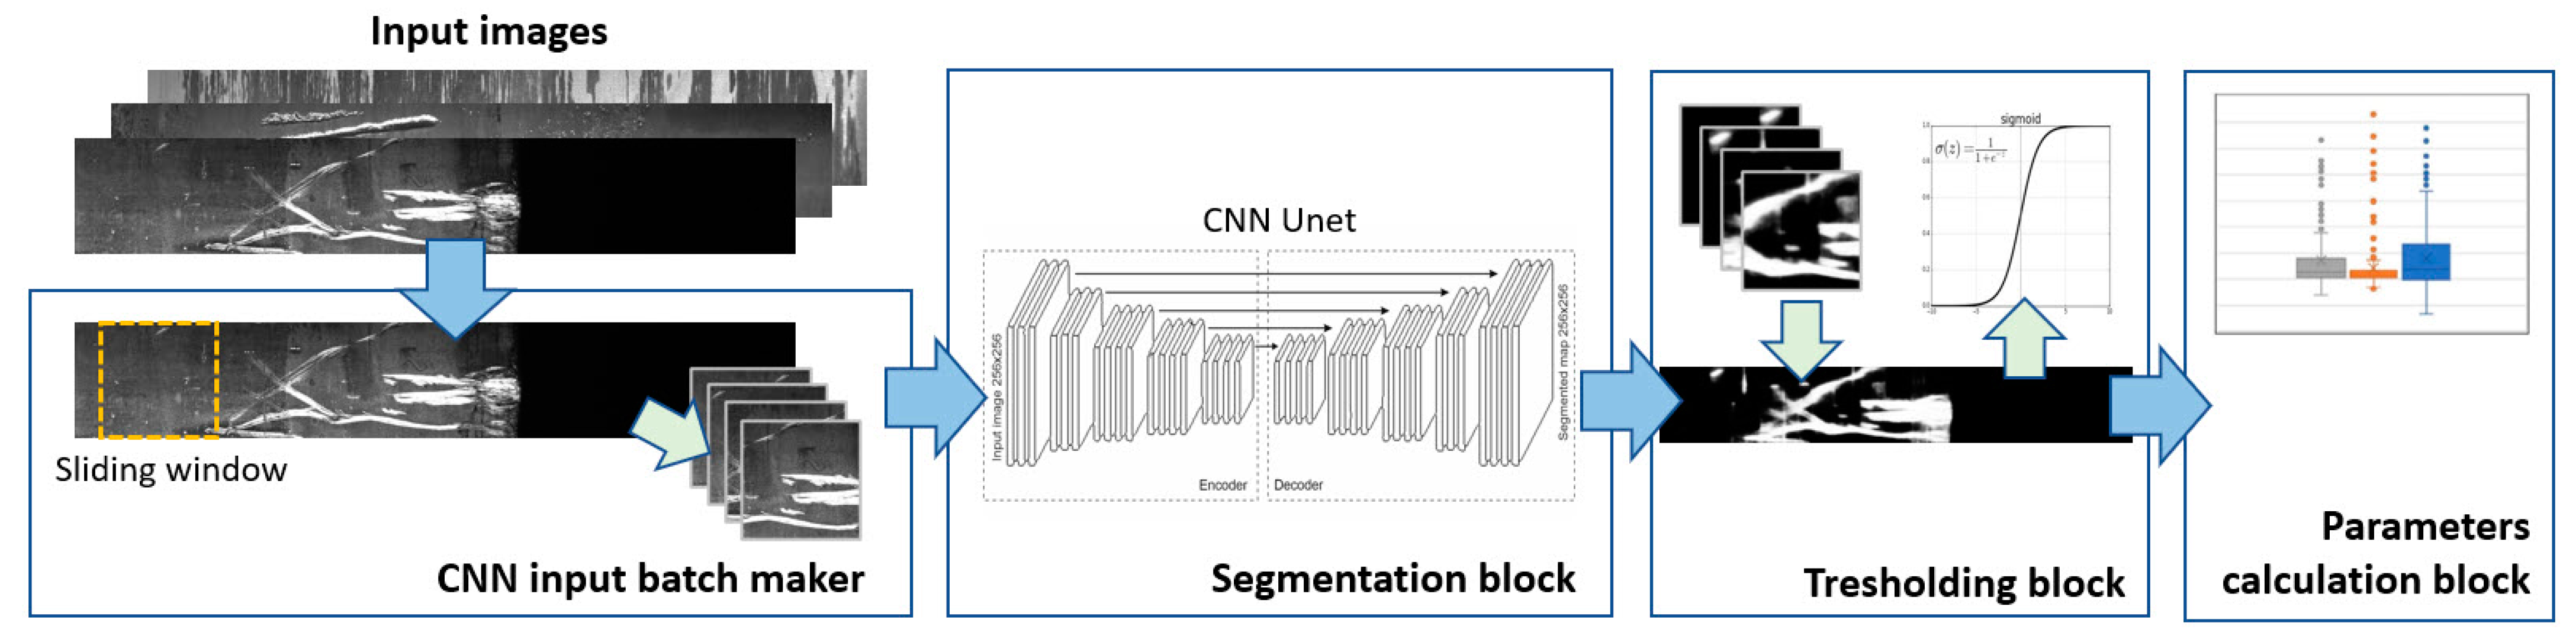
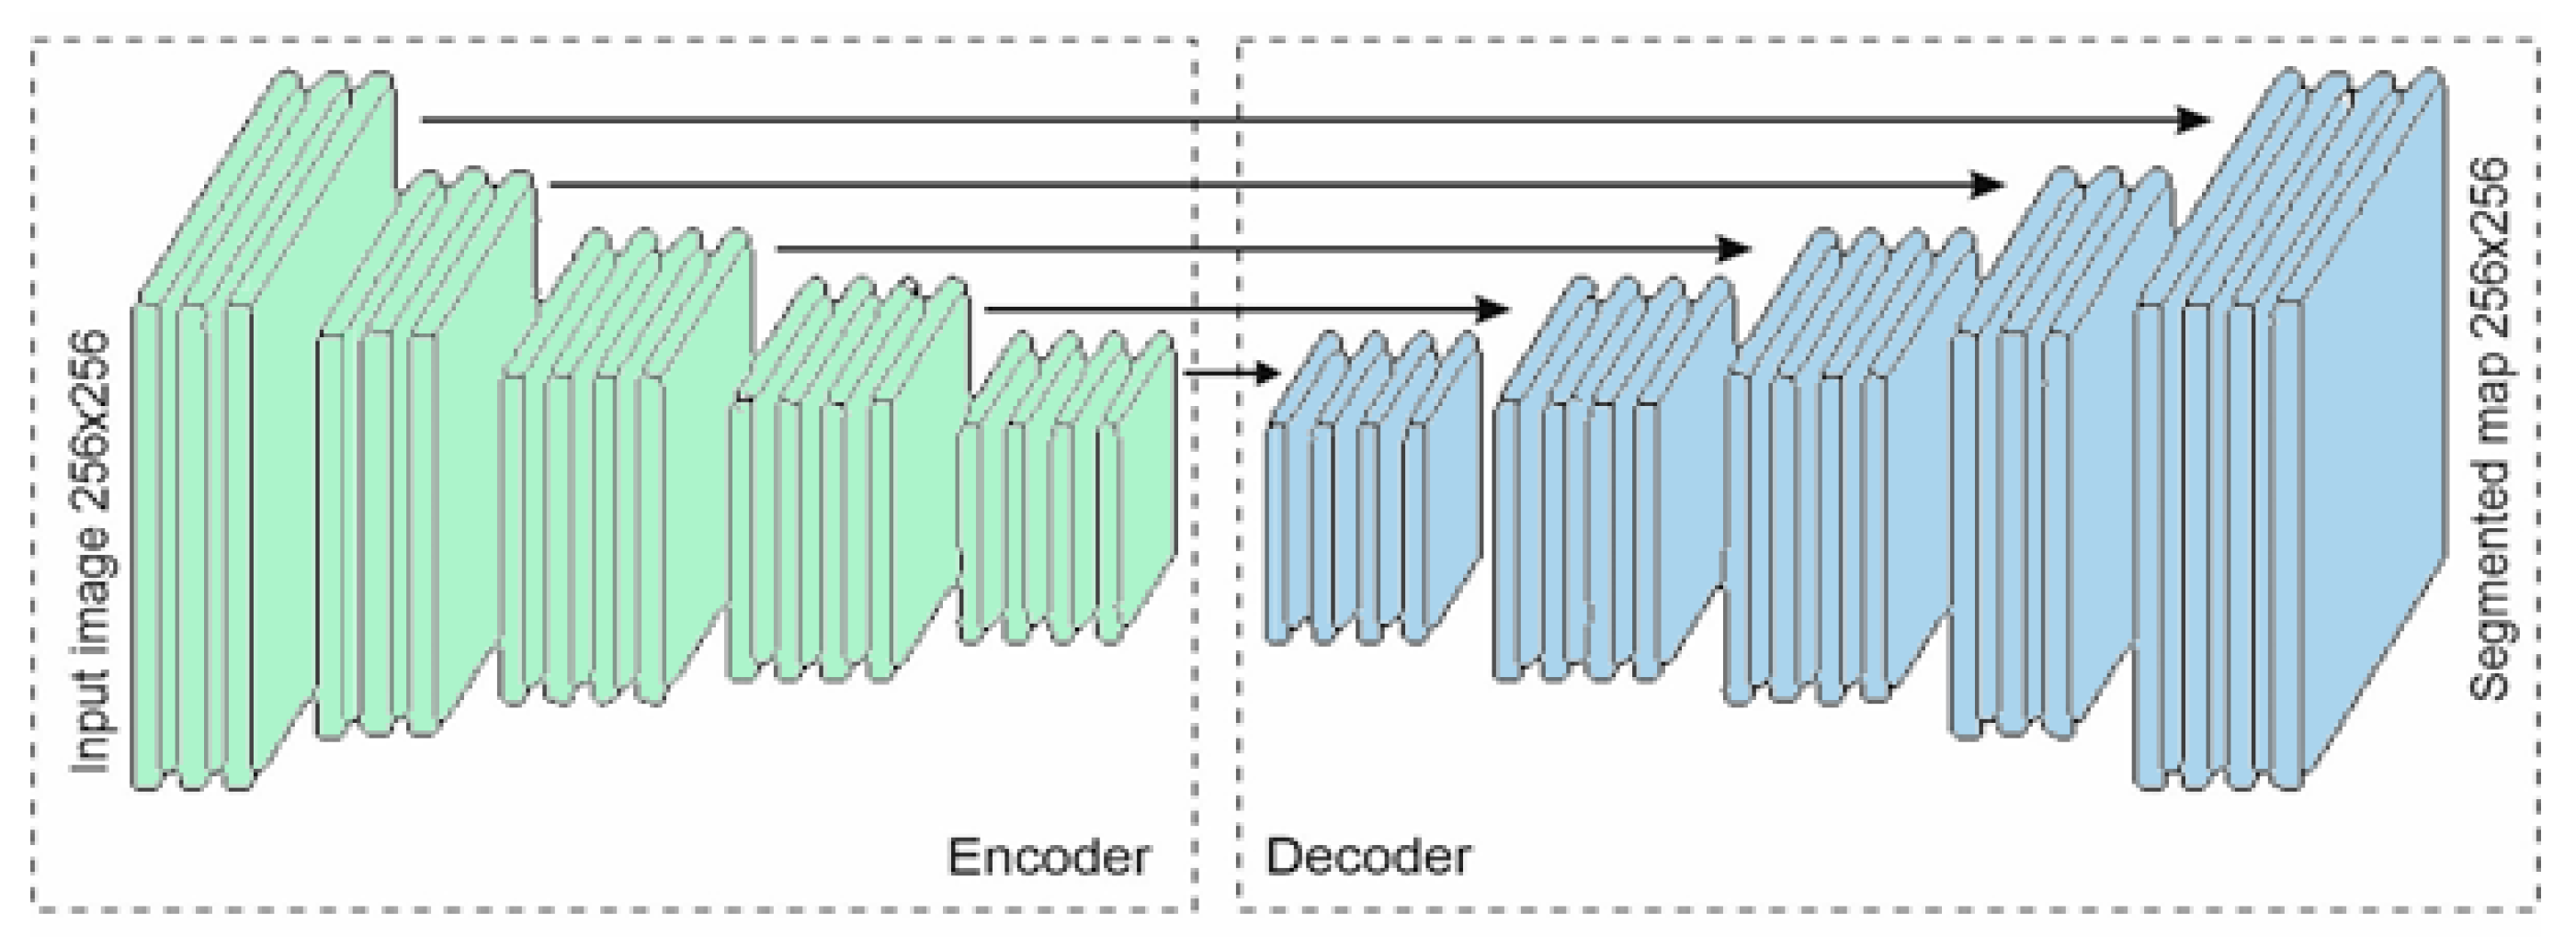
3. Method for Detecting Defective Zones

Defects were investigated using images obtained in industrial conditions during the manufacture of rolled steel sheets. Images provided by Severstal, a Russian steel and mining company that participated in the analytics and modeling contest organized on the Kaggle platform in 2019, formed the basis of the study [15]. From the array of images, we selected those that corresponded to the studied subclasses. Figure 1 shows examples of images of each subclass. The images were selected and marked by a group of experts.
The general architecture of the proposed application complex for surface defect investigation using images is shown in Figure 2. The initial images are fed to the block to form the input batch for the CNN. By means of a sliding window with a certain step, a batch of images with a size corresponding to the size of an input layer of a neural network is formed. Next, this batch is fed to the segmentation block, where the CNN produces a batch of two-dimensional maps of the spatial distribution of recognized defects for each image in the batch. The batch of recognized images is fed to the thresholding block, which synthesizes the defects map for the input image and performs the final thresholding, so that all the pixels are divided into two clusters: defect and background (undamaged areas). The obtained binary image enters the block for the calculation of defect parameters, where separate elements of the defects are identified and their quantitative parameters (number, area, size, statistical indicators, etc.) are calculated.
A semantic segmentation model based on a neural network was used to recognize and classify defects in the image. This model allowed each pixel to be assigned to objects of one of the three damage subclasses, or to be classified as belonging to an intact surface. Semantic segmentation allows areas in the image to be selected that contain objects of interest, which, in turn, allows defects to be quantified by calculating their geometric characteristics (size, area, etc.).
The segmentation model was built based on the UNet neural network [16], which was proposed in 2015 for the segmentation of biomedical images. The model is based on the fully convolutional architecture proposed by Long et al. [17]. The UNet architecture has demonstrated excellent results in image recognition in various areas, including the study of medical images [18], the search for roads in aerial photography [19], the detection of clouds and shadows cast by clouds [20], and the detection of defects in textile products [21].
The UNet architecture consists of two parts (Figure 3). The first part (encoder) performs “compression” of the input image and is used to capture the context of the image. This stage contains blocks of ordinary convolutional and max-pooling layers connected sequentially. After each convolution, batch normalization is performed [22], which makes it possible to reduce the retraining of the deep neural network and accelerate the training process itself. In this case, each convolutional layer forms feature maps of objects of different sizes and scales. The second part performs the opposite of the first action—it expands the feature maps to the size of the corresponding convolutional layer in a stepwise manner. This makes it possible to localize the position of the detected features using transposed convolution.
The encoder contains five stages. The first stage receives an input image measuring 256 × 256 pixels and performs the initial convolution and max-pooling, thus reducing the image size to 128 × 128 pixels. The second stage forms feature maps measuring 128 × 128 pixels; after max-pooling these are reduced to 64 × 64 pixels. The third stage processes feature maps measuring 64 × 64 and 32 × 32 pixels. The second and third stages highlight the most common features of the objects in the image. At the fourth stage, feature maps measuring 32 × 32 and 16 × 16 pixels are distinguished. This stage performs the main work of highlighting the features of the objects of interest, and it forms the most significant number of maps that characterize the object features in greater detail. The fifth stage processes feature maps measuring 16 × 16 and 8 × 8 pixels, highlighting the smallest features of the objects. Each stage contains sequentially connected convolutional layers, after which batch normalization is performed. The decoder also contains five stages, each of which is associated with the outputs of the relevant encoder stages and performs upsampling and generalization of its feature maps. The source layer of the neural network has a shape of 256 × 256 neurons with a sigmoid activation function. Thus, each neuron of the output layer represents the input image pixel and yields a value in the range of (0; 1), which reflects the degree of reliability with which the model assigns this pixel to a particular class of damage.
A training sample of 9385 images measuring 256 × 256 pixels was formed, based on the available image database. The sample contained photos of undamaged surfaces, photos of the three studied subclasses, and photos of surface defects of other types that we studied in previous work [23]. The available images were divided into the training (6005 images), validation (1502 images), and test (1878 images) subsamples.
The neural network for semantic image segmentation was built using the TensorFlow and Keras libraries. A workstation based on an Intel Core i7-2600 CPU with 32 GiB of RAM and two NVIDIA GeForce GTX 1060 GPUs, with 6 GiB of video memory, was used for training and testing.
The neural network was trained using the SGD (stochastic gradient descent) optimizer and the binary cross-entropy loss function. The random crop technique was used to train the model. For this purpose, a data generator was developed which selected a random position of the frame and, in addition, augmented the resulting area of the image.
The results of damage recognition on several test images are shown in Figure 4. In the neural network’s output, a result in the range of (0; 1) was obtained for each pixel; in Figure 4, these values are represented in grayscale.
The Dice similarity coefficient metric was used to assess the segmentation quality (Figure 5): D S C = 2 a i ( a g t   +   a s g ) (where a g t is the actual area of damage according to the initial label, a s g is the object area obtained after segmentation, and a i = a g t a s g is the intersection area of the actual object and found object). The intersection-over-union metric was also calculated to compare the segmentation results with those of other authors: I o U = a i a u (where a u = a g t a s g is the area of the combined sets of pixels a g t and a s g ).
Since the output values of the neural network are in the range of [ 0 ;   1 ] the Dice coefficient was calculated for different thresholds. The best result was achieved for a threshold of 0.5. For the set of images under study, D S C @ 0.5 = 0.912 and IoU @ 0.5 = 0.894 .
These results are comparable with the indicators achieved by other authors in similar areas (see Table 1) and meet the industry requirements.

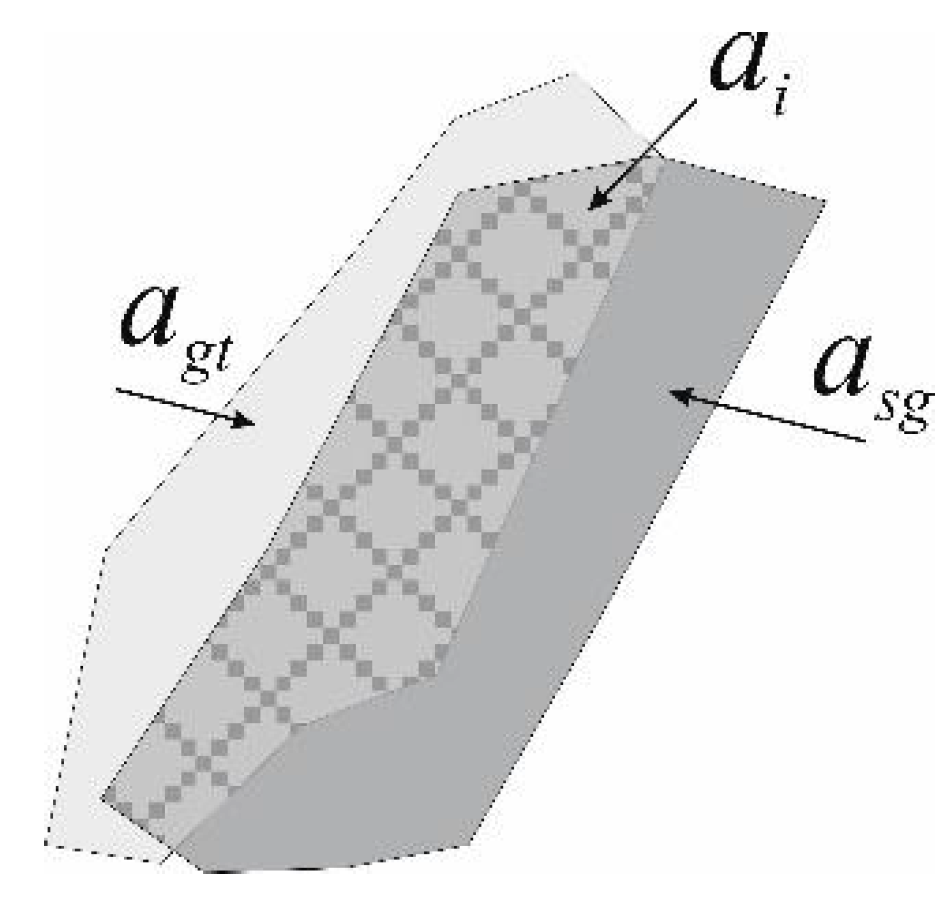
4. Defect Geometry Analysis

Individual objects (combined groups of pixels) recognized by the model represent elements of surface defects. In order to identify the defect characteristics, defect properties were determined according to the parameters given in Table 2. First of all, the area was considered the primary parameter that characterizes the defect size. In addition, we calculated the perimeter, which in combination with the area describes the object’s edge roughness.
To calculate other parameters, we used the idea of an “equivalent” ellipse, the second moment of which is equal to the moment of the defect found by the model [29,30]. This approach is simplified and does not always properly describe the morphology of random defects. However, it is valid for the defects in the classes considered, which have differences in morphology as described in Table 3. The defect orientation was calculated as the inclination of the ellipse’s major axis to the rolling direction. The Ferret diameter, ellipse eccentricity, and lengths of the major and minor axes of the ellipse were calculated as additional parameters. For the studied set of images with damage, the Ferret diameter was found to deviate from the length of the ellipse’s major axis by not more than 4%. Thus, the length of the ellipse’s major axis can be considered as a parameter that characterizes the maximum size of the object. The ellipse eccentricity can vary within the range of (0; 1) and characterizes the degree of defect “elongation”. If the eccentricity is close to zero, the defect shape is close to circular. If the eccentricity is close to 1, the defect has a linear shape.

5. Morphological Analysis Results

Based on statistical estimates of the sample obtained based on previous knowledge of the desired result, the factor features were found to differentiate defects by their geometry. The purpose was to gain practical experience with different methods that can be applied to solve another practical problem—classifying defects into subtypes. The obtained numerical information was analyzed using descriptive statistics. Box diagrams were constructed for the visual differentiation of the morphologies of defect subtypes (Figure 6). The values of the defect orientation distributions were compared, as well as the defect ellipse length versus defect perimeter ratios, values of eccentricity, and the minor axis versus the major axis of the defect ellipse ratios.
Orientation. Complete disorientation of defects is characteristic of the “attrition” subtype. Both positive and negative deviations are observed over almost the entire range of possible values (from −1.57 to +1.57 rad). Deviations with a negative sign are a little more numerous, as evidenced by the shift of the central tendencies (the median and the sample mean). This fact may indicate sheet mixing in the transverse direction during rolling. The “scratch” subclass is characterized by a clear orientation of defects parallel to the strip rolling direction. The vast majority of defects of the “line” subclass are also oriented in the strip rolling direction; however, the distribution contains a significant number of outliers, that is, lines with arbitrary orientation. This fact may indicate various reasons for the occurrence of defects of this subtype or the deficiencies found in the description of their morphology by experts.
Defect edge roughness. This was evaluated using the distribution of the “defect ellipse length/defect perimeter” parameter. This parameter can take values from the (0; 1) interval. Values close to 1 indicate a clear-cut contour with a smooth change in its curvature. A comparative analysis of the box diagrams showed that almost all parameter values for the “scratch” subtype were in the range of (0.83; 0.94). At the same time, this parameter covers a much more comprehensive range of values for defects of the “attrition” and “line” subtypes. It is noteworthy that for the defects analyzed, the value ranges of this parameter overlap. This may indicate its insensitivity and, accordingly, its inability to serve as a factor for differentiating defects by subtypes.
Eccentricity. This parameter can take values from the (0; 1) interval. The lowest values of eccentricity are observed for attritions, indicating a greater roundness of the defect ellipse. Scratches have the largest eccentricity value; almost all parameter values for defects of this subtype are in the (0.99; 1) interval. This clearly distinguishes the scratch subtype with a shape similar to fragments of straight lines. Lines occupy an intermediate position. It is particularly noteworthy that the parameter range for scratches almost does not overlap with that for attritions and lines, which suggests the sensitivity of this parameter to their shapes.
Elongation is the minor axis versus the major axis of the defect ellipse ratio. This ratio determines the shape of the main rectangle into which the defect ellipse is embedded. The parameter can take values from the (0; 1) interval. As can be seen from the box diagram, the parameter values for scratches are close to zero, which indicates an obviously elongated, lengthy shape for these defects. The elongation of attritions shows almost all possible values. Many distribution outliers of elongation values (towards 1) are noticeable for lines. These are lines of a relatively short length.
The Explorer interface of the Weka application package (Waikato Environment for Knowledge Analysis) for data mining was used to solve the problem of defect classification [31]. Weka is free software widely used by both researchers and industry scientists to automatically analyze large amounts of data, gain valuable knowledge, and make effective decisions in science and business.
The design matrix contained 545 samples assigned by experts to three classes: attritions (161 objects), scratches (213 objects), and lines (171 objects). All data were numerical, continuous, and rough. Omitted values were absent.

6. Attribute Selection

In [31,32,33,34], the geometry of surface defects (attritions, scratches, lines) was analyzed, considering them as one type. As a result, the relevant attributes described in Table 1 were identified along with their derivatives, as well as the following geometric characteristics:
Eccentricity of the defect ellipse, which shows the proximity of its shape to the circle (Eccentricity);
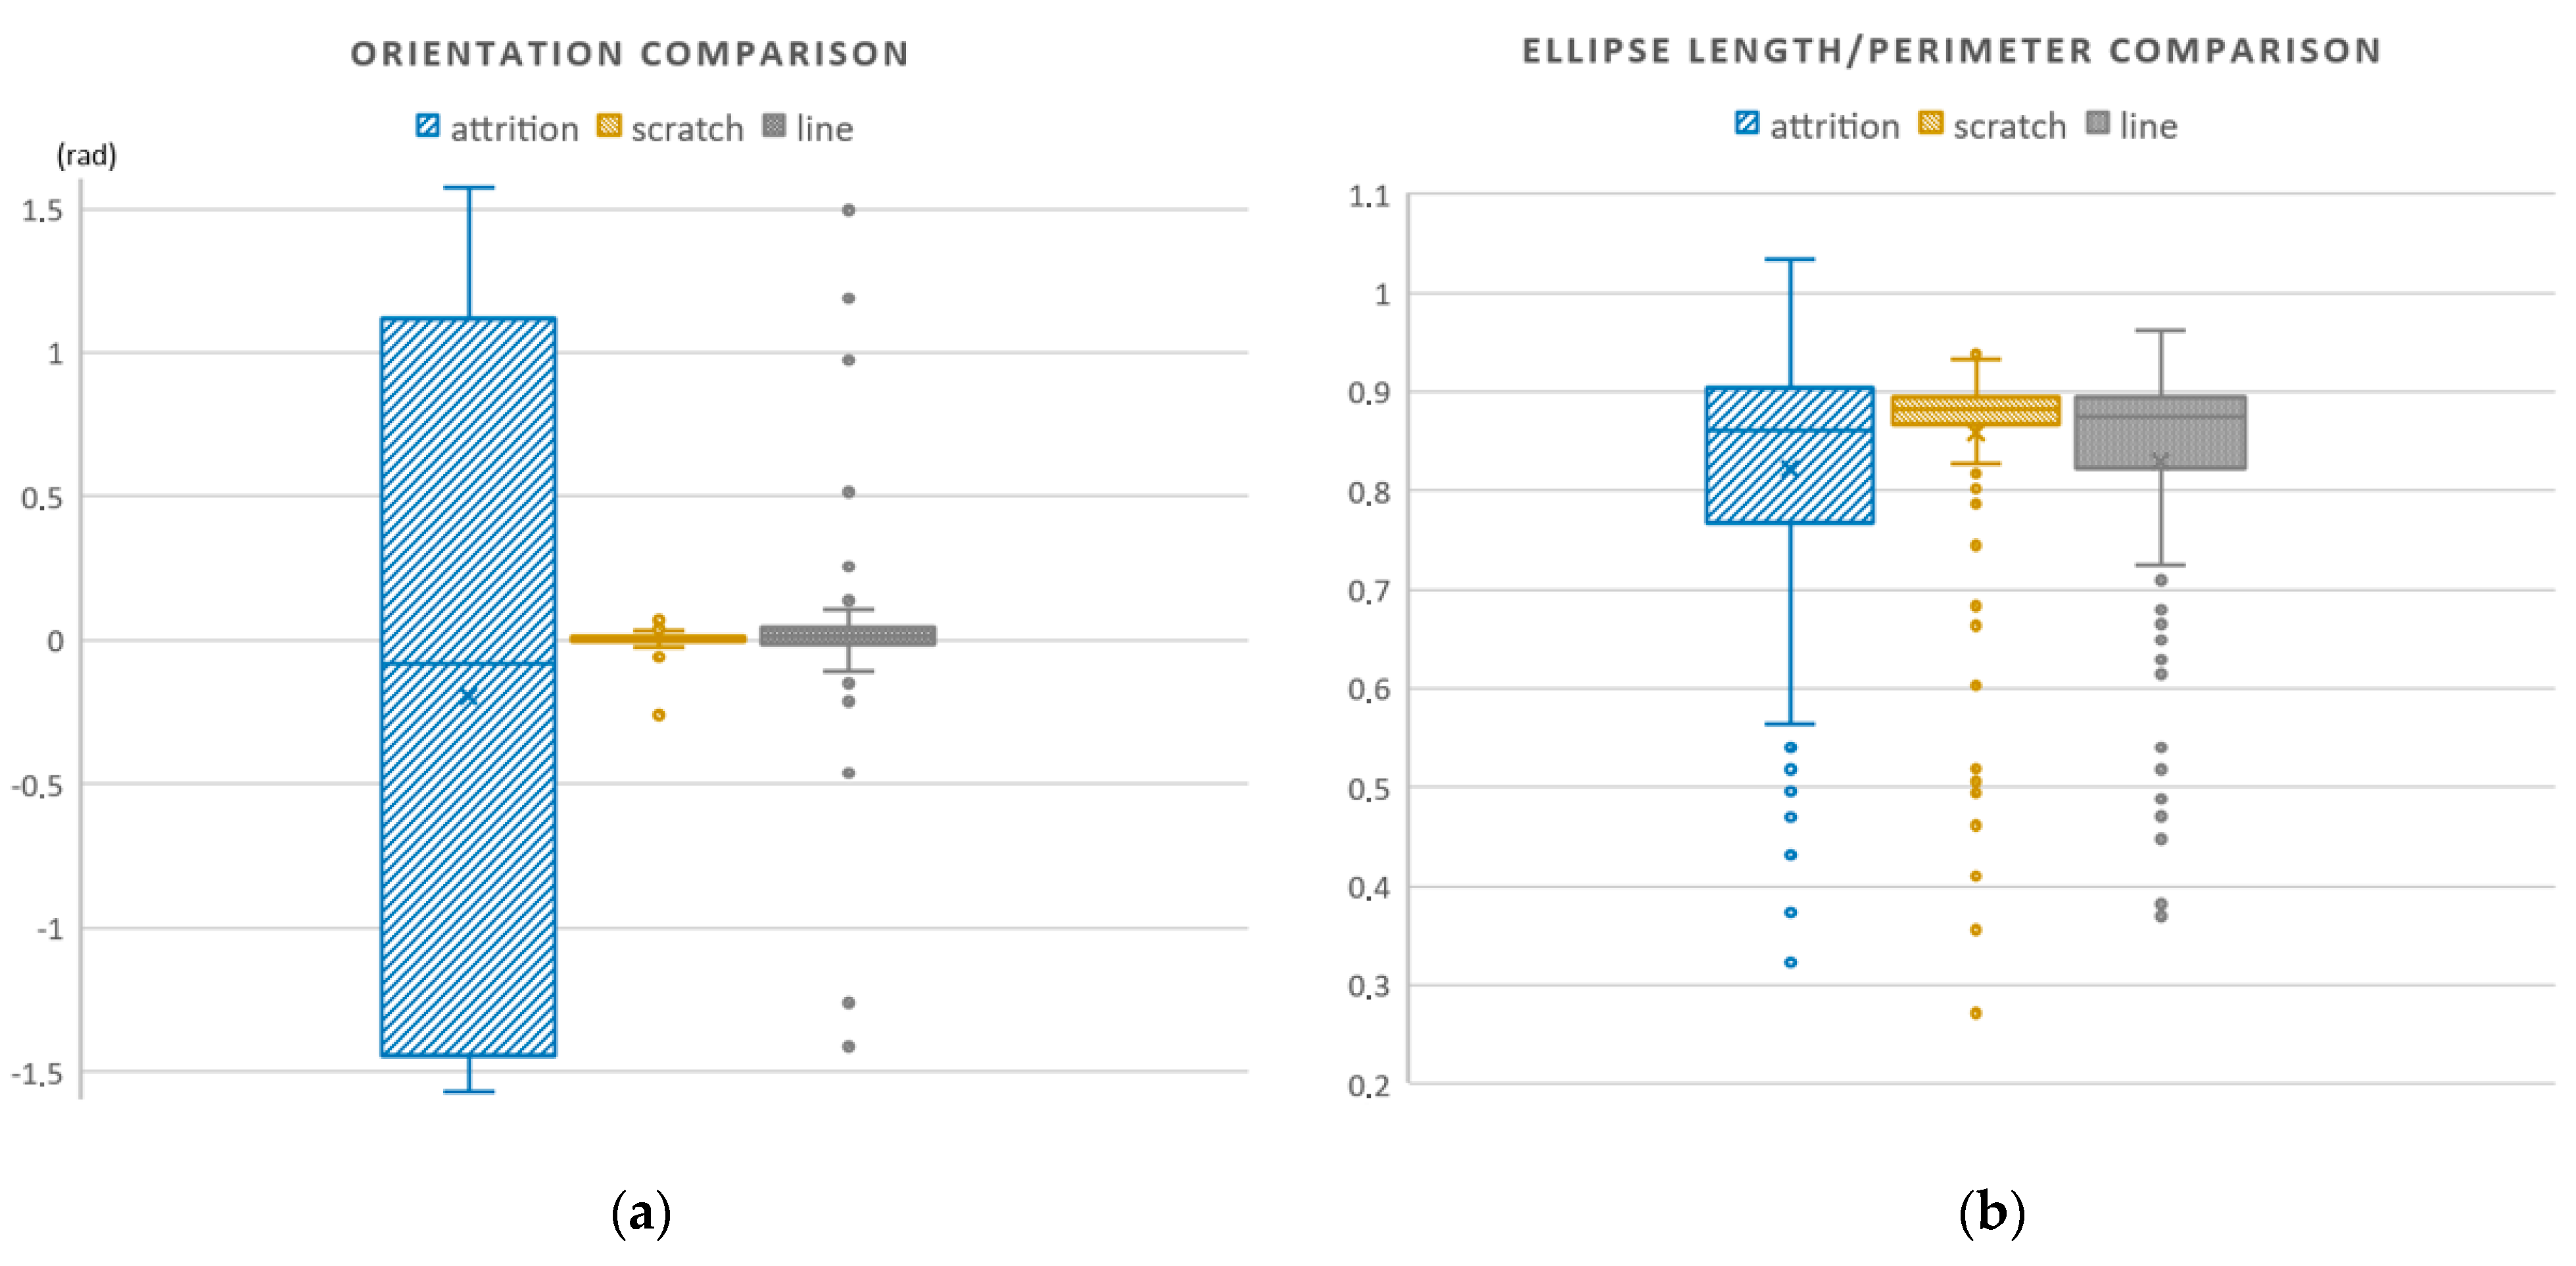
The angle (in radians) that forms the main axis of the defect ellipse in the strip rolling direction (Orientation);
Defect ellipse length versus defect perimeter ratio (El_len/Per);
The minor axis versus the major axis of the defect ellipse ratio (Min_A/Maj_A).
The El_len/Per parameter was found to be insensitive to the defect type and unsuitable for differentiation of defects by subtypes.
The importance of a subset of attributes was assessed via data preprocessing using the “Attribute Selection” function of the Weka package, taking into account the individual predictability of each attribute. Among the attribute evaluators proposed by Weka, algorithms based on measuring the gain of attribute information concerning the class, both absolute and relative (InfoGainAttributeEval and GainRatioAttributeEval, respectively), were used. When the Attribute Selection function was applied to the dataset, attributes such as “Eccentricity”, “Orientation”, “Min_A/Maj_A”, and “Major_Axis_Length” were returned as relevant features. All five attributes listed in Table 4 were used for the comparative analysis of the classifiers.

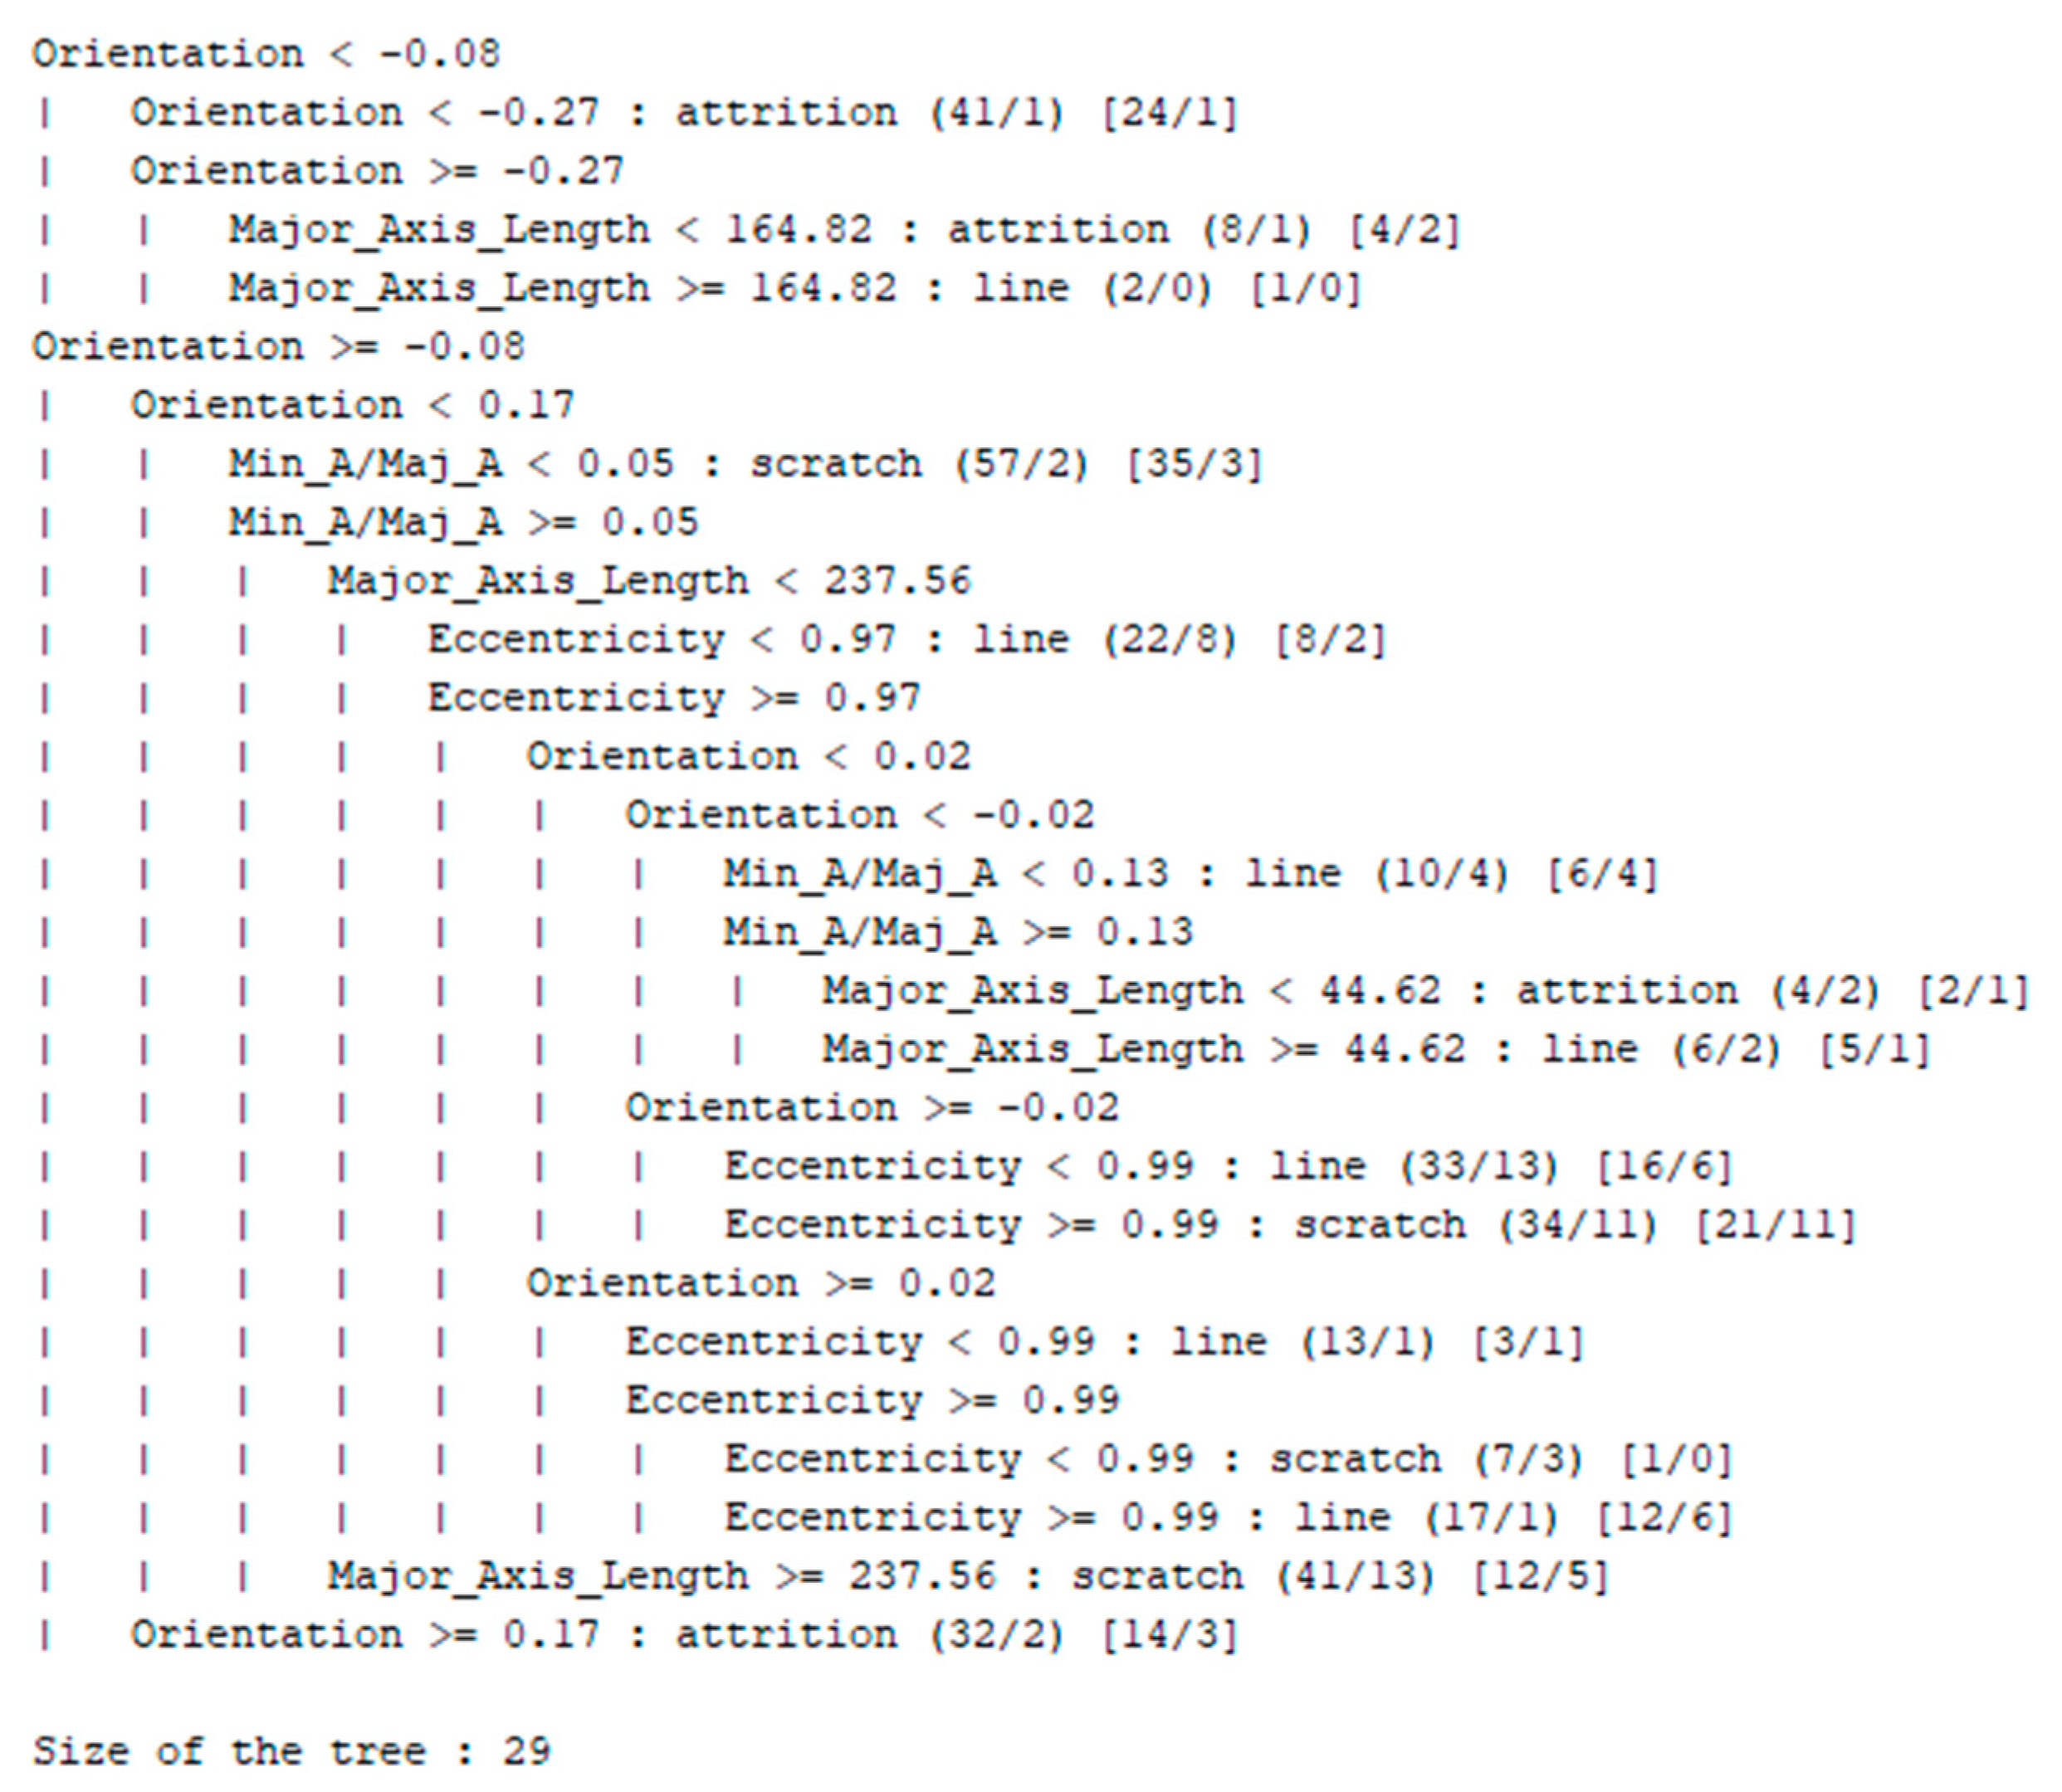
6.1. Selection of Classifiers

Decision tree methods were selected for classification. Building decision trees for classification is one of the most popular methods for solving classification and prediction problems. In its simplest form, the classification tree is a set of “if-then” rules in a hierarchical, consistent structure. Algorithms suitable for the multiclass classification of quantitative data were used from the classifier library (Table 5). The operation of most of the algorithms was based on the calculation of entropy and gain of information for class variables. Entropy-based classifiers such as J48, REPTree, and LMT, as well as the random forest random tree algorithm, were selected for further study. These classifiers showed better quality (a higher percentage of correct answers) at the stage of algorithm selection using the Experimenter interface. A 10-fold cross validation was used for quality assessment. All settings and values of the algorithm hyperparameters were accepted by default.

6.2. Classification Results

The distributions of attribute values into three subclasses of defects are shown in Figure 7.
As can be seen, this approach provided for the analysis of morphological objects of different complexity. It should be noted that the quantitative assessment of the morphological features confirmed the reliability of the results, their high reproducibility, and a sufficient technical compliance. Figure 7 shows the distribution histograms of the attribute values for the classification of rolled strip defects into the “attritions”, “scratches”, and “lines” subclasses (attritions—161, scratches—213, and lines—171).
The statistical characteristics of the attribute distributions (minima, maxima, average values, and standard deviations) are shown in Table 5.
A comparison of the quality of models obtained using different classifiers is presented in the Table 6. Stratified 10-fold cross validation was used to validate the models.
The REPTree approach was used, which uses the logic of a regression tree in different iterations. Typically, this approach forms several trees in different iterations and selects the optimal tree based on the values of the root mean square error of the predictions made by the tree. Analysis of the regression tree pseudo-code showed that in decision-making, the algorithm uses the orientation and major_axis_length parameters first (see Appendix A).
The average percentage of correctly classified defects for all models was 69–74%. Kappa statistics were used not only to evaluate a single classifier but also to compare classifiers with each other. Kappa statistics values in the range of 0.4–0.7 were considered good, according to Fleiss [35]. According to all the quality indicators, random forest ranked first among the selected classifiers based on decision trees. The confusion matrix of the model built using random forest is shown in Figure 8.

7. Conclusions

A technique for detecting and analyzing steel surface defects of the type “lines, attritions, scratches” was proposed, and neural networks were used to detect surface defects on images and to obtain a quantitative description of their geometry. The proposed technique consisted of input-image segmenting using a UNet-based CNN (with a Dice coefficient metric equal to 91.2%), then selecting regions for each separated fragment of damage and calculating a set of quantitative parameters: orientation, area, perimeter, eccentricity, and maximum and minimum axis length. Next, the found parameters were analyzed using statical methods and machine learning methods. The built-in hierarchical classifiers of the Weka package for data mining were used to automatically differentiate defects by geometric characteristics. This made it possible to obtain important information about the types of damage and even to identify their subclasses.
Based on formalizing the defect geometry and describing its features, a set of geometric parameters was selected, making it possible to describe the defect’s properties. The orientation and axis lengths of the “equivalent ellipse” were found to be the most important parameters that can be used to describe the defects of different subclasses. The ranges of parameter values that are characteristic of different defect subclasses were analyzed. The findings indicated that subclasses such as “scratch” and “line” could be most clearly distinguished by the selected numerical parameters. Defects of the “attrition” subclass were characterized by a significant variation in their parameters. Using fast algorithms of machine learning, many classifiers were constructed that attributed previously revealed defects to one of the three subclasses: “scratch”, “attrition”, or “line”, based on the chosen parameters. The best result was achieved using the random forest algorithm. The accuracy of this classifier was 74.0% for the different defect subclasses.
Defects of different subclasses occur under the influence of different technological conditions (damaged surface or roller, sheet sliding on the roller or other sheet, unforeseen mechanical interaction between the sheet and other equipment, etc.). The availability of information about the defects of different subclasses allows the technological factors that have the most significant impact on the quality of the final product to be identified.

Author Contributions

The research was conceptualized by I.K., P.M. and H.K.; the experiments were conducted by I.K. and P.M.; the simulations were performed by H.K. and J.B. (Janette Brezinová); the results were analyzed and discussed by I.K., P.M., H.K. and J.B. (Jakub Brezina). The manuscript was written and reviewed by I.K., P.M., H.K., J.B. (Jakub Brezina), and A.G. All authors have read and agreed to the published version of the manuscript.

Funding

This research was funded by the Scientific Grant Agency, “Application of progressive technologies in restoration of functional surfaces of products” (1/0497/20), the Cultural and Educational Grant Agency, “Modernization of teaching in the field of technologies for joining construction materials” (001STU-4/2019), and the Slovak Research and Development Agency, “Innovative approaches to the restoration of functional surfaces by laser weld overlaying” (APVV-20-0303).

Institutional Review Board Statement

Not applicable.

Informed Consent Statement

Not applicable.

Data Availability Statement

The data presented in this study are available upon request from the corresponding author.

Acknowledgments

The research described in this paper was financially supported by the Scientific Grant Agency, “Application of progressive technologies in restoration of functional surfaces of products” (1/0497/20) and the Cultural and Educational Grant Agency, “Modernization of teaching in the field of technologies for joining construction materials” (001STU-4/2019). This support is highly appreciated by the authors.

Conflicts of Interest

The authors declare no conflict of interest.

Appendix A

Figure A1. The pseudo-code showing the classification tree obtained by the REPTree algorithm.
Metals 11 01851 g0a1

References

  1. Mazur, V.L.; Timoshenko, V.I.; Prikhod’ko, I.Y. Stability loss and defects in coils cold-rolled strip. Steel Transl. 2019, 49, 58–65. [Google Scholar] [CrossRef]
  2. Mazur, I.P. Monitoring the surface quality in sheet rolling. Steel Transl. 2011, 41, 326. [Google Scholar] [CrossRef]
  3. Hao, R.; Lu, B.; Cheng, Y.; Li, X.; Huang, B. A steel surface defect inspection approach towards smart industrial monitoring. J. Intell. Manuf. 2020, 32, 1833–1843. [Google Scholar] [CrossRef]
  4. Wang, S.; Xia, X.; Ye, L.; Yang, B. Automatic detection and classification of steel surface defect using deep convolutional neural networks. Metals 2021, 11, 388. [Google Scholar] [CrossRef]
  5. Neven, R.; Goedemé, T. A multi-branch U-Net for steel surface defect type and severity segmentation. Metals 2021, 11, 870. [Google Scholar] [CrossRef]
  6. Feng, X.; Gao, X.; Luo, L. X-SDD: A new benchmark for hot rolled steel strip surface defects detection. Symmetry 2021, 13, 706. [Google Scholar] [CrossRef]
  7. Zhao, W.; Chen, F.; Huang, H.; Li, D.; Cheng, W. A new steel defect detection algorithm based on deep learning. Comput. Intell. Neurosci. 2021, 2021, 5592878. [Google Scholar] [CrossRef]
  8. Jiang, X.; Hao, Y.; Xu, G. Equivalent circular defect model of real defect outlines in the IC manufacturing process. IEEE Trans. Semicond. Manuf. 1998, 11, 432–441. [Google Scholar] [CrossRef] [Green Version]
  9. Hess, C.; Stroele, A.P. Modeling of real defect outlines and parameter extraction using a checkerboard test structure to localize defects. IEEE Trans. Semicond. Manuf. 1994, 7, 284–292. [Google Scholar] [CrossRef]
  10. Borghese, N.A.; Fomasi, M. Automatic defect classification on a production line. Intell. Ind. Syst. 2015, 1, 373–393. [Google Scholar] [CrossRef]
  11. Psuj, G. Utilization of multisensor data fusion for magnetic nondestructive evaluation of defects in steel elements under Various operation strategies. Sensors 2018, 18, 2091. [Google Scholar] [CrossRef] [Green Version]
  12. Detecting Scratch on Image with Much Noise. Available online: https://stackoverflow.com/questions/33227202/detecting-scratch-on-image-with-much-noise (accessed on 12 November 2021).
  13. Becker, D.; Bierwirth, J.; Brachthäuser, N.; Döpper, R.; Thülig, T. Zero-Defect-Strategy in the Cold Rolling Industry. Possibilities and Limitations of Defect Avoidance and Defect Detection in the Production of Cold-Rolled Steel Strip; Fachvereinigung Kaltwalzwerke e.V., CIELFFA: Düsseldorf, Germany, 2019; p. 16. [Google Scholar]
  14. Brezinová, J.; Vináš, J.; Maruschak, P.; Guzanová, A.; Draganovská, D.; Vrabel’, M. Sustainable Renovation within Metallurgical Production; RAM-Verlag: Lüdenscheid, Germany, 2017; p. 215. [Google Scholar]
  15. Kaggle Severstal: Steel Defect Detection. Can. You Detect. and Classify Defects in Steel? 2019. Available online: https://www.kaggle.com/c/severstal-steel-defect-detection (accessed on 4 October 2021).
  16. Ronneberger, O.; Fischer, P.; Brox, T. U-Net: Convolutional networks for biomedical image segmentation. arXiv 2015, arXiv:1505.04597v1. [Google Scholar]
  17. Long, J.; Shelhamer, E.; Darrell, T. Fully convolutional networks for semantic segmentation. arXiv 2014, arXiv:1411.4038. [Google Scholar]
  18. Tran, S.-T.; Cheng, C.-H.; Nguyen, T.-T.; Le, M.-H.; Liu, D.-G. TMD-Unet: Triple-Unet with multi-scale input features and dense skip connection for medical image segmentation. Healthcare 2021, 9, 54. [Google Scholar] [CrossRef]
  19. Hou, Y.; Liu, Z.; Zhang, T.; Li, Y. C-UNet: Complement UNet for remote sensing road extraction. Sensors 2021, 21, 2153. [Google Scholar] [CrossRef]
  20. Jiao, L.; Huo, L.; Hu, C.; Tang, P. Refined UNet: UNet-based refinement network for cloud and shadow precise segmentation. Remote Sens. 2020, 12, 2001. [Google Scholar] [CrossRef]
  21. Jing, J.; Wang, Z.; Rätsch, M.; Zhang, H. Mobile-Unet: An efficient convolutional neural network for fabric defect detection. Text. Res. J. 2020, 21, 1427–1435. [Google Scholar] [CrossRef]
  22. Ioffe, S.; Szegedy, C. Batch normalization: Accelerating deep network training by reducing internal covariate shift. arXiv 2015, arXiv:1502.03167v3. [Google Scholar]
  23. Konovalenko, I.; Maruschak, P.; Brezinová, J.; Viňáš, J.; Brezina, J. Steel surface defect classification using deep residual neural network. Metals 2020, 10, 846. [Google Scholar] [CrossRef]
  24. Qian, K. Automated detection of steel defects via machine learning based on real-time semantic segmentation. In Proceedings of the 3rd International Conference on Video and Image Processing (ICVIP 2019), Shanghai, China, 20–23 December 2019; Association for Computing Machinery: New York, NY, USA, 2019; pp. 42–46. [Google Scholar] [CrossRef]
  25. Yu, H.; Li, X.; Song, K.; Shang, E.; Liu, H.; Yan, Y. Adaptive depth and receptive field selection network for defect semantic segmentation on castings X-rays. NDT E Int. 2020, 116, 102345. [Google Scholar] [CrossRef]
  26. Zhu, Y.; Yang, R.; He, Y.; Ma, J.; Guo, H.; Yang, Y.; Zhang, L. A Lightweight Multiscale Attention Semantic Segmentation Algorithm for Detecting Laser Welding Defects on Safety Vent of Power Battery. IEEE Access 2021, 9, 39245–39254. [Google Scholar] [CrossRef]
  27. Aslam, Y.; Santhi, N.; Ramasamy, N.; Ramar, K. Localization and segmentation of metal cracks using deep learning. J. Ambient. Intell. Humaniz. Comput. 2021, 12, 4205–4213. [Google Scholar] [CrossRef]
  28. Kim, H.; Lee, S.; Han, S. Railroad Surface Defect Segmentation Using a Modified Fully Convolutional Network. KSII Trans. Internet Inf. Syst. 2020, 14, 12. [Google Scholar]
  29. Allan, G.A.; Walton, A.J. Efficient critical area estimation for arbitrary defect shapes. In Proceedings of the 1997 IEEE International Symposium on Defect and Fault Tolerance in VLSI Systems, Paris, France, 20–22 October 1997; pp. 20–28. [Google Scholar] [CrossRef]
  30. Talapatra, S.N.; Chaudhuri, R.; Ghosh, S. Cell Profiler and WEKA tools: Image Analysis for fish erythrocytes shape and machine learning model algorithm accuracy prediction of dataset. World Sci. News 2021, 154, 101–116. [Google Scholar]
  31. Penumuru, D.P.; Muthuswamy, S.; Karumbu, P. Identification and classification of materials using machine vision and machine learning in the context of industry 4.0. J. Intell. Manuf. 2020, 31, 1229–1241. [Google Scholar] [CrossRef]
  32. Konovalenko, I.; Maruschak, P.; Brevus, V.; Prentkovskis, O. Recognition of scratches and abrasions on metal surfaces using a classifier based on a convolutional neural network. Metals 2021, 11, 549. [Google Scholar] [CrossRef]
  33. Konovalenko, I.; Maruschak, P.; Brevus, V. Steel surface defect detection using an ensemble of deep residual neural networks. J. Comput. Inf. Sci. Eng. 2022, 22, 014501. [Google Scholar] [CrossRef]
  34. Konovalenko, I.; Hutsaylyuk, V.; Maruschak, P. Classification of surface defects of rolled metal using deep neural network ResNet50. In Proceedings of the 13th International Conference on Intelligent Technologies in Logistics and Mechatronics Systems, Panevezys, Lithuania, 1 October 2020; pp. 41–48. [Google Scholar]
  35. Fleiss, J.L. Statistical Methods for Rates and Proportions, 2nd ed.; John Wiley: New York, NY, USA, 1981; p. 336. [Google Scholar]
Figure 1. Examples of images with defects of three subclasses: scratch (a), line (b), and attrition (c).
Metals 11 01851 g001
Figure 2. Flowchart of the proposed method of surface defect investigation.
Metals 11 01851 g002
Figure 3. General architecture of neural network model for segmentation.
Metals 11 01851 g003
Figure 4. Test images (a) and damage recognition results (b).
Metals 11 01851 g004
Figure 5. Illustration of the calculation of metrics.
Metals 11 01851 g005
Figure 6. Box diagrams of defect types for the sample of images analyzed.
Metals 11 01851 g006aMetals 11 01851 g006b
Figure 7. Histograms of the distributions of attribute values for the classification of defects of rolled strips into subclasses “abrasions”, “scratches”, “lines” (attritions—161, scratches—213, lines—171) (obtained by Weka).
Metals 11 01851 g007aMetals 11 01851 g007b
Figure 8. Confusion matrix of the model built using random forest.
Metals 11 01851 g008
Table 1. Results of comparing the developed model with similar models for detecting surface damage.
ModelDSCIoU
Developed model0.9120.894
Kun Qian [24]0.915 and 0.905
Han Yu et al. [25]0.86
Y. Zhu et al. [26]0.847
Aslam, Y. et al. [27]0.917
Hyeonho Kim [28]0.854 and 0.846
Table 2. Parameters for describing the orientation and geometry of defects.
Parameter NameParameter GeometryGeometric Content Description
Orientation Metals 11 01851 i001Defect orientation relative to the strip rolling direction
Area Metals 11 01851 i002Defect area
Perimeter Metals 11 01851 i003Defect perimeter shows the development of its edge
Eccentricity Metals 11 01851 i004Eccentricity shows the degree of “elongation” of the defect shape
Maximum and minimum axes of the defect when describing its ellipse Metals 11 01851 i005
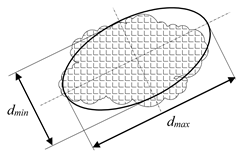
Allows the defect size and shape to be established
Table 3. Morphological features, causes of formation, and morphological description of defects of class “scratch, line, attrition”.
Defect SubclassCauses of FormationThe Scheme of the Analyzed DefectsMorphological Description of Defects Analyzed
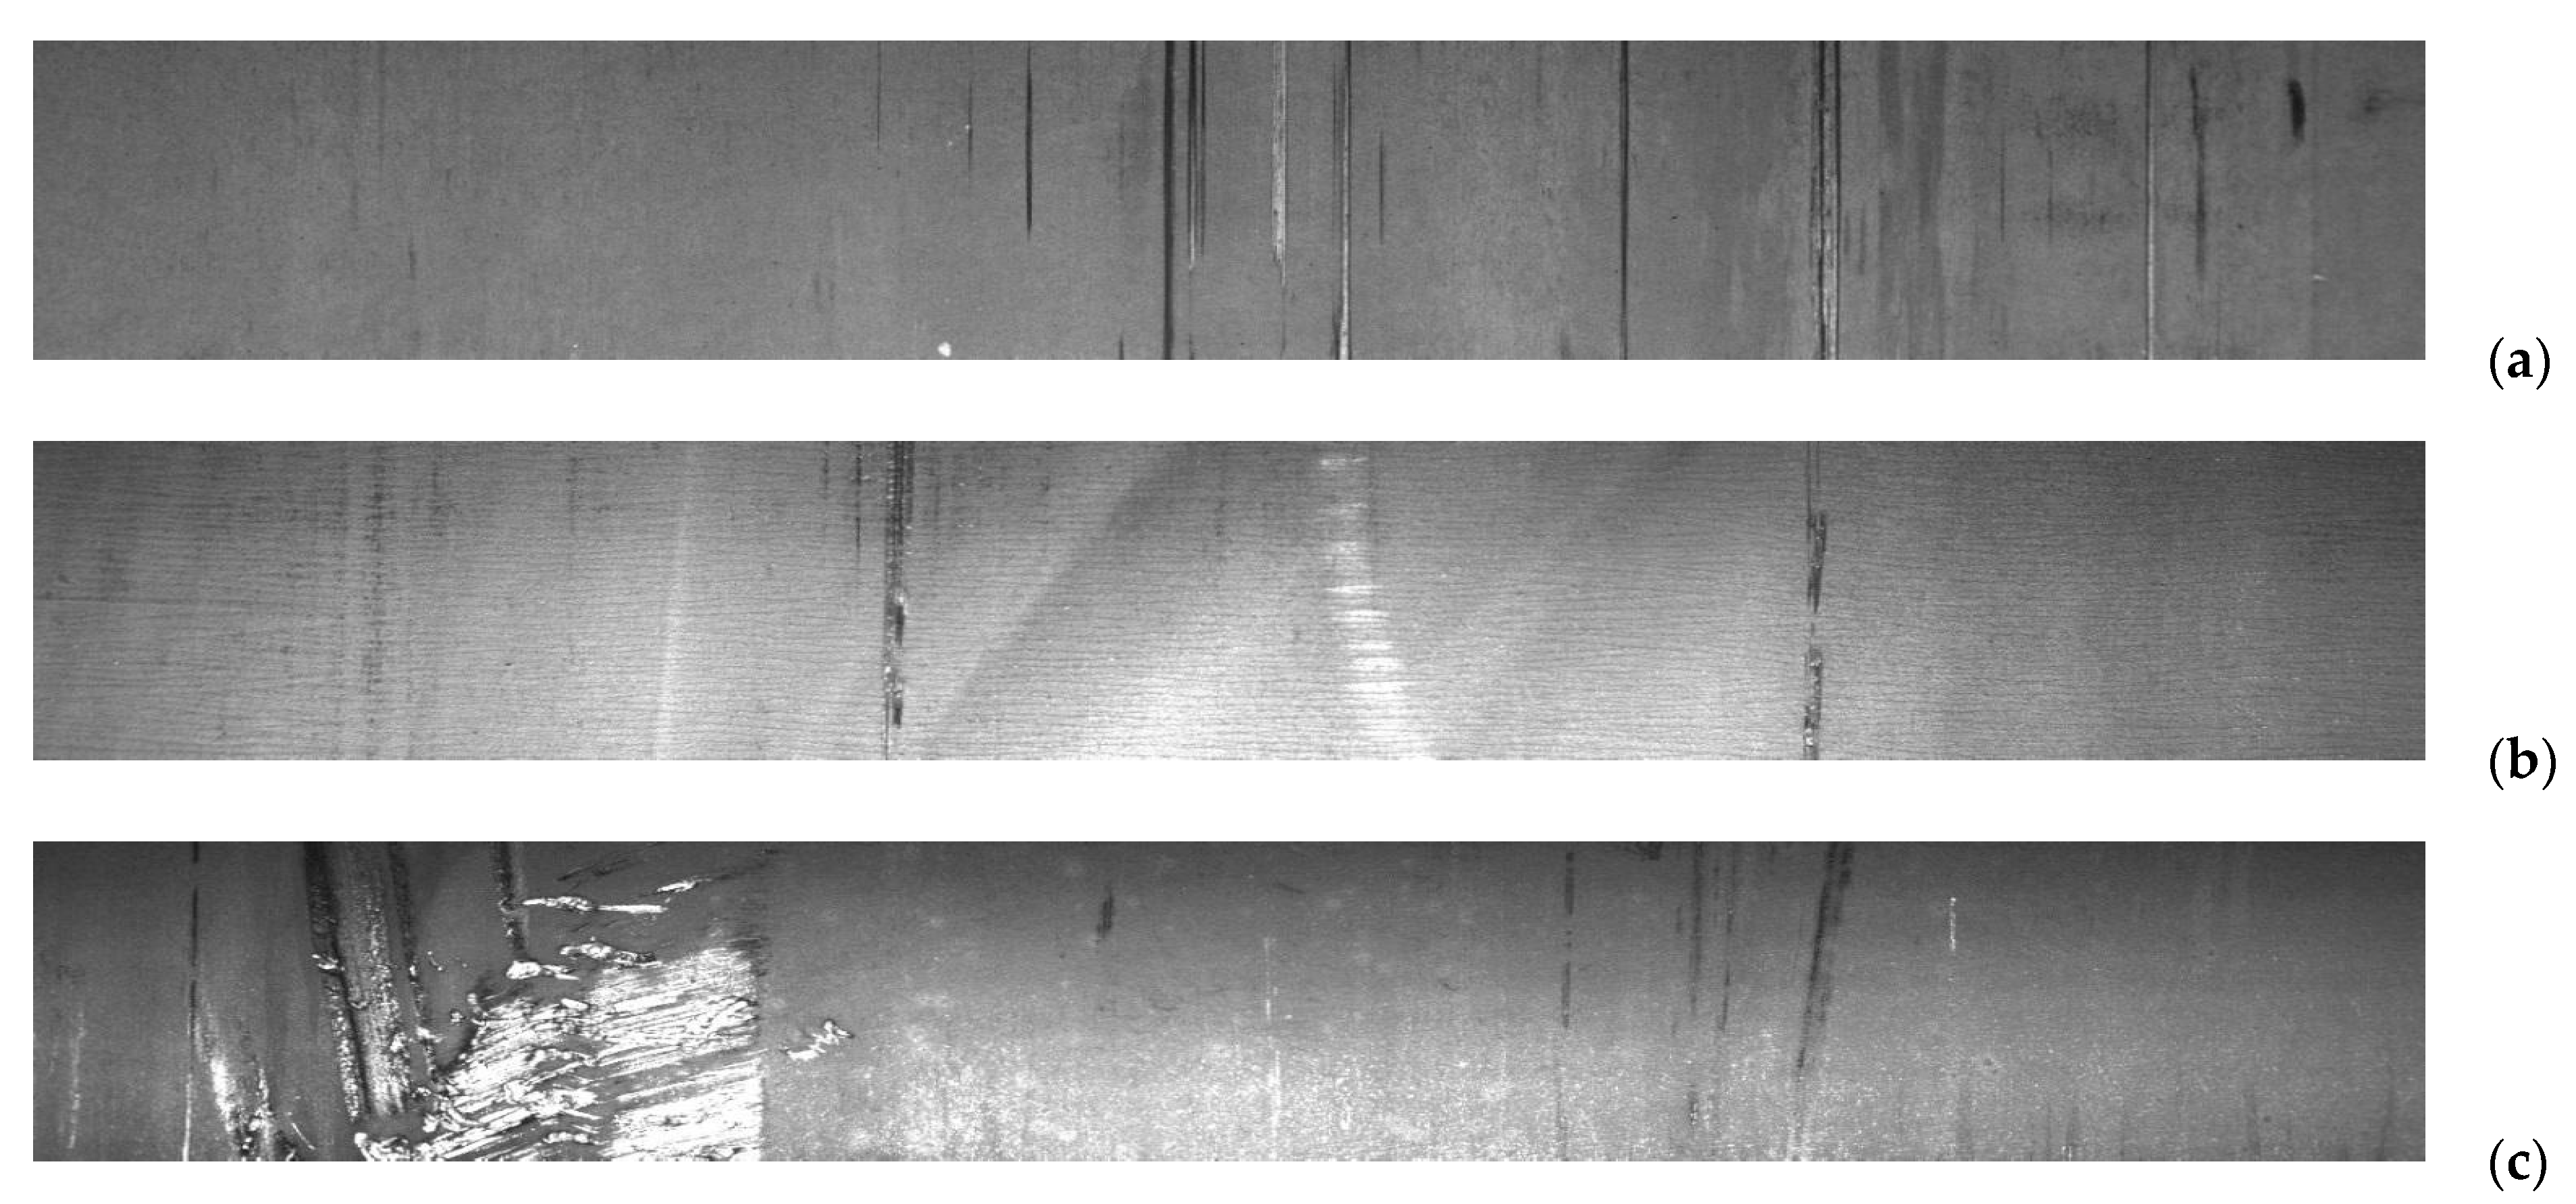
ScratchesJamming and actuation of individual rollers and harnessing Metals 11 01851 i006
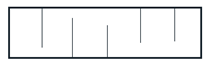
Defects are oriented parallel to the strip movement direction. They have a clear-cut thin thread-like front that runs through the entire image.
LinesAdhesion of metal particles to the roll surface and their sliding on the strip surface Metals 11 01851 i007
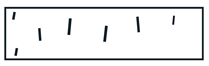
Defects are oriented parallel to the strip movement direction but less clearly than cracks. They have a rough front, the edges of which show “cuts”, and plastically deformed microzones due to scratching of the metal.
AttritionsStrip friction against the drive parts of the process equipment Metals 11 01851 i008Defects of arbitrary orientation. They have a matte surface and a large area. The defect color may be inhomogeneous across its area due to depth differences in different areas.
Table 4. Attributes selected for the analysis of rolled strip defects that belong to “attritions”, “scratches”, “lines” subclasses.
Attribute Selection
AttributeExpert OpinionStatistical MethodsWeka
Eccentricity
Orientation
El_len/Per
Min_A/Maj_A
Major_Axis_Length
Table 5. Statistical parameters of attribute distributions.
Statistical Values of Attributes
AttributeMinimumMaximumMeanSTD
Eccentricity0.4041.0000.9660.077
Major_axis_length13.6211632.084180.683161.164
Orientation−1.5701.570−0.0530.647
El_len/Per0.2711.1560.8380.114
Min_A/Maj_A0.0200.9150.1740.173
Table 6. Data generated by stratified 10-fold cross validation.
Classifiers Models Quality Comparison
AttributeCorrectly Classified InstancesKappa StatisticsMean Absolute Error
J4869.36%0.5330.239
REPTree70.83%0.5580.239
LMT73.21%0.5930.226
Random forest73.95%0.6050.230
Publisher’s Note: MDPI stays neutral with regard to jurisdictional claims in published maps and institutional affiliations.

