Article

Effects of Al and Mo on Microstructure and Hardness of As-Cast TNM TiAl Alloys

1
State Key Laboratory for Advanced Metals and Materials, University of Science and Technology Beijing, Beijing 100083, China
2
Beijing Research Institute of Mechanical and Electrical Technology, Beijing 100083, China
3
School of Materials Science and Engineering, Yangtze Normal University, Chongqing 408100, China
4
College of Materials Science and Engineering, Taiyuan University of Technology, Taiyuan 030024, China
*
Authors to whom correspondence should be addressed.
Metals 2021, 11(11), 1849; https://doi.org/10.3390/met11111849
Submission received: 14 October 2021 / Revised: 12 November 2021 / Accepted: 15 November 2021 / Published: 17 November 2021
(This article belongs to the Special Issue Microstructure and Properties of High Temperature Intermetallic)

Abstract

:
The effects of Al and Mo elements on the microstructure and hardness of TNM TiAl alloys (Ti-43.5Al-4Nb-1Mo-0.1B) were studied by decreasing 0.5 at.% Mo and/or increasing 1.5 at.% Al. The results showed that the changed composition of the alloy had a slight influence on the morphology, but had important effects on the volume fraction, size, and composition of each phase. All the alloys had nearly full lamellar (NL) microstructures, with a few βo phases at the boundaries of the colony or in the lamellar colony. The lamellar colony size and the lamellar spacing increased with the decrease in Mo and the increase in Al. The reduction in Mo content reduced the content of each phase in proportion, but the increase in Al content in the alloys led to the corresponding increase in Al content in the α2 and γ phases. The hardness of the alloys decreased with the increase in Al content and the decrease in Mo content. This is mainly due to the increase in lamellar spacing caused by the change in composition. Therefore, the increased content of Al and decreased Mo content are unbeneficial for the microstructure. The relationship between the Vickers hardness and the lamellar spacing obeyed the Hall–Petch relationship.

1. Introduction

Due to their low density, relatively high specific strength, etc., TiAl-based alloys have been successfully applied as turbocharger wheels in car engines and low-pressure turbine blades in aero engines [1,2]. The conventional γ-TiAl consists of the α2 phase (Ti3Al with DO19 structure), γ phase (TiAl with L10 structure), and βo phase (Ti2AlNb with B2 structure) [3]. They form the following four classical microstructures: full lamellar (FL), nearly full lamellar (NL), duplex (DP), and near γ (NG) microstructures. According to the basic relationship of composition–microstructure–mechanical properties, an FL microstructure with a fine grain size exhibits excellent comprehensive performance [2,4,5,6].
The Al element, as the principal element, is an α-phase stable element with the ability to expand the α-phase region, to a certain extent. However, TiAl alloys with an excess of the Al element have poor mechanical performance, due to rapid grain growth in the single phase region. It has been found that TiAl alloys with a lower Al content have changed the overall properties [7,8,9]. Numerous elements, such as Nb, W, Mo, Zr, Ta, and Cr, or interstitial elements, such as C, B, and N, have been introduced into TiAl alloys in order to obtain useful phases for increasing their service temperature [10,11,12]. The Nb element increases the oxidation resistance, melting point, and high-temperature strength of TiAl alloys. Nb and Mo are β-phase stable elements, leading to the formation of a βo structure at room temperature, which is a ductile phase at high temperature. The TiAl alloys termed TNM, with a nominal composition of Ti-(42–45)Al-(3–5)Nb-(0.1–2)Mo-(0.1–0.2)B (the atomic ratios are all involved in this paper, unless otherwise stated), have been developed and used in PW1100G-JM jet engines (Pratt & Whitney, East Hartford, CT, USA) [13]. Moreover, analysis of the hardness, as one of the conventional properties, is an effective and convenient approach to characterize the relationship between the microstructure and mechanical properties of γ-TiAl alloys. Cui et al. [9] used the nanohardness to evaluate the mechanical properties of TiAl with different β-stabled elements, such as Cr, Nb, and V. Liu et al. [14] reported the microhardness with a load of 10 g and a dwell time of 10 s for the TiAlNb alloy design during directional solidification. Cha et al. studied the effect of the content of C and heat treatment processing on lamellar spacing, and explored the influence on the hardness of the TNM alloy [15]. In general, minor fluctuations in the chemical composition of TiAl alloys must lead to variation in their mechanical properties because of their complicated microstructure and phases. It is of great engineering significance to reveal the influence of minor changes in the main components on the microstructure and properties of the alloy, because this is the premise to optimize the composition of alloys, to control the melting and heat treatment process, and to select the service properties of alloys. However, to date, although much work has focused on the relationship between the microhardness and microstructure of the Ti-43.5Al-4Nb-1Mo-0.1B alloy [16,17,18,19], the other studies related compositions and the corresponding effects of TNM alloys are scarcely explored, motivating the current study.
In this paper, the microstructure of the TNM alloy was tailored by adding a minor content of Al and Mo. The effects of composition variation on the microstructure and hardness were explored. The distribution and variation in elements in different phases, and the sensitivity of the microstructure to microhardness and Vickers hardness, were studied.

2. Materials and Methods

The alloys with four nominal compositions, designated as alloy S1 to S4, listed in Table 1, were studied. Vacuum induction melting with water-cooled cooper crucible was employed to melt and prepare these alloys. The raw materials were Al–Mo alloy (Mo: 60 wt.%), Al–Nb alloy (Nb: 75 wt.%), Al–Ti–B alloy (Ti: 5 wt.%, B: 1 wt.%), pure Ti (99.96 wt.%) and pure Al (99.99 wt.%). These alloys had been remolten at least five times to ensure the compositional homogeneity of ingots. The cast ingots with a diameter of 45 mm and length of 140 mm were prepared by metal mold casting.
Specimens for microstructure observation were taken from the center of the radius in the cross-section and the middle of the length. The specimens were electro-polished after being mechanically grinded by sandpapers of 400#, 800#, 1000# and 1500# and polished with 0.5 μm diamond paste. Microstructural observation was carried out using Zeiss SUPRA 55 scanning electron microscope (SEM, Carl Zeiss AG, Oberkochen, Germany) in backscattered electron (BSE) mode and a Tecnai G2 F30 field emission transmission electron microscope (TEM, Hillsboro, OR, USA). The compositions of different phases in the specimen were measured by energy dispersive spectrometry (EDS). The average of 5 EDS values of each specimen were calculated to eliminate errors. The phase volume fraction was calculated from five phase distribution maps of electron backscattered diffraction (EBSD) analysis. The EBSD dates were achieved by Oxford max2 with 20 kV accelerating voltage, 16.8 mm working distance, 0.1 μm step size, and analyzed by the Channal 5 software of Oxford Instruments. The phases were examined by a D/max-2500/PC X-ray diffractometer (XRD, Rigaku Co., Akishima-shi, Tokyo, Japan) at room temperature. The lamellar spacing was calculated by software of Imagetool from 5 TEM photos of different positions of each specimen. The hardness of the alloys was measured at room temperature by a Vickers hardness tester (THVP-50, Beijing Era United Technology Co., Ltd., Beijing, China) with a load of 5 kg and holding time of 15 s, and a microhardness tester (innovtest-423D, Holland) with a load of 10 g and holding time of 15 s. In order to eliminate the error, 5 and 20 points were selected randomly for Vickers hardness testing and microhardness testing, respectively.

3. Results and Discussion

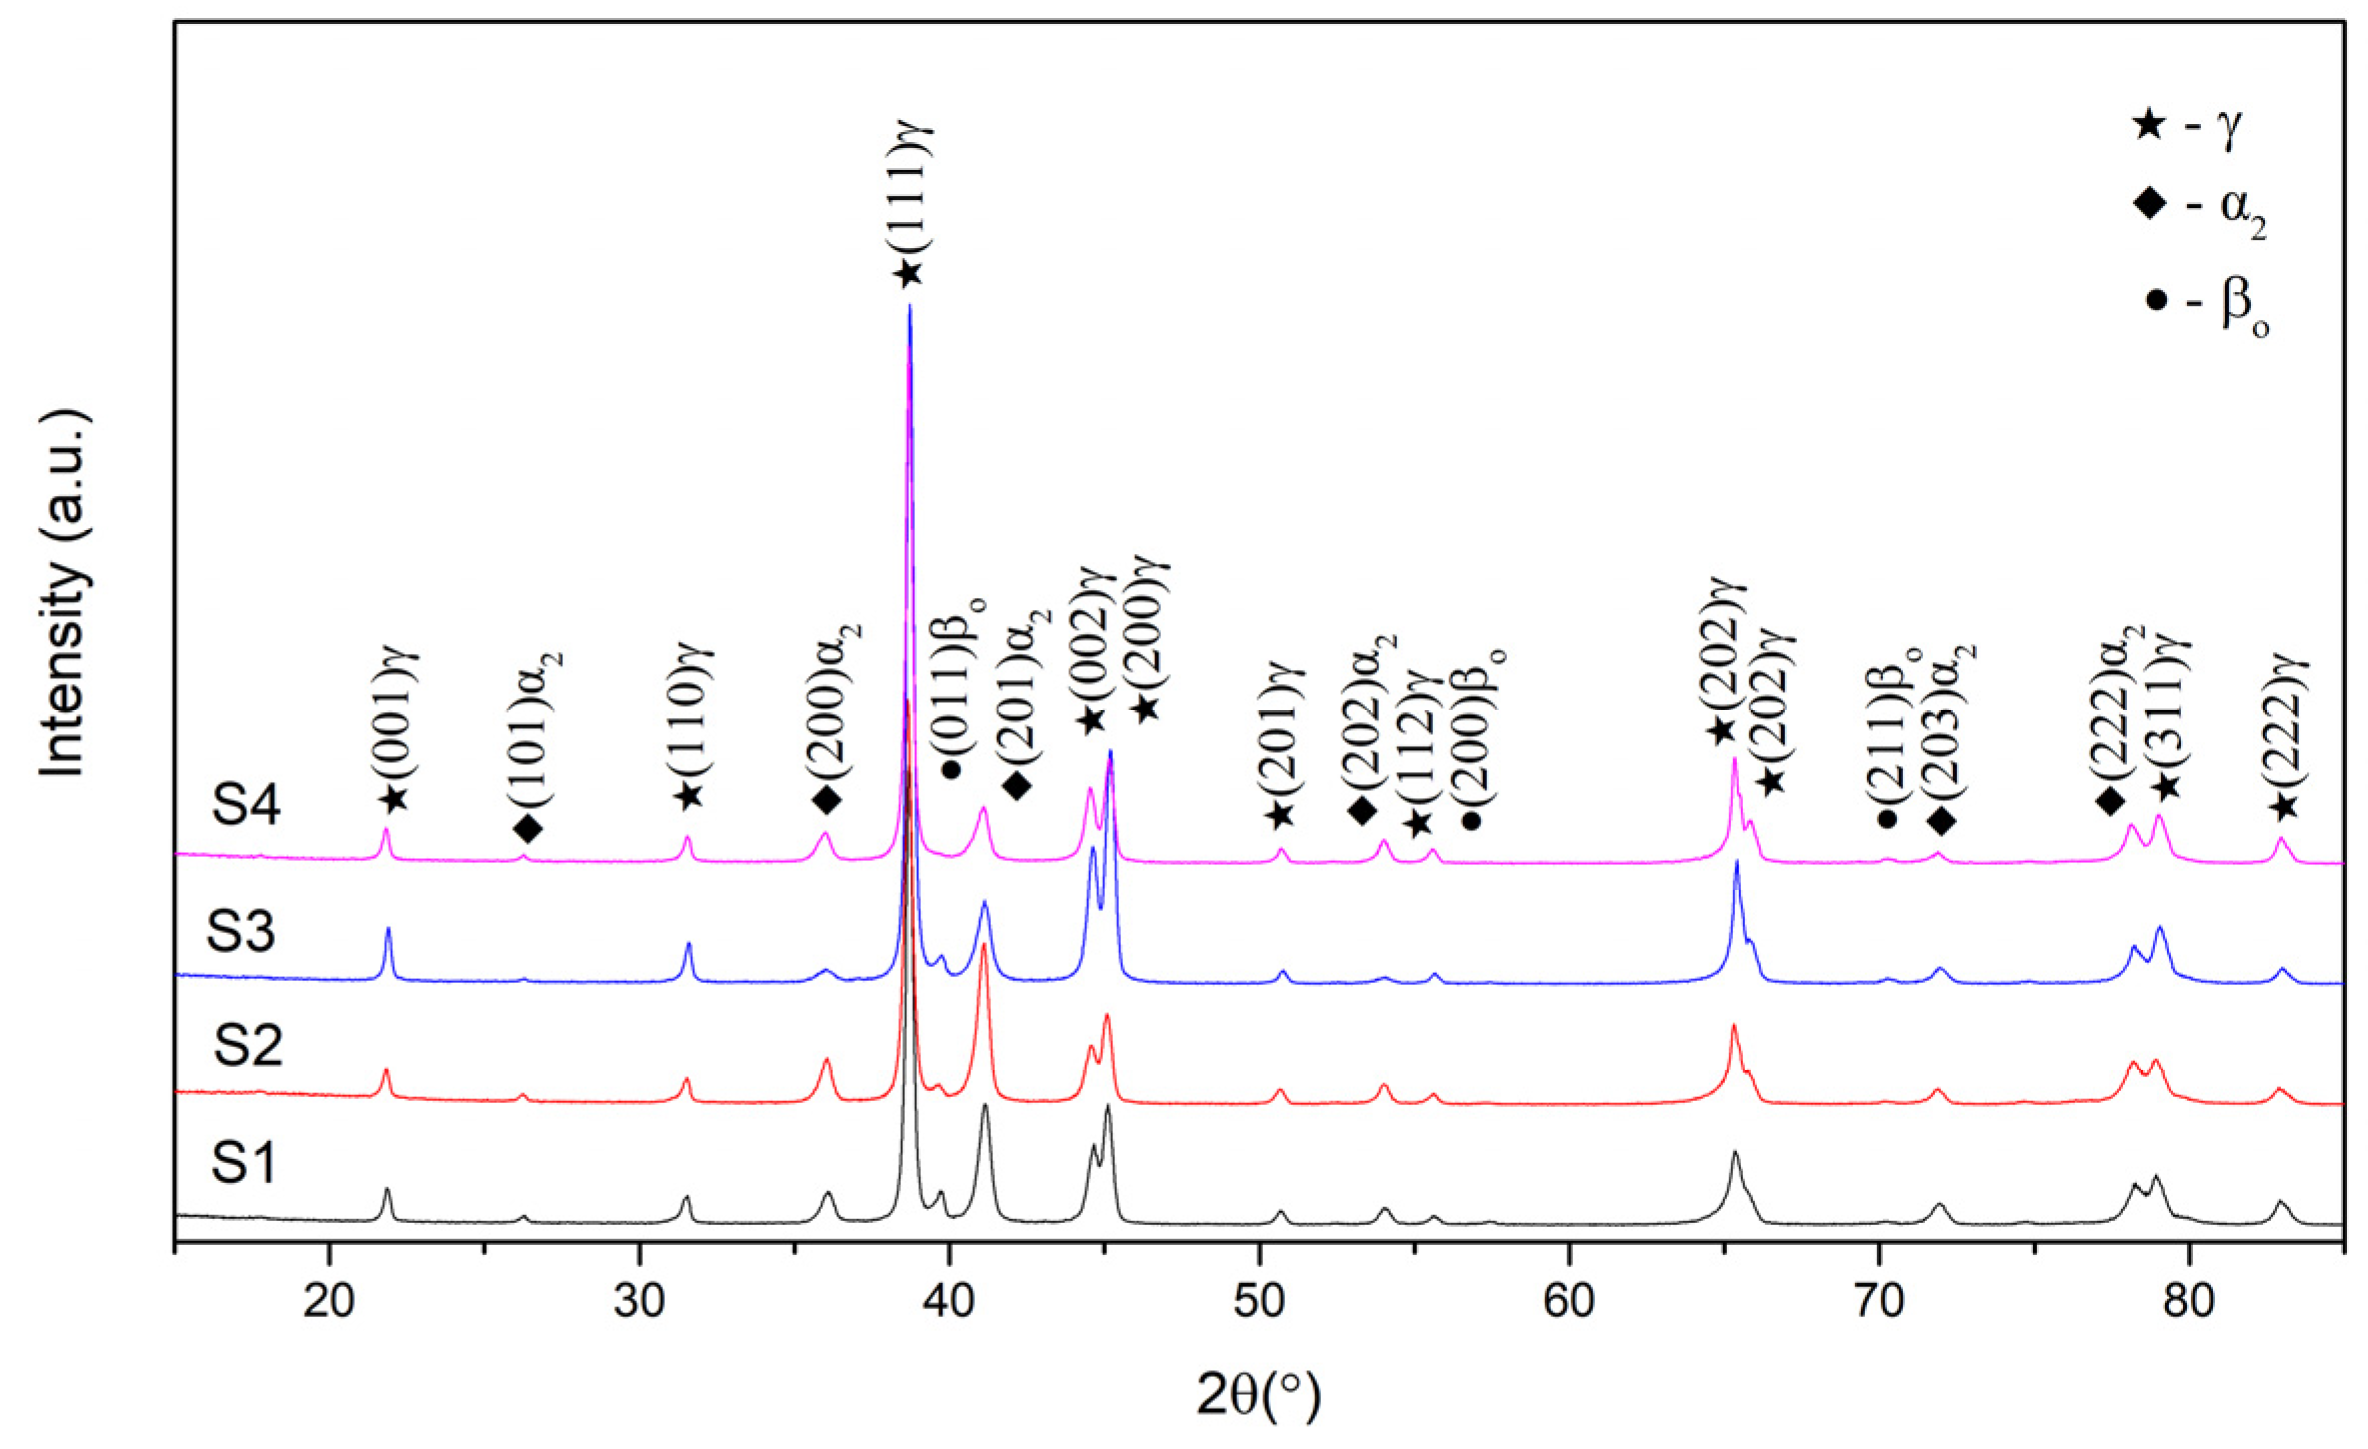
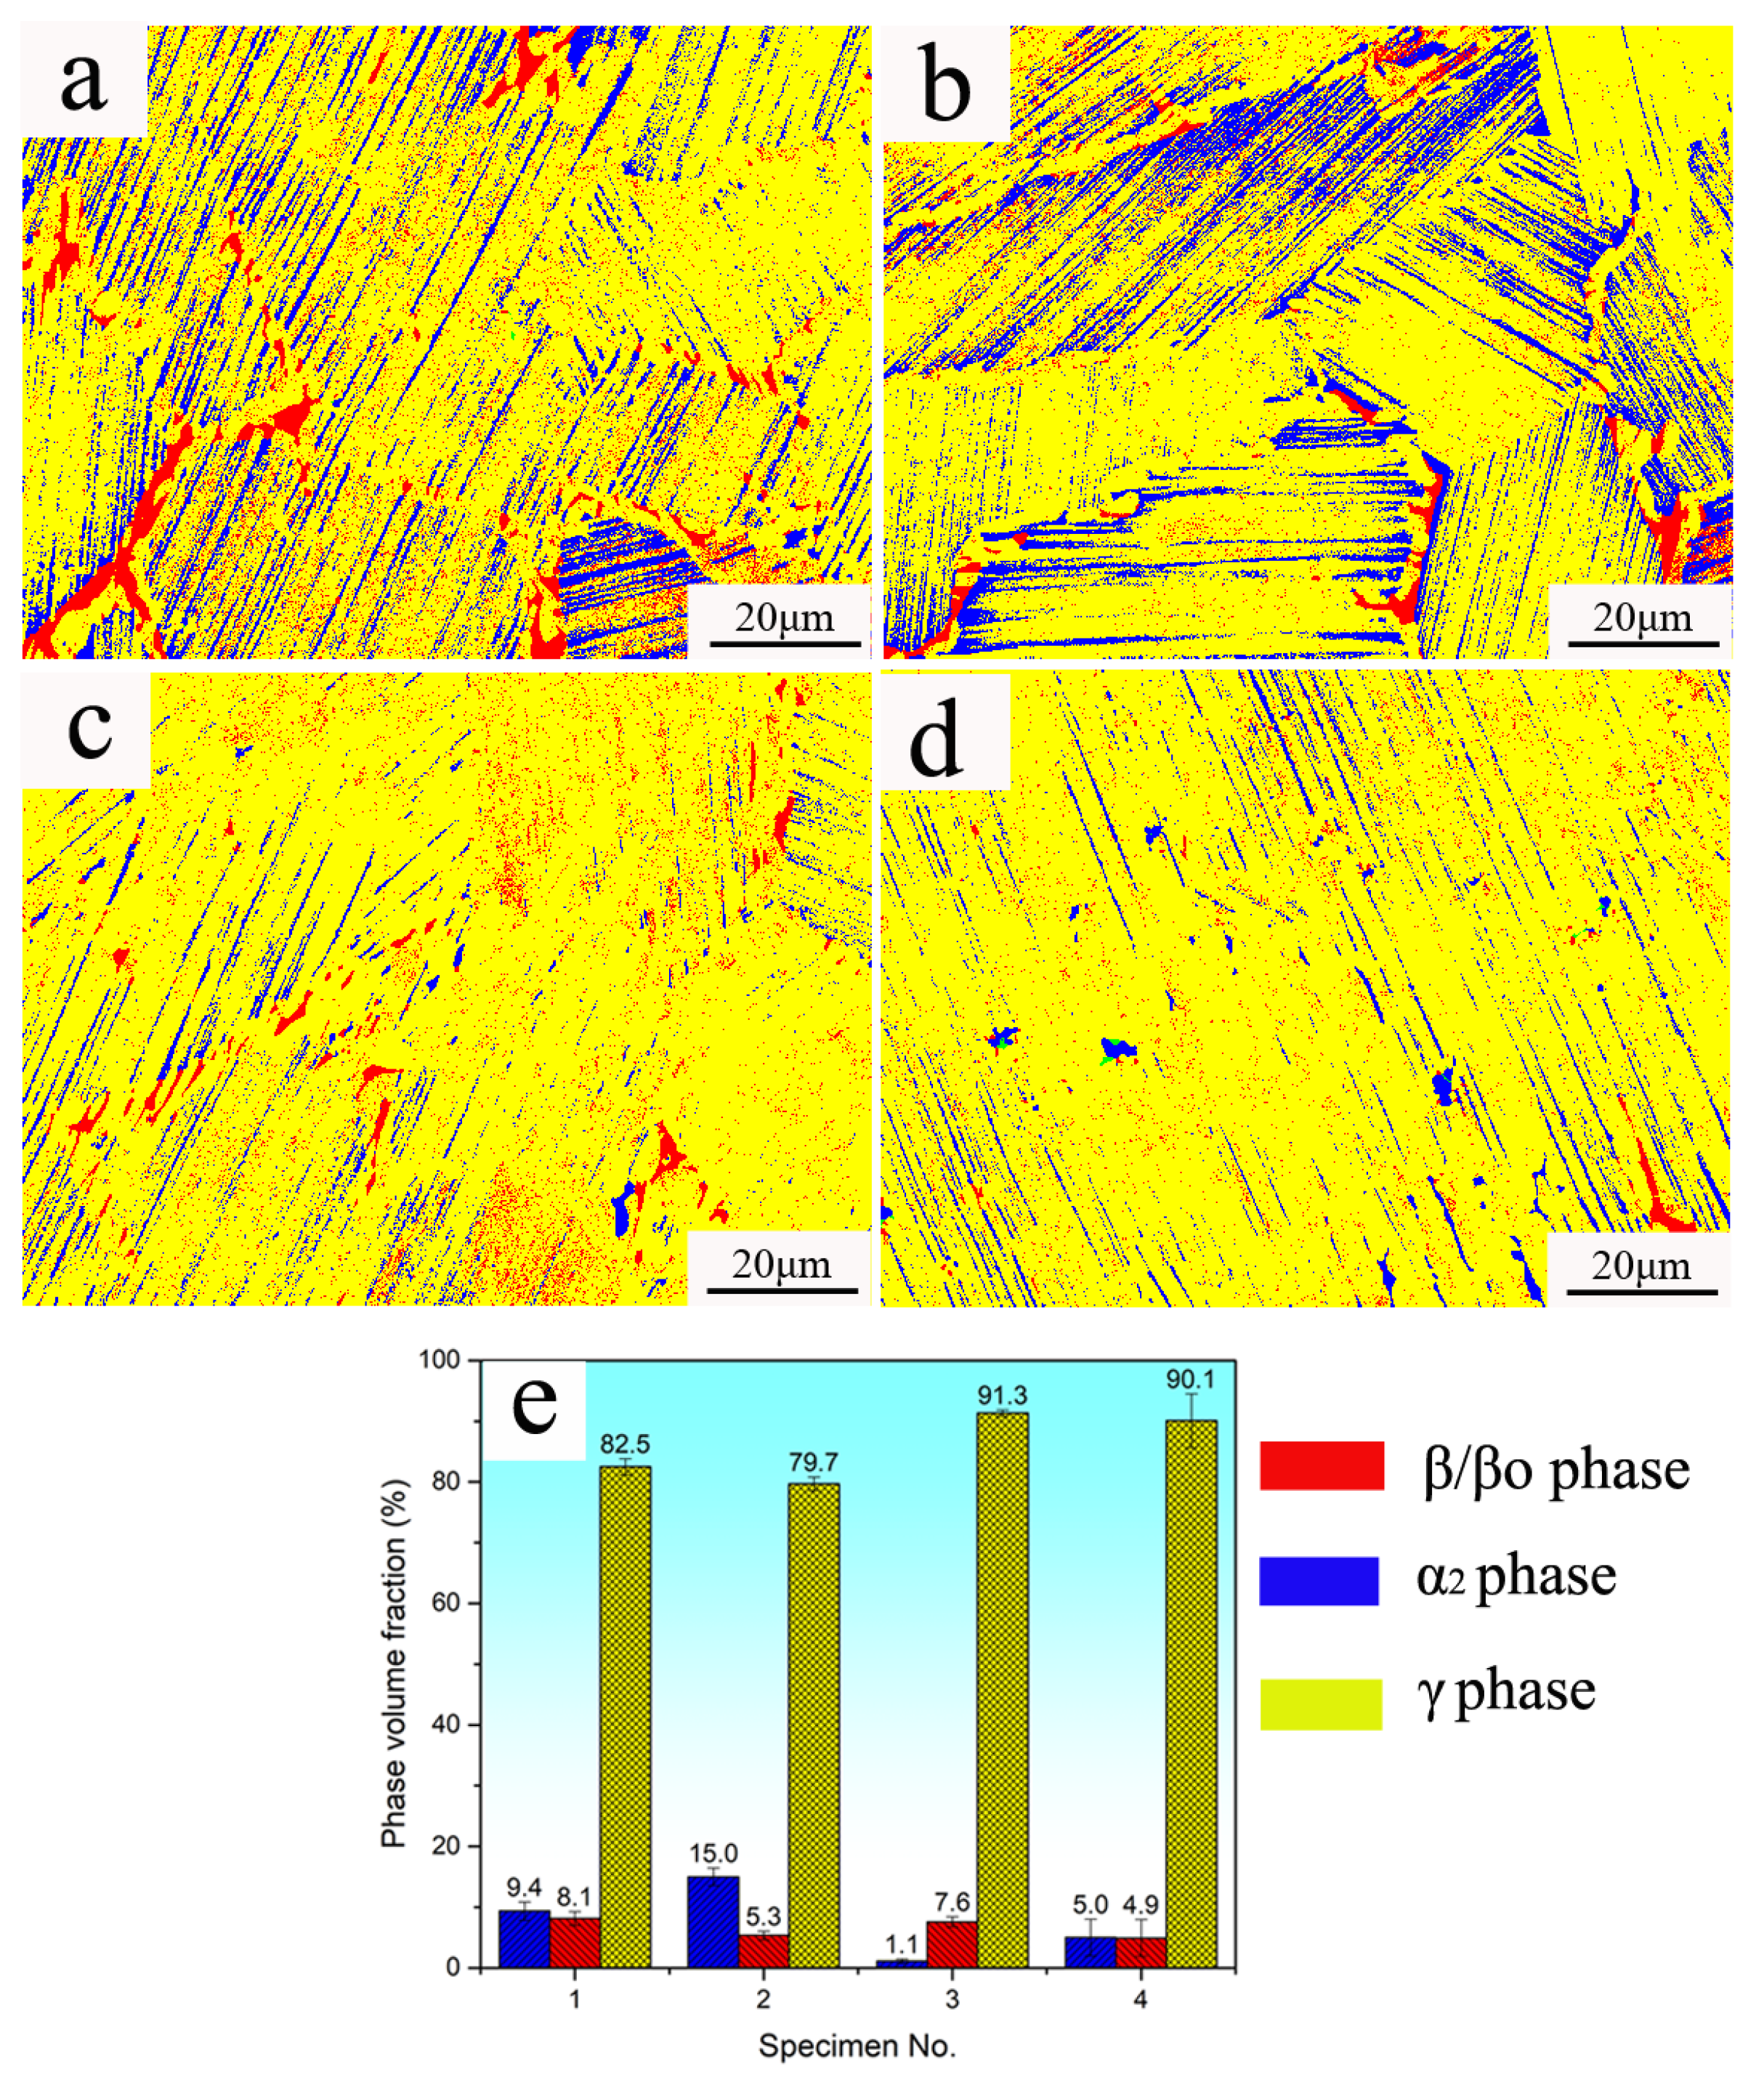
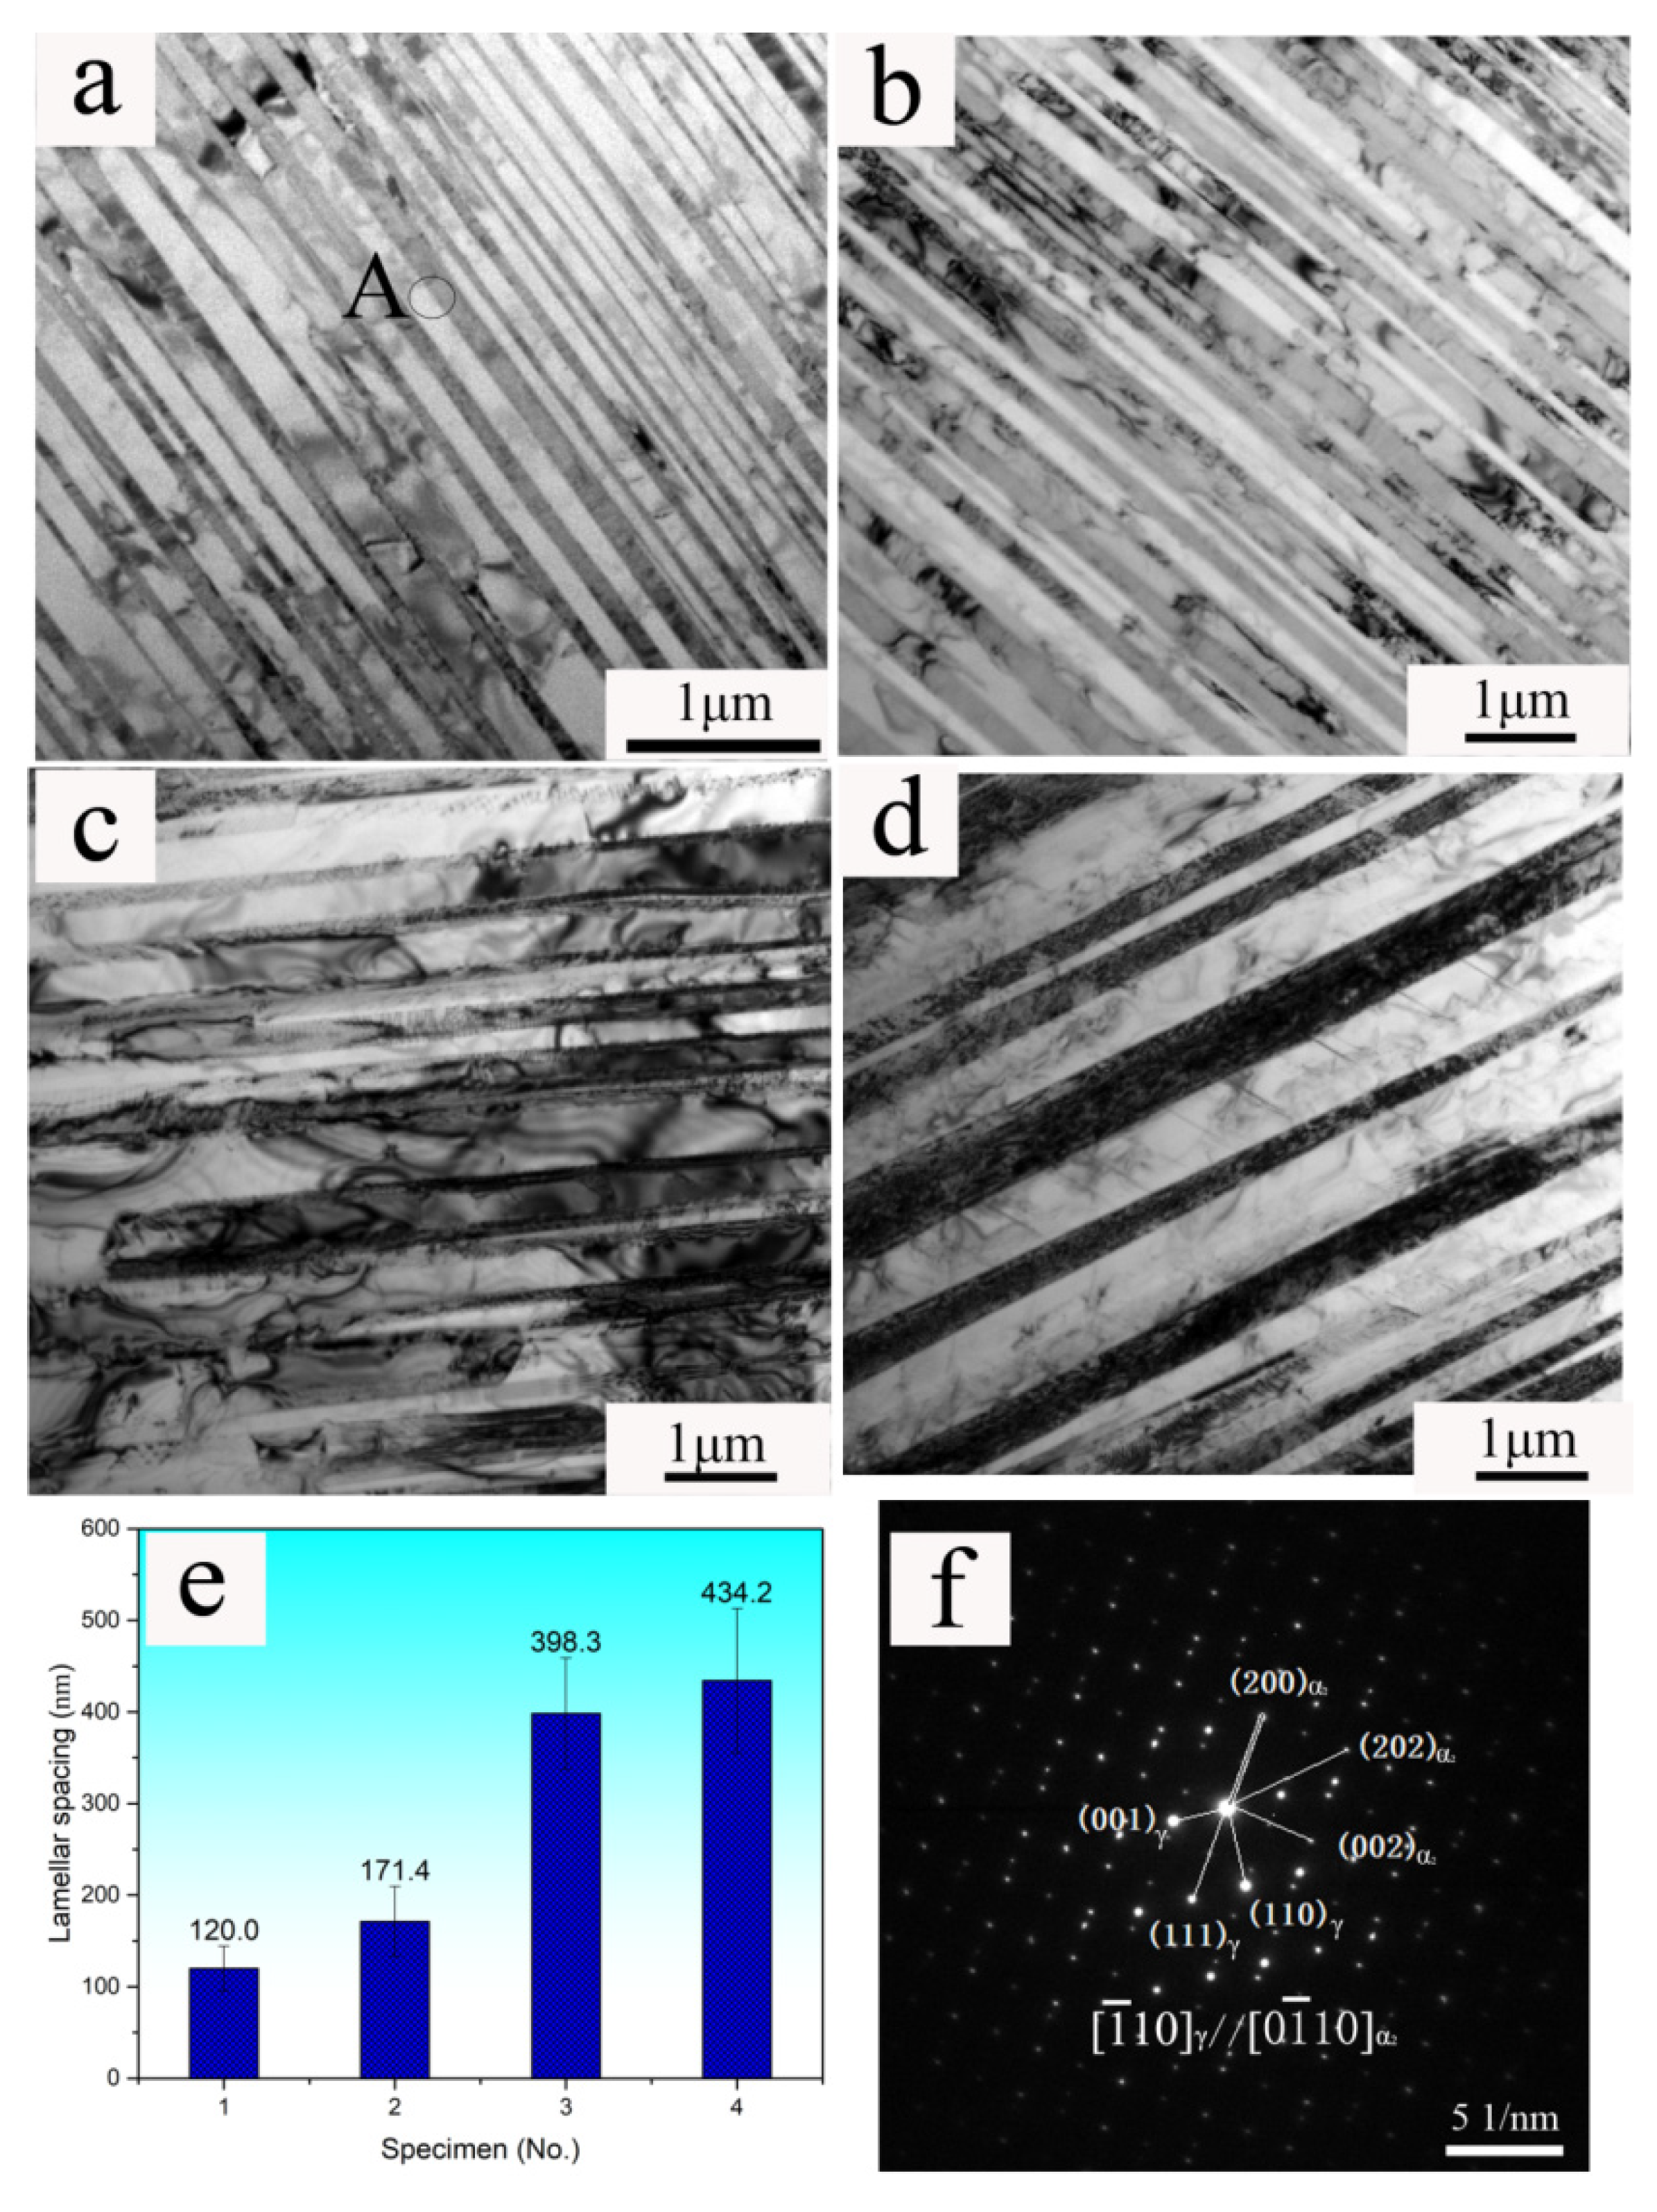
3.1. The Influence of Element on Microstructure

Figure 1 shows the XRD patterns of alloys with different compositions. The alloy Ti-43.5Al-4Nb-1Mo-0.1B (S1) mainly consists of γ-TiAl, α2-Ti3Al, and β phases. After the compositions had little adjustment, the main phases of the alloys S2, S3, and S4 also consist of γ-TiAl, α2-Ti3Al, and βo phases.
Figure 2 shows the microstructure of the four ingots and the diameter of their lamellar colonies. The phases with the brightest contrast are the βo phase, whereas the phases with the darkest contrast are the γ phase and the gray phases, whose contrast is between those of the γ and βo phases, are α2 phase (Figure 2b,d,f,h). The microstructure of the specimens consists of α2/γ lamellar colonies, which are surrounded by a few γ and βo phases. The current TiAl alloys should solidify by the β solidification sequence L→L + β→β→β + α, according to the pseudo-binary phase diagram of the Ti-yAl-4Nb-1Mo-0.1B alloy system [20]. The primary β phase exhibits dendritic morphology, showing the brightest contrast in the BSE image because it contains a lower Al content and higher β-formation additions, such as Nb and Mo (Figure 2a,c,e,g). The interdendritic black area, named S segregation (solidification microsegregation), was formed in solidification processing. It presents a dark contrast because the area is rich in Al, and poor in Nb and Mo. The bright white bands observed at high magnification (as marked in Figure 2b,d,f,h), which always appear inside the lamellar colonies or on the boundaries of the lamellar colonies, are called α-segregation. They formed during β→α + β transformation. Some white lamellae within the lamellar colony were formed by α→γ + α2 + βo solid state phase transformations and ordering [3,21]. The three microsegregations that formed a path were described in detail by Xu [22]. The S segregation becomes serious with an increasing Al content. This is observed by comparing Figure 2a,b,e,f and Figure 2c,d,g,h. The higher Al content in the interdendritic area leads to the formation of a large volume fraction of γ lamella in the lamellar colony at room temperature. At the same time, the β-segregation becomes pronounced with the increase in Mo content. The reason for this is that Mo is a β-stability element and results in an increase in the volume fraction of the βo phase.
The diameter of the lamellar colonies is shown in Figure 2i. The average lamellar colony diameter of S2 is 48.5 ± 4 μm, which is slightly larger than that of S1 (40.6 ± 6.4 μm). Moreover, the average lamellar colony diameter of S4 is 111.1 ± 9.8 μm, which is also larger than that of S3 (94.8 ± 10 μm). This indicates that the lamellar colony size increased with the increase in Al content and the decrease in Mo content. The result is the same as the report of Xu, who argued that the retained β phase hinders the over coarsening of the lamellar colony (α phase at high temperature) when there is a higher Mo content in Ti-45Al-5Nb-xMo-0.3Y alloys [23]. During solidification, the Ti-43.5Al-4Nb-1Mo-0.1B alloy underwent a transformation pathway, which, simplified, is expressed as L→L + β →β→β + α→α + β + γ→α + β + βo + γ→α + βo + γ→α + α2 + βo + γ→α2 + βo + γ [3]. This indicates that the α single phase field region was not passed through during the phase transformation for this special composition. This is attributed to the large amounts of the strong β-stable elements Nb and Mo existing in the alloys, which expand the β phase and contract the α phase. During β→α transformation, the β phase always pins the grain boundaries of the α phase and restricts the growth of α grains. Therefore, the size of the lamellar colony, which is formed by the α grain, was small. From the point of view of the β-stable phase, 1 at.% Mo is equal to 4–6 at.% Nb [2,6,24], so an increase of 0.5 at.% Mo can form more β phase, leading to more pronounced grain refinement. However, the α phase appears in the solid phase transformation path of the TNM alloy, when the Al content exceeds 43.5 at.%, and the α-phase region expands with the increase in Al content. Therefore, the transformation path of S3 and S4 is L→L + β→β→β + α→α→α + γ→α + β + γ→α + β + βo + γ→α + βo+ γ →α +α2+ βo+ γ→α2+ βo+ γ. After β→β + α→α phase transformation, the α grain can grow excessively in a short time, forming a large-sized lamellar colony. Comparing the lamellar colony sizes of S1, S2, S3, and S4, one can observe that the grain change caused by the difference of 0.5 at.% Mo is small, while the grain change caused by the difference of 1.5 at.% Al is more obvious. The reason for this is that the change in Al leads to a change in the phase transition pathway, while the change in Mo only leads to a change in the volume fraction of the β phase.
Table 2 shows the compositions of the βo, α2, and γ phases in the four alloys, respectively. For each alloy, the Mo content in the βo phase is obviously higher than those in the other two phases. This clearly indicates that Mo is a βo-phase formed element. Comparing the compositions of S1 with S2, one can observe that the change in Mo content in each phase is obvious, and the relative change in other elements is very slight. Mo is almost twice as abundant in each phase of S1 as in its S2 counterpart. The trend also applies to the comparison between S3 and S4. The content of Al in the α and γ phases in S3 increased, compared with the corresponding phases in S1. However, Al in the βo phase changes slightly with the increase in Al in the alloy. The same result is concluded by comparing the composition of each phase in S2 and S4. In short, the change in alloy composition also brings a corresponding change in the composition of each phase. The change in Mo is reflected in the change in the compositions of all the phases, while the change in Al is reflected in the changes in both α2 and γ phase compositions. The α2 and γ phases are mostly in the lamellar colony, which is α phase at high temperature. This indicates that Al is enriched in α and Mo is enriched in β during the phase transformation from β to α. Boron was not available due to the lack of capability of the EDS instrumentation.
Figure 3 shows the EBSD phase distribution and statistical results of the volume fractions of the phases in the alloys. The phase distribution images also indicate that Al played a key role in tailoring the microstructure of the TNM alloys. The sum of the volume factions of the α2 and β phases in the four alloys were 17.5%, 20.3%, 8.7%, and 9.9%, respectively. Therefore, the amount of γ phase increases with the increase in Al content. A self-evident fact is that with the increase in Al, the γ single region is approached for the Al-lean TiAl alloy. However, the difference in the volume fraction of the γ phase for the samples with the same Al content is relatively small; for example, the volume fraction of the γ phase in S1 is 2.8% higher than that in S2, and the volume fraction of the γ phase in S3 is only 1.2% higher than that in S4. At the same Al content, the amount of βo phase increases with the increase in Mo content; for example, the volume fractions of the βo phase in S1 and S3 are greater than those in S2 and S4, respectively. However, Mo leads to a decrease in the α2 phase for the same Al-containing alloys.
Figure 4 shows the lamellar morphologies under TEM and the lamellar spacing of the four alloys. The average lamellar spacing of S1, S2, S3, and S4 are 120.0 ± 24.3 nm, 171.1 ± 38.1 nm, 398.2 ± 60.7 nm, and 434.2 ± 78.9 nm, respectively. This indicates that the average lamellar spacing increases from 120.0 ± 24.3 nm to 171.1 ± 38.1 nm (or from 398.2 ± 60.7 nm to 434.2 ± 78.9 nm) under the same Al content (43.5 at.% Al and 45 at.% Al, respectively), when the Mo content is decreased from 1 at.% to 0.5 at.%. However, the lamellar spacing of alloys increases from 120.0 ± 24.3 nm to 398.2 ± 60.7 nm when the Al content is increased from 43.5 at.% to 45 at.% for the 1 at.% Mo-containing alloys (or increased from 171.1 ± 38.1 nm to 434.2 ± 78.9 nm for the alloys containing 0.5 at.% Mo). The increase of 1.5 at.% Al has a more obvious influence on the increase in lamellar spacing than the decrease of 0.5 at.% Mo. It is well known that the lamellar spacing depends on cooling rate, alloy composition, and so on. At the same cooling rate, the α/γ lamellar formation is mainly related to the composition of the alloy, which determines both the volume ratio of α/γ and the stacking fault of the α phase. The formation mechanism of lamellae is that the stacking fault in the α phase is used as the nucleation point, and then lamellae grow by the step mechanism of short-range diffusion [25]. Therefore, the lower the stacking fault energy is, the more likely a stacking fault defect will appear in the crystal, and the thinner the lamellar spacing is. In Ti-Al binary alloys, the stacking fault energy decreases significantly with the decrease in Al content, but it is practically independent of Al content in ternary Ti-Al-10Nb alloys. However, Mo leads to a decrease in the stacking fault energy of the α phase [26,27,28]. With decreasing Al content, the volume fraction of the α2 phase increases. The average lamellar spacing decreases linearly with increasing volume fraction of the α2 phase, as shown in Figure 3 and Figure 4, under the same Mo content. Usually, the α2 lath is much thinner than the γ laths in the lamellar structure. Therefore, the lamellar spacing decreases with the increase in the volume fraction of the α2 phase. Therefore, more fine α lamella is beneficial to the separation of γ into more lamella, resulting in the reduction in lamellar spacing. This has also been reported in high-Nb-containing TiAl alloys [8].

3.2. The Influence of Element on Hardness

Table 3 shows the microhardness and Vickers hardness values of each alloy. Both hardness values decrease from S1 to S4. The hardnesses of S1 and S2 were higher than those of S3 and S4, respectively. Therefore, the hardness of the specimen decreased with the increase in Al content and the decrease in Mo content. Moreover, the change in hardness is more obviously by adjusting 1.5 at.% Al than adjusting 0.5 at.% Mo. It is worth noting that the microhardness values are more dispersed than the Vickers hardness values. This is clearly related to the more localized areas in which microhardness was measured.
Figure 5a–c are the BSE images of indentation microhardness testing in S1. The microhardness indentation has a length of less than 10 μm, and may be located in the lamellar colony, or cover both the lamellar colony and γ phase or the lamellar colony and βo phase. In this case, it is not reasonable to calculate microhardness by the arithmetic mean of values at all points. Cha et al. [29] found that the microhardness of the Ti-43.5Al-4Nb-1Mo-0.1B alloy with a fine-grained microstructure (grain size 2–20 μm and lamellar spacing of 10–30 nm) can be estimated by rule of mixture (ROM), using either the iso-stress (Reuss) model, assuming deformation in series, or the iso-strain (Voilgt) model, assuming deformation in parallel [29,30]. They measured the microhardness of γ, α2, and βo as 440 HV0.01, 490 HV0.01, and 740 HV0.01, respectively. The following relation of microhardness and phase volume fraction (iso-strain mode) is obeyed for the microstructure that is 41% lamellar colony:
1 / H C = f α 2 / H α 2 + f γ / H γ + f β / H β
where H C , H α 2 , H γ , and H β present the microhardness of the cellular region, α2 phase, γ phase, and β phase, respectively, and f α 2 , f γ , and f β represent the volume fraction of the α2 phase, γ phase, and βo phase, respectively. However, the iso-stress mode is as follows:
H C = f α 2 × H α 2 + f γ × H γ + f β × H β
This is suitable for the microstructure that is 82% lamellar colony. Kim [30] believed that when the volume fraction of the hardened phase was small, it was more reliable to calculate the overall hardness value of the material through the hardness value of each phase by using the iso-stress model. Because the volumes of the βo and α2 phases in the present microstructure are very small, and the hardness of each phase cannot be measured directly, we adopt the microhardness values of each phase in the TNM alloy measured by Cha [29], and calculate the microhardnesses of the four alloys by using the iso-stress model. The calculated results are 469.0 HV0.01, 463.4 HV0.01, 463.5 HV0.01, and 457.2 HV0.01, respectively. This indicates that there is little change in the hardness values between the four alloys.
As for the relationship between the hardness of the lamellar structure and lamellar spacing, Chu et al. [31] established a superlattice film model with periodic arrangement of films, and believed that the hardness increased with the decrease in lamellar thickness, and then decreased with the decrease in lamellar thickness when it reached a critical value. This law is also found in the TiAl lamellar structure; for example, Cha et al. [15] found that the hardness of the FL structure decreases with the decrease in nanoscale lamellar spacing. They ascertained that, in this case, because of the refinement of the γ lamellae and the small volume fraction of the γ phase, a dislocation slip in α2 lamellae is easier than in γ lamellae, leading to a change in the deformation mechanism. However, most results suggest that hardness increases with increasing α2 volume fraction and decreasing lamellar spacing. This is based on the fact that the deformation mechanism during the application of the load by the indenter is mainly a dislocation slip in the γ lamellae. Here, the γ/γ and γ/α2 interfaces act as glide obstacles and lead to dislocation pile-ups. Therefore, the modified Hall–Petch formula is often used to construct the relationship of harness and lamellar spacing. Burtscher [31] built a linear relationship between the average lamellar spacing and the value of Vickers hardness, according to the modified Hall–Petch relation for the Ti-43.5Al-4Nb-1Mo-0.1B-0.3Si-0.3C alloy, with an FL lamellar microstructure, as follows:
HV 10 = ( 298 ± 21 ) + ( 845 ± 148 ) × λ 1 / 2
where λ is the lamellar spacing. This relation is obtained through a lamellar microstructure with a colony size of about 42 μm and lamellar spacing of 31–114 nm.
The average values of the Vicker hardness of S1, S2, S3, and S4 are 388.2 HV5, 374.8 HV5, 330.1 HV5, and 316.5 HV5, respectively (Table 2). We constructed the following similar formula:
HV 5 = 251.3 + 1541.89 × λ 1 / 2
This relation is shown in Figure 6. Figure 5d shows the BSE images of the indentation of Vickers hardness testing in S1. The indentation, with a diagonal length of more than 100 μm, covers several lamellar colonies and many βo regions. Thus, hardness reflects not only the contribution of the three phases, but also those of the colony boundaries, phase boundaries, and lamellar interfaces. Comparing our microstructures with those of Burtscher [32], we find that the effect of colony boundaries also exists for their testing, but the effect of the βo phase is an additional phenomenon for the present alloy; thus, we have a similar formula with a different coefficient.
For most metals and other materials, the hardness increases with decreasing indentation depth in the micrometer range. This increasing hardness could be explained by the indentation size effect [33]. This case also occurs in TiAl alloys, including TNM alloys. It is confirmed by the fact that the microhardness is higher than the Vickers hardness in the present work. We recommend using Vickers hardness to measure the properties of TNM alloys. The microhardness is poorly representative and the results are highly dispersed. The nanohardness value is the highest, although different authors have different hardness values for each phase of the TNM alloy; for example, Martin Schloffer measured the nanohardness of γ, α2, and βo as 6.9 GPa, 8.3 GPa, and 8.0 GPa in a powder metallurgical TNM alloy, respectively; however, the three values obtained were 4.2 GPa, 5.3 GPa, and 7.2 GPa, respectively, in a β-stabilized casted TiAl alloy (Ti–43.6Al–4.06Nb–1.01Mo–0.09B) [34,35]. The two results are not only very different in value, but also in hardness order. This is related to not only the composition changes in the phases under different heat treatment conditions, but also the neglect of the effect of interface state on hardness. It is well known that there is a positive correlation between hardness and strength. S1 and S2 have a fine lamellar colony, and lamellar spacing with high Vickers hardness, so the microstructures of S1 and S2 are optimal in this work.

4. Conclusions

The alloys with four different compositions were designed for studying the effect of Al and Mo content on the microstructure and properties of TNM TiAl alloys. The following conclusions have been drawn:
(1)
After a decrease of 0.5 at.% Mo and/or increase of 1.5 at.% Al in the typical TNM alloy, the alloys have an NL microstructure with a few βo phases at the colony boundaries or in the lamellar colony. The lamellar colony size and the lamellar spacing have increased with the decrease in Mo and the increase in Al. The volume fraction of the βo phase decreases with the decrease in Mo and the increase in Al, and that of α2 decreases with the increase in both Al and Mo contents. Mo is rich in the βo phase, and the reduction in its content reduces the content of each phase in proportion. The increase in Al content in the alloy leads to the corresponding increase in Al content in the α2 and γ phases. The increased content of Al and decreased content of Mo is unbeneficial for obtaining a microstructure with a fine lamellar colony and lamellar spacing.
(2)
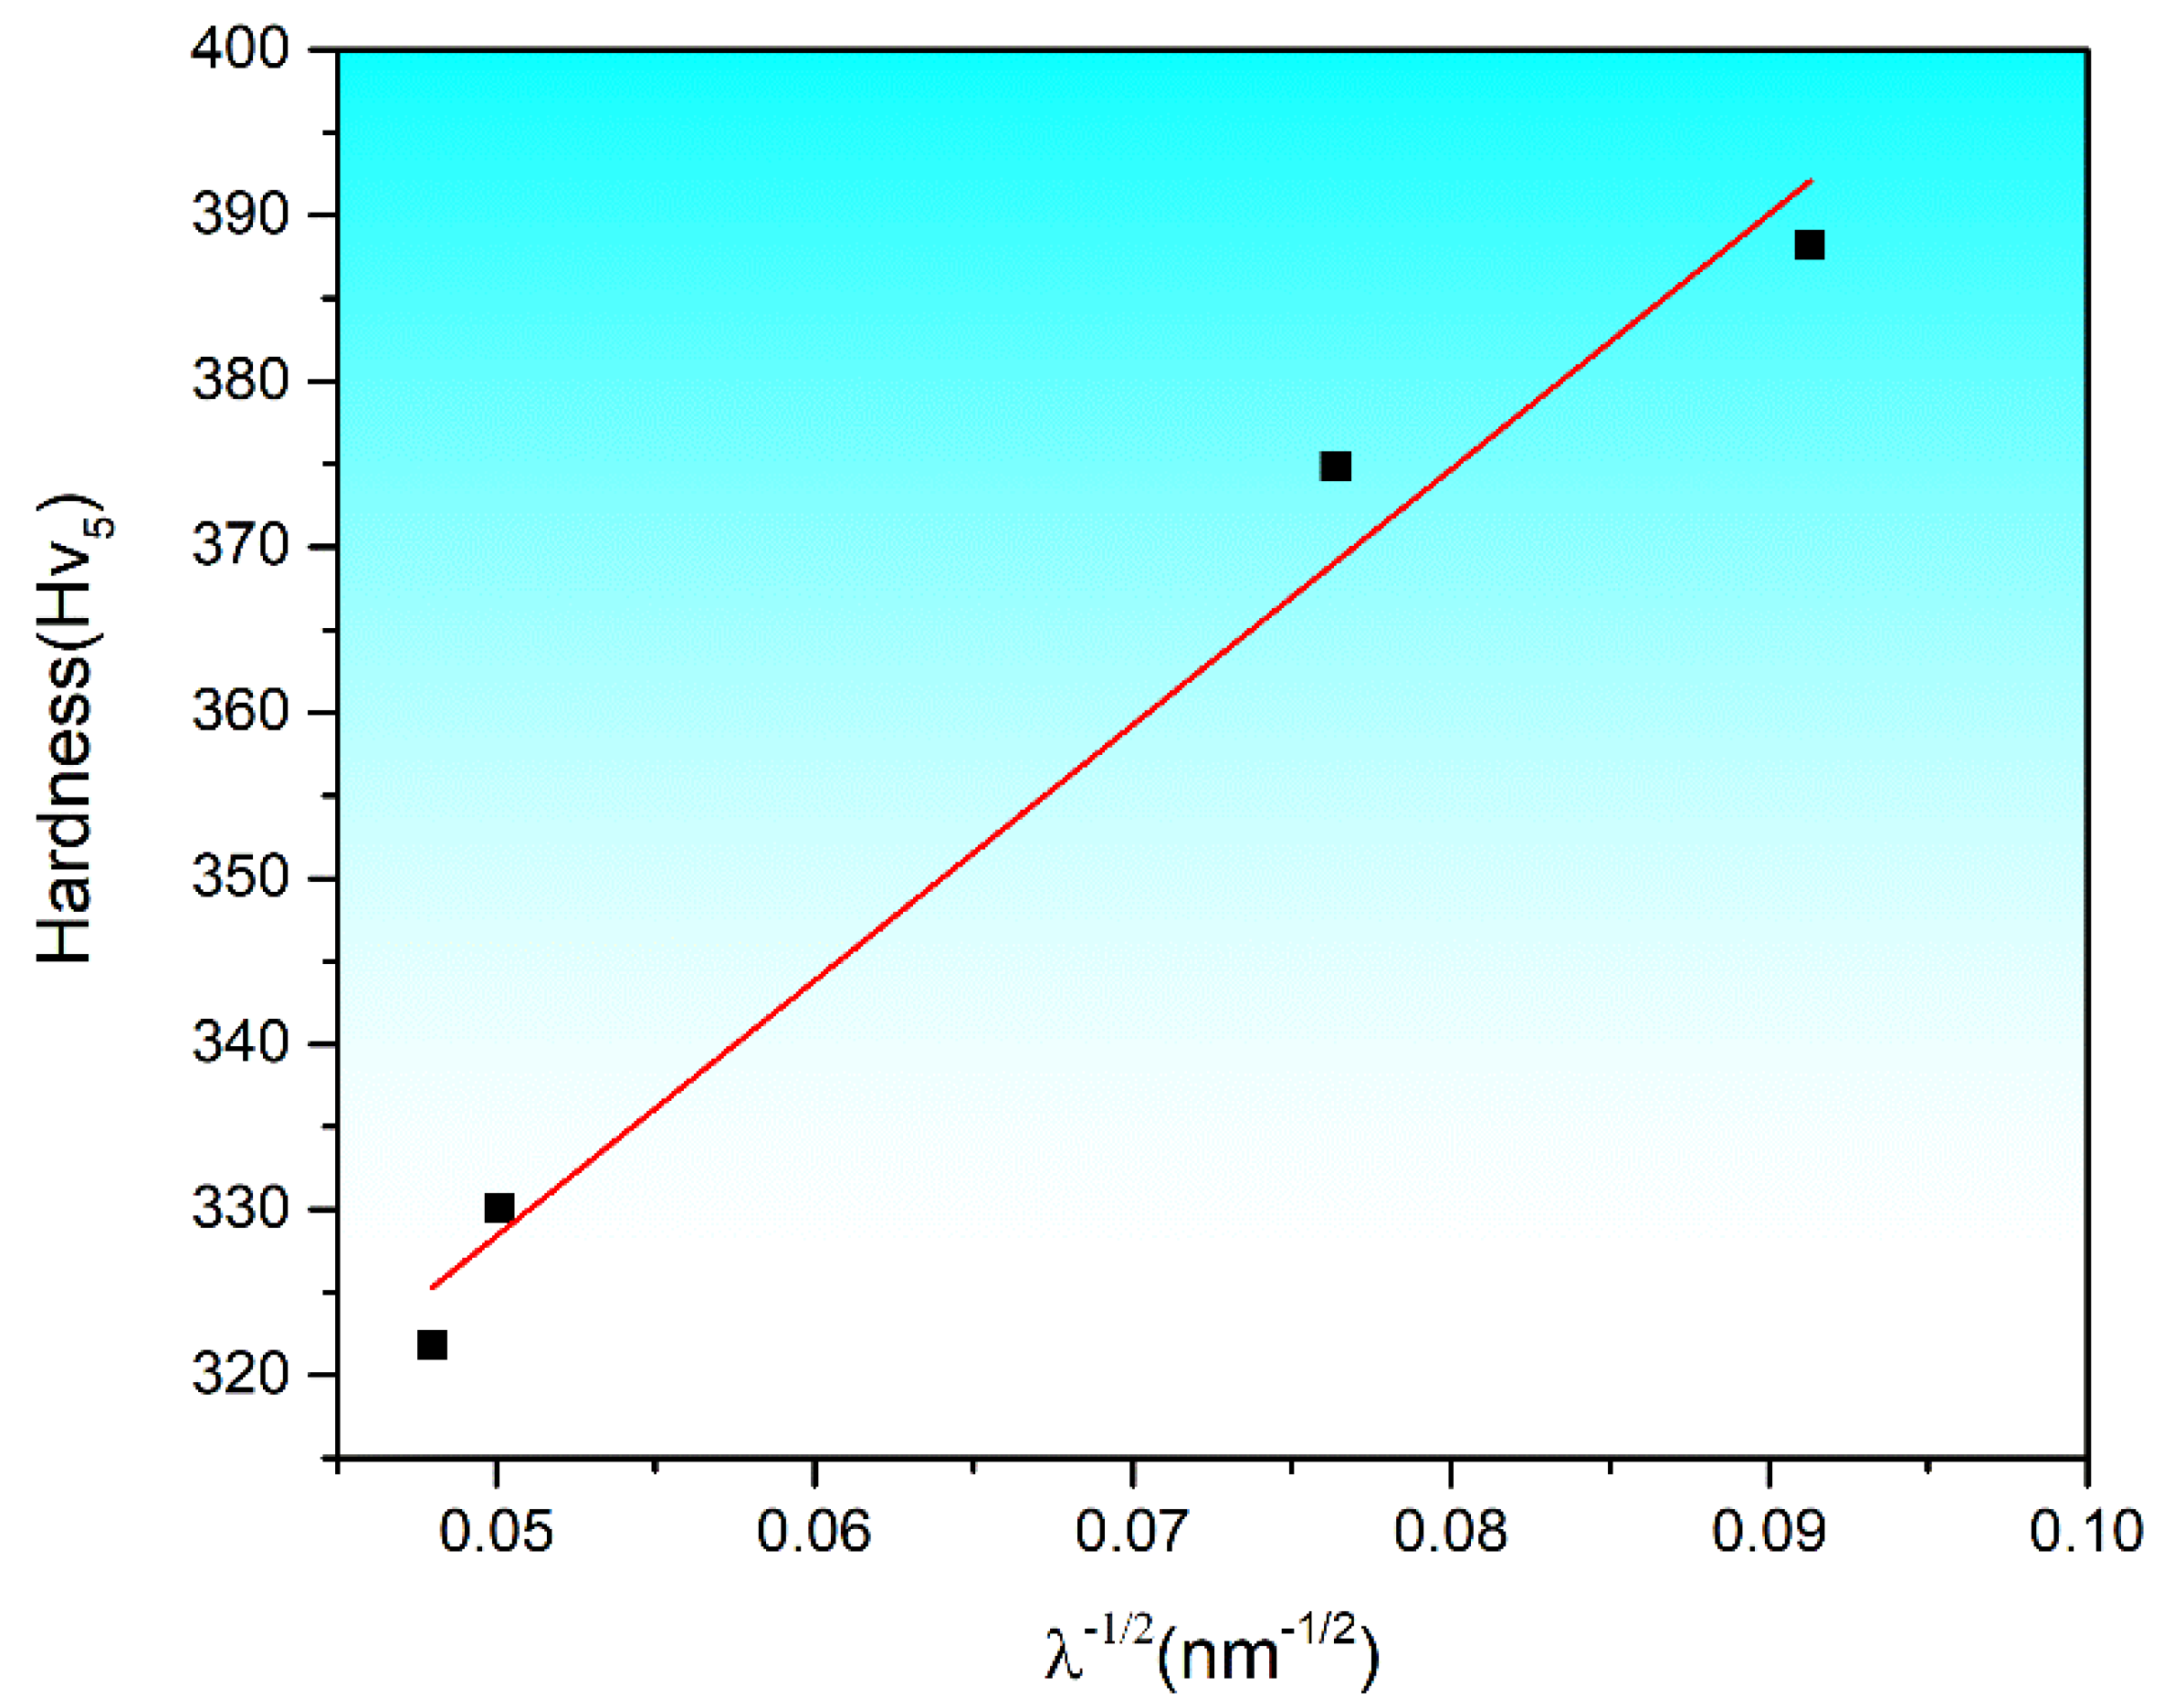
The hardness of the alloys decreases with the increase in Al content and the decrease in Mo content, mainly due to the increase in lamellar spacing, which was caused by the change in composition. In the obtained microstructure, the Vickers hardness results reasonably reflect the hardness of the alloys. The relationship between the hardness value and the lamellar spacing conforms to the Hall–Petch relationship.

Author Contributions

G.Y.: Conceptualization, methodology, investigation, writing—original manuscript. X.X., Y.L., Y.W. and G.H.: design guide, writing assistance. J.L. and Y.Z.: provided financial and equipment support for experiment, supervision. All authors have read and agreed to the published version of the manuscript.

Funding

Financial support by National Natural Science Foundation of China (No. 51831001), the Funds for Creative Research Groups of China (No. 51921001) and the National Science and Technology Major Project of China (J2019-VI-0011-0125) are gratefully acknowledged.

Institutional Review Board Statement

The study did not involve humans or animals.

Informed Consent Statement

The study did not involve humans.

Data Availability Statement

The data used in this article are presented in the manuscript.

Conflicts of Interest

The authors declare no conflict of interest.

References

  1. Tetsui, T.; Shindo, K.; Kobayashi, S.; Takeyama, M. A newly developed hot worked TiAl alloy for blades and structural components. Scr. Mater. 2002, 47, 399–403. [Google Scholar] [CrossRef]
  2. Kim, Y.W.; Kim, S.L. Advances in Gammalloy Materials–Processes–Application Technology: Successes, Dilemmas, and Future. JOM 2018, 70, 553–560. [Google Scholar] [CrossRef] [Green Version]
  3. Klein, T.; Niknafs, S.; Dippenaar, R.; Clemens, H.; Mayer, S. Grain Growth and β to α Transformation Behavior of a β-Solidifying TiAl Alloy. Adv. Eng. Mater. 2015, 17, 786–790. [Google Scholar] [CrossRef]
  4. Kim, Y.W.; Dimiduk, D.M. Progress in the understanding of gamma titanium aluminides. JOM 1991, 43, 41–47. [Google Scholar] [CrossRef]
  5. Kim, Y.W. Ordered intermetallic alloys, part III Gamma titanium aluminides. JOM 1994, 46, 30–39. [Google Scholar] [CrossRef]
  6. Schwaighofer, E.; Clemens, H.; Mayer, S.; Lindemann, J.; Klose, J.; Smarsly, W.; Güther, V. Microstructural design and mechanical properties of a cast and heat-treated intermetallic multi-phase γ-TiAl based alloy. Intermetallics 2014, 44, 128–140. [Google Scholar] [CrossRef]
  7. Umeda, H.; Kishida, K.; Inui, H.; Yamaguchi, M. Effects of Al-concentration and lamellar spacing on the room-temperature strength and ductility of PST crystals of TiAl. Mater. Sci. Eng. A 1997, 97, 336–343. [Google Scholar] [CrossRef]
  8. Liu, Z.C.; Lin, J.P.; Li, S.J.; Chen, G.L. Effects of Nb and Al on the microstructures and mechanical properties of high Nb containing TiAl base alloys. Intermetallics 2002, 10, 653–659. [Google Scholar] [CrossRef]
  9. Cui, N.; Wu, Q.; Yan, Z.; Zhou, H.; Wang, X. The Microstructural Evolution, Tensile Properties, and Phase Hardness of a TiAl Alloy with a High Content of the beta Phase. Mater. Basel 2019, 12, 2757. [Google Scholar] [CrossRef] [Green Version]
  10. Fang, H.; Chen, R.; Gong, X.; Su, Y.; Ding, H.; Guo, J.; Fu, H. Effects of Nb on Microstructure and Mechanical Properties of Ti42Al2.6C Alloys. Adv. Eng. Mater. 2018, 20, 1701112. [Google Scholar] [CrossRef]
  11. Zhu, D.; Liu, L.; Dong, D.; Wang, X.; Liu, Y.; Chen, Z.; Wei, Z. Microstructure and compression behavior of in-situ synthesized Ti2AlC reinforced Ti-48Al-2Cr alloy with carbon nanotubes addition. J. Alloys Compd. 2021, 862, 158646. [Google Scholar] [CrossRef]
  12. Lee, D.-B. Effect of Cr, Nb, Mn, V, W and Si on high temperature oxidation of TiAl alloys. Met. Mater. Int. 2005, 11, 141–147. [Google Scholar] [CrossRef]
  13. Burtscher, M.; Klein, T.; Lindemann, J.; Lehmann, O.; Fellmann, H.; Guther, V.; Clemens, H.; Mayer, S. An Advanced TiAl Alloy for High-Performance Racing Applications. Mater. Basel 2020, 13, 4720. [Google Scholar] [CrossRef]
  14. Liu, G.H.; Wang, Z.D.; Fu, T.L.; Li, Y.; Liu, H.T.; Li, T.R.; Gong, M.N. Study on the microstructure, phase transition and hardness for the TiAl-Nb alloy design during directional solidification. J. Alloys Compd. 2015, 650, 45–52. [Google Scholar] [CrossRef]
  15. Cha, L.M.; Clemens, H.; Dehm, G. Microstructure evolution and mechanical properties of an intermetallic Ti-43.5Al-4Nb-1Mo-0.1B alloy after ageing below the eutectoid temperature. Int. J. Mater. Res. 2011, 102, 703–708. [Google Scholar] [CrossRef]
  16. Clemens, H.; Mayer, S. Advanced Intermetallic TiAl Alloys. Mater. Sci. Forum 2016, 879, 113–118. [Google Scholar] [CrossRef]
  17. Mayer, S.; Kastenhuber, M.; Clemens, H. Advanced Titanium Aluminides-How to Improve the Creep Resistance via Compositional and Microstructural Optimization. Mater. Sci. Forum 2018, 941, 1484–1489. [Google Scholar] [CrossRef]
  18. Clemens, H.; Mayer, S. Development Status, Applications and Perspectives of Advanced Intermetallic Titanium Aluminides. Mater. Sci. Forum 2014, 783, 15–20. [Google Scholar] [CrossRef]
  19. Mayer, S.; Erdely, P.; Fischer, F.D.; Holec, D.; Kastenhuber, M.; Klein, T.; Clemens, H. Intermetallic β-Solidifying γ-TiAl Based Alloys−From Fundamental Research to Application. Adv. Eng. Mater. 2017, 19, 1600735. [Google Scholar] [CrossRef]
  20. Clemens, H.; Mayer, S. Design, Processing, Microstructure, Properties, and Applications of Advanced Intermetallic TiAl Alloys. Adv. Eng. Mater. 2013, 15, 191–215. [Google Scholar] [CrossRef]
  21. Johnson, D.R.; Inui, H.; Muto, S.; Omiya, Y.; Yamanaka, T. Microstructural development during directional solidification of α-seeded TiAl alloys. Acta Mater. 2006, 54, 1077–1085. [Google Scholar] [CrossRef]
  22. Chen, G.L.; Xu, X.J.; Teng, Z.K.; Wang, Y.L.; Lin, J.P. Microsegregation in high Nb containing TiAl alloy ingots beyond laboratory scale. Intermetallics 2007, 15, 625–631. [Google Scholar] [CrossRef]
  23. Xu, W.C.; Huang, K.; Wu, S.F.; Zong, Y.Y.; Shan, D.B. Influence of Mo content on microstructure and mechanical properties of β-containing TiAl alloy. Trans. Nonferr. Metal. Soc. China 2017, 27, 820–828. [Google Scholar] [CrossRef]
  24. Yang, Y.; Fang, H.; Chen, R.; Su, Y.; Ding, H.; Guo, J. A Comparative Study on Microstructure and Mechanical Properties of Ti-43/46Al–5Nb–0.1B Alloys Modified by Mo. Adv. Eng. Mater. 2019, 22, 1901075. [Google Scholar] [CrossRef]
  25. Denquin, A.; Naka, S. Phase transformation mechsnisms involved in two-phase TiAl-based alloy-1. lamallae sturacture formation 1996.pdf. Acta Mater. 1996, 44, 343–352. [Google Scholar] [CrossRef]
  26. Zhang, W.J.; Appel, F. Weak-beam TEM study on planar fault energies of Al-lean TiAl-base alloys. Mater. Sci. Eng. A 2002, 334, 59–64. [Google Scholar] [CrossRef]
  27. Zhang, W.J.; Appel, F. Effect of Al content and Nb addition on the strength and fault energy of TiAl alloys. Mater. Sci. Eng. A 2002, 329, 649–652. [Google Scholar] [CrossRef]
  28. Shang, S.L.; Wang, W.Y.; Zhou, B.C.; Wang, Y.; Darling, K.A.; Kecskes, L.J.; Mathaudhu, S.N.; Liu, Z.K. Generalized stacking fault energy, ideal strength and twinnability of dilute Mg-based alloys: A first-principles study of shear deformation. Acta Mater. 2014, 67, 168–180. [Google Scholar] [CrossRef]
  29. Cha, L.; Scheu, C.; Clemens, H.; Chladil, H.F.; Dehm, G.; Gerling, R.; Bartels, A. Nanometer-scaled lamellar microstructures in Ti–45Al–7.5Nb–(0; 0.5)C alloys and their influence on hardness. Intermetallics 2008, 16, 868–875. [Google Scholar] [CrossRef]
  30. Kim, H.S. On the rule of mixtures for the hardness of particle reinforced composites 2000.pdf. Mater. Sci. Eng. A 2000, 289, 30–33. [Google Scholar] [CrossRef]
  31. Chu, X.; Barnett, S.A. Model of superlattice yield stress and hardness enhancements. J. Appl. Phys. 1995, 77, 4403–4411. [Google Scholar] [CrossRef]
  32. Burtscher, M.; Klein, T.; Mayer, S.; Clemens, H.; Fischer, F.D. The creep behavior of a fully lamellar γ-TiAl based alloy. Intermetallics 2019, 114, 106611. [Google Scholar] [CrossRef]
  33. Dehm, G.; Motz, C.; Scheu, C.; Clemens, H.; Mayrhofer, P.H.; Mitterer, C. Mechanical Size-Effects in Miniaturized and Bulk Materials. Adv. Eng. Mater. 2006, 8, 1033–1045. [Google Scholar] [CrossRef]
  34. Schloffer, M.; Iqbal, F.; Gabrisch, H.; Schwaighofer, E.; Schimansky, F.-P.; Mayer, S.; Stark, A.; Lippmann, T.; Göken, M.; Pyczak, F.; et al. Microstructure development and hardness of a powder metallurgical multi phase γ-TiAl based alloy. Intermetallics 2012, 22, 231–240. [Google Scholar] [CrossRef] [Green Version]
  35. Schloffer, M.; Rashkova, B.; Schöberl, T.; Schwaighofer, E.; Zhang, Z.; Clemens, H.; Mayer, S. Evolution of the ωo phase in a β-stabilized multi-phase TiAl alloy and its effect on hardness. Acta Mater. 2014, 64, 241–252. [Google Scholar] [CrossRef]
Figure 1. X-ray diffraction (XRD) patterns of ingots with different compositions.
Metals 11 01849 g001
Figure 2. The SEM-BSE images of the following four alloys: S1 (a,b), S2 (c,d), S3 (e,f) and S4 (g,h), respectively, and the diameter of their lamellar colonies (i).
Metals 11 01849 g002
Figure 3. The EBSD phase distribution and statistics results of the volume fractions of different phases in the following alloys: (a) S1, (b) S2, (c) S3, (d) S4, (e) the statistical information from the EBSD data.
Metals 11 01849 g003
Figure 4. The TEM images of lamellar morphologies of S1 (a), S2 (b), S3 (c) and S4 (d), and their lamellar spacing (e). The selected area diffraction patterns of position A shown in (f).
Metals 11 01849 g004
Figure 5. The impression left by microhardness indenter (ac) and Vickers hardness indenter (d) in S1: (a) within lamellar colony; (b) on the colony boundary; (c,d) on both lamellar colony and βo and γ phases.
Metals 11 01849 g005
Figure 6. The relationship between lamellar spacing and Vickers hardness.
Metals 11 01849 g006
Table 1. Nominal compositions of the present TiAl alloys (at.%).
Specimen No.Nominal Chemical Component
S1Ti-43.5Al-4Nb-1Mo-0.1B
S2Ti-43.5Al-4Nb-0.5Mo-0.1B
S3Ti-45Al-4Nb-1Mo-0.1B
S4Ti-45Al-4Nb-0.5Mo-0.1B
Table 2. The compositions of βo, α2 and γ phase in the alloys by EDS.
AlloyPhaseTi (at.%)Al (at.%)Nb (at.%)Mo (at.%)B (at.%)
S1βo54.7 ± 1.038.3 ± 1.24.7 ± 0.22.3 ± 0.2-
α252.9 ± 0.441.9 ± 0.74.1 ± 0.31.1 ± 0.2-
γ50.9 ± 0.643.5 ± 0.74.3 ± 0.21.3 ± 0.2-
S2βo55.2 ± 0.338.5 ± 0.304.8 ± 0.21.4 ± 0.2-
α253.8 ± 0.441.5 ± 0.54.2 ± 0.20.5 ± 0.1-
γ50.6 ± 0.944.2 ± 0.54.5 ± 0.10.7 ± 0.2-
S3βo53.3 ± 1.938.6 ± 2.84.9 ± 0.303.1 ± 0.7-
α251.5 ± 1.043.4 ± 0.84.1 ± 0.21.0 ± 0.2-
γ48.5 ± 0.645.8 ± 0.54.5 ± 0.11.3 ± 0.1-
S4βo54.5 ± 1.938.9 ± 2.34.9 ± 0.21.6 ± 0.3-
α251.8 ± 0.543.3 ± 0.94.2 ± 0.30.6 ± 0.2-
γ48.3 ± 0.846.3 ± 1.14.6 ± 0.20.9 ± 0.3-
Table 3. Microhardness and Vickers hardness values of the alloys.
AlloyS1S2S3S4
HV0.01441.7 ± 119.7437.9 ± 95.4363.7 ± 81.5349.6 ± 78.2
HV5388.2 ± 9.4374.9 ± 7.8330.1 ± 8.6316.5 ± 6.3
Publisher’s Note: MDPI stays neutral with regard to jurisdictional claims in published maps and institutional affiliations.

