Article

Effects of Static Magnetic Field on the Microstructure of Selective Laser Melted Inconel 625 Superalloy: Numerical and Experiment Investigations

1
State Key Laboratory of Advanced Special Steels, School of Materials Science and Engineering, Shanghai University, Shanghai 200444, China
2
ICB UMR 6303, CNRS, University Bourgogne Franche-Comté, UTBM, F-90010 Belfort, France
*
Authors to whom correspondence should be addressed.
Metals 2021, 11(11), 1846; https://doi.org/10.3390/met11111846
Submission received: 6 October 2021 / Revised: 14 November 2021 / Accepted: 15 November 2021 / Published: 17 November 2021
(This article belongs to the Special Issue Solidification Process of Alloys under Magnetic Field)

Abstract

:
A number of researchers have reported that a static magnetic field (SMF) will affect the process of selective laser melting (SLM), which is achieved mainly through affecting molten pool evolution and microstructure growth. However, its underlying mechanism has not been fully understood. In this work, we conducted a comprehensive investigation of the influence of SMF on the SLM Inconel 625 superalloy through experiments and multi-scale numerical simulation. The multi-scale numerical models of the SLM process include the molten pool and the dendrite in the mushy zone. For the molten pool simulation, the simulation results are in good agreement with the experimental results regarding the pool size. Under the influence of the Lorentz force, the dimension of the molten pool, the flow field, and the temperature field do not have an obvious change. For the dendrite simulation, the dendrite size obtained in the experiment is employed for setting up the dendrite geometry in the dendrite numerical simulation, and our findings show that the applied magnetic field mainly influences the dendrite growth owing to thermoelectric magnetic force (TEMF) on the solid–liquid interface rather than the Lorentz force inside the molten pool. Since the TEMF on the solid–liquid interface is affected by the interaction between the SMF and thermal gradient at different locations, we changed the SLM parameters and SMF to investigate the effect on the TEMF. The simulation shows that the thermoelectric current is highest at the solid–liquid interface, resulting in a maximum TEMF at the solid–liquid interface and, as a result, affecting the dendrite morphology and promoting the columnar to equiaxed transition (CET), which is also shown in the experiment results under 0.1 T. Furthermore, it is known that the thermoelectric magnetic convection (TEMC) around the dendrite can homogenize the laves phase distribution. This agrees well with the experimental results, which show reduced Nb precipitation from 8.65% to 4.34% under the SMF of 0.1 T. The present work can provide potential guidance for microstructure control in the SLM process using an external SMF.

1. Introduction

Compared with traditional manufacturing processes, selective laser melting (SLM), as a typical additive manufacturing (AM) technique, can produce fine microstructures due to its complex physical behaviors with large thermal gradient, high solidification rate, and local temperature variations caused by the repeated heating and melting [1,2,3]. SLM can be used for rapid prototyping by melting metal powders layer-by-layer using a heat source such as a focused laser beam, based on a design from 3D Computer-Aided Design (CAD) data. SLM can prepare parts with complex structures and realize the regulation of comprehensive performance through laser process parameters. For the moment, SLM has been widely used in many fields, including aerospace, automobiles, microelectronics, healthcare, and mold manufacturing [4,5,6].
However, the final microstructures of SLM parts are determined by the inevitable complex multi-physics phenomena, such as repeated heating and melting, the Marangoni effect, rapid solidification, phase transformation, and gas bubble formation [7,8,9,10,11,12]. Thus, an increasing number of studies have been focused on the intrinsic mechanisms of SLM in recent years. For example, the building direction in the SLM process has an obvious influence on the surface macro-/microstructure of the Inconel 625 parts [13,14]. The columnar structures are elongated with the direction of the temperature gradient [15]. Yang et al. [16] reported that the temperature field and thermal gradient could influence the SLMed samples grain growth of Nickel-based superalloy.
Besides conventional methods, in the field of metallurgy, the concept of solidification control via the magnetic field has been a hot topic for decades [17,18,19]. Recently, some preliminary studies have been reported on the application of static magnetic field (SMF) in AM processes to affect the solidification process. Kang et al. [20] reported that the texture and microstructure could be changed in the SLM of commercially pure Ti with a magnetic field. Shuai et al. [21] found that the columnar to equiaxed transition (CET) of primary Al dendrites was promoted in the laser AM of Al-12Si alloy with SMF, which was attributed to the fragmentation by thermoelectric magnetic force (TEMF) in the solid phase. Nie et al. [22] reported that the magnetic field could potentially eliminate the residual stress in laser additive manufacturing components. Besides, Du et al. [23] reported a decreased pore density for AlSi10Mg in the SLM with SMF due to magnetic damping of convection, and the volume force imposed on the cellular dendrite reached 105 N/m3. The abovementioned results show that the SMF does have a considerable impact on the microstructure of SLM samples. However, the mechanism analysis of the influence of SMF on the SLM process is not fully understood.
In the past, the research on the SLM process was limited to the fluid flow and heat transfer in the molten pool. Numerical simulations and experiments in different scales—molten pool scale and dendrite scale are challenging consider simultaneously. In this work, we perform multi-scale studies for the SLM process of Inconel 625 superalloy under different magnetic field intensities and laser process conditions. The magnetic damping effect and Marangoni effect were studied on the molten pool scale, and the TEMF and thermoelectric magnetic flow were studied on the dendrite scale. Meanwhile, the SLM experiment under the static magnetic field was conducted to verify the numerical models at the molten pool and dendritic scales.

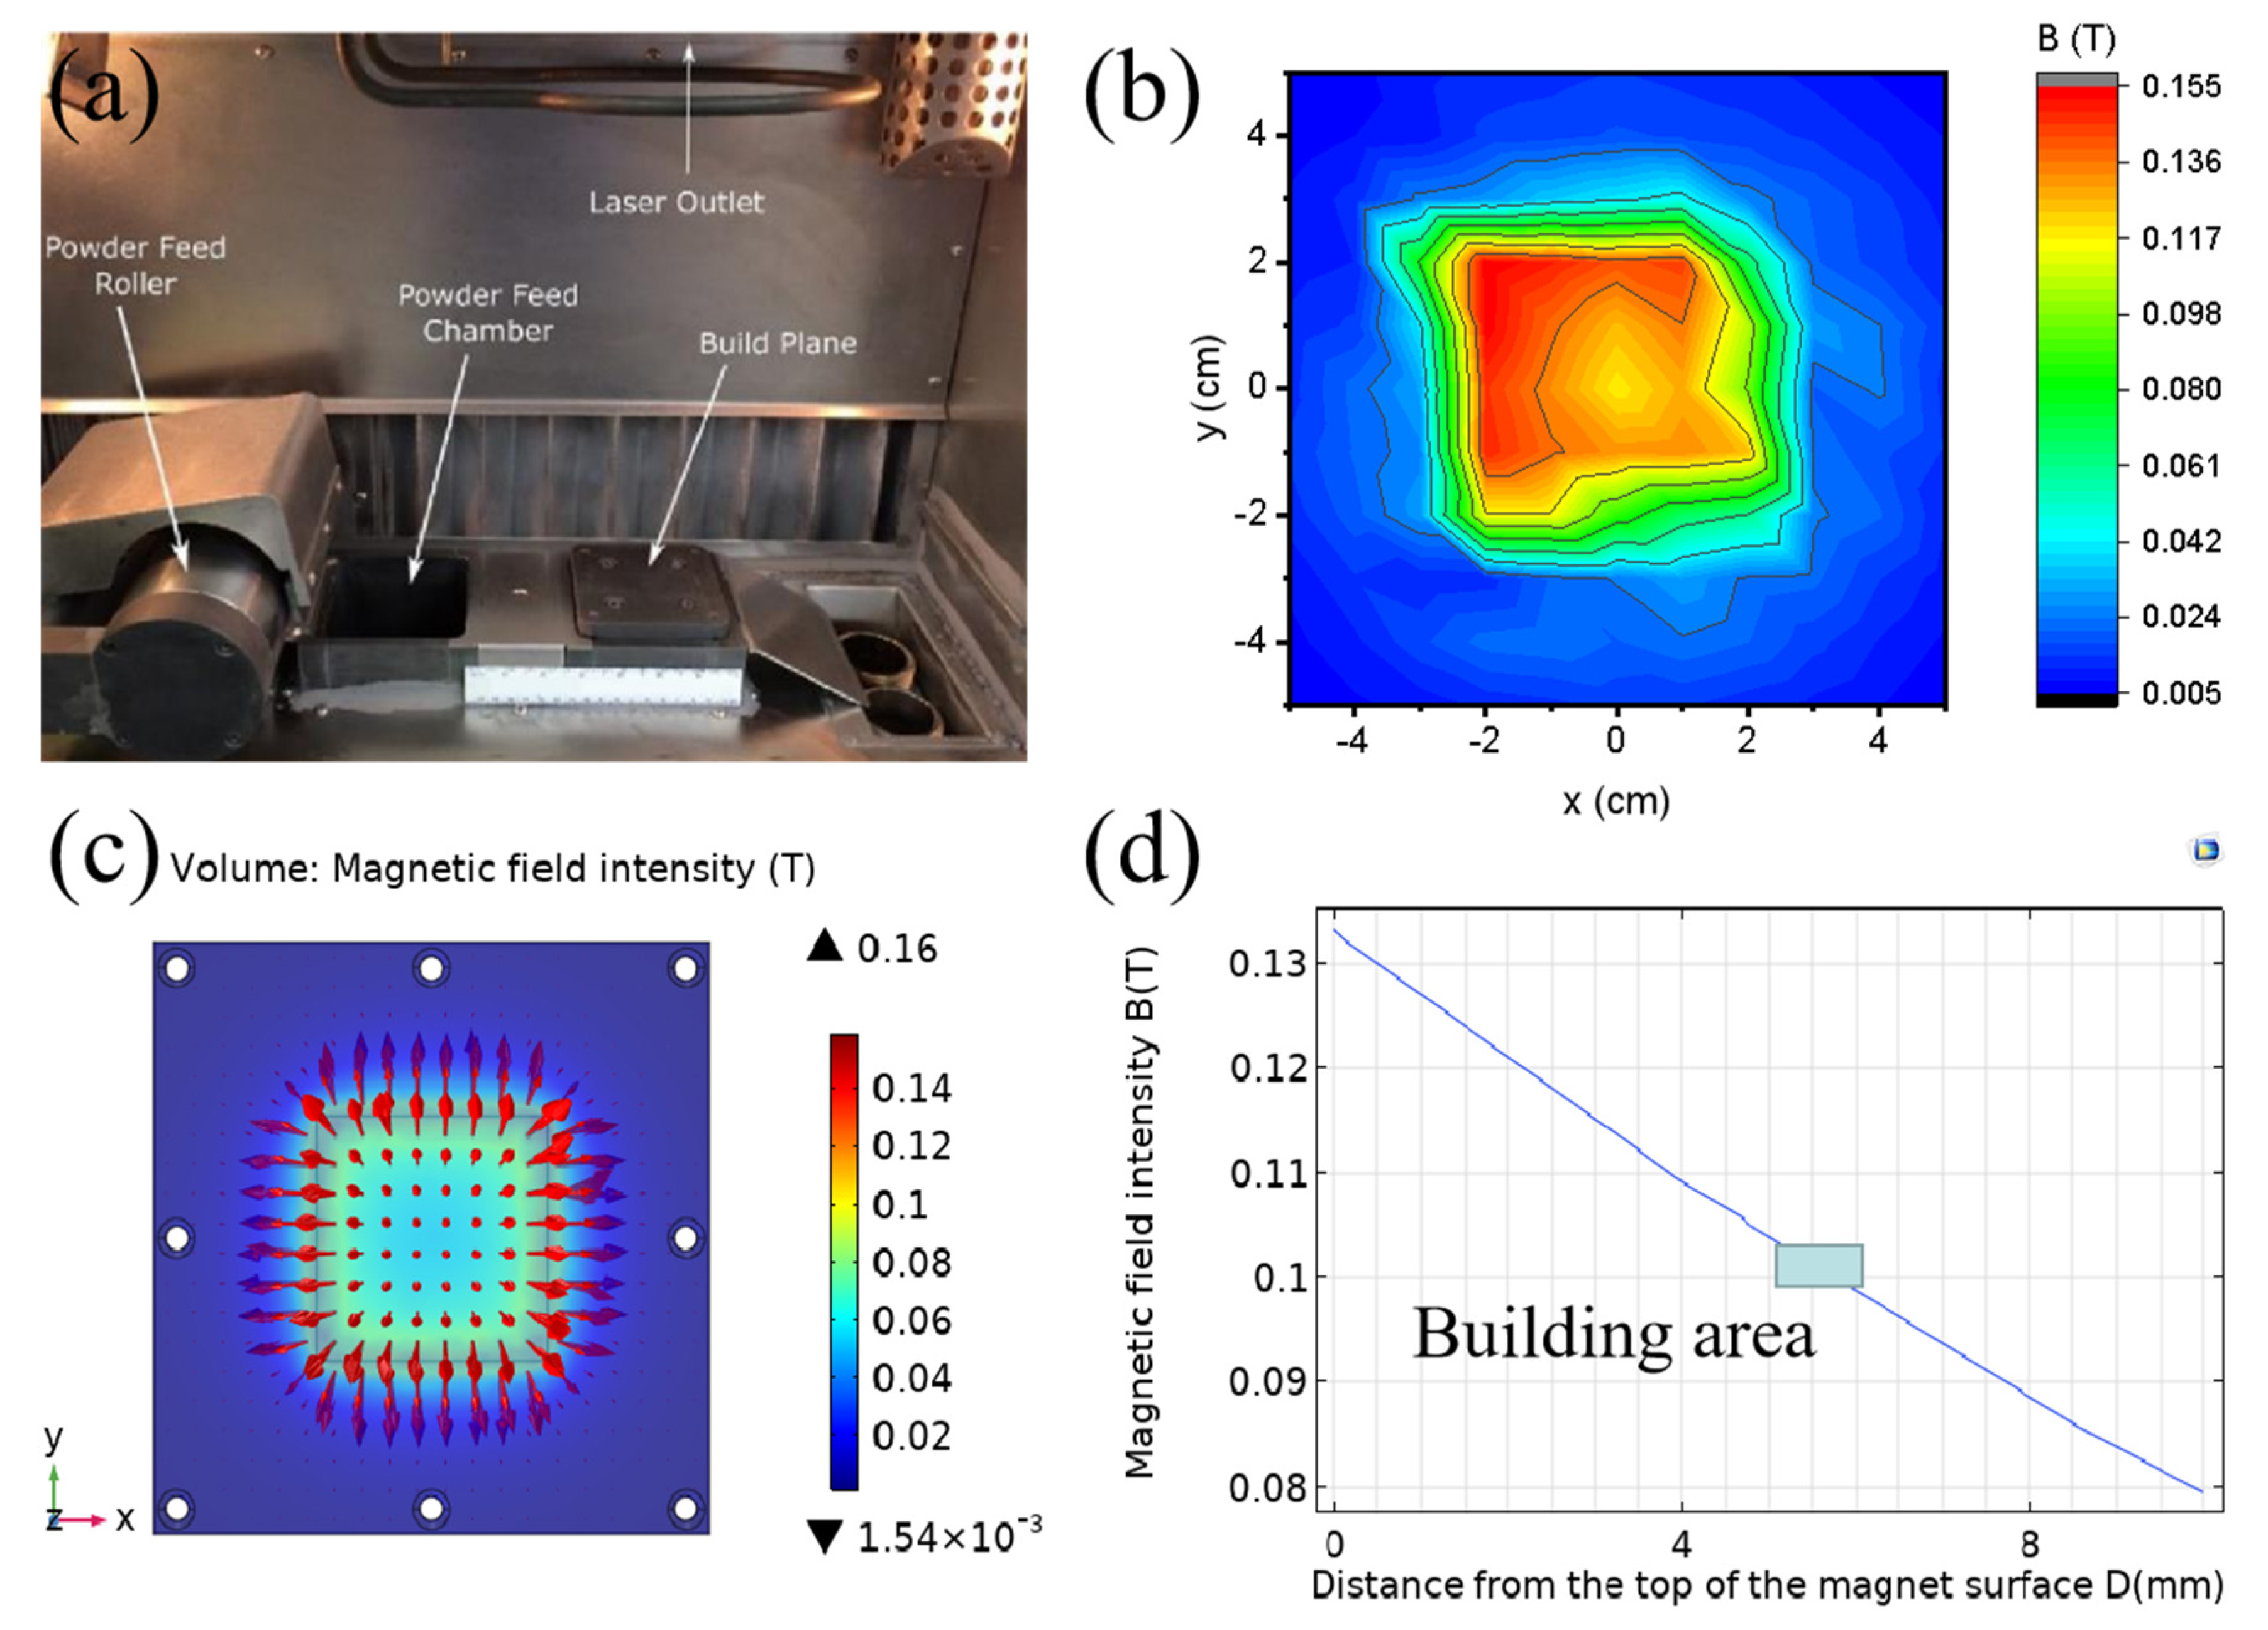
2. Experimental Methods

In the experiment, Inconel 625 superalloy was used as powder material. The SLM process was conducted using ProX 200 rapid forming equipment (3D systems, Rock Hill, SC, USA) as shown in Figure 1a, consisting of a 300 W optical fiber laser (spot diameter of 75 μm), optical path system, control gas purification system, and forming system. SLM process parameters were adopted as follows: laser power of 200 W and laser scan velocity of 800 mm/s. Cubic parts with the dimensions of 5 mm × 5 mm × 5 mm were built for the microstructure observation and validation of the numerical model.
To obtain the magnetic field in the SLM process, a cuboid-shaped permanent magnet with a size of 50 mm × 50 mm × 10 mm was assembled about 5 mm below the platform. The magnetic field intensity on the surface of the substrate was measured by Tesla meter (see Figure 1b), and the spatial distribution of the magnetic field around the substrate was numerically simulated using a finite element method. As shown in Figure 1c,d, it can be seen that the maximum magnetic field intensity on the platform was about 0.16 T, which was distributed at the substrate directly above the edge of the magnetic block. The magnetic field direction was parallel to the building direction in the center of the platform, and the magnitude of the magnetic field intensity was about 0.1 T for the deposited area (see Figure 1d).
Before the microstructure characterization, the sample was ground using sandpapers with different grit sizes (80, 150, 240, 600, 1200, 2500, 3000), then polished with a diamond suspension and cleaned in an ethanol bath with ultrasounds. The polished samples were etched by the popular reagent, a solution consisting of 8 g FeCl3, 24 mL HCl, and 21 mL water with an exposure time of 10 s. Microstructure analysis was carried out by a high-resolution scanning electron microscope (FEI QUENTA 450, FEI, Hillsboro, OR, USA) equipped with X-ray energy dispersive spectroscopy.

3. Numerical Modeling

3.1. Modeling of Molten Pool and Dendrite of SLM

The numerical simulations were performed using the finite-element-based commercial code COMSOL Multiphysics V5.5. A schematic 3D model of the SLM process is presented in Figure 2. The dimensions of the physical model are 0.1 mm × 0.4 mm × 0.3 mm, which was discretized with a tetrahedral mesh of 5 μm. A moving molten pool was generated within the metal powder bed under a moving laser beam conforming to the Gaussian distribution.
In order to understand the problem systematically, the temperature field and fluid flow around the dendrite in the solid–liquid interface is considered in the present work. As illustrated in Figure 2, the numerical model and the boundary conditions of the dendrite-scale model were established based on the specific mushy zone from the results of the molten pool scale model. In order to further study the heat transfer and flow around the dendrite, the dendrite in the molten pool can be divided into three different regions: the dendrite at the bottom of the molten pool, which is parallel to the longitudinal magnetic field; the dendrite at the top region of the molten pool, which is perpendicular to the magnetic field; the dendrite in the middle of the molten pool, which is 45 degrees to the magnetic field; these three regions correspond, respectively, to a, b, and c in Figure 2. According to the experiment results and simulation of the molten pool, the shape and size of dendrite can be determined through the length of the mushy zone, whereas the details are discussed in the results section. The maximum and minimum tetrahedral mesh sizes of the dendrite-scale model are 0.06 μm and 6.0 × 10⁻⁴ μm, respectively.

3.2. Governing Equations and Boundary Conditions

3.2.1. Molten Pool-Scale Model

For modeling the molten pool, the following assumptions are made to simplify the model.
(a)
The flow field within the molten metal is assumed to be Newtonian and incompressible.
(b)
The complex shape and distribution of powders are ignored, and the powder layer is assumed to be flat.
(c)
The heat and mass loss due to vaporization is not considered [24,25].
The thermal, electrical, and hydrodynamic phenomena in a static magnetic field are reproduced with few modifications from the available COMSOL Multiphysics modules by solving the following equations of conservation of mass, momentum, and energy, which are given in Equations (1)–(5), respectively: [26,27,28,29,30,31,32].
Mass :   · · u = 0
Momentum : ρ u t + ρ ( u · ) u = p + μ 2 u + ρ g + J × B
Current flow J is generated from two sources, metallic fluid motion through a magnetic field u × B, voltage induced by variable temperatures, and the difference in Seebeck coefficient S and electrical conductivity σ between the liquid and solid alloy. The electric field can then be calculated from Ohms law:
J = σ ( E + u × B S T )
Energy :   h t + ( u · ) h = 1 ρ ( · λ T ) + q
The mathematical expression of the heat source can be written as
q = 6 A P π H ( r e 2   + r e r l + r l 2 ) e ( 2 · ( x v t ) 2 + y 2 r 0 )
where ρ is the density, u is the velocity field, p is pressure, μ is viscosity, E = 0 denotes the electric field, and the source term J × B represents the Lorentz force imposed by electric current flow J through the static magnetic field B, where B is considered to be uniform throughout the simulation domains. q is the source term to account for the volumetric heat source at a radial distance r from the beam center, re and rl are the radius at the top and bottom, P is the laser power, a value of 37.5 μm is used for r0, which is the laser beam radius, H is the height of heat source model, and A is the absorptance of the material.
At the surfaces of the computation domain, heat exchange takes place between the build and substrate and their surroundings, which are solved through the Equations (6)–(8).
q r = σ ε ( T 4 T 0 4 )
q c = h c ( T T 0 )
q z = k ( T z )
where qr is heat loss due to thermal radiation, qc is heat loss owing to convection, qz is heat loss because of conduction, σ is the Stefan–Boltzmann constant, ε is the emissivity, a value of 80 W/m2 is used for hc which is the convective heat transfer coefficient, T is the surface temperature, T0 is the room temperature, and k is the effective thermal conductivity of the material.
The convective flow of the molten metal is largely driven by the Marangoni force [33,34] generated due to the surface tension variation on the top surface of the molten pool resulting from the spatial gradient of temperature. On the top surface of the molten pool, the temperature gradient has two components along with X and Y directions, i.e., Gx and Gy, respectively. Therefore, the Marangoni shear stresses [34,35,36] along X and Y directions on the top surface of the molten pool can be written as
τ x = μ d u d z = d γ d T G x
τ y = μ d v d z = d γ d T G y

3.2.2. Dendrite-Scale Model

The conservation equations, including Equations (1)–(3) and Equation (11), are solved in the dendrite model. As for the thermal boundary conditions, the temperature in the bottom of the dendrite is defined as solidus temperature Ts. According to the temperature gradient G at the dendrite from the molten pool and length of dendrite d, the temperature at the dendrite tip is defined as temperature T = Ts + d × G. Solidus temperature Ts is the temperature at the bottom of the dendrite. The temperature gradient G from the bottom of the dendrite to the top of the dendrite is regarded as constant. The temperature difference between the bottom and top of the dendrite can be calculated by multiplying the length of the dendrite d by the temperature gradient G. In addition, T is the temperature at the top of the dendrite. T and Ts are regarded as the temperature boundary conditions at the top and bottom of the dendrite. The G of 107 K/m, obtained from the mushy zone of the molten pool, is parallel to B, perpendicular to B, and 45° between G and B.
h t + ( u · ) h = 1 ρ ( · λ T )

3.3. Material Properties

The material properties of Inconel 625 superalloy, including density, liquid metal viscosity, thermal conductivity, specific heat, etc., are summarized in Table 1.

4. Results and Discussion

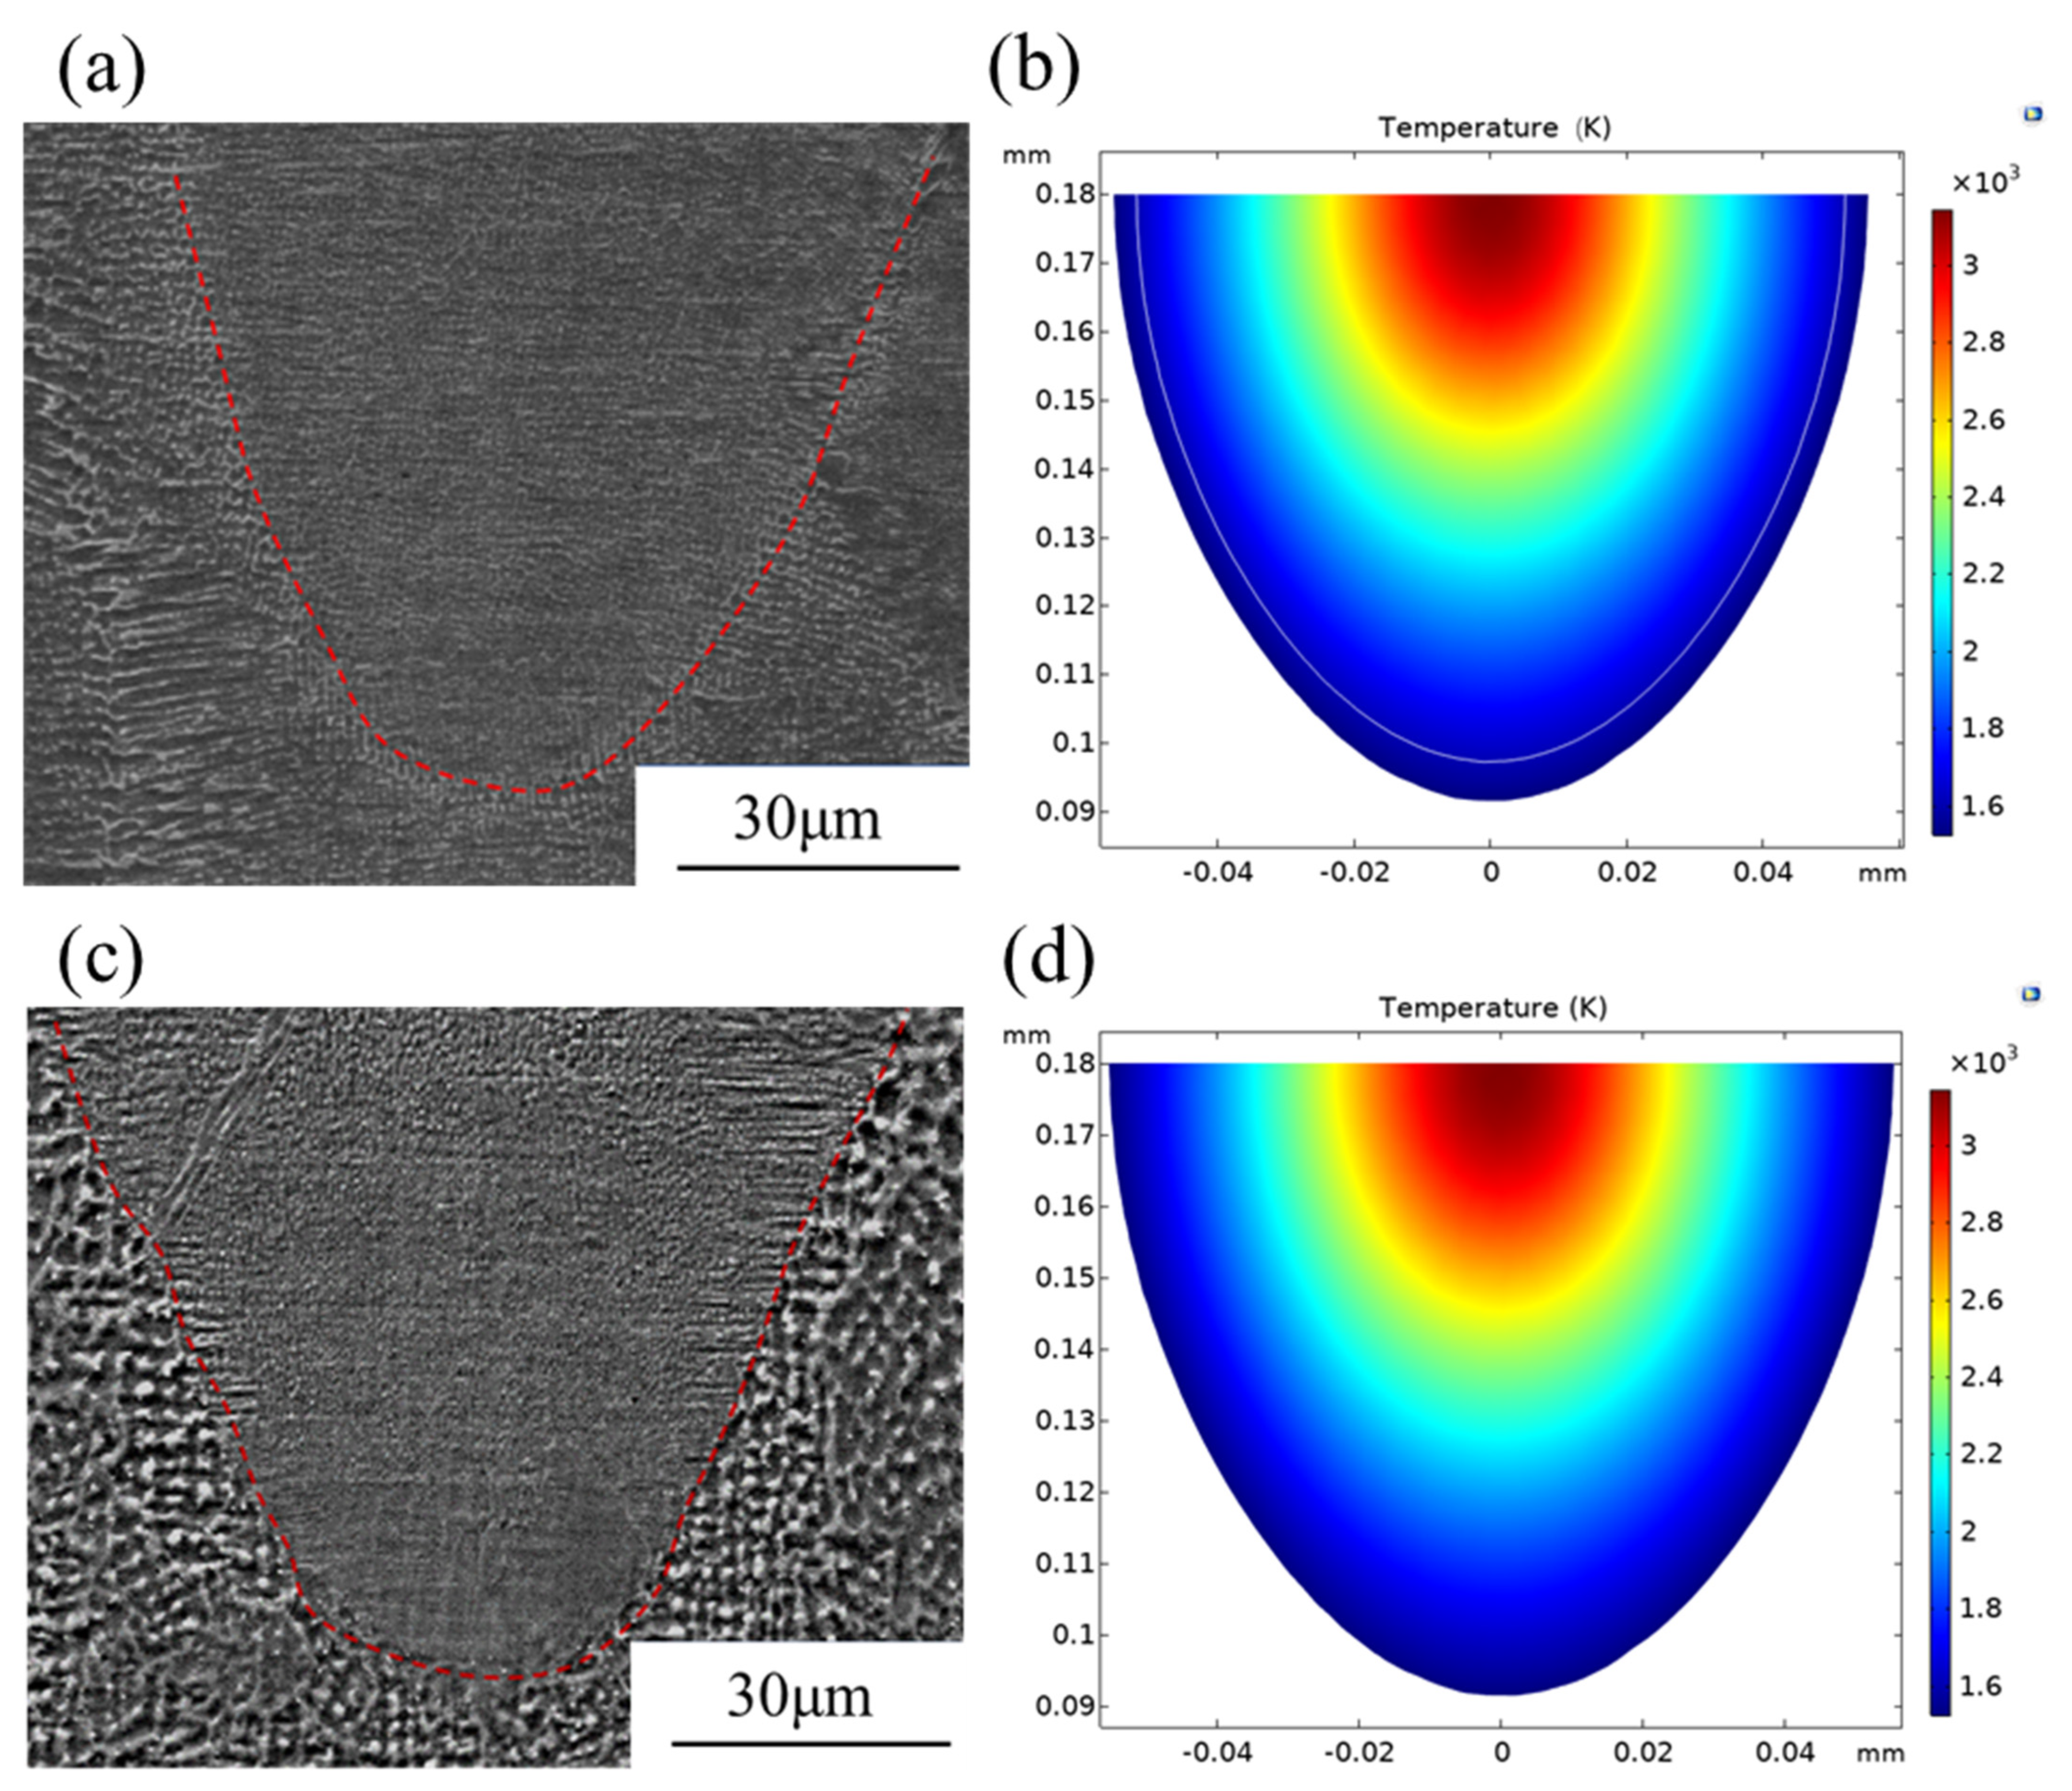
4.1. Validation of the Numerical Model

Firstly, the accuracy of the numerical model is validated via the size of the molten pool from the SLM experiment. As the experimental result shown in Figure 3a indicates, the width and depth of the molten pool through statistics analysis without a magnetic field are 89 μm and 79 μm, while those obtained from the numerical model are 93 μm and 85 μm, respectively. The error of depth value between the simulation and the experimental results is 7.6%, and the error of molten pool width is 4.5%. After applying the magnetic field, it was found that the width and depth of the molten pool from the experimental results are 91 μm and 82 μm. In comparison, the width and depth of the simulation results are 94 μm and 85 μm. The error of depth value between the numerical and the experimental results is 3.7%, and the error of width is 3.3%; the results are given in Figure 3 and Table 2. The simulation results are in good agreement with the experimental results. The relatively low error values between the numerical and experimental results can indicate the validity of the molten pool-scale model.

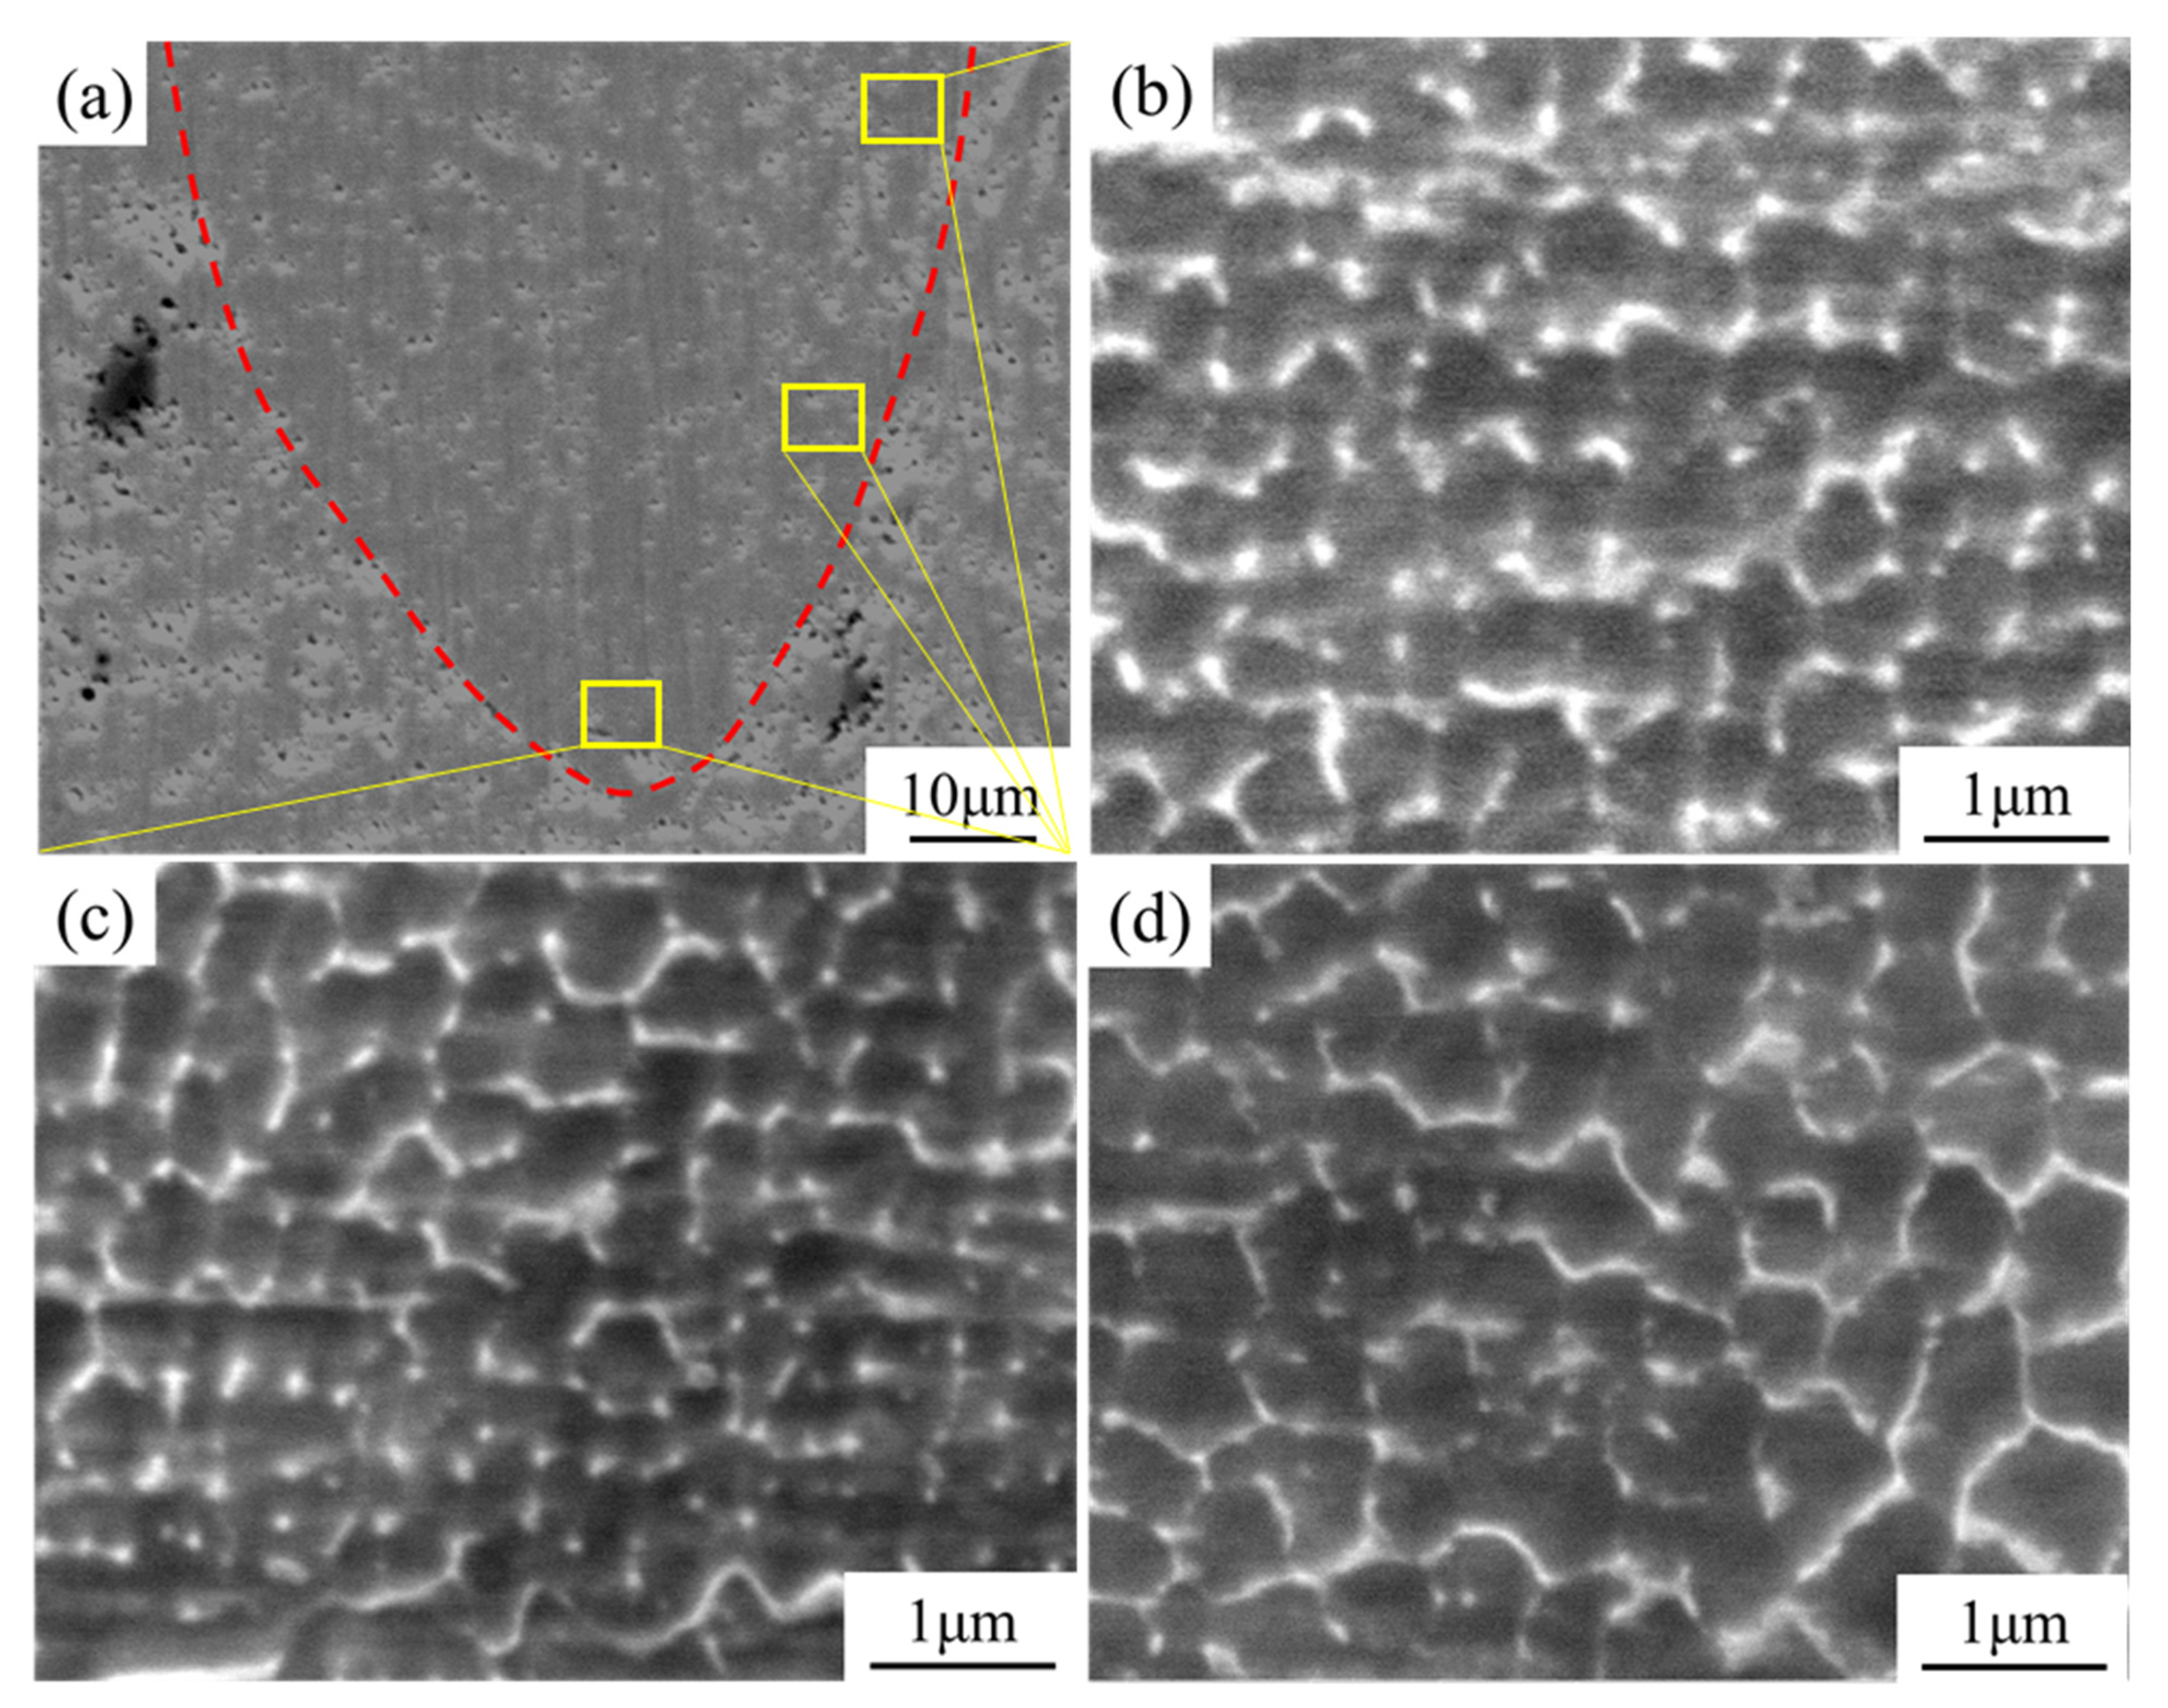
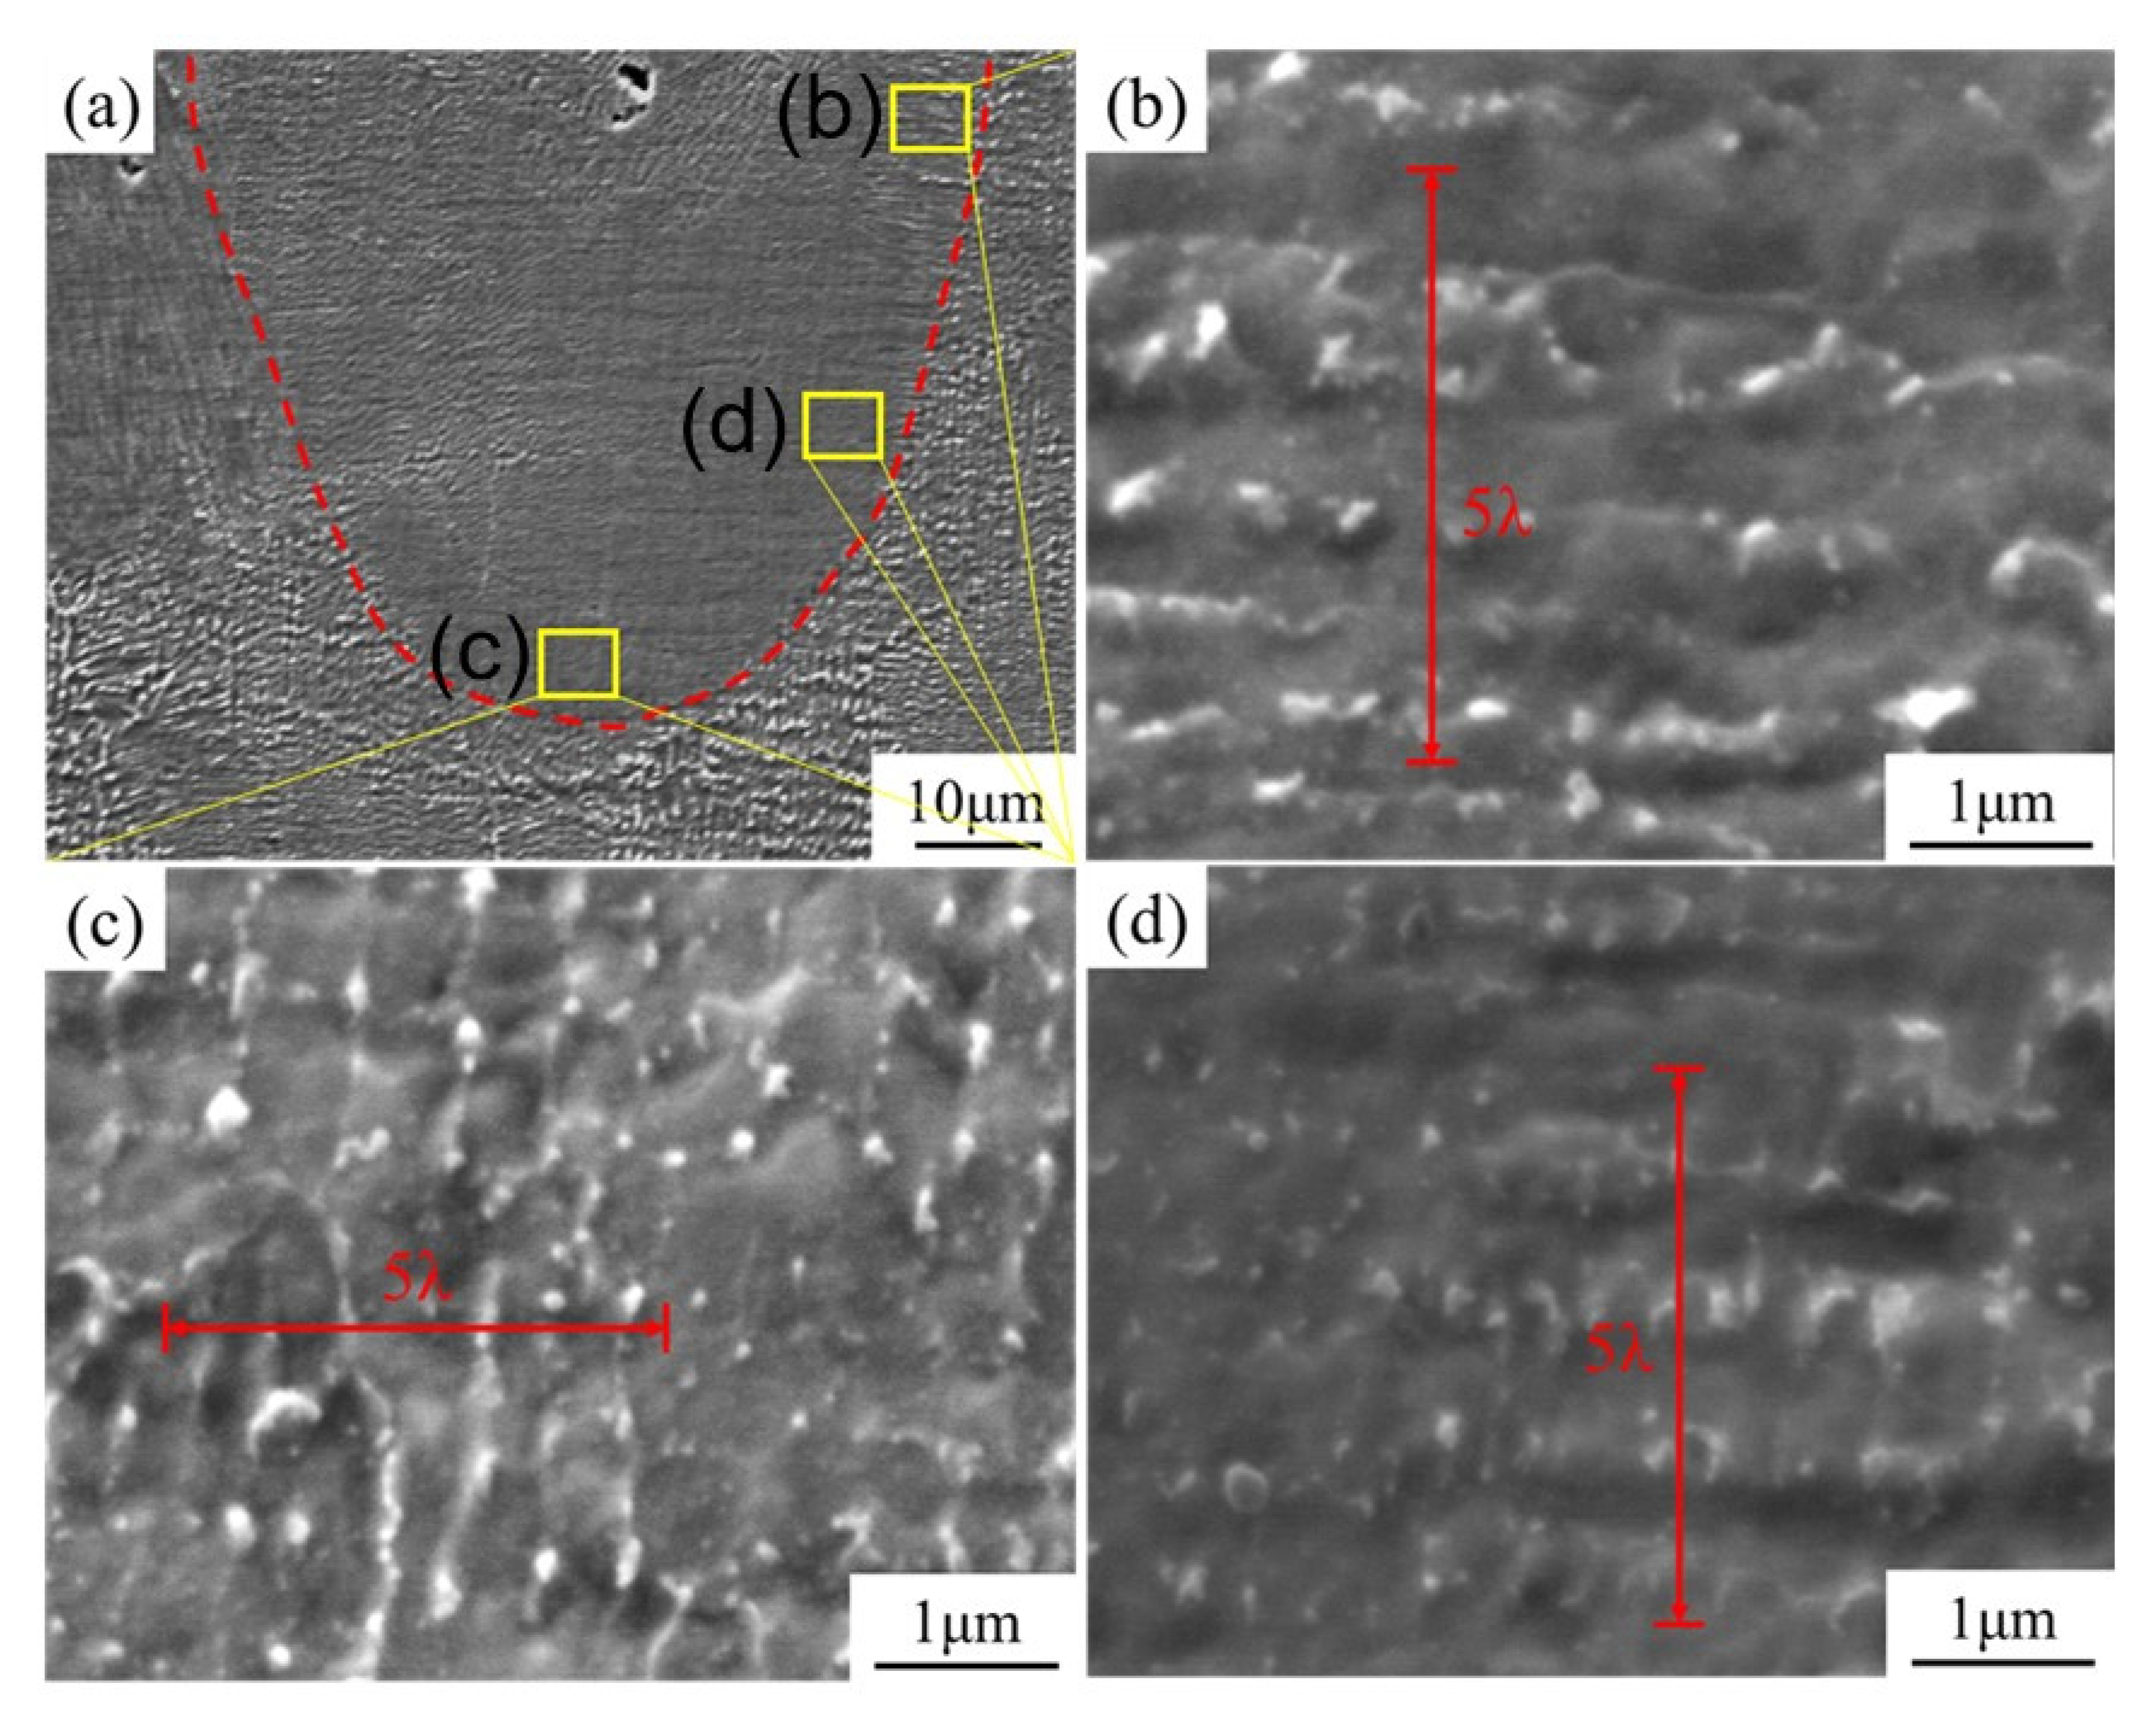
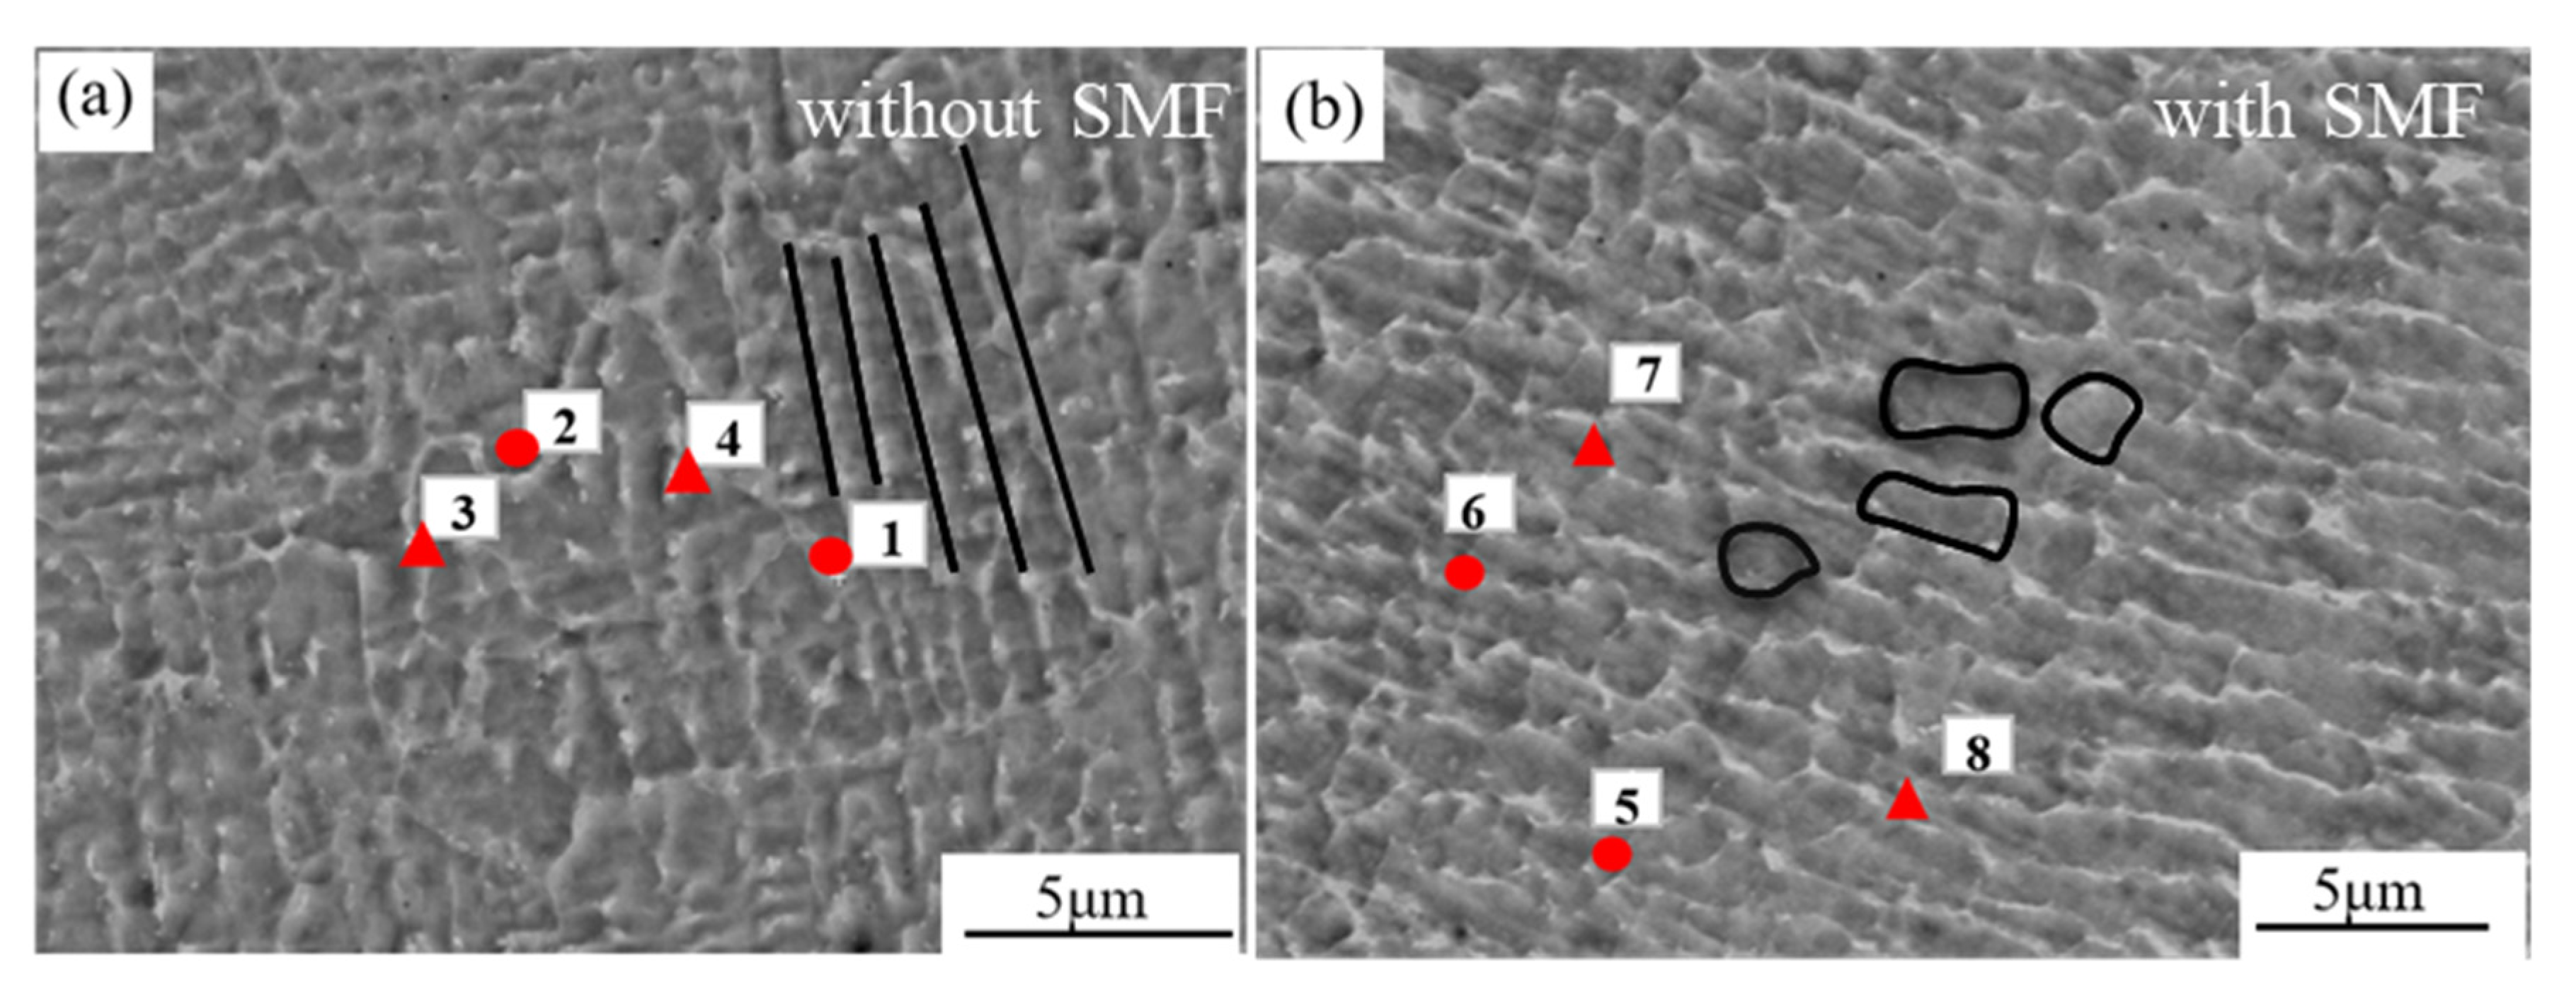
4.2. Microstructure and Laves Phase

The experimental dendrites spacing and the simulated liquidus and solidus spacing can be used as the dendrite diameter and length in the dendrite model, respectively, without considering the influence of the heat-affected zone. These can provide a reasonable size of dendrite modeling.
Figure 4 illustrates the microstructures of SLM-processed Inconel 625 superalloy samples in the absence of a magnetic field. Figure 4a shows the SEM micrographs of the longitudinal planes in the SLM processed Inconel 625 superalloy samples. Figure 4b–d are the magnification views of the square area in Figure 4a, respectively. Dendrite spacing λ can be determined by precipitated phase. The diameter and length of the dendrites are 500 nm and 5 μm, respectively, which is shown in Figure 4 and Figure 3b. From the experimental results, columnar crystal growth always occurs in the experimental results without a magnetic field, which generally grows towards the center of the molten pool, conforming to the characteristics of reverse heat transfer.
Figure 5 illustrates the microstructures of SLM-processed Inconel 625 superalloy samples in a 0.1 T magnetic field. Figure 5a shows the SEM micrographs of the longitudinal planes in the SLM-processed Inconel 625 superalloy samples. Figure 5b–d are the magnifications of the square area in Figure 5a, respectively. It can be clearly seen from Figure 4 that the dendrites grow as columnar crystals without a magnetic field. However, the equiaxed grains can be found under the influence of SMF due to the occurrence of CET. As shown in Figure 5, the equiaxed grains with a diameter of about 300~400 nm can be observed, which is much finer than the original columnar crystal with a width of more than 500 nm and a length of 5000 nm. The effect of TEMF on dendrite growth will be introduced in detail in the later numerical simulation.
EDS characterization was conducted to reveal the change in the laves phase in the SLM Inconel 625 samples with and without SMF. As shown in Figure 6a, two points were selected to measure the matrix phase and precipitate phase, respectively. The precipitate phase is indicated by point 3 and point 4 and matrix phase by point 1 and point 2. The composition of various elements is shown in Table 3. It can also be seen from the element contents in the table that the Nb composition in the precipitated phase is 2–3 times as much as that in the matrix phase, and the amount of Nb is the main difference between the two phases. Besides, black lines in (a) and black circles in (b) indicate the boundary of dendrites in the Figure 6, and it can be seen that the distribution of Laves phase precipitates is along the dendrite. As shown in Figure 6b, the Laves precipitated around equiaxed grains are more uniform than those around columnar grains, which can benefit the mechanical properties. In addition, the composition of the precipitated phase of samples under a magnetic field was analyzed, as shown in Figure 6b. The matrix phase is marked as No. 5 and 6, and the precipitate phase is marked as No. 7 and 8. It can be seen from the results that the Nb content of the precipitated phase is still higher than that of the matrix phase. In addition, compared with element content in Table 3, it can be seen that, under the magnetic field, the precipitation of Nb content is significantly reduced, which indicates that the magnetic field can inhibit the precipitation of Nb, thus reducing the content of the Laves phase.

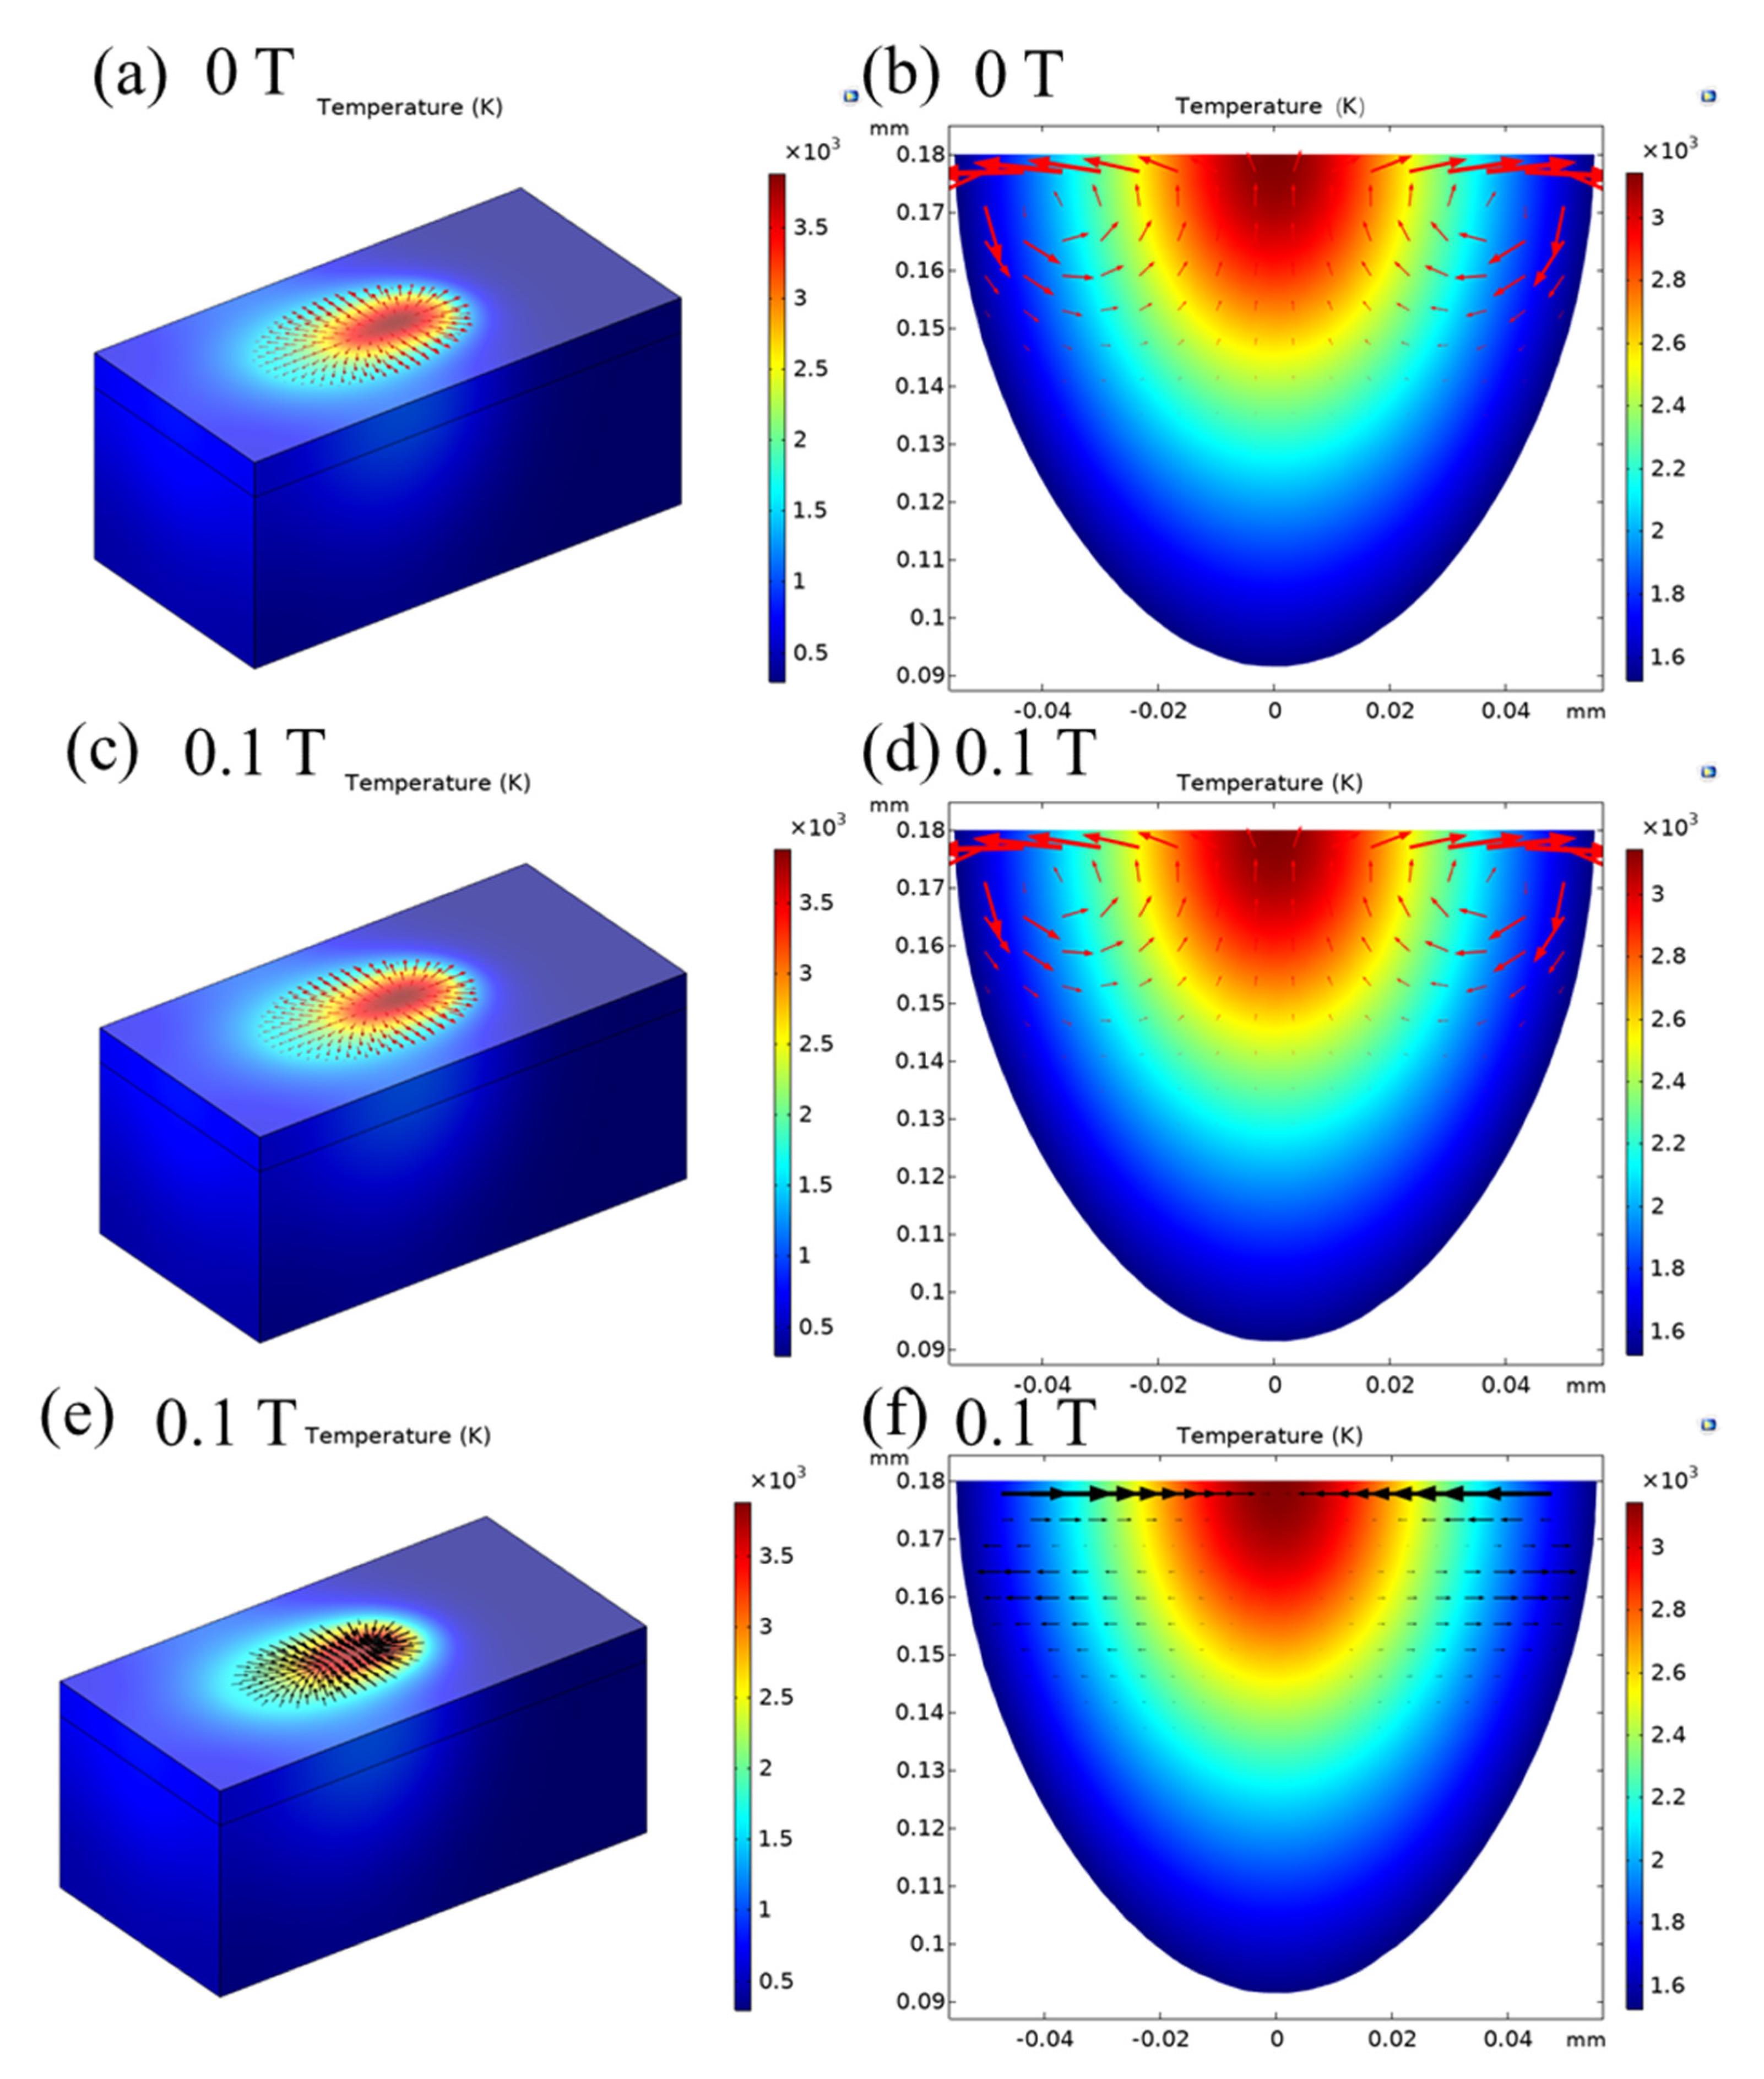
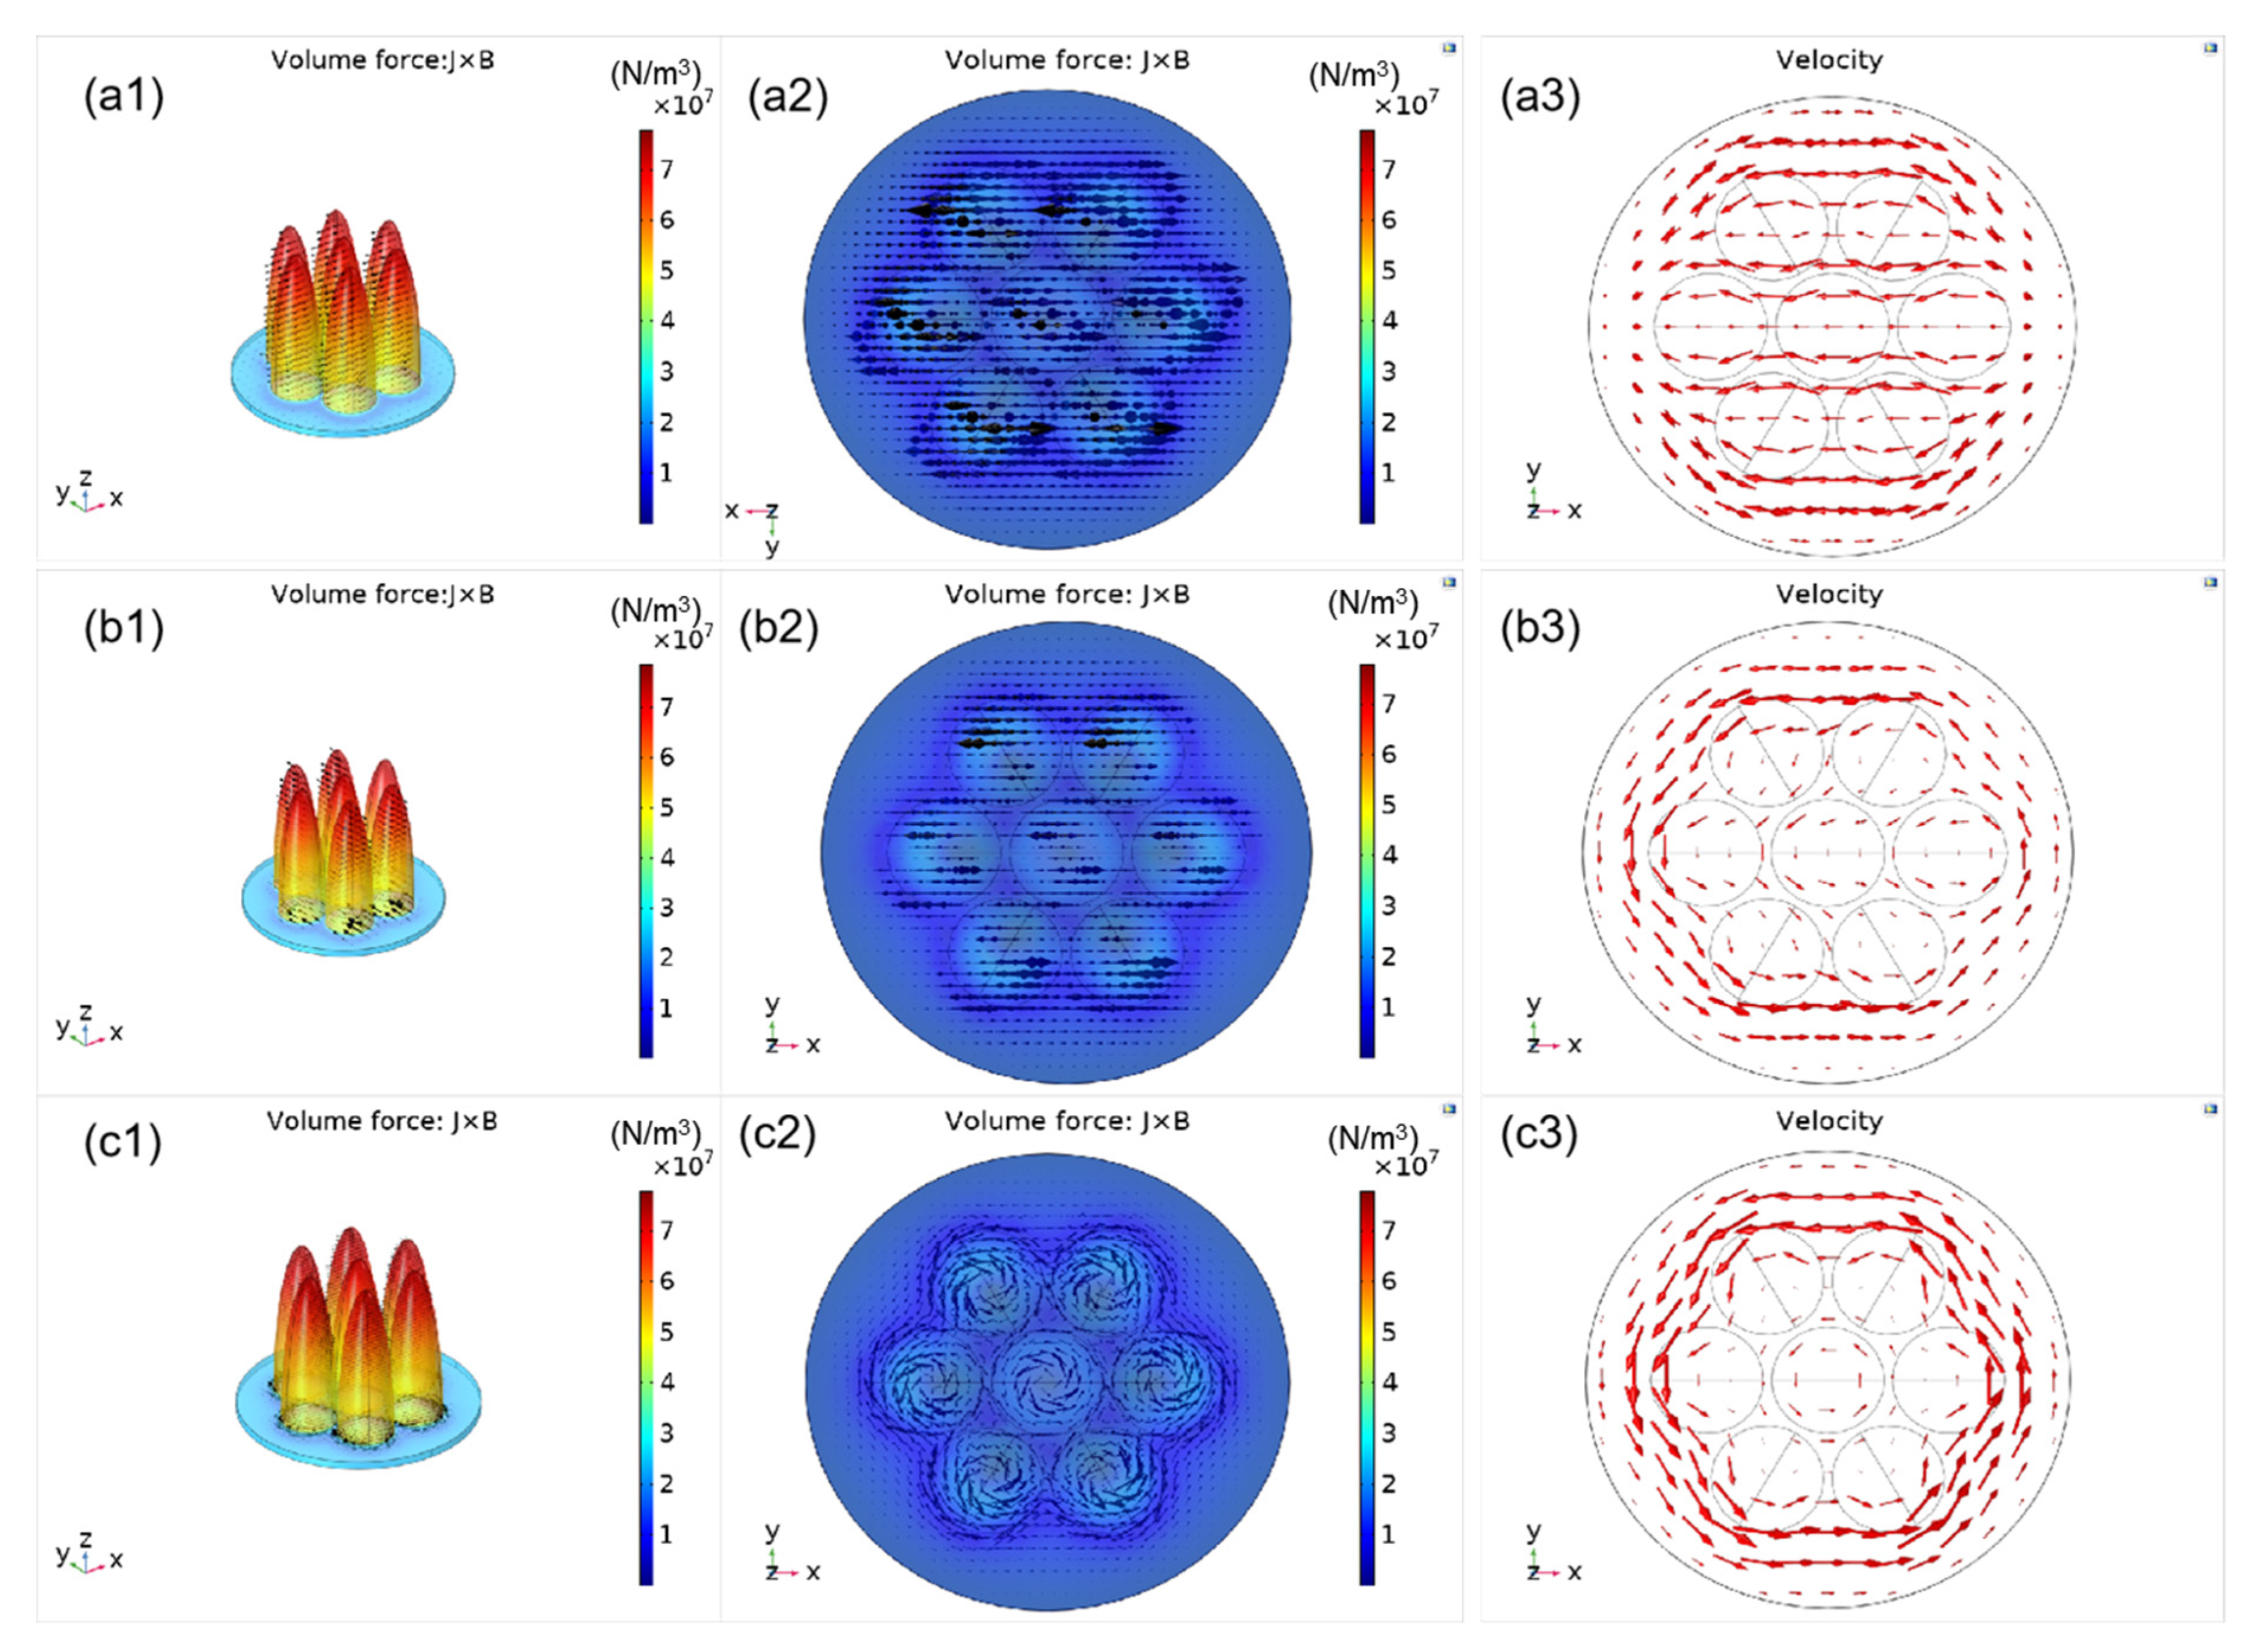
4.3. Numerical Analysis of Molten Pool Dynamics

Figure 7 illustrates the numerical simulation results of fluid flow, Lorentz force, and temperature distribution in the molten pool. Figure 7a,b show the numerical simulation results of temperature distribution and flow of the 3D overviews and central cross-sections without a magnetic field. Figure 7c–f are the numerical simulation results of temperature distribution, flow, and Lorentz force of the 3D overviews and central cross-sections in a 0.1 T magnetic field. The red and black arrows indicate the velocity vector and Lorentz force, respectively. Under the heating of a moving Gaussian laser beam, the metal powder absorbs the heat and generates a moving molten pool. The melt flowing from the center to the edge of the molten pool can be seen in the numerical results due to the Marangoni effect, showing that the maximum value of temperature is about 3.8 × 10³ K and the maximum value of velocity is about 2~3 m/s in Figure 7b. As shown in Figure 7c,e, the directions of the Lorentz force and velocity are opposite; however, the Lorentz force does not change velocity significantly. The Marangoni flow is always dominant. It is possible that a Lorentz force of about 105 N/m3, caused by a weak magnetic field, is not enough to influence the fluid flow in the molten pool.

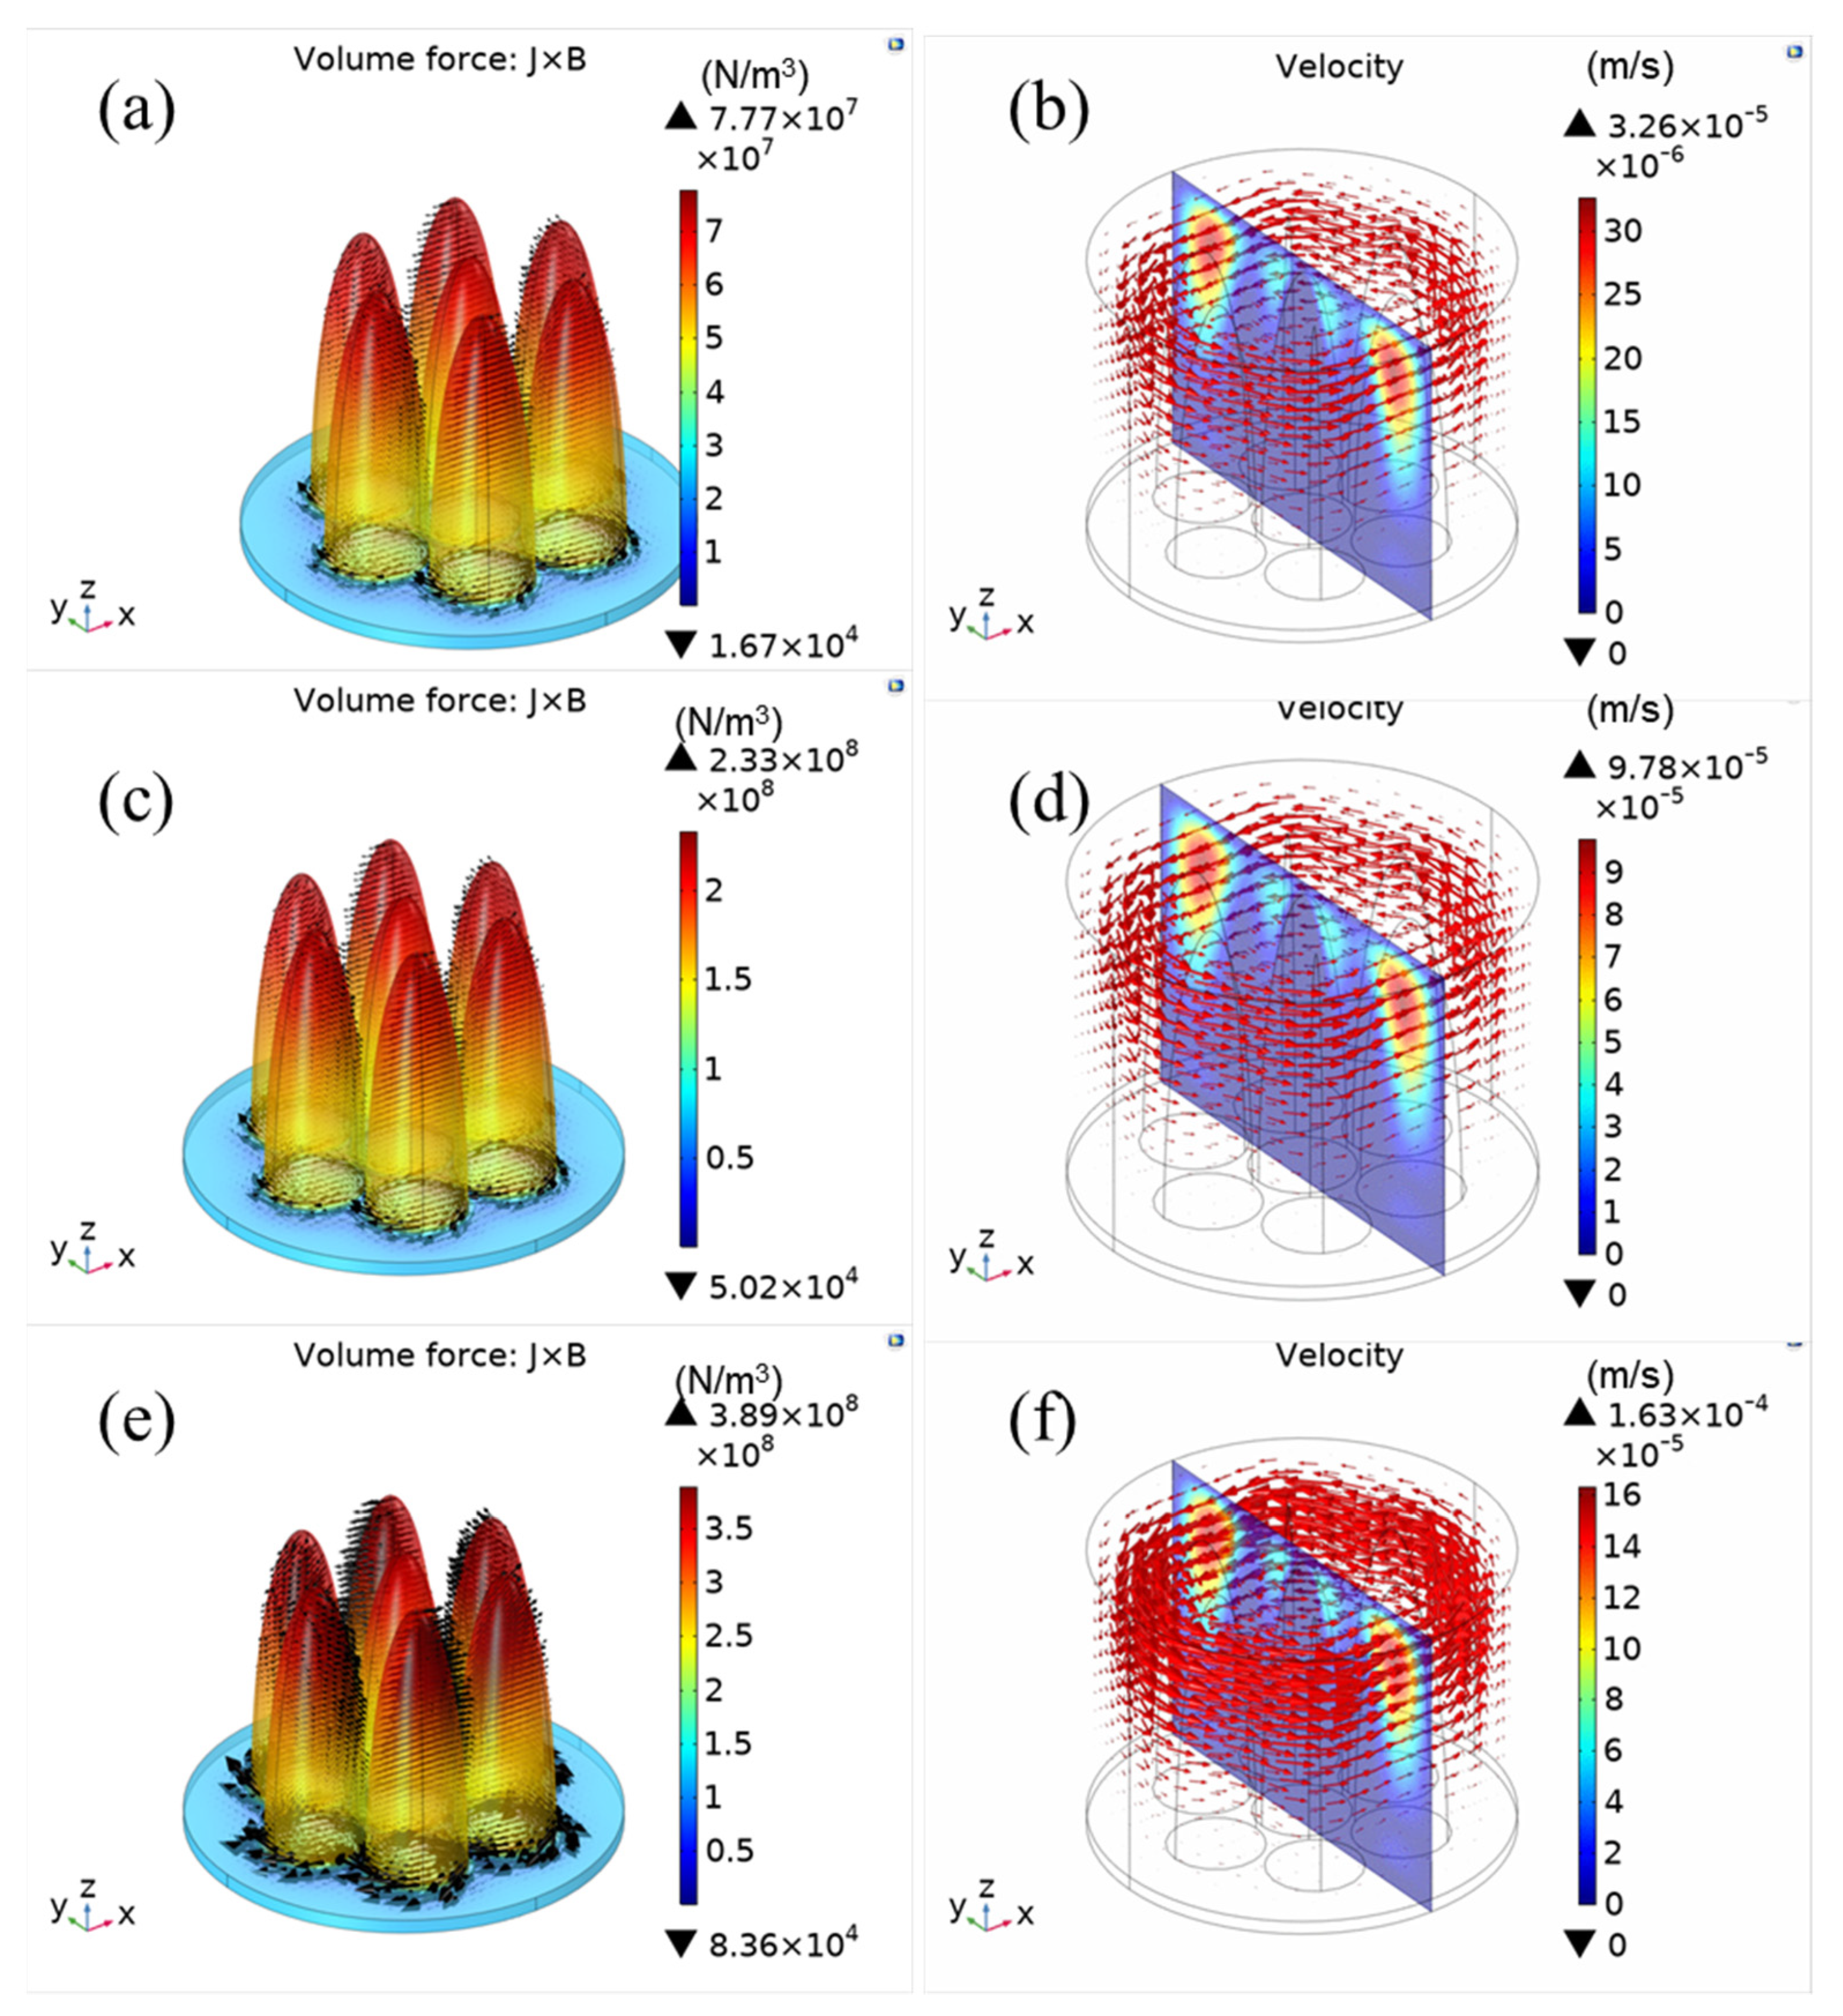
4.4. TEMF on the Interdendritic Region

The dendrites at different positions in the molten pool are shown in Figure 2. Figure 8 shows TEMF and thermoelectric magnetic convection (TEMC) at three different positions in the molten pool. Comparing Figure 8(a2,b2,c2), the direction of TEMF is different. TEMF at the bottom of the molten pool is around the dendrite, but the others are perpendicular to the dendrite direction. Since the temperature gradient of the dendrite at the bottom of the molten pool is parallel to the direction of the magnetic field, the direction of the TEMF will be generated around the dendrite. While the dendrite at the top region of the molten pool is perpendicular to the direction of the magnetic field, so the TEMF will be perpendicular to the dendrite. The dendrites in the middle of the molten pool grow at an angle of 45 degrees between the temperature gradient and the magnetic field direction. As a result, the TEMF will have a component force perpendicular to the dendrites and a component force sur-rounding the dendrites. Dendrites at the bottom of the molten pool are subjected to TEMF around the direction of dendrite growth, which can cause flow around dendrites, as shown in Figure 8(c1,c2,c3). Meanwhile, dendrites in the other regions are influenced by TEMF in the tangential direction. The dendrites at 45 degrees in the middle of the molten pool and at the top region of the molten pool will be subjected to a tangential force, which will make the dendrites subject to bending force and affect the growth of dendrites. In all three cases, the numerical results show that the value of the TEMC is on the order of 10−5~10−6 m/s, and that TEMF is on the order of 107 N/m3 in the mushy zone. The dendrites subjected to TEMF will break up, becoming secondary nucleation and growing to form equiaxed crystals. The Laves phase will precipitate along the dendrites, and the original columnar crystal will be transformed into equiaxed crystal growth under the influence of TEMF and, therefore, the Laves phase will be more evenly distributed than that without magnetic field, which indicates that TEMC can homogenize the Laves phase distribution, as shown in Figure 5. The effect of the magnetic field on the flow in the molten pool is not very obvious. However, it is obvious that the weak magnetic field impacts the dendrite.
Besides, TEMF around dendrites is also different under different laser parameters, which are determined by the temperature gradient caused by different laser parameters. Figure 9 provides the numerical simulation of the dendrite scale of the different scanning speeds. Figure 9a,c,e,g show the TEMF, and Figure 9b,d,f,h show the TEMC. The temperature gradient increases with the increase in laser energy density, which leads to an increasing TEMF. The temperature gradient in the edge of the molten pool decreases with the increase in scanning speed when the laser power is constant. As shown in Figure 9, TEMF decreases from 1.07 × 10⁸ to 8.75 × 10⁷ N/m3 with the increase in laser speed when the laser power is constant due to the reason that TEMF is proportional to the temperature gradient. Figure 10 shows results with different laser powers. As shown in Figure 10a,c,e,g, the TEMF increases from 7.77 × 10⁷ to 8.75 × 10⁷ N/m3 with the increase in laser power when the laser scanning speed is constant.
The fluid flow and heat transfer around dendrites under different magnetic fields are considered, such as 0.1 T, 0.3 T, and 0.5 T. Figure 11 provides the numerical simulation of dendrite scale of the different magnetic field intensities. Figure 11a,c,e show the TEMF, and Figure 11b,d,f show the TEMC. The dendrites under different magnetic fields will also be subjected to different TEMFs because the TEMF is proportional to the strength of the magnetic field. The TEMF also increases from 7.77 × 10⁷ to 3.89 × 10⁸ N/m3 with the increase in magnetic field from 0.1 T to 0.5 T. The simulation shows that the thermoelectric current is highest at the solid–liquid interface, resulting in a maximum TEMF at the solid–liquid interface; as a result, this affects the dendrite morphology and promotes CET, which is shown in Figure 11.

5. Conclusions

Two scales, including the molten pool and the cellular dendrite in the SLM, were separately considered by numerical simulation and experimentation to understand the influence of a static magnetic field on the molten pool and microstructure during SLM. The major conclusions are drawn as follows:
  • From comparison of simulation results and experimental results, the size of the molten pool of the simulation results is in good agreement with the experimental results. Meanwhile, the dendrite size obtained in the experiment is employed for setting up the dendrite geometry in the dendrite numerical simulation;
  • From the simulation results of the molten pool, the dimension of the molten pool, the flow field, and the temperature field do not have an obvious change under the influence of the Lorentz force;
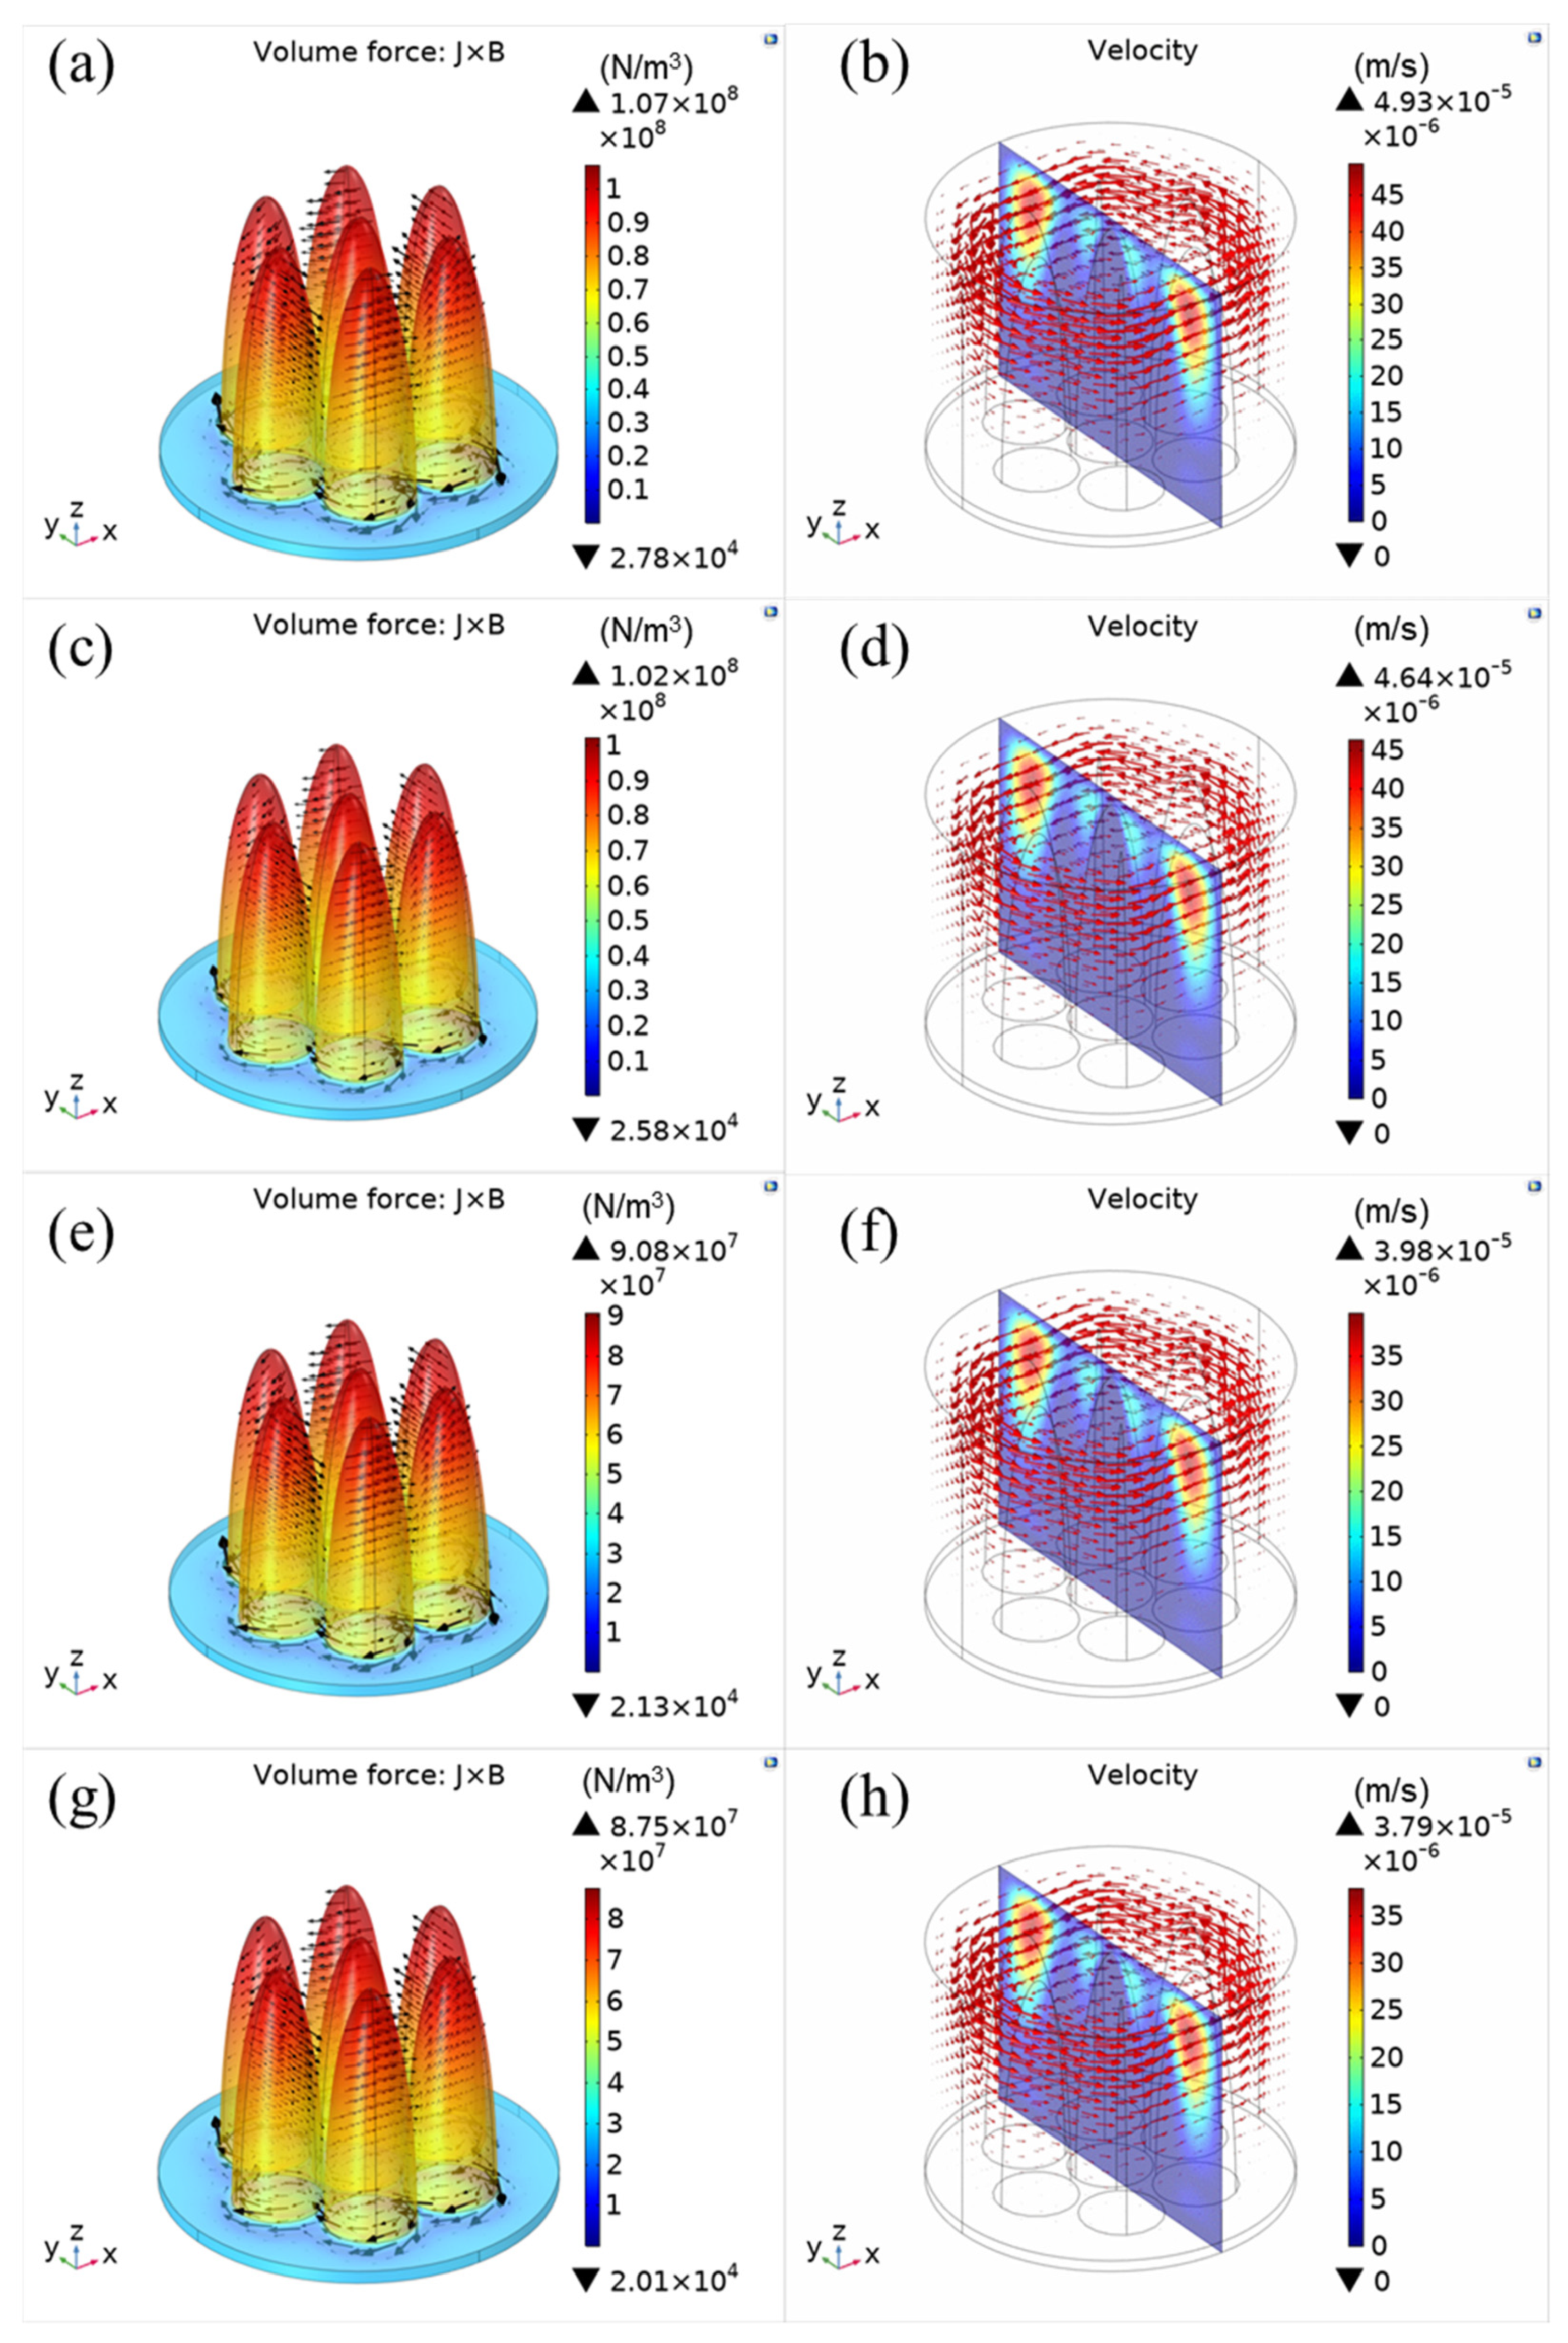
  • From the simulation results of dendrites, dendrites in different areas are affected by the TEMF of different directions because the direction of the magnetic field and the TEMF is about 107~108 N/m3. Dendrites in different parameters of SLM suffered from TEMF because SLM will generate different temperature gradients. TEMF is strengthened with the increase in temperature gradient and intensity of the magnetic field;
  • From the experimental results of SEM, the dendrite was broken and CET will emerge under the influence of the TEMF in the solid phase. The simulation shows that the thermoelectric current is highest at the solid–liquid interface, resulting in a maximum TEMF at the solid–liquid interface, and, as a result, this affects the dendrite morphology and promotes CET, which is also shown in the experiment results under 0.1 T;
  • The distribution of the Laves phase is more uniform under a magnetic field than that without a magnetic field, since the Laves phase precipitates along the grain boundary. From the experimental results of EDS analysis, Nb precipitation reduces from 8.65% to 4.34% under an SMF of 0.1 T.

Author Contributions

Conceptualization, J.W., H.L. and Z.R.; methodology, L.S. and S.X.; validation, S.S., T.H.; writing—original draft preparation, W.Z.; writing—review and editing, C.C., T.H. and S.Y. All authors have read and agreed to the published version of the manuscript.

Funding

This work was supported by the National Natural Science Foundation of China [grant number 52001191]; the Shanghai Science and Technology Committee of China [grant number 19DZ1100704]; Shanghai Rising-Star Program of China [grant number 20QA1403800]; Shanghai Shuguang Program [grant number 20SG42]; and the Open Project of State Key Laboratory of Advanced Special Steel, Shanghai Key Laboratory of Advanced Ferrometallurgy, Shanghai University [grant number SKLASS 2019-14 and SKLASS 2020-08] and the Science and Technology Commission of Shanghai Municipality [grant number 19DZ2270200].

Institutional Review Board Statement

Not applicable.

Data Availability Statement

Not applicable.

Conflicts of Interest

The authors declare no conflict of interest.

References

  1. Berman, B. 3-D printing: The new industrial revolution. Bus. Horiz. 2012, 55, 155–162. [Google Scholar] [CrossRef]
  2. Yang, N.; Tian, Y.; Zhang, D. Novel real function based method to construct heterogeneous porous scaffolds and additive manufacturing for use in medical engineering. Med. Eng. Phys. 2015, 37, 1037–1046. [Google Scholar] [CrossRef] [PubMed]
  3. Barbas, A.; Bonnet, A.S.; Lipinski, P.; Pesci, R.; Dubois, G. Development and mechanical characterization of porous titanium bone substitutes. J. Mech. Behav. Biomed. Mater. 2012, 9, 34–44. [Google Scholar] [CrossRef] [PubMed] [Green Version]
  4. Prasad, S.V.; Asthana, R. Aluminum metal–matrix composites for automotive applications: Tribological considerations. Tribol. Lett. 2004, 17, 445–453. [Google Scholar] [CrossRef]
  5. Santhosh Kumar, S.; Seshu Bai, V.; Rajkumar, K.V.; Sharma, G.K.; Jayakumar, T.; Rajasekharan, T. Elastic modulus of Al–Si/SiC metal matrix composites as a function of volume fraction. J. Phys. D-Appl. Phys. 2009, 42, 175504–175513. [Google Scholar] [CrossRef]
  6. Kumar, S.S.; Bai, V.S.; Rajasekharan, T. Aluminum matrix composites by pressureless infiltration: The metallurgical and physical properties. J. Phys. D-Appl. Phys. 2008, 41, 169801–169808. [Google Scholar] [CrossRef]
  7. Cook, P.S.; Murphy, A.B. Simulation of melt pool behaviour during additive manufacturing: Underlying physics and progress. Addit. Manuf. 2020, 31, 100909. [Google Scholar] [CrossRef]
  8. Fisk, M.; Lundbäck, A.; Edberg, J.; Zhou, J.M. Simulation of microstructural evolution during repair welding of an IN718 plate. Finite Elem. Anal. Des. 2016, 120, 92–101. [Google Scholar] [CrossRef]
  9. Yu, Z.-Q.; Ma, Q.; Lin, Z.-Q. Simulation and analysis of microstructure evolution of IN718 in rotary forgings by FEM. J. Shanghai Jiao Tong Univ. 2008, 13, 721–726. [Google Scholar] [CrossRef]
  10. Sung, P.K.; Poirier, D.R.; Felicelli, S.D.; Poirier, E.J.; Ahmed, A. Simulations of microporosity in IN718 equiaxed investment castings. J. Cryst. Growth 2001, 226, 363–377. [Google Scholar] [CrossRef]
  11. Raghavan, N.; Dehoff, R.; Pannala, S.; Simunovic, S.; Kirka, M.; Turner, J.; Carlson, N.; Babu, S.S. Numerical modeling of heat-transfer and the influence of process parameters on tailoring the grain morphology of IN718 in electron beam additive manufacturing. Acta Mater. 2016, 112, 303–314. [Google Scholar] [CrossRef] [Green Version]
  12. Zhou, W.; Fan, Y.; Zhang, P.; Yin, Y.; Zhou, J. Numerical simulation and optimization of the hot isostatic pressure process of a part of aircraft structure. Procedia Manuf. 2019, 37, 138–145. [Google Scholar] [CrossRef]
  13. Leary, M.; Mazur, M.; Williams, H.; Yang, E.; Alghamdi, A.; Lozanovski, B.; Zhang, X.; Shidid, D.; Farahbod-Sternahl, L.; Witt, G.; et al. Inconel 625 lattice structures manufactured by selective laser melting (SLM): Mechanical properties, deformation and failure modes. Mater. Des. 2018, 157, 179–199. [Google Scholar] [CrossRef]
  14. Yan, X.; Gao, S.; Chang, C.; Huang, J.; Khanlari, K.; Dong, D.; Ma, W.; Fenineche, N.; Liao, H.; Liu, M. Effect of building directions on the surface roughness, microstructure, and tribological properties of selective laser melted Inconel 625. J. Mater. Process. Technol. 2021, 288, 116878. [Google Scholar] [CrossRef]
  15. Cao, M.; Zhang, D.; Gao, Y.; Chen, R.; Huang, G.; Feng, Z.; Poprawe, R.; Schleifenbaum, J.H.; Ziegler, S. The effect of homogenization temperature on the microstructure and high temperature mechanical performance of SLM-fabricated IN718 alloy. Mater. Sci. Eng. A-Struct. Mater. Prop. Microstruct. Process. 2021, 801, 140427. [Google Scholar] [CrossRef]
  16. Yang, J.; Li, F.; Pan, A.; Yang, H.; Zhao, C.; Huang, W.; Wang, Z.; Zeng, X.; Zhang, X. Microstructure and grain growth direction of SRR99 single-crystal superalloy by selective laser melting. J. Alloy. Compd. 2019, 808, 151740. [Google Scholar] [CrossRef]
  17. Wang, J.; Fautrelle, Y.; Ren, Z.; Nguyen-Thi, H.; Salloum Abou Jaoude, G.; Reinhart, G.; Mangelinck-Noël, N.; Kaldre, I. Thermoelectric magnetic flows in melt during directional solidification. Appl. Phys. Lett. 2014, 104, 121916. [Google Scholar]
  18. Li, X.; Ren, Z.; Fautrelle, Y. Effect of an axial high magnetic field on the microstructure in directionally solidified Pb–Sn eutectic alloy. J. Cryst. Growth 2008, 310, 3584–3589. [Google Scholar] [CrossRef]
  19. Wang, J.; Ren, Z.; Fautrelle, Y.; Li, X.; Nguyen-Thi, H.; Mangelinck-Noel, N.; Jaoude, G.S.A.; Zhong, Y.; Kaldre, I.; Bojarevics, A. Modification of liquid/solid interface shape in directionally solidifying Al–Cu alloys by a transverse magnetic field. J. Mater. Sci. 2012, 48, 213–219. [Google Scholar] [CrossRef] [Green Version]
  20. Kang, N.; Yuan, H.; Coddet, P.; Ren, Z.; Bernage, C.; Liao, H.; Coddet, C. On the texture, phase and tensile properties of commercially pure Ti produced via selective laser melting assisted by static magnetic field. Mater. Sci. Eng. C-Mater. Biol. Appl. 2017, 70, 405–407. [Google Scholar] [CrossRef]
  21. Sansan, S.; Xin, L.; Wuquan, X.; Jianbo, Y.; Jiang, W.; Zhongming, R. Effect of Transverse Static Magnetic Field on Microstructure of Al-12%Si Alloys Fabricated by Powder-Blow Additive Manufacturing. Acta Metall. Sin. 2018, 54, 918–926. [Google Scholar]
  22. Nie, J.; Chen, C.; Shuai, S.; Liu, X.; Zhao, R.; Wang, J.; Liao, H.; Ren, Z. Effect of Static Magnetic Field on the Evolution of Residual Stress and Microstructure of Laser Remelted Inconel 718 Superalloy. J. Therm. Spray Technol. 2020, 29, 1410–1423. [Google Scholar] [CrossRef]
  23. Du, D.; Haley, J.C.; Dong, A.; Fautrelle, Y.; Shu, D.; Zhu, G.; Li, X.; Sun, B.; Lavernia, E.J. Influence of static magnetic field on microstructure and mechanical behavior of selective laser melted AlSi10Mg alloy. Mater. Des. 2019, 181, 107923. [Google Scholar] [CrossRef]
  24. Mukherjee, T.; Wei, H.L.; De, A.; Debroy, T. Heat and fluid flow in additive manufacturing—Part I: Modeling of powder bed fusion. Comput. Mater. Sci. 2018, 150, 304–313. [Google Scholar] [CrossRef] [Green Version]
  25. Zhang, D.; Zhang, P.; Liu, Z.; Feng, Z.; Wang, C.; Guoa, Y. Thermofluid field of molten pool and its effects during selective laser melting (SLM) of Inconel 718 alloy. Addit. Manuf. 2018, 21, 567–578. [Google Scholar] [CrossRef]
  26. Zhang, Z.; Huang, Y.; Rani Kasinathan, A.; Imani Shahabad, S.; Ali, U.; Mahmoodkhani, Y.; Toyserkani, E. 3-Dimensional heat transfer modeling for laser powder-bed fusion additive manufacturing with volumetric heat sources based on varied thermal conductivity and absorptivity. Opt. Laser Technol. 2019, 109, 297–312. [Google Scholar] [CrossRef]
  27. Dai, D.; Gu, D. Thermal behavior and densification mechanism during selective laser melting of copper matrix composites: Simulation and experiments. Mater. Des. 2014, 55, 482–491. [Google Scholar] [CrossRef]
  28. Xiao, B.; Zhang, Y. Marangoni and Buoyancy Effects on Direct Metal Laser Sintering with a Moving Laser Beam. Numer. Heat Tranf. A-Appl. 2007, 51, 715–733. [Google Scholar] [CrossRef]
  29. Alhendal, Y.; Turan, A.; Aly, W.I.A. VOF simulation of marangoni flow of gas bubbles in 2D-axisymmetric column. Procedia Comput. Sci. 2010, 1, 673–680. [Google Scholar] [CrossRef]
  30. Kao, A. Analytic Solutions to Determine Critical Magnetic Fields for Thermoelectric Magnetohydrodynamics in Alloy Solidification. Metall. Mater. Trans. A-Phys. Metall. Mater. Sci. 2015, 46, 4215–4233. [Google Scholar] [CrossRef] [Green Version]
  31. Weichao, D.; Sanping, L.; Dianzhong, L.; Yiyi, L. Numerical simulation of effects of the minor active-element oxygen on the Marangoni convection and the weld shape. Acta Metall. Sin. 2008, 44, 249–256. [Google Scholar]
  32. Lee, Y.S.; Zhang, W. Modeling of heat transfer, fluid flow and solidification microstructure of nickel-base superalloy fabricated by laser powder bed fusion. Addit. Manuf. 2016, 12, 178–188. [Google Scholar] [CrossRef] [Green Version]
  33. Manvatkar, V.; De, A.; Debroy, T. Spatial variation of melt pool geometry, peak temperature and solidification parameters during laser assisted additive manufacturing process. Mater. Sci. Technol. 2014, 31, 924–930. [Google Scholar] [CrossRef]
  34. Debroy, T.; David, S.A. Physical processes in fusion welding. Rev. Mod. Phys. 1995, 67, 85–112. [Google Scholar] [CrossRef]
  35. Mukherjee, T.; Manvatkar, V.; De, A.; Debroy, T. Dimensionless numbers in additive manufacturing. J. Appl. Phys. 2017, 121, 1–10. [Google Scholar] [CrossRef] [Green Version]
  36. Mukherjee, T.; Zuback, J.S.; Zhang, W.; Debroy, T. Residual stresses and distortion in additively manufactured compositionally graded and dissimilar joints. Comput. Mater. Sci. 2018, 143, 325–337. [Google Scholar] [CrossRef]
  37. Arısoy, Y.M.; Criales, L.E.; Özel, T. Modeling and simulation of thermal field and solidification in laser powder bed fusion of nickel alloy IN625. Opt. Laser Technol. 2019, 109, 278–292. [Google Scholar] [CrossRef]
  38. Criales, L.E.; Arısoy, Y.M.; Özel, T. Sensitivity analysis of material and process parameters in finite element modeling of selective laser melting of Inconel 625. Int. J. Adv. Manuf. Technol. 2016, 86, 2653–2666. [Google Scholar] [CrossRef]
Figure 1. SLM experimental conditions: (a) SLM system, (b) data measured by Tesla meter (c), and (d) numerical simulation on the static magnetic field.
Metals 11 01846 g001
Figure 2. Schematic diagram of the numerical model of SLM process in the molten pool and dendrite scales.
Metals 11 01846 g002
Figure 3. Comparison of molten pool shapes in SLM In625 superalloy between experimental observation (a,c) and numerical simulation (b,d): SEM observations of the etched microstructure under different magnetic field conditions: (a) 0 T, (c) 0.1 T; temperature distribution within the molten pool under different magnetic field conditions: (b) 0 T, (d) 0.1 T.
Metals 11 01846 g003
Figure 4. Dendrite growth and precipitation in the molten pool during SLM without magnetic field: (a) molten pool morphology; (bd) are enlarged views of three different positions in the molten pool, respectively (SEM).
Metals 11 01846 g004
Figure 5. Dendrite growth and precipitation in the molten pool during SLM under 0.1 T magnetic field: (a) molten pool morphology; (bd) are enlarged views of three different positions in the molten pool, respectively (SEM).
Metals 11 01846 g005
Figure 6. Location of EDS analysis of the bottom of the molten pool of samples: (a) without magnetic field and (b) with the magnetic field (The voltage of SEM is 5 kV. Black lines in (a) and black circle in (b) indicate the boundary of dendrites).
Metals 11 01846 g006
Figure 7. Numerical simulation results of temperature distribution of the 3D overviews (a,c,e) and central cross-sections (b,d,f) of the molten pool under different conditions: (a,b) without SMF; (c,d) with 0.1 T SMF, where the red arrows show the direction of velocity field and black arrows direction of Lorentz force.
Metals 11 01846 g007
Figure 8. TEMF (N/m3) and TEMC at three different positions in the molten pool: (a1) TEMF around dendrites on the surface of the molten pool; (a2) and (a3) TEMF and TEMC on the surface of the molten pool of vertical view; (b1) TEMF around dendrites in the middle of the molten pool; (b2) and (b3) TEMF and TEMC around dendrites in the middle of the molten pool of vertical view; (c1) TEMF around dendrites on the bottom of the molten pool; (c2) and (c3) TEMF and TEMC around dendrites on the bottom of the molten pool of vertical view.
Metals 11 01846 g008
Figure 9. TEMF (N/m3) (a,c,e,g) and TEMC (b,d,f,h) around the dendrites at the bottom of the molten pool at the scanning speeds of 1200 mm/s, 1300 mm/s, 1400 mm/s, and 1500 mm/s with a laser power of 180 W.
Metals 11 01846 g009
Figure 10. (a,c,e,g) show the TEMF (N/m3) at the bottom of the molten pool with a laser power of 150 W, 160 W, 170 W, and 180 W at a scanning speed of 1500 mm/s, respectively, and figures (b,d,f,h) show the TEMC.
Metals 11 01846 g010
Figure 11. (a,c,e) show the TEMF (N/m3) around the dendrites at the bottom of the molten pool under the magnetic fields of 0.1 T, 0.3 T, and 0.5 T, respectively, and (b,d,f) show the TEMC.
Metals 11 01846 g011
Table 1. Physical parameters in the simulation [37,38].
ParametersValueUnit
Density ρ8440kg/m3
Solidus temperature Ts1528K
Liquidus temperature Tl1610K
Latent heat of fusion ΔHv227,000J/kg
Thermal conductivity in solid-state ks5.331 + 0.015 × TW/(m·K)
Thermal conductivity in liquid state kl30.05W/(m·K)
Electrical conductivity in solid-state σs0.75 × 106Ώ−1·m−1
Electrical conductivity in liquid stat σl0.67 × 106Ώ−1·m−1
Specific heat capacity in solid Cp(Ts)600J/(kg·K)
Specific heat capacity in liquid Cp(Tl)775J/(kg·K)
dγ/dt−0.1 × 10−3N/(m·K)
Radiation emissivity ε0.71
Viscosity μ0.2 − 2.7 × 10⁻⁴ × T + 7.8 × 10 − 8 × T2Pa·s
Seebeck coefficient in solid Ss−10.95μV/K
Seebeck coefficient in liquid Sl−16μV/K
Table 2. Comparison of calculated and measured molten pool dimensions.
Magnetic FieldDimensionExperimentSimulationError
0 TWidth89 ± 4 μm93 μm4.5%
Depth79 ± 3 μm85 μm7.6%
0.1 TWidth91 ± 5 μm94 μm3.3%
Depth82 ± 3 μm85 μm3.7%
Table 3. Element content ratio of the bottom of the molten pool of the sample with and without the magnetic field.
Magnetic Field0 T0.1 T
ComponentMatrixLavesMatrixLaves
Spectrum Label12345678
C8.065.8611.5611.304.895.118.397.72
Si0.700.001.210.890.620.610.750.72
Cr20.6421.2818.3018.4120.8420.7319.4619.81
Ni58.4061.6952.4051.8661.3761.8357.2558.40
Nb3.382.816.378.653.583.465.004.34
Mo8.828.3710.178.888.708.259.159.00
Total100.00100.00100.00100.00100.00100100.00100.00
Publisher’s Note: MDPI stays neutral with regard to jurisdictional claims in published maps and institutional affiliations.

