Article

Numerical Study on Vibration Response and Fatigue Damage of Axial Compressor Blade Considering Aerodynamic Excitation

1
College of Mechanical-Electronic and Vehicle Engineering, Weifang University, Weifang 261061, China
2
State Key Laboratory of Engines, Tianjin University, Tianjin 300072, China
*
Author to whom correspondence should be addressed.
Metals 2021, 11(11), 1835; https://doi.org/10.3390/met11111835
Submission received: 30 September 2021 / Revised: 2 November 2021 / Accepted: 13 November 2021 / Published: 15 November 2021
(This article belongs to the Special Issue Multi-Axial Fatigue and Fracture Behavior in Metals)

Abstract

:
Axial compressor blades with a deformed initial torsion angle caused by aerodynamic excitation resonated at the working speed and changed the rule of fatigue damage accumulation. The fatigue life of a blade has a prediction error, even causing serious flight accidents if the effect of torque causing damage deterioration of the blade fatigue life is neglected. Therefore, in this paper, a uniaxial non-linear fatigue damage model was modified using the equivalent stress with torsional shear stress, and the proposed fatigue model including the torsional moment was used to study the compressor blade fatigue life. Then, the blade numerical simulation model was established to calculate the vibration characteristics under complex loads of airflow excitation and a rotating centrifugal force. Finally, the blade fatigue life under actual working conditions was predicted using the modified fatigue model. The results show that the interaction between centrifugal and aerodynamic loads affects the natural frequency, as the frequencies in modes dominated by bending deformation decreased whereas those dominated by torsional deformation increased. Furthermore, the blade root of the suction surface showed stress concentration, but there is an obvious difference of stress distribution and amplitude between the normal stress and the equivalent stress including torsional shear stress. The additional consideration of the torsional shear stress decreased the predicted fatigue life by 4.5%. The damage accumulation rate changes with the loading cycle, and it accelerates fast for the last 25% of the cycle, when the blade fracture may occur at any time. Thus, the aerodynamic excitation increased the safety factor of blade fatigue life prediction.

1. Introduction

The compressor blade is the core component of an aeroengine, which operates in an environment of high rotating speeds, high pressure, and high temperature. With the improvement in the performance of aeroengines, the compressor loads are increasing. Therefore, the operating environment of the blade will become more adverse, and failure fractures will often occur [1,2,3]. The high-speed rotating blades are not only subjected to centrifugal load by self-weight, but could also be causing the vibration deformation with the initial twist angle, leading to the blade entering a complex stress state [4]. In this state, the blade can easily suffer fatigue failure under the coupling alternating loads, which is extremely harmful to the operational security of an aeroengine [5,6]. Hence, it is necessary to study the vibration characteristics and fatigue life predictions of a compressor blade considering aerodynamic excitation, which is of great significance to improving the reliability of aeroengines.
The high-speed rotation of a compressor’s blades converts the kinetic energy of the rotor to the internal energy of the gas. As the pressure of the gas increases, its flow velocity also increases. Studies have shown that, during this process of energy conversion, the blade is subject to excitation and vibrates. The vibration includes the self-excited vibration, or flutter, and the unsteady forced vibration. Compared with the self-excited vibration, the forced vibration is more common [7,8]. When the frequency of the external excitation is equal or close to the natural frequency of the blade, it will be induced to resonate, leading to instantaneous increases in the magnitude of vibration and blade failure [9]. Ernst et al. [10] investigated the effect of the wave induced by the rotor–stator interactions on the vibration characteristics of a compressor blade and verified the numerical computation results for the flow field. They also measured the blade vibration frequencies and strains and developed a method for determining the blade–blade interaction through frequency analysis. Janardhana and Maharana [11] analyzed the vibration stress in a single-stage fan blade at multiple critical rotational speeds. They found that the peak stress was closely related to the blade modal deformation and always occurred at the leading edge, making it prone to fatigue failure. Yang et al. [12] computed the vibration response of a radial turbine. They found that the shock wave excited by the trailing edge of the guide vane induced a pressure wave on the turbine blade, which, in turn, induced blade harmonic resonance, and subsequently, high-cycle fatigue. Belamri et al. [13,14] used a three-dimensional computational fluid dynamics (CFD) tool to establish a flow field analysis model of a 15-stage axial compressor and to perform steady-state and transient-flow simulations. Ni et al. [15] established a numerical model of a transonic compressor blade under fluid–structure interactions and analyzed the dynamic response characteristics of the blade. They found that the self-excitation of the rotor blade rows varied the pressure distribution on the blade surface and the resulting blade dynamic response had a non-negligible effect on the structural strength.
A blade is usually designed with an initial twist angle to improve its fluidity. Operating under high-speed, high-pressure conditions, the blade is subject to coupled vibrations, including axial bending, tangential bending, and torsion, in real operating cycles due to the combined effects of the centrifugal inertial force of the blade and the gas flow disturbance-induced aerodynamic load [16,17]. The stress distribution in the blade under the coupled vibrations is more complex than that under pure bending or torsional vibration [18]. The combined effects of the tensile, bending, and torsional stresses not only change the location of the critical region for blade fatigue failure, but also increase the accumulation rate of blade damage. Among the methods for estimating the fatigue damage of structures from the stress fatigue perspective, the S-N curve method is the most widely applied [19,20]. The model’s parameters can be easily fitted, and the computational results are accurate enough for engineering applications, which combines with Palmgren–Miner linear damage rule [21], Marco–Starkey nonlinear damage rule [22], and other nonlinear damage accumulation equations [23,24]. However, they cannot characterize the relationship between the loading parameters and the fatigue damage [25,26]. In order to overcome the defects of the damage accumulation model, Chaboche and Lesne [27] proposed a nonlinear fatigue damage model based on continuous damage mechanics, which describes the effects of the loading parameters on the fatigue life and damage variables, considers the effect of loading sequence, and provides more accurate computational results than the S-N curve and damage accumulation models. On the basis of Chaboche’s work, the effect of the loading conditions on fatigue damage and the application of Chaboche’s nonlinear damage model have been studied [28,29]. In terms of the model’s improvement, Yao et al. [30] modified the damage model by adding a temperature function to consider the effect of temperature on the viscoplastic behavior of material. Van [31] showed the availability of adopting the Chaboche model to predict the high cycle fatigue life of a steel structure based on the finite element (FE) results of residual stress. Gao [32] used Chaboche’s nonlinear damage model to investigate a compressor blade subjected to multilevel cyclic fatigue. It was found that the Chaboche model takes into account the multilevel sequential loading but ignores the multiaxial stress state, which might bring in errors of fatigue life prediction. Therefore, the nonlinear model is based on uniaxial loading and does not consider the torsional moment-induced stress (torsional shear stress) of the compressor blade. Thus, it has certain errors when used for fatigue life prediction, and the nonlinear model can make proper modifications to the damage model based on the loading condition and can improve the accuracy of the fatigue life assessment.
In this study, a three-dimensional numerical model of a compressor blade was established. By analyzing the effect of the airflow excitation-induced blade torsional deformation on the vibration response, the effect of the torsional moment was represented as torsional shear stress. Then, the nonlinear cumulative damage model was modified by also considering the torsional shear stress and used for predicting the fatigue life of the blade in typical operating cycles, and the predicted mode of failure was compared with the actual mode of failure of the compressor blade. The results provide a foundation for further research of blade fatigue life under in-service loading conditions.

2. Numerical Methodology

2.1. Structure Dynamic Equations

A dynamic equation is the basis of structure dynamic characteristic analysis. Its general equation is expressed as follows [33]:
M u ¨ + C u ˙ + K u = F
where u , u ˙ and u ¨ are structural displacement, velocity, and acceleration, respectively. M is the mass matrix, C is the damping matrix, K is the stiffness matrix, and F denotes the resulting external forces.
For different solutions of dynamic characteristics, the parameter values in the above-mentioned equations are different. Generally, it is accepted that F is zero for modal analysis and C is zero for a frequency calculation of self-excited vibration. Therefore, the dynamic equation is transformed as follows:
M u ¨ + K u = 0
For a compressor blade, it is believed that the blade is mainly affected by the centrifugal loads in a state of rotation; therefore, the resulting external forces F = v N T f d v . Hence, based on Equation (1), the dynamic frequency of a blade under centrifugal loads can be calculated.
At the rotational part, a compressor blade can convert the rotational kinetic energy into the internal energy of the gas, which increases the gas pressure and flow velocity. Moreover, the compressor blade also affected by the aerodynamic excitation in the actual working process since the blade has a pre-torsion angle. Under the aerodynamic loads, the blade deformation is transformed. Therefore, the structural dynamic characteristics also change. Additionally, then, the deformation has an effect on the fluid flow and flow field distribution. Therefore, there is an interaction between the fluid domain and the structural domain of the blade. Considering the complex loads of centrifugal and aerodynamic excitation, the analysis of a dynamic characteristic could be more accurate for a compressor blade.
Based on the energy conservation principle, the parameters of the fluid domain and the structural domain meet the demand of displacement compatibility and force balance in the coupling interface. The acoustic wave equation of fluid is established as follows:
M P P ¨ + C P P ˙ + K P P + ρ 0 R T u ¨ = 0
where P is the sound pressure; M P , C P and K P are the mass, damping, and stiffness matrix of the fluid; and ρ 0 R T denotes the coupling mass matrix.
Then, the fluid pressure is applied to the structural domain calculation. The dynamic equation under aerodynamic excitation is established as follows:
M u ¨ + C u ˙ + K u = F + R f
where R f is the additional node vector caused by an interaction between the structure and the fluid, and F and R f are both the function of fluid pressure P .

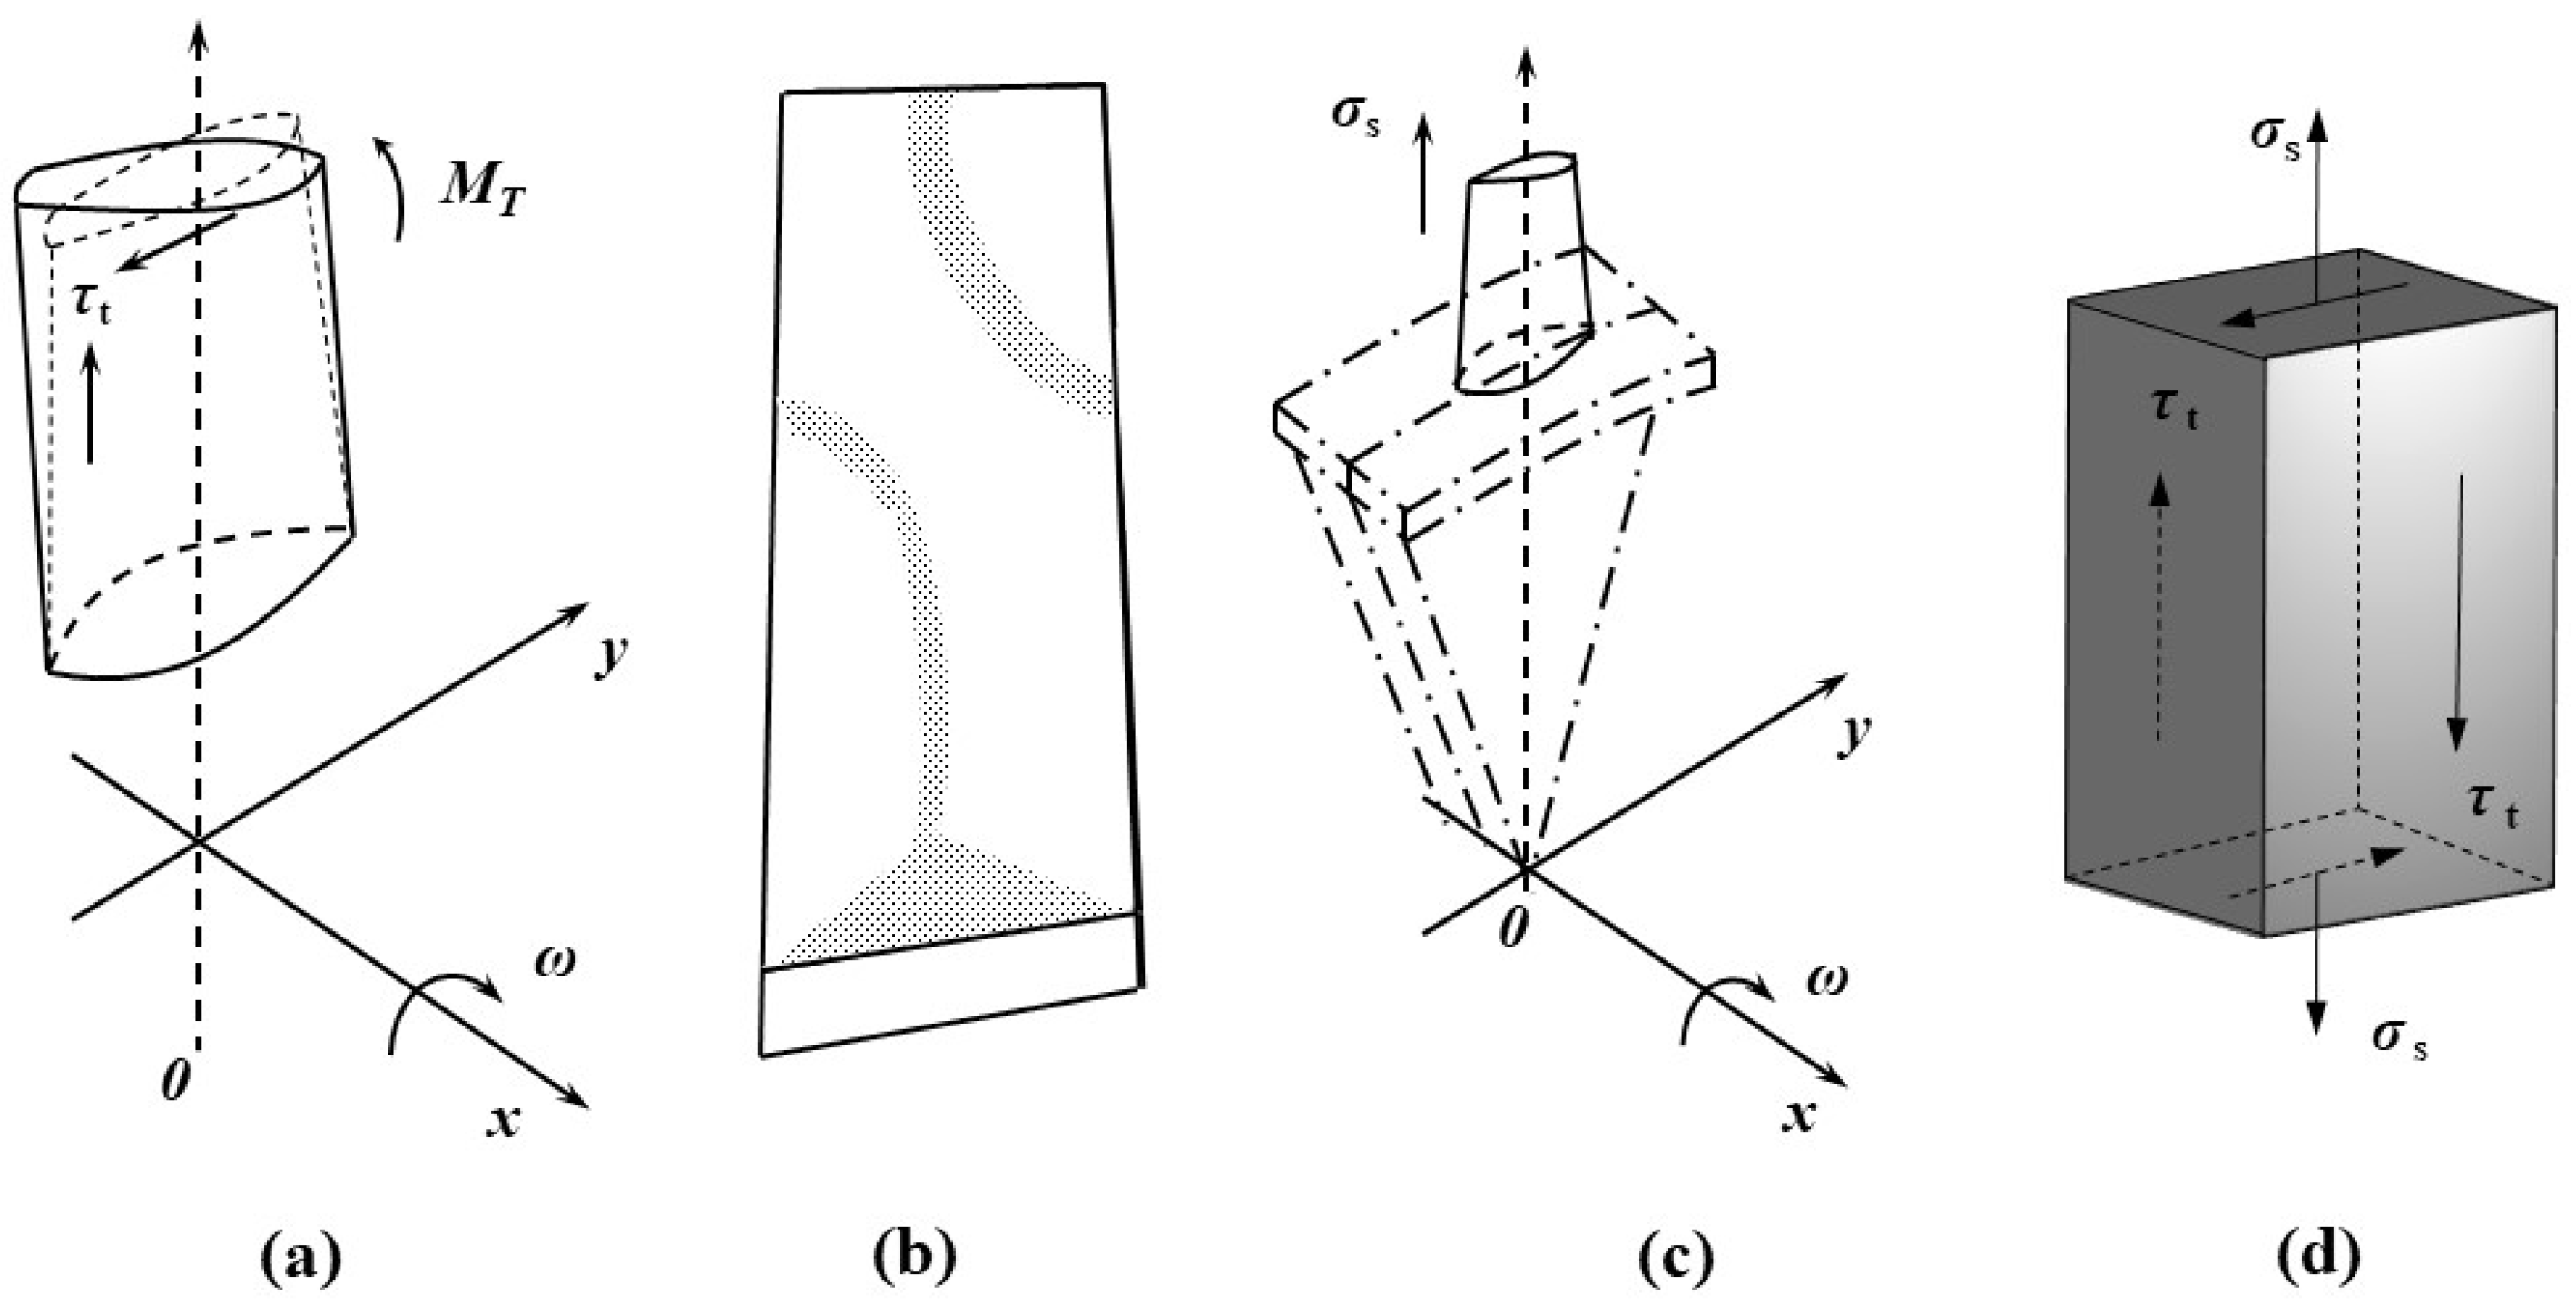
2.2. Modified Fatigue Damage Model

Generally, the S-N curves were used to indicate the life cycle of stress loading. Then, the rules of damage accumulation and the failure life of engineering machinery could be calculated with Miner’s linear damage theory. However, the interaction between the cycle loads and the damage parameters is ignored in the linear theory, which leads to a large deviation of predicted life between the numerical model and the actual situation. Hence, some nonlinear damage accumulation models were put forward, of which the Chaboche model was applied maturely. In this model, the damage and loading parameters interrelate, which is expressed as follows:
d D d N = f 1 σ a , σ m , D     g σ a , σ m
From a nondestructive state to fracture, the damage parameter D rises from zero to one. Therefore, the Chaboche nonlinear damage accumulation model can be obtained under uniaxial loading by numerically integrating Equation (5).
N f = 1 1 α 1 1 + β M 0 1 b 0 σ m σ a β
where β, M0, b0, and α are the fatigue parameters of the material, and α is relevant to the load parameters, the equation for which is α = 1 H σ a σ 1 / σ b σ a . σa and σm are the stress amplitude and mean stress of the uniaxial alternating load, respectively. σb and σ−1 denote the tensile strength and fatigue limit of the material.
The high rotation speed compressor blade mainly bears centrifugal loads caused by rotor rotation and aerodynamic loads caused by airflow disturbances [34]. Due to the compressor blade with an initial angle of torsion, the torque caused by transverse aeromechanics will also cause the blade torsional vibration. The deformed blade of vibration is subjected to the torsional shear stress, in addition to centrifugal tensile stress. Therefore, the blade is affected by complex alternating loads, which accelerate the damage accumulation rate and lead to an early fatigue fracture in the blade. Therefore, to predict the fatigue life of an axial compressor blade, considering the torsional effect could be more accurate.
As shown in Figure 1a,b, the torsional stress τ t is caused by blade deformation of torsional vibration under the airflow effect, and the centrifugal tensile stress was superimposed at the same time, leading to the complex stress state shown in Figure 1c,d. Since the torsional deformation leads to the degradation effect of damage accumulation and crack propagation, the damage accumulation rate was accelerated, and the fatigue life was decreased. In this study, the torque effect is expressed by the torsional stress τ t , and the von Mises equivalent stress in the blade in a complex stress state is expressed as follows:
σ eq = σ s 2 + 3 τ t 2
where σ eq is the equivalent stress amplitude of the blade, σ s is the centrifugal tensile stress and τ t is the torsional shear stress. Based on the material static mechanics relationship, the torsional shear stress τ t is expressed as follows:
τ t = M T W P
where MT is the torque caused by the resultant external force and WP is the section modulus in torsion.
By bringing Equation (8) into Equation (7), the stress in Equation (6) is expressed by the equivalent stress amplitude. Considering the effect of torque on fatigue life and damage accumulation, the modified fatigue model is established with a stress correction, which is shown as follows:
N f = 1 1 α 1 1 + β M 1 b σ m σ s 2 + 3 τ t 2 β
where σ m is the equivalent mean stress with torque effect, which can be calculated using the following: σ m = 1   +   R 1     R σ eq .
According to Equation (9), there is no fatigue fracture in the structure (namely N = ∞) when the loading is lower than the material fatigue limit (namely σaσ−1, so as to α = 1). When the loading is larger than the material fatigue limit, the fatigue life cycles Nf′ can be calculated using Equation (9), and then the expression of the corresponding fatigue damage D under complex bend-torsion loads of certain cycles n is shown as follows:
D = 1 1 n N f 1 / ( 1 α ) 1 / ( 1 + β )
Due to the irreversibility in the crack propagation process of continuous fatigue damage, the above modified model must meet the following conditions to verify the validity.
(a)
With the increase in fatigue loading cycles, the continuous damage variable D also is increased, which is shown as follows:
D n > 0
(b)
In the case of a structure with equal initial damage D0, the damage variable under the larger fatigue load should be greater than the damage variable under the lower fatigue load with the same loading cycles, which is expressed as follows:
2 D n σ > 0
(c)
In the case of equal fatigue loads, the damage variable with a larger initial damage variable D01 under one loading cycle should be greater than the damage variable with a lower initial damage variable D02 under same loading cycle, which is shown as follows:
D D 0 > 0
In Equation (10), the first order partial differential function of D to n is expressed as follows:
D n = 1 1 α 1 + β N f n N f α / 1 α 1 n N f 1 / 1 α β / 1 + β
In the case of σ a > σ 1 , it is found that 1 α > 0 and N f > n > 0 , while in the equation of load parameters, α is denoted as 1 H σ a σ 1 / σ b σ a . Therefore, the modified fatigue model meets the above first condition, which establishes Equation (11).
For Equation (14), the partial differential function of D to σ is expressed as follows:
2 D n σ = σ b σ a n H σ a σ 1 1 + β 1 w 1   +   2 β 1   +   β 1 w 1 + β w
where w = n / N f 1 / 1 α . According to the parameter value and the same mathematic relation as above, it can be easily proven that Equation (15) is greater than zero. Namely, Equation (12) is also established, which sees the proposed model meet the aforementioned second condition.
The relationship of damage variable D, loading cycles n, and initial damage D0 is shown as follows, which is under a certain loading amplitude:
1 1 D 1 + β 1 α = 1 1 D 0 1 + β 1 α + n 1 α 1 + β σ a M 0 1 b 0 σ m β
Hence, the partial differential function of D to D0 for Equation (16) can be given as follows:
D D 0 = 1 1 D 0 1 + β α 1 D 0 β 1 1 D 1 + β α 1 D β
where there is 0 < D 0 < D < 1 and the material parameters α and β are both greater than zero. Therefore, Equation (13) is established, which sees the modified model meet the above third condition.
In summary, the proposed fatigue damage model satisfies the mathematical constraints of the continuous function, that is to say Equations (9) and (10) of the modified model are valid.

3. Numerical Modelling

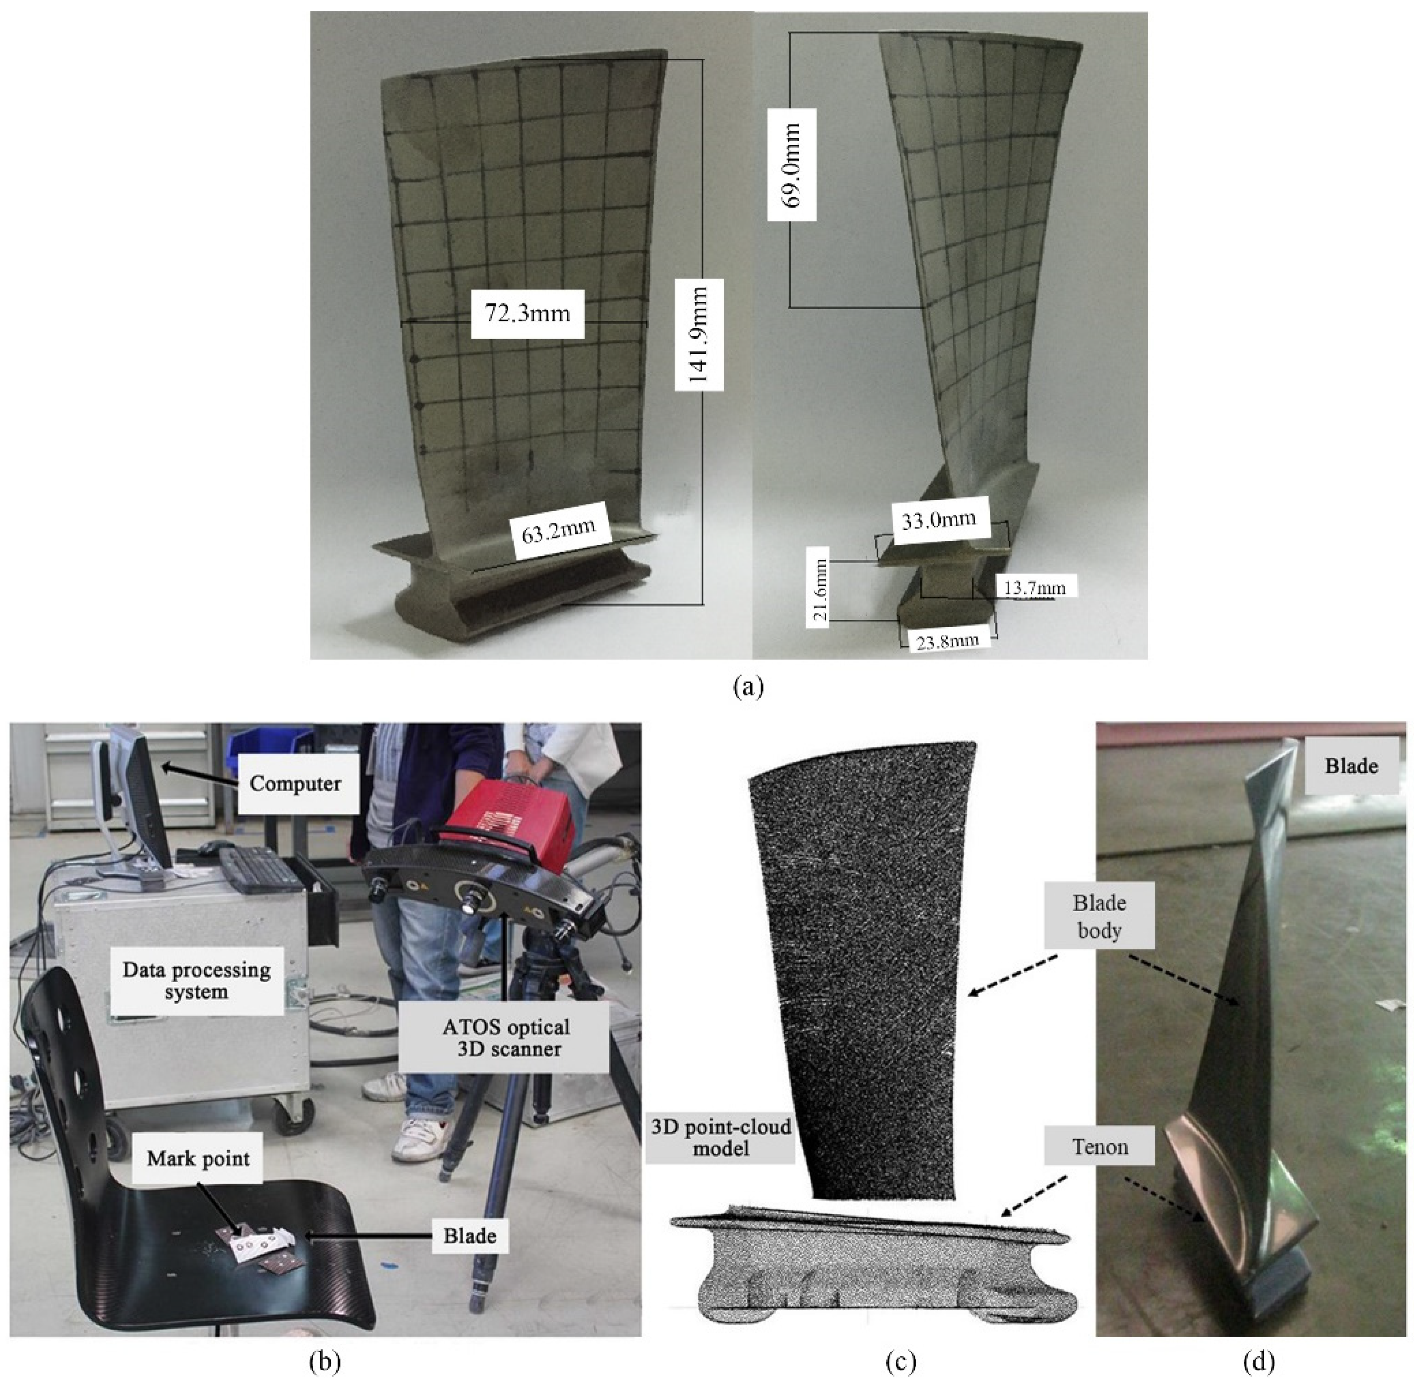
3.1. Finite Element Modeling and Verification

Based on the reversed modeling theory, the three-dimensional model of a compressor blade was established. The detailed steps of the blade modeling have been published in the Ref [35,36]. Therefore, there is no description of the modeling process in this study. The method of reversed modeling and the blade 3D model with the main dimension parameters are shown in Figure 2. The blade was pre-twisted at 33.4° and the semidiameter of hub was 281.79 mm. The blade material was Ti-6Al-4V titanium alloy, and its mechanical properties were confirmed by the tensile test according to national standard GB/T 228.1-2010, as shown in Figure 3. According to the tensile curves, the tensile strength, yield strength, Young’s modulus, Poisson’s ratio, and material density were assumed to be σb = 1005 MPa, σs = 975 MPa, E = 107 GPa, μ = 0.3, and ρ = 4200 kg/m3, respectively.
In order to verify the modeling accuracy, it was necessary to calculate the modal frequency to compare with the modal test. First, the blade 3D model was meshed with the 10-node tetrahedron (solid 187) to establish the finite element model, which is appropriate to describe the thin wall features of the twisted blade and the constraint conditions are kept with the actual assembly of the blade and the hub. The modal analysis was carried out using commercial software of Ansys Workbench, within which the solver type is direct (Block Lanczos), the blade FE model and constrain conditions are shown as Figure 4. The modal tests of statically clamped impact were performed using a single-excitation, single-response method (Figure 5), which is based on the national standard GB/T 19873.3-2019. The test equipment included a PSV-400-3D Scanning Vibrometer system and a Test Lab Vibration Control test system. The laser probe of the PSV-A-400 was used as the acceleration signal sensor in the test. This non-contact measurement device obtained the response of the blade to the excitation by detecting the variation in the displacement of spatial points. The results of the modal calculation and the modal test are listed in Table 1. It was found that the modal frequency error was consistently within 10%, and the modal shape corresponded with the test. The errors may be caused by the following factors: (1) differences between the computational models of the blade and its actual structure, and (2) differences between the simulated and actual boundary conditions for constraining the blade’s displacement. Finally, the 3D model blade essentially met the computational requirements.

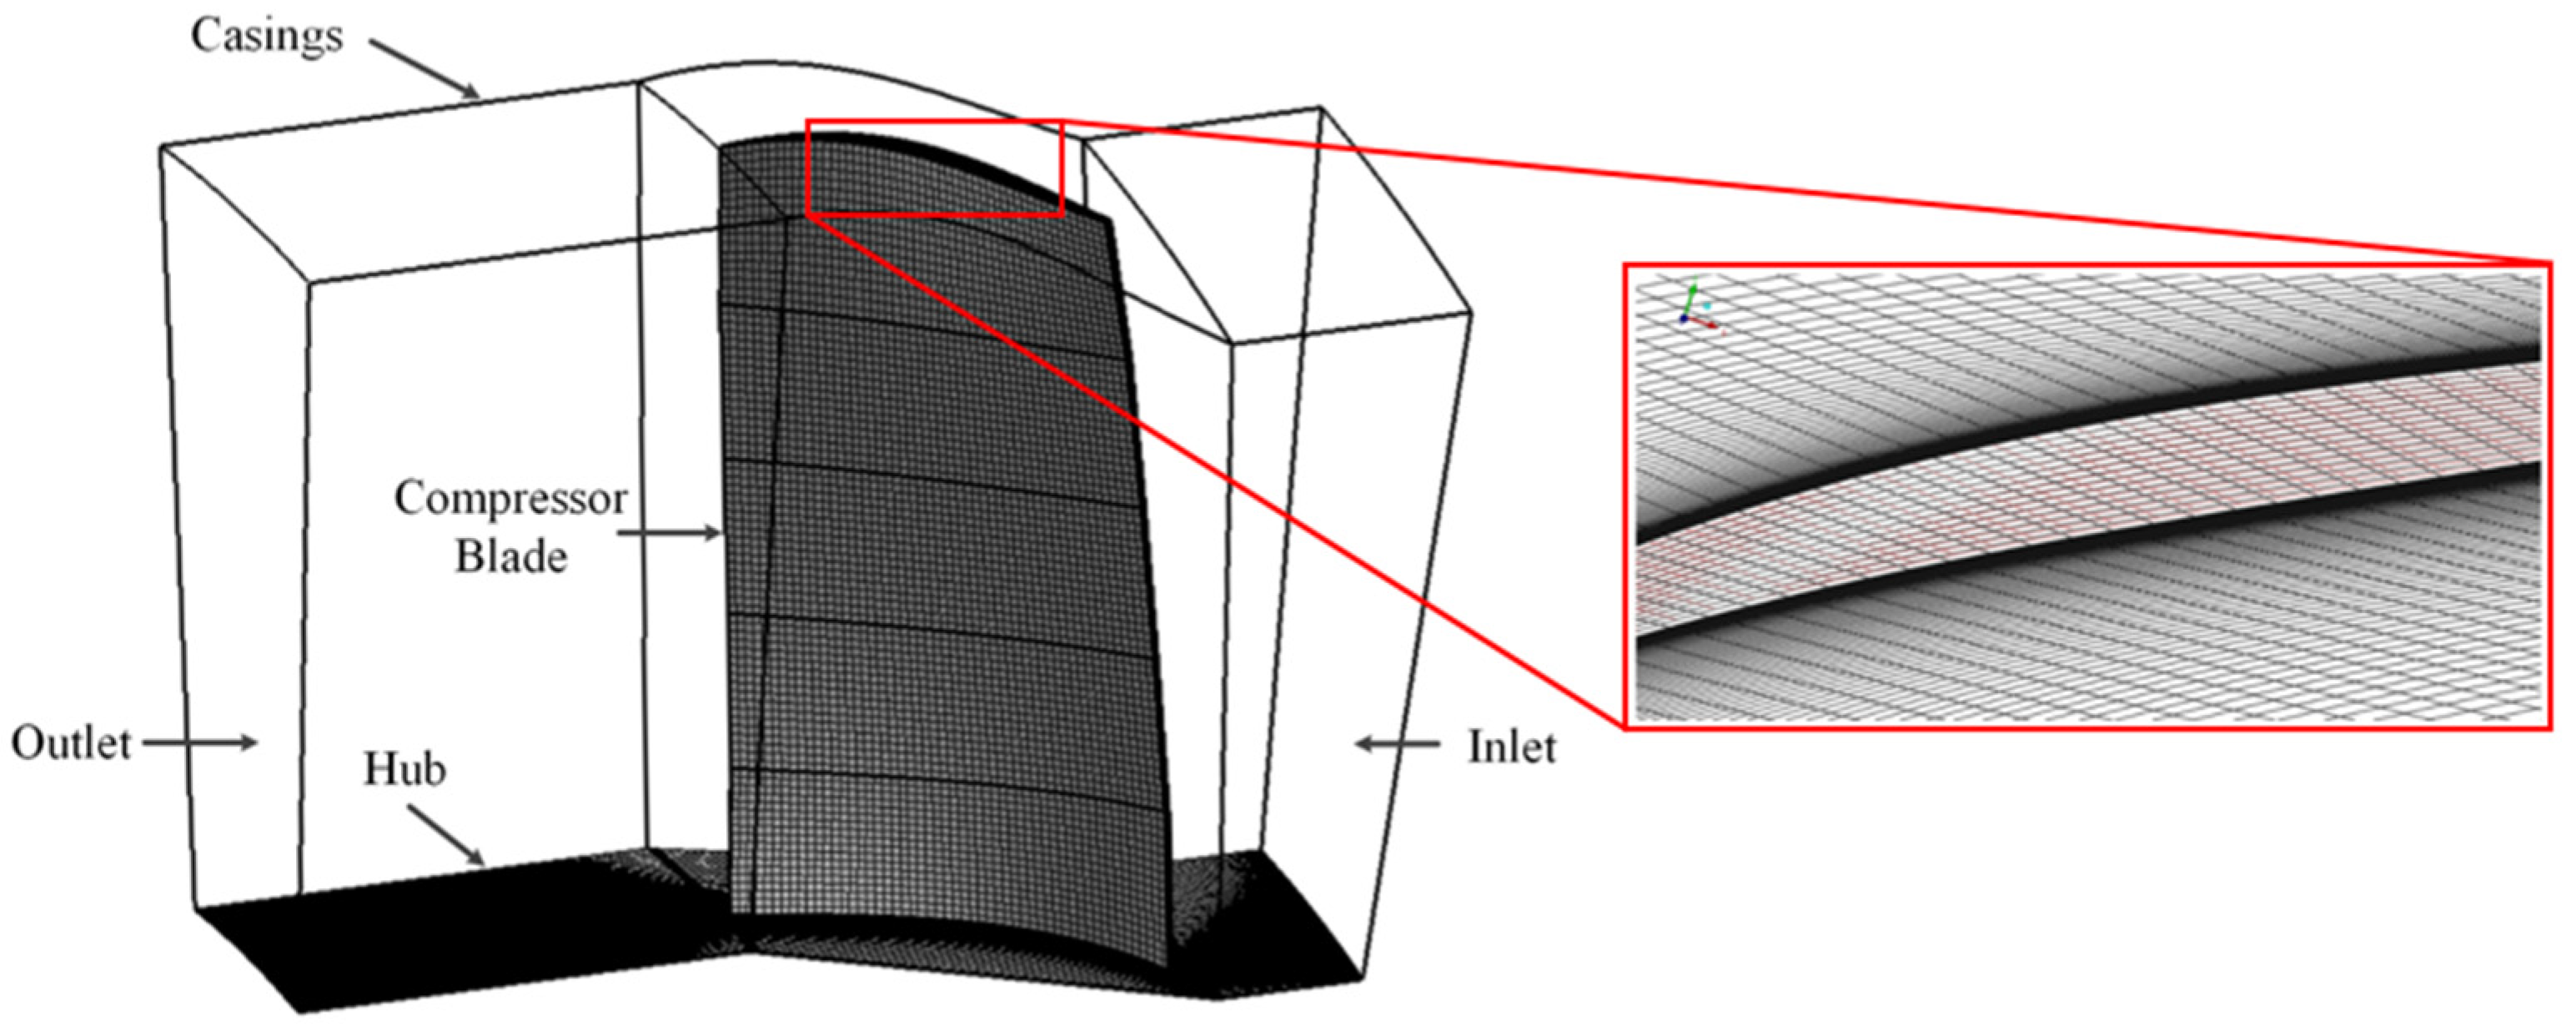
3.2. Flow Field Modeling and Verification

According to the above structural dynamic analysis, the rotating blade produced the aerodynamic excitation to change the blade deformation and, in addition, to affect the vibration response and fatigue damage. Therefore, the CFD model of the blade was built as shown in Figure 6 to confirm the aerodynamic excitation. The flow field parameters were set as follows: the gap between the blade and the casing was 1.7 mm, the length of inlet flow and outlet flow were 80 and 120 mm, respectively. Considering the calculation precision, the uniform multi-block grid was utilized to mesh the blade flow field model. The mesh was generated using an H-J mixed mesh topology, an O-grid around the blade surface and hexagonal elements in the tip region, while the blade tip was filled with a refined H-grid block and the grid between the case and the blade tip was matched. With the database for an aeroengine test, the boundary conditions were set as pressure inlet and pressure outlet. An ideal gas approximation was used for the fluid material and the wall parameters were assumed to be adiabatic and smooth with a no-slip condition. The turbulence was modelled using the realizable k-epsilon model and the standard wall function was used as the near-wall treatment. The solution methods of CFD were solved by an implicit formulation. The turbulence kinetic energy and turbulent dissipation rate were both set as a second-order upwind.
Considering the influence of grid density on CFD computational accuracy, the grid independence was verified using three different grids, such as a coarse grid (comprising 1,312,442 elements), a medium grid (comprising 1,880,936 elements), and a fine grid (comprising 2,516,523 elements). Since the airflow at the blade tip has a significant influence on deformation, the monitoring line was set at 90% of the blade span, as shown in Figure 7a. The aerodynamic pressure results for the coarse, medium, and fine grids were compared, as shown in Figure 7b. It was found that the calculated results’ error of the medium and fine grids was within 2%. However, the computing time was significantly longer for the fine grids. To balance the accuracy of the prediction with the computational time cost, the medium grid was used for the CFD simulation in this study.

4. Results and Discussion

Based on the theorical analysis, it was noted that the fatigue damage behavior was greatly affected by the aerodynamic loads. Thus, the aerodynamic characteristics, natural vibration performance, and harmonic resonance characteristic are analyzed in this part to discuss the effect of aerodynamic excitation on the vibration and fatigue life of a compressor blade.

4.1. Aerodynamic Loads Analysis

Aerodynamic load, as an external excitation, can induce blade deformation and vibration. When the energy supplied to the blade promotes structural vibration, the resulting vibration stress can easily lead to blade fatigue. Generally, the working conditions of an aeroengine are divided into some stages, such as take-off, cruise, approach, and landing, with different rotation speeds, which lead to a change of the aerodynamic load and vibration characteristics. Hence, the engine flight cycle was divided into six typical operating conditions according to the aeroengine test-drive data [37], its rotation speeds are shown in Table 2. With the CFD calculation models, the internal flow field of the compressor was solved under six typical speeds.
It was found that the pressure distributions in the flow channel of the compressor under different rotational speeds were basically consistent, but the pressure amplitude differed significantly. Furthermore, the pressure amplitude on the inlet side was greater than it was on the outlet side. This is because the main function of the compressor is to provide a high-pressure gas source for the combustion chamber; therefore, the gas pressure is increased by the blade rotating. Thereby, the pressure amplitude on the concave side of the blade, used as the pressure side, was also greater than that on the convex side of the blade, which is used as the suction side. The aerodynamic pressure on the blade surface at rotational speeds 6278, 8847, and 9561 rpm are shown in Figure 8, which shows that the pressure amplitude in the axial direction increased from the inlet to the outlet, and that in the radial direction, increased from hub to casing. Additionally, the aerodynamic pressure close to the blade tip was significantly higher than the other areas. This is because the airflow could be leaked from the blade tip clearance. Therefore, the pressurized airflow might flow from the pressure side to the suction side by tip clearance, leading to an increase in local pressure on the blade tip.

4.2. Natural Vibration Analysis

The natural frequencies of the blade increased with the rotational speed (Table 3). This is because the load on the blade resulting from the rotation increases the blade’s stiffness, thereby increasing the frequency. In particular, the fifth-mode frequency increased by the largest magnitude, whereas the first-mode frequency increased by the largest ratio due to its relatively low frequency. This is because the natural frequency of a structure is in direct proportion to its stiffness. However, the natural frequency does not increase infinitely as the stiffness increases, i.e., increasing the stiffness can only increase the natural frequency by a certain magnitude.
With the airflow excitation considered, the blade’s modes of vibration at different orders did not vary as the engine’s rotational speed varied. However, the magnitude of the dynamic frequency did vary. With the effect of the aerodynamic pressure considered, the blade’s first- and third-order frequencies decreased slightly, whereas the second-, fourth-, and fifth-order frequencies increased. That is to say, when the airflow excitation was considered, the frequencies in modes dominated by bending deformation decreased, whereas those dominated by torsional deformation increased. The reason behind this phenomenon is as follows. During the operation of the compressor, the tensile–compressive stress caused by the centrifugal load increases the bending deformation of the blade, whereas the aerodynamic load weakens the bending of the blade. In addition, the initial twist angle of the blade, considering the airflow excitation further increases the torsion effect of the blade, may lead to an acceleration of the crack fatigue propagation rate.

4.3. Harmonic Resonance Analysis

As discussed above, the gas flow excitation affects both the natural frequency and the mode of vibration of a blade. In the following, the instantaneous dynamic characteristics of a blade, also considering the effect of the gas flow, will be further analyzed. The flow in a compressor is unsteady, i.e., the state of low at any point in the space varies with time. Considering that the pressure wave on the blade surface varies periodically, the temporally varying instantaneous flow pressure in the compressor was extracted to compute the instantaneous response characteristics of the blade. Then, by analyzing the variations in the blade stress distribution, the critical region for structural failure was determined, based on which fatigue life of the blade was predicted.
Figure 9 shows the configuration of pressure measurement points in the compressor flow channel. To understand the flow in the compressor, measurement points P1 and P2 were used for measuring the pressures at the inlet and outlet of the flow channel, respectively; measurement points P3, P4, and P5 were used for measuring the pressures at the locations in the blade where the modal stress was concentrated. The model for solving the flow field and the configuration of the boundary conditions and other conventional parameters are as described in Section 3.2. The stage of the rotor investigated in this study consisted of 40 blades. Therefore, a cycle of rotation of the compressor was divided into 40 time steps, i.e., the flow field was solved for each 9° rotation of the blade. Thus, the computational step length for the six typical operating conditions were as follows.
The computational results showed that the pressure pulsation patterns under the six typical operating conditions were basically consistent, all exhibiting a prominent periodicity and differing only in the magnitude of pressure. Figure 10 shows the variations in the instantaneous pressures at measurement points P1 (inlet) and P2 (outlet) at a rotational speed of 6278 rpm. The pressures at P1 and P2 varied basically periodically in the investigated cycles of rotation, and the pressure on the outlet side was prominently higher than that on the inlet side. This result is consistent with the aerodynamic pressure distribution described in Section 4.1. In a cycle of rotation, the maximum and minimum aerodynamic pressures at measurement point P1 (inlet) were 101,380 and 90,877 Pa, respectively, the difference being 10,503 Pa. The maximum and minimum aerodynamic pressures at measurement point P2 (outlet) were 130,035 and 127,386 Pa, respectively, the difference being 2649 Pa. The pressure wave in the outlet channel was prominently higher than that on the inlet side. As the compressor blade increased the gas pressure, the blade structure interacted with the pressure waves on the inlet and outlet sides. The following is an in-depth analysis of the gas pressure waves on the blade surface.
Similarly, Figure 11 shows the pressure time domain diagram for measurements points (on the compressor blade surface) P3, P4, and P5, respectively, at a rotational speed of 6278 rpm. The pressure waves at these measurement points were also basically periodic, despite the different magnitudes of pressure in the different cycles of rotation. The maximum and minimum aerodynamic pressures at measurement points P3 (at the blade root on the suction side), P4 (on the concave surface of the blade), and P5 (at the lower half of the leading edge on the concave surface of the blade) were 105,609 and 95,897 Pa, 130,750 and 125,531 Pa, and 107,986 and 99,534 Pa, respectively. The differences between the maximum and minimum aerodynamic pressures at these three measurements points were 9712, 5219 and 8452 Pa, respectively.
Further, the resonance characteristics of the blade were analyzed by extracting the displacement response and stress response of the blade. Figure 12 shows the variations in the displacement at the tip of the blade’s leading edge with a frequency under the six typical operating conditions using FFT (fast Fourier transform), where the horizontal axis represents the frequency, and the vertical axis represents the displacement. The blade exhibited different response characteristics at the different rotational speeds. However, all frequency–displacement curves have multiple peaks. At low rotational speeds (6278 and 6966 rpm), the blade resonated at the first-, second-, and fifth-order frequencies. At rotational speeds of 8847 and 9172 rpm, the displacement peaked mainly at the first- and second-order frequencies. At rotational speeds of 9337 and 9561 rpm, the blade resonated at the first-, second-, and third-order frequencies. For the frequency spectra at different rotational speeds, the maximum peak corresponded to the first-order frequency, and was thus a low-frequency vibration. The harmonic response at the second-order torsional frequency was also of high magnitude. As the rotational speed increased, the blade became less subject to resonance or harmonic resonance at high-order frequencies. Therefore, the vibration of the compressor blade was the result of the stacking of the vibrations at different orders of low frequencies [38,39,40]. Despite the different resonance response characteristics at different rotational speeds, the low-frequency (first-and second-order frequencies) modes of vibration were more easily excited than the high-order modes of vibration. Thus, the torsional deformation increases the complexity of the stress state in the blade and is non-negligible in subsequent stress and fatigue analyses.
In addition, the blade stress in a time domain in a cycle of rotation was analyzed. Figure 13 shows the temporal variations in the stress distribution at a rotational speed of 6278 rpm. In the first half of the cycle, the stress in the blade gradually increased. On the pressure surface, stress concentration occurred at the center, and the stress decreased as the distance from the center increased, exhibiting elliptic contours. On the suction surface, stress concentration occurred at the blade root, and the stress decreased along the blade span direction. The stresses on both surfaces peaked at time T/2. In the second half of the cycle, the stresses on the pressure and suction surfaces varied in a reverse trend—decreasing from the maximum to the minimum. At the completion of a cycle of rotation, the stress distribution in the blade returned to the initial state. Further analysis of the stress distribution showed that the stress concentration at the blade root on the suction surface (region B) was higher than that at the center of the pressure surface (region A). This result is consistent with the actual mode of failure of the blade, namely overloading-induced fracture failure at the blade root (Figure 14). Thus, region B was determined as the critical region for a subsequent fatigue life prediction.

4.4. Fatigue Damage Analysis

As the material parameters in the fatigue model could be obtained using the fatigue test, the high cycle fatigue test was carried out according to the national standard GB/T 3075-2008. Based on the fatigue criterion of 107 cycles, the fatigue limit of the Ti-6Al-4V titanium alloy was about 440 MPa. The fatigue test and fitting curve of the fatigue model were shown in Figure 15 and Figure 16, respectively. Then, the material parameters of the proposed model were determined as H = 0.093, M0 = 6.63 × 10⁸, β = 0.42, and b = 0.000112.
Then, the blade stress in different operating cycles was computed. Figure 17 shows the distribution of normal stress along the blade span direction (without the torsional moment) and the distribution of equivalent stress (also considering the torsional moment) under take-off operating conditions. The magnitude and distribution of the normal stress in the blade without the torsional moment was different from those of the equivalent stress also considering the torsional moment. However, whether or not the torsional moment was taken into consideration, the maximum stress invariably occurred at the blade root on the suction side near the gas inlet side, the critical region for fatigue failure as described in Section 4.3. In addition, after considering the torsional moment (i.e., considering the torsional deformation-induced shear stress in the blade), the magnitude of the stress in the critical region increased. This result is consistent with the above conclusion that the torsional deformation accelerated the damage. Therefore, the prediction life of the modified model considering the torsional moment has a high safety factor.
Table 4 shows the fatigue load spectrum of the blade under cyclic loading based on the computed equivalent stress in the critical region. The table includes the maximum and minimum equivalent stresses, the number of operating cycles per 1000 flight hours and the fatigue life of the compressor blade (the number of operating cycles listed in the last column, which was obtained by substituting the equivalent stresses into the fatigue model also considering the torsional moment) under each of the cyclic loading conditions. The fatigue life of the blade also considering the torsional deformation was predicted to be 18,085.21 flight hours, while that of the blade predicted using the same method but without the torsional moment was 18,939.17 flight hours. The additional consideration of the torsional shear stress decreased the fatigue life by 4.5%. For the S-N curve and Miner linear damage accumulation rule, the result was 30,478.8 flight hours, which is extremely larger than the result of the proposed and the original Chaboche model. In Figure 18, the damage accumulation curve of the proposed model and the Miner rule are shown. As the linear model just accumulates the damage of every cycle, while it ignores the interaction between the loading parameters and the damage variables, the damage curve is a straight line. Actually, the damage accumulation rate changes with the loading cycle, as shown with the damage curve of the proposed model. In the first 75% of cycles, the damage accumulation rate is low, but the damage accumulation rate starts to accelerate and increases the accumulative damage quickly for the last 25% of the cycle, while the blade fracture may occur at any time. Hence, considering that the instantaneous fracture of the compressor blade is a great hazard to aircraft flight safety, the additional consideration of the torsional moment in the proposed model increased the safety factor of blade fatigue life prediction, and can thus prevent a blade fatigue fracture to some degree.
Therefore, it is reasonable to conclude that under real operating conditions, a blade is subject to high-cycle fatigue failure due to the torsional vibration. Thus, attention should be paid to the torsional moment-induced vibration and its effect on the blade fatigue characteristics in the design, strength analysis, life prediction, and fault diagnosis of blades.

5. Conclusions

In this study, a numerical computation of a compressor blade was produced to analyze the effect of blade torsional deformation induced by aerodynamic excitation on vibration response and fatigue life. Moreover, the modified nonlinear cumulative damage model was proposed by considering the torsional shear stress caused by airflow. Then, fatigue loading spectra were obtained for the compressor blade and the modified fatigue life model was used to predict the life of the blade. The main conclusions are as follows:
  • A modified nonlinear cumulative damage model is proposed, which is based on the uniaxial tensile-compressive stress, considers the effect of the torsional moment on the cumulative damage rate, and describes the complex stress in the blade after torsional deformation using equivalent stress.
  • When considering the airflow excitation, the frequencies in the modes dominated by bending deformation decreased, whereas those dominated by torsional deformation increased, since the blade has an initial twist angle, and the airflow excitation further increases the torsion effect of the blade. Therefore, compared with the blade vibration characteristics considering the centrifugal load alone, the results considering the airflow excitation could better approximate the blade under the real-world operating conditions of the engine.
  • The vibration of the compressor blade is the result of the stacking of the vibrations at different orders of low frequencies, first- and second-order frequency modes of vibration were more easily excited than high-order modes of vibration. Thus, the torsional deformation increases the complexity of the stress state in the blade, resulting in the stress concentration that occurred at the blade root and changed its fatigue behavior.
  • There is an obvious difference of stress distribution between the normal stress and the equivalent stress including torsional shear stress. Hence, the additional consideration of the torsional shear stress decreased the predicted fatigue life by 4.5%. Moreover, the accumulative damage increased quickly for the last 25% cycle of damage curve, when the blade fracture may occur at any time. Thus, considering the aerodynamic excitation increased the safety factor of blade fatigue life prediction.

Author Contributions

Conceptualization, X.F. and J.Z.; methodology, X.F.; software, X.F. and C.M.; validation, X.F. and J.L.; formal analysis, X.F. and C.M.; investigation, X.F. and J.L.; resources, C.M.; data curation, J.L.; writing—original draft preparation, X.F.; writing—review and editing, X.F.; visualization, C.M.; supervision, J.Z.; project administration, X.F.; funding acquisition, X.F. All authors have read and agreed to the published version of the manuscript.

Funding

This research was funded by the Chinese National Natural Science Foundation, “Research on fatigue life and damage behavior prediction of compressor blade with loads below fatigue limit”, grant number 51905382.

Conflicts of Interest

The authors declare no conflict of interest.

Nomenclature

C, CPdamping matrix of solid and fluid
Dfatigue damage
D0initial damage
Fexternal forces
K, KPstiffness matrix of solid and fluid
M, MPmass matrix of solid and fluid
MTtorque
nloading cycles
N, Nf, Nffatigue life
Psound pressure
Rfadditional node vector
u , u ˙ , u ¨ structural displacement, velocity and acceleration
WPtorsional section modulus
σstress
σastress amplitude
σbtensile strength
σeqvon Mises equivalent stress
σm, σmmean stress, the equivalent mean stress with torque effect
σscentrifugal tensile stress
σ−1fatigue limit
τttorsional shear stress
b0, M0, α, βmaterial parameters
ρ 0 R T coupling mass matrix

References

  1. Sun, X.; Xu, D.; Sun, D. Recent development of casing treatments for aeroengine compressors. Chin. J. Aeronaut. 2019, 32, 1–36. [Google Scholar] [CrossRef]
  2. Abu, A.O.; Eshati, S.; Laskaridis, P.; Singh, R. Aero-engine turbine blade life assessment using the Neu/Sehitoglu damage model. Int. J. Fatigue 2014, 61, 160–169. [Google Scholar] [CrossRef]
  3. Poursaeidi, E.; Babati, A.; Behrouzshad, F.; Arhani, M.R. Failure analysis of an axial compressor first row rotating blades. Eng. Fail. Anal. 2013, 28, 25–33. [Google Scholar] [CrossRef]
  4. Bednarz, A.; Misiolek, W.Z. Numerical and Experimental Assessment of the Effect of Residual Stresses on the Fatigue Strength of an Aircraft Blade. Material 2021, 14, 5279. [Google Scholar] [CrossRef] [PubMed]
  5. Li, Q.; Wang, Y. The Design Problem of Aero-Engine Structure Strength, 1st ed.; Shanghai Jiao Tong University Press: Shanghai, China, 2014; pp. 5–66. [Google Scholar]
  6. Tao, C.; Zhong, P.; Wang, R.; Nie, J. Failure Analysis and Prevention for Rotor in Aero-Engine, 1st ed.; Beijing National Defence Industry Press: Beijing, China, 2000; pp. 5–39. [Google Scholar]
  7. Mårtensson, H. Harmonic Forcing from Distortion in a Boundary Layer Ingesting Fan. Aerospace 2021, 8, 58. [Google Scholar] [CrossRef]
  8. Arena, M.; Chiariello, A.; Castaldo, M.; Palma, L.D. Vibration Response Aspects of a Main Landing Gear Composite Door Designed for High-Speed Rotorcraft. Aerospace 2021, 8, 52. [Google Scholar] [CrossRef]
  9. Zhang, J.; Fu, X.; Kou, H.; Lin, J. Numerical study on vibration characteristics of axial flow compressor blade under fluid-structure interaction. J. Vib. Meas. Diagn. 2018, 38, 59–66. [Google Scholar]
  10. Ernst, M.; Michel, A.; Jeschke, P. Analysis of rotor-stator-interaction and blade-to-blade measurements in a two stage axial flow compressor. J. Turbomach. 2011, 133, 11–27. [Google Scholar] [CrossRef]
  11. Janardhana, K.; Maharana, S.K. Numerical Study of Vibration Stress and Deformation of Rotating Fan Blade of a Gas Turbine. Int. J. Struct. Mechan. Finite Elem. 2017, 3, 1–11. [Google Scholar]
  12. Liu, Y.; Lao, D.; Liu, Y.; Yang, C.; Qi, M.; Ma, C. Harmonic resonance and high cycle fatigue of a radial turbine in pressure fluctuation. Trans. Beijing Inst. Technol. 2014, 34, 1120–1124. [Google Scholar]
  13. Belamri, T.; G.alpin, P.; Braune, A.; Cornelius, C. CFD Analysis of a 15 Stage Axial Compressor: Part I-Methods, ASME Turbo Expo 2005: Power for Land, Sea, and Air; American Society of Mechanical Engineers: Reno, NV, USA, 2005; pp. 1001–1008. [Google Scholar]
  14. Belamri, T.; G.alpin, P.; Braune, A.; Cornelius, C. CFD Analysis of a 15 Stage Axial Compressor: Part II-Results, ASME Turbo Expo 2005: Power for Land, Sea, and Air; American Society of Mechanical Engineers: Reno, NV, USA, 2005; pp. 1009–1017. [Google Scholar]
  15. Ni, Q.; Hou, A.; Liu, R.; Zhou, B.; Zhang, M. Separation flow and blade dynamic response characteristic of compressor at high attack angle. J. Beijing Univ. Aeronaut. Astronaut. 2017, 43, 1410–1418. [Google Scholar]
  16. Berg, D.; Wilson, D.; Resor, B.; Barone, M.; Berg, J.; Kota, S.; Ervin, G. Active aerodynamic blade load control impacts on utility-scale wind turbines. In Proceedings of the Windpower Conference & Exhibition, Chicago, IL, USA, 1 April 2009. [Google Scholar]
  17. Kaewbumrung, M.; Tangsopa, W.; Thongsri, J. Investigation of the trailing edge modification effect on compressor blade aerodynamics using SST k-ω turbulence model. Aerospace 2019, 6, 48. [Google Scholar] [CrossRef] [Green Version]
  18. Amoo, L. On the design and structural analysis of jet engine fan blade structures. Prog. Aerosp. Sci. 2013, 60, 1–11. [Google Scholar] [CrossRef]
  19. Song, X.; Wang, L.; Niinomi, M.; Nakai, M.; Liu, Y. Fatigue characteristics of a biomedical β-type titanium alloy with titanium boride. Mater. Sci. Eng. A 2015, 640, 154–164. [Google Scholar] [CrossRef]
  20. Zhang, Y.; Maddox, S.; Manteghi, S. Verification of Class B S-N curve for fatigue design of steel forgings. Int. J. Fatigue 2016, 92, 246–261. [Google Scholar] [CrossRef]
  21. Miner, M.A. Cumulative damage in fatigue. J. Appl. Mech. 1945, 12, 159–164. [Google Scholar] [CrossRef]
  22. Marco, S.M.; Starkey, W.L. A concept of fatigue damage. Trans. ASME 1954, 76, 627–632. [Google Scholar]
  23. Gatts, R. Application of a cumulative damage concept to fatigue. J. Fluids Eng. 1961, 83, 529–534. [Google Scholar] [CrossRef]
  24. Manson, S.S.; Halford, G.R. Practical implementation of the double linear damage rule and damage curve approach for treating cumulative fatigue damage. Int. J. Fract. 1981, 17, 169–192. [Google Scholar] [CrossRef] [Green Version]
  25. Sonsino, C. Course of SN-curves especially in the high-cycle fatigue regime with regard to component design and safety. Int. J. Fatigue 2007, 29, 2246–2258. [Google Scholar] [CrossRef]
  26. Zhang, J.; Yang, S.; Lin, L. A nonlinear continuous damage model based on short-crack concept under variable amplitude loading. Fatigue Fract. Eng. Mater. Struct. 2016, 39, 79–94. [Google Scholar] [CrossRef]
  27. Chaboche, J.; Lesne, M. A non-linear continuous fatigue damage model. Fatigue Fract. Eng. Mater. Struct. 1988, 11, 1–17. [Google Scholar] [CrossRef]
  28. Dattoma, V.; Giancane, S.; Nobile, R.; Panella, F. Fatigue life prediction under variable loading based on a new non-linear continuum damage mechanics model. Int. J. Fatigue 2006, 28, 89–95. [Google Scholar] [CrossRef]
  29. Malcher, L.; Mamiya, E. An improved damage evolution law based on continuum damage mechanics and its dependence on both stress triaxiality and the third invariant. Int. J. Plast. 2014, 56, 232–261. [Google Scholar] [CrossRef]
  30. Yao, Y.; He, X.; Keer, L.; Fine, M. A continuum damage mechanics-based unified creep and plasticity model for solder materials. Acta Mater. 2015, 83, 160–168. [Google Scholar] [CrossRef]
  31. Van, D.; Lee, C.; Chang, K. High cycle fatigue analysis in presence of residual stresses by using a continuum damage mechanics model. Int. J. Fatigue 2015, 70, 51–62. [Google Scholar]
  32. Gao, T.; Jing, J.; Chen, C.; Cong, J.; Li, J.; Cao, S. A practical nonlinear damage accumulation method to predict the life and crack propagation of blade subjected to multilevel cyclic fatigue loads. J. Strain Anal. Eng. Des. 2020, 55, 86–98. [Google Scholar] [CrossRef]
  33. Heylen, W.; Stefan, L.; Paul, S. Modal Analysis Theory and Testing; Katholieke Universiteit Leuven: Leuven, Belgium, 1997. [Google Scholar]
  34. Ma, Y.; Cao, S.; Guo, H. Nonlinear aeroelastic analysis of rotating shrouded blades under coupled bending and torsional vibration. J. Vib. Shock 2019, 38, 67–74. [Google Scholar]
  35. Mohaghegh, K.; Sadeghi, M.; Abdullah, A. Reverse engineering of turbine blades based on design intent. Int. J. Adv. Manuf. Technol. 2007, 32, 1009–1020. [Google Scholar] [CrossRef]
  36. Kou, H.; Lin, J.; Zhang, J.; Fu, X. Dynamic and fatigue compressor blade characteristics during fluid-structure interaction: Part I—Blade modelling and vibration analysis. Eng. Fail. Anal. 2017, 76, 80–98. [Google Scholar] [CrossRef]
  37. Fu, X.; Zhang, J.; Lin, J. Study on fatigue life and damage accumulation of compressor blade based on a modified nonlinear damage model. Fatigue Fract. Eng. Mater. Struct. 2017, 41, 1077–1088. [Google Scholar] [CrossRef]
  38. Kielb, R.E.; Barter, J.W.; Thomas, J.P.; Hall, K.C. Blade excitation by aerodynamic instabilities: A compressor blade study. In Turbo Expo: Power for Land, Sea, and Air; American Society of Mechanical Engineers: Atlanta, GA, USA, 2003; pp. 399–406. [Google Scholar]
  39. Im, H.S.; Zha, G. Simulation of non-synchronous blade vibration of an axial compressor using a fully coupled fluid/structure interaction. In Turbo Expo: Power for Land, Sea, and Air; American Society of Mechanical Engineers: Copenhagen, Denmark, 2012; pp. 1395–1407. [Google Scholar]
  40. Espinal, D.; Im, H.S.; Zha, G. Full-annulus simulation of nonsynchronous blade vibration excitation of an axial compressor. J. Turbomach. 2018, 140, 031008. [Google Scholar] [CrossRef]
Figure 1. Stress state of blade under torsional vibration. (a) Torsional stress of blade; (b) Deformation of blade; (c) Tensile stress of blade; (d) Stress state.
Metals 11 01835 g001
Figure 2. Blade geometry dimension and reversed modeling. (a) Geometric dimension of blade; (b) Blade geometry data acquisition; (c) Point cloud data block of blade; (d) Reference object.
Metals 11 01835 g002
Figure 3. Tensile test of Ti-6Al-4V titanium alloy. (a) Equipment of tensile test; (b) The tensile curve of Ti-6Al-4V titanium alloy at room temperature.
Metals 11 01835 g003
Figure 4. The blade FE model and constrain conditions.
Metals 11 01835 g004
Figure 5. Modal test of the blade.
Metals 11 01835 g005
Figure 6. CFD model of compressor blade.
Metals 11 01835 g006
Figure 7. Grid convergence testing of CFD model. (a) Schematic diagram of the monitoring line; (b) Aerodynamic pressure of 90% of the blade span.
Metals 11 01835 g007aMetals 11 01835 g007b
Figure 8. Aerodynamic pressure comparison of blade at 6278, 8847 and 9561 rpm.
Metals 11 01835 g008
Figure 9. Location of measurement points. (a) Pressure side; (b) Suction side.
Metals 11 01835 g009
Figure 10. Pressure time domain diagram of P1 and P2 at 6278 rpm. (a) P1; (b) P2.
Metals 11 01835 g010
Figure 11. Pressure time domain diagram of P3, P4 and P5 at 6278 rpm. (a) P3; (b) P4; (c) P5.
Metals 11 01835 g011
Figure 12. Spectrum values of natural frequency and displacement response under typical speed conditions. (a) 6278 rpm; (b) 6966 rpm; (c) 8847 rpm; (d) 9172 rpm; (e) 9337 rpm; (f) 9561 rpm.
Metals 11 01835 g012
Figure 13. Stress distribution of blade at different time in ground idling condition. (a) Pressure side; (b) Suction side.
Metals 11 01835 g013
Figure 14. Fatigue failure locations of a compressor 5th blade.
Metals 11 01835 g014
Figure 15. Fatigue test of Ti-6Al-4V titanium alloy. (a) Equipment of fatigue test; (b) The test loads; (c) The fractured specimen of fatigue test.
Metals 11 01835 g015
Figure 16. Fatigue test results and fatigue model fitting curve.
Metals 11 01835 g016
Figure 17. Stress distribution of blade. (a) Distribution of normal stress (without the torsional moment); (b) Distribution of equivalent stress (including the torsional moment).
Metals 11 01835 g017
Figure 18. Comparisons of damage accumulation curves of different models.
Metals 11 01835 g018
Table 1. Validation results for the finite element model.
Mode No.Nature Frequency/HzRelative Error/%Mode Shape
Test ResultsComputational Results
1272.94284.904.381st order bending Metals 11 01835 i001
2956.941006.805.211st order torsion Metals 11 01835 i002
31283.131256.502.082nd order bending Metals 11 01835 i003
42133.931950.608.59Bending-torsioncomposite Metals 11 01835 i004
52752.603011.209.392nd order torsion Metals 11 01835 i005
Table 2. Typical operational conditions [37].
CaseTake OffMaximum ContinuousCruiseDescendingFlight IdleGround Idle
Rotational speed/rpm956193379172884769666278
Table 3. The natural frequency of the blade in typical engine conditions [36].
Mode No.Load ConditionDynamic Frequency/Hz
6278 (rpm)6966 (rpm)8847 (rpm)9172 (rpm)9337 (rpm)9561 (rpm)
1CL 1357.78371.62413.15420.77424.68430.04
CL+ AL 2356.81370.61412.06419.48423.37428.63
2CL1040.61044.91057.91060.21061.41063.1
CL+ AL1044.41050.31068.61072.21074.21076.2
3CL1348.71363.11409.31418.21422.81429.2
CL+ AL1347.61361.31404.81413.51417.91423.6
4CL2069.72073.92087.52090.22091.62093.6
CL+ AL2078.82084.62103.82107.92109.92112.5
5CL3136.33140.83154.83157.53159.03160.9
CL+ AL3153.53164.63200.33207.93211.73216.0
6CL3288.73305.83362.03373.13378.83386.8
CL+ AL3290.93307.73365.13378.23384.53391.9
1 CL denotes only centrifugal load, 2 CL + AL denote both centrifugal and aerodynamic loads.
Table 4. The fatigue loading spectrum of the blade in typical engine conditions.
Operating CycleMaximum Stress (MPa)Minimum Stress (MPa)Number of Loading Cycles (Cycle/1000 h)Fatigue Life (Cycle)
0—take-off—0563.54031132,723
Ground idle speed—take-off—ground idle speed563.54215.953750,729
0—maximum endurance—0525.63024439,896
flight idle speed—descending—flight idle speed437.76264.588952142,770
Cruising—flight idle speed—cruising525.63480.647494868,250
Publisher’s Note: MDPI stays neutral with regard to jurisdictional claims in published maps and institutional affiliations.

