
Correlation between Fractal Dimension and Areal Surface Parameters for Fracture Analysis after Bending-Torsion Fatigue


Abstract
:1. Introduction
2. Materials and Methods
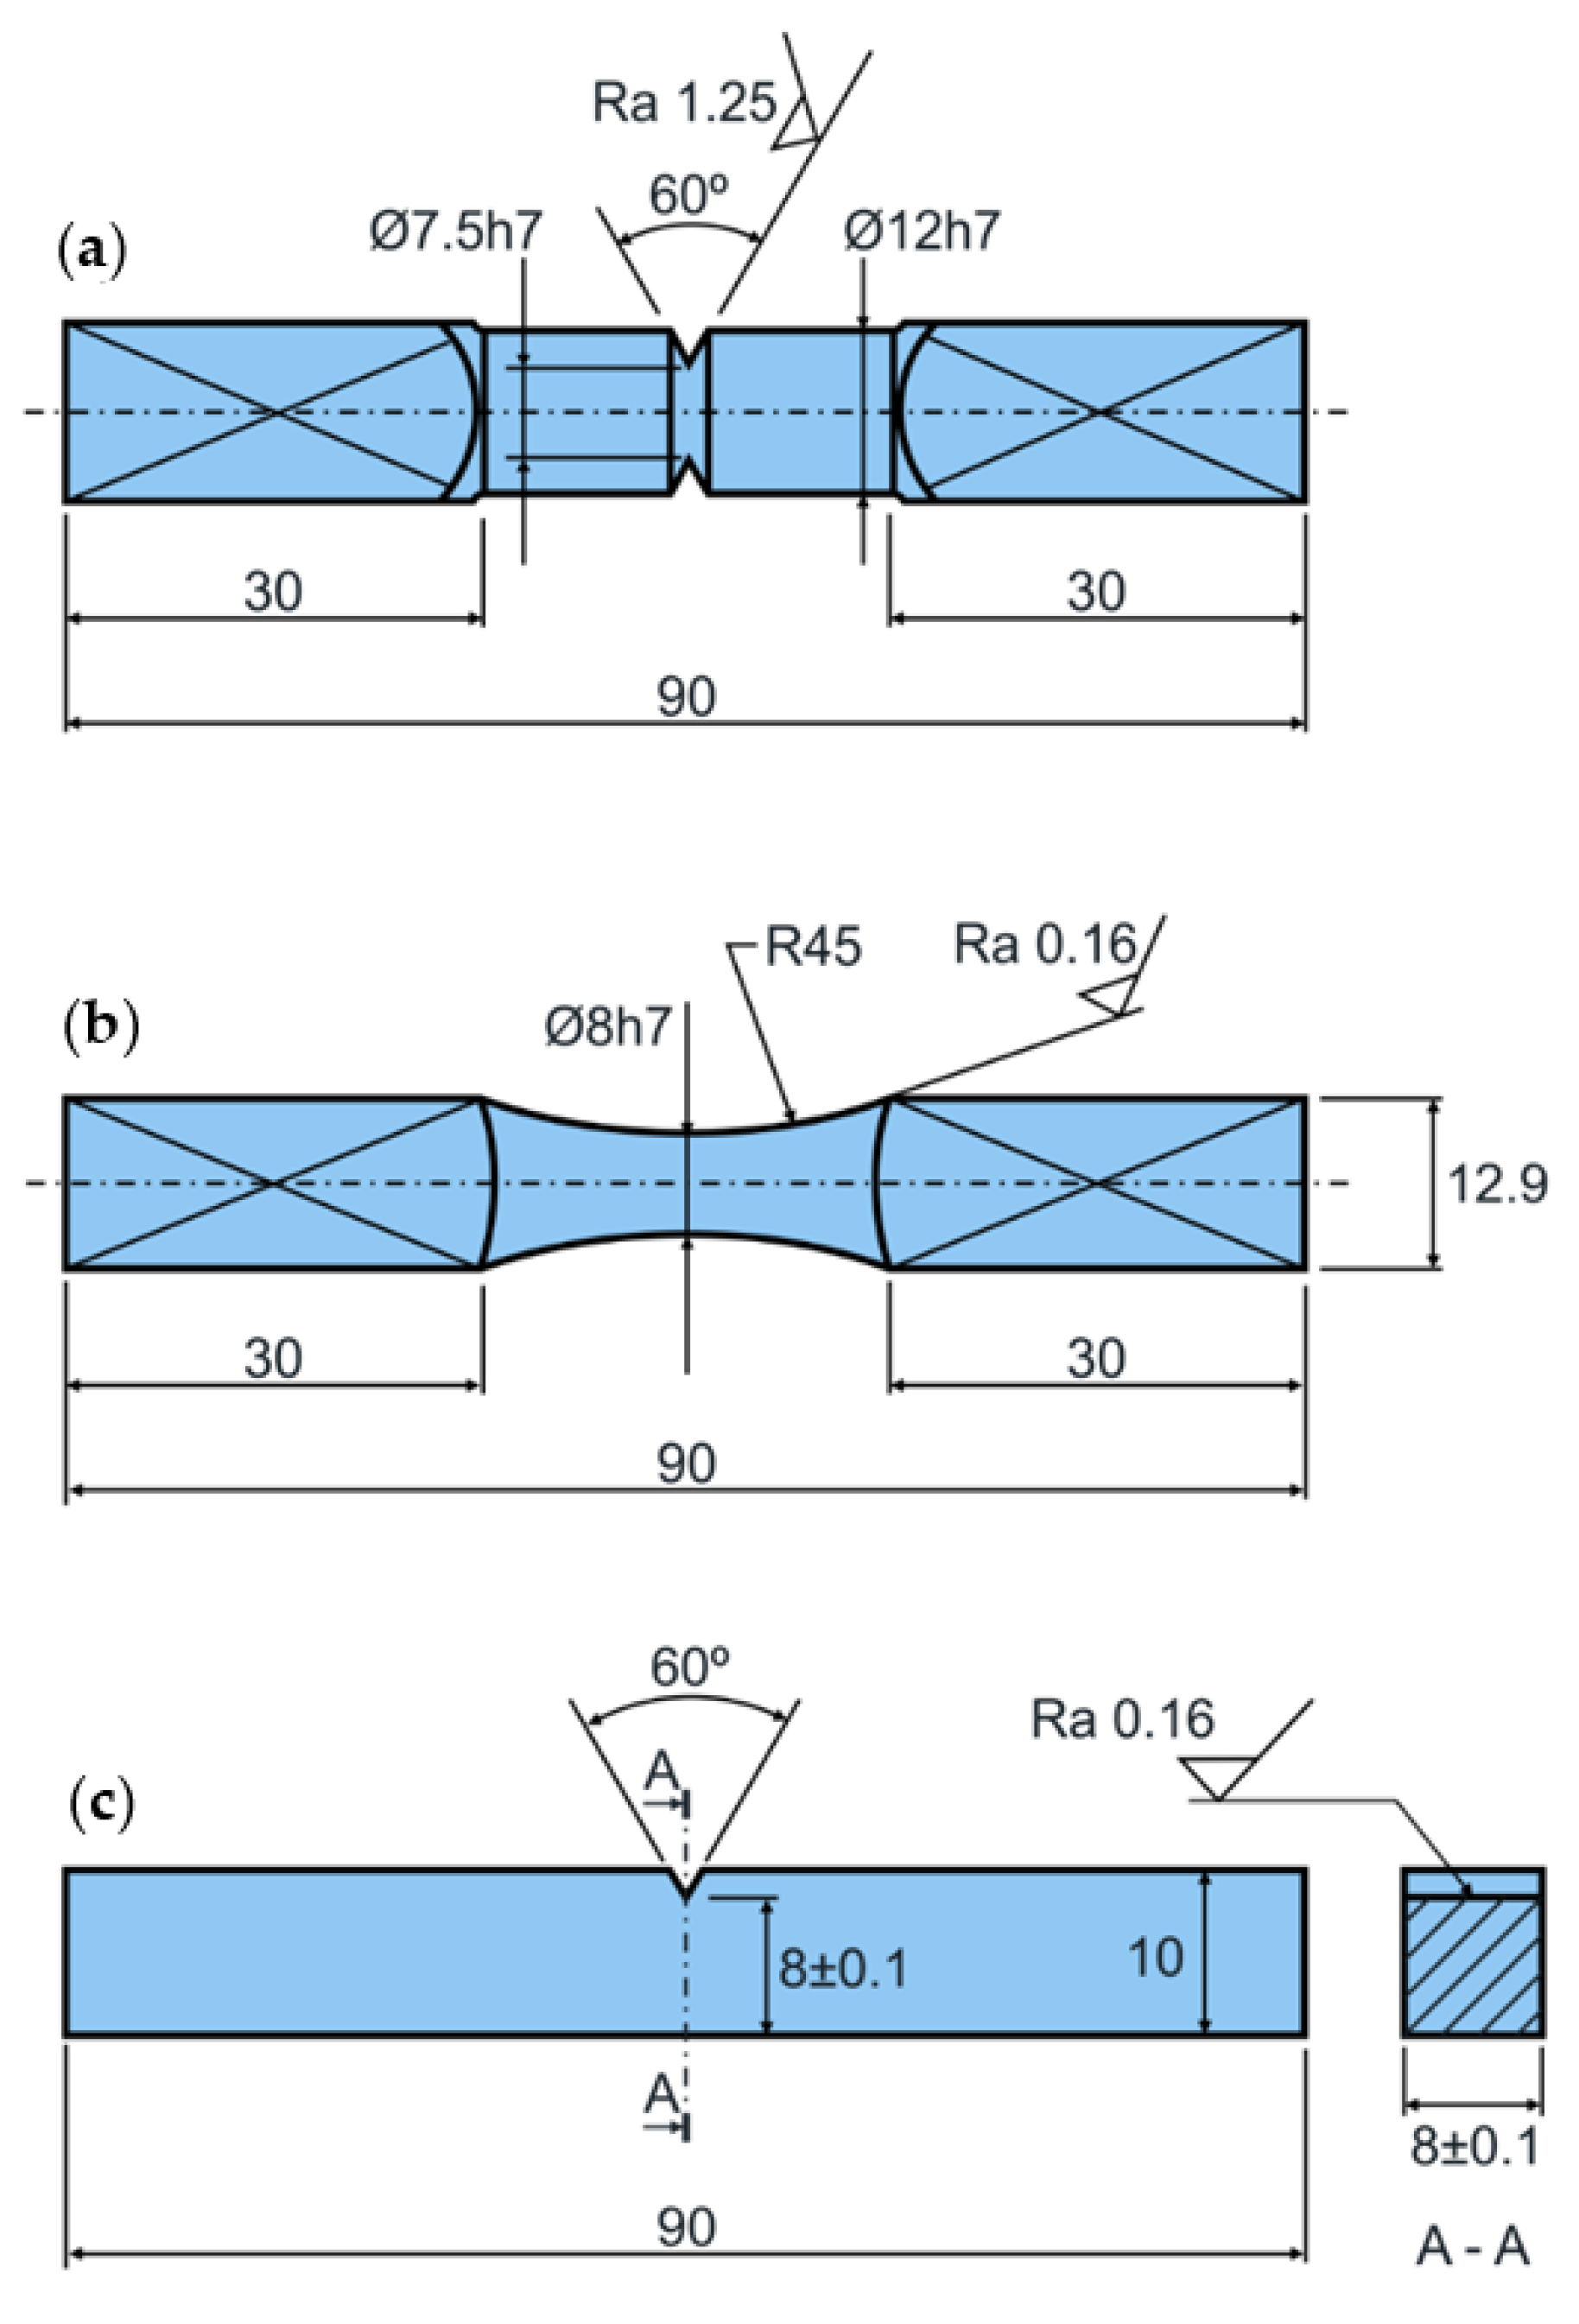
2.1. Fatigue Test Materials and Campaign
2.2. Fracture Surface Topography Measurement
3. Results and Discussion
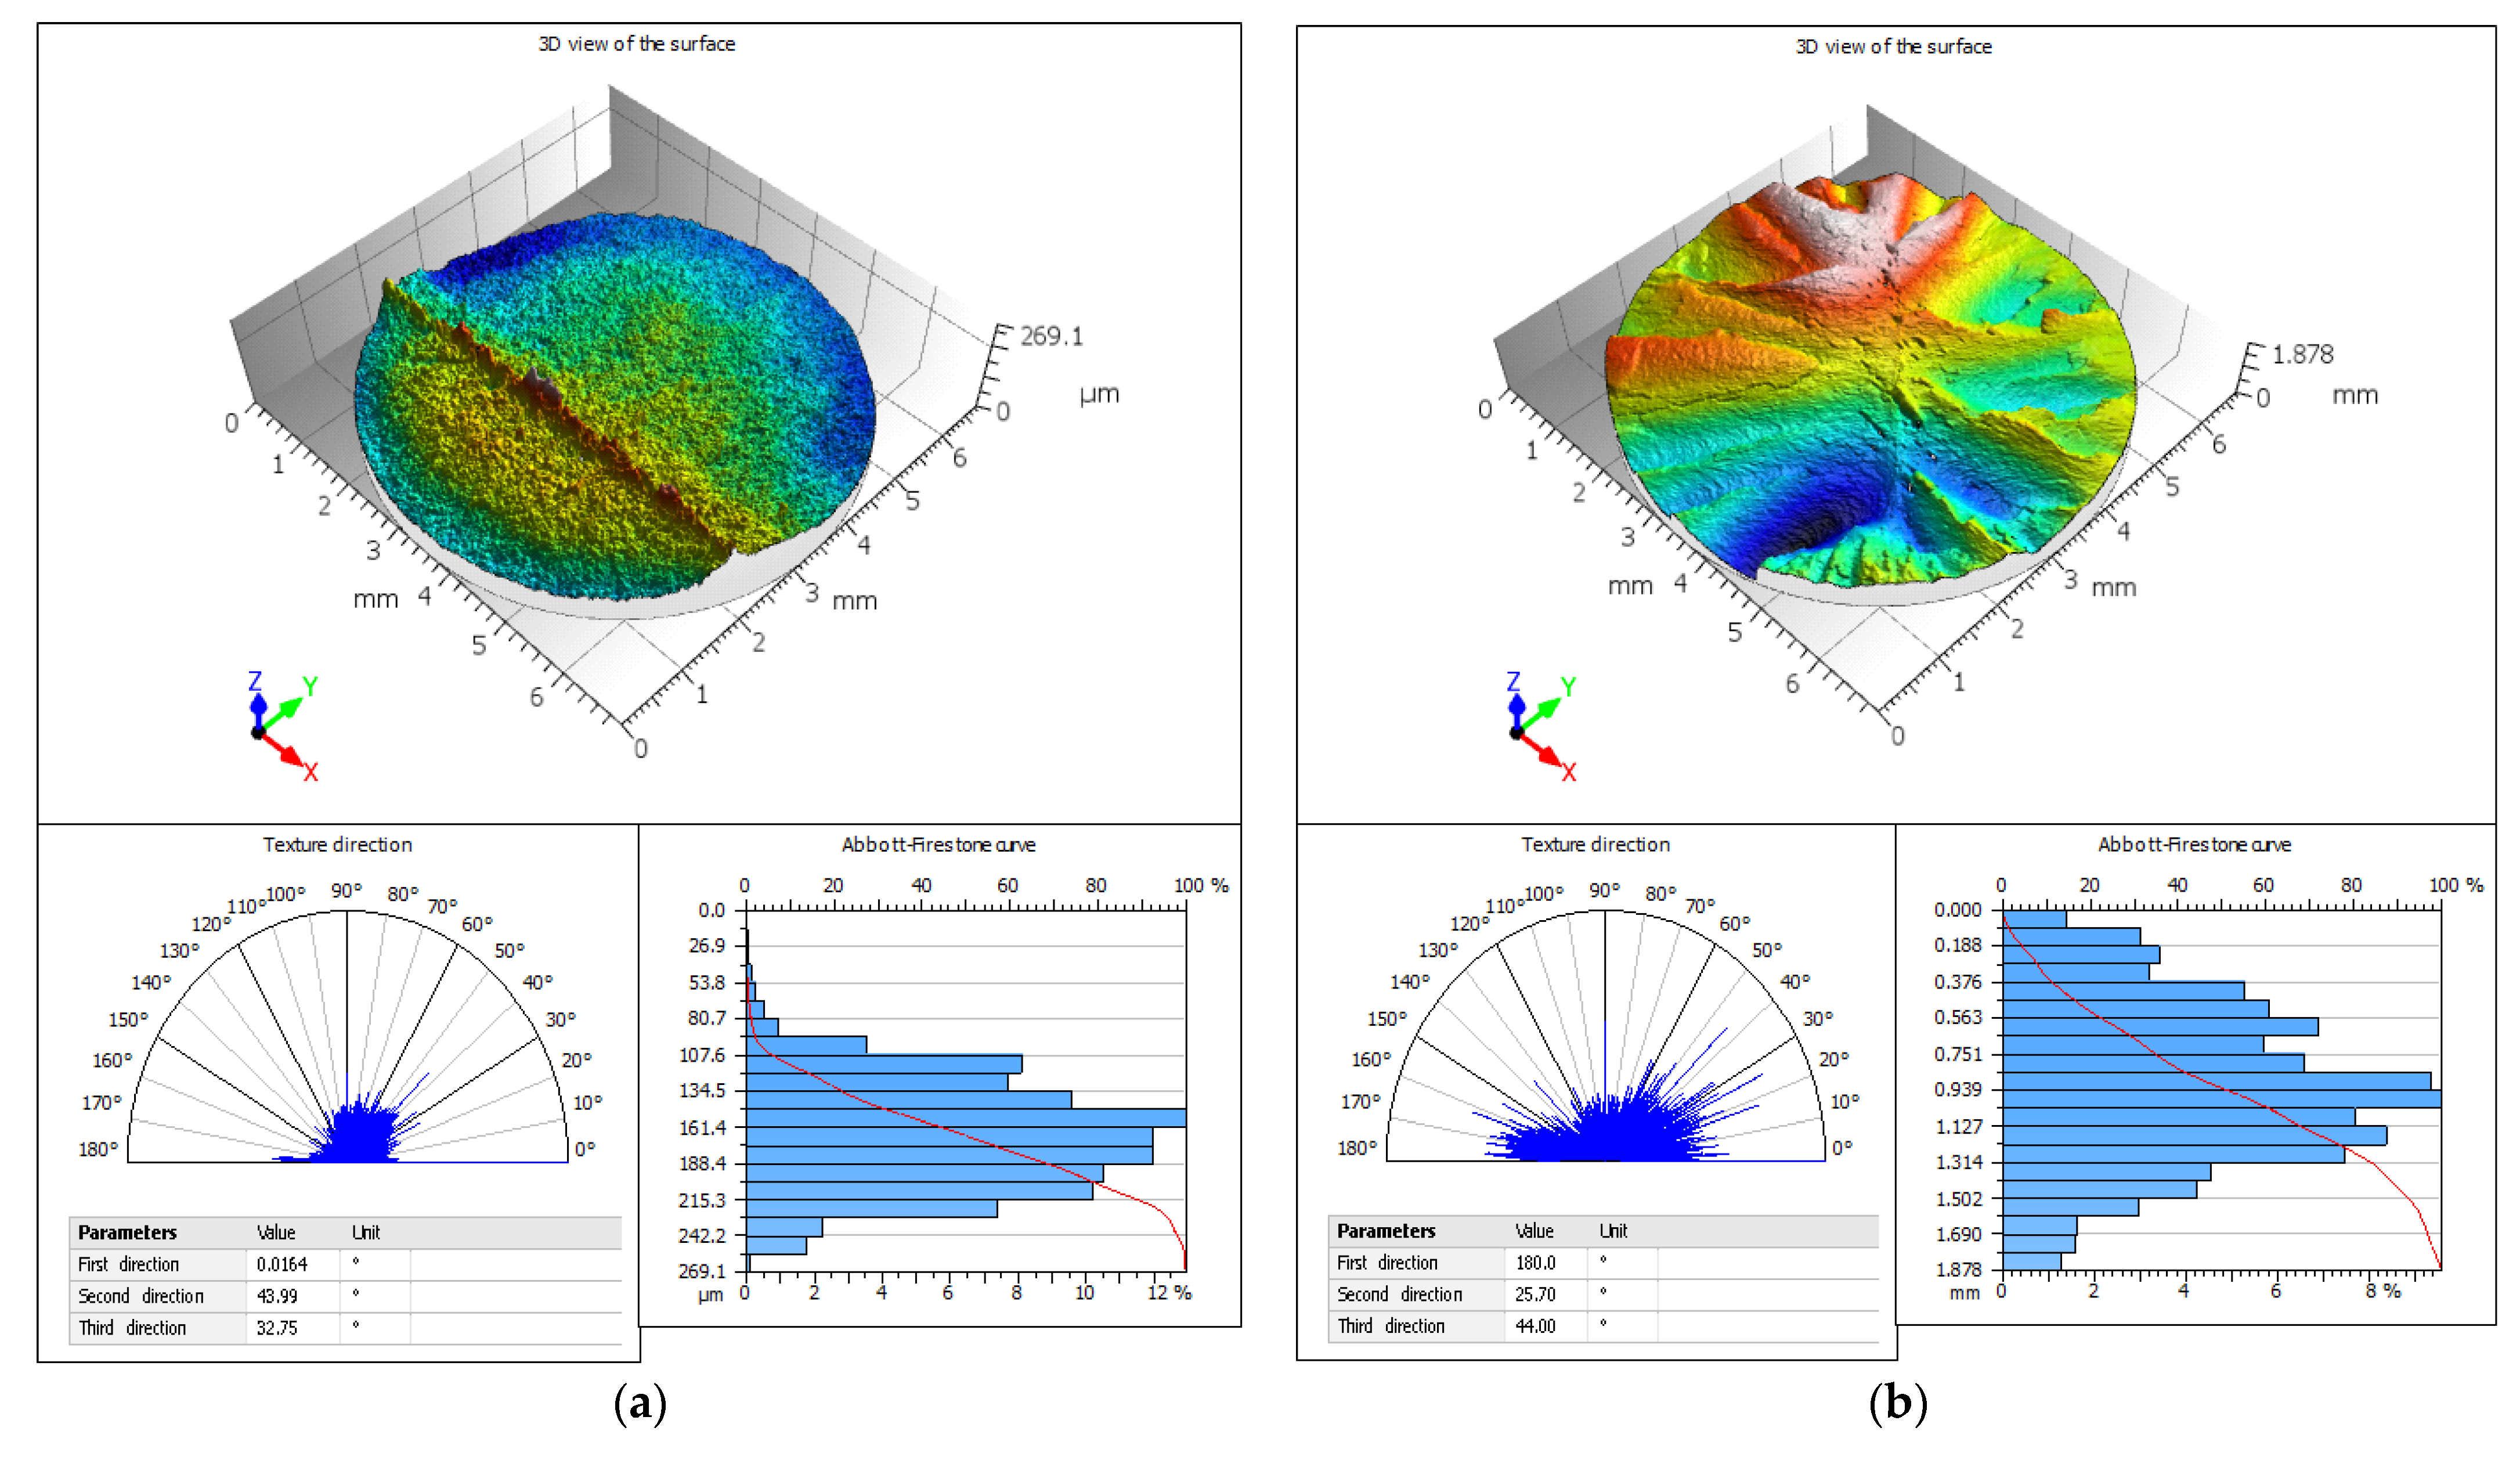
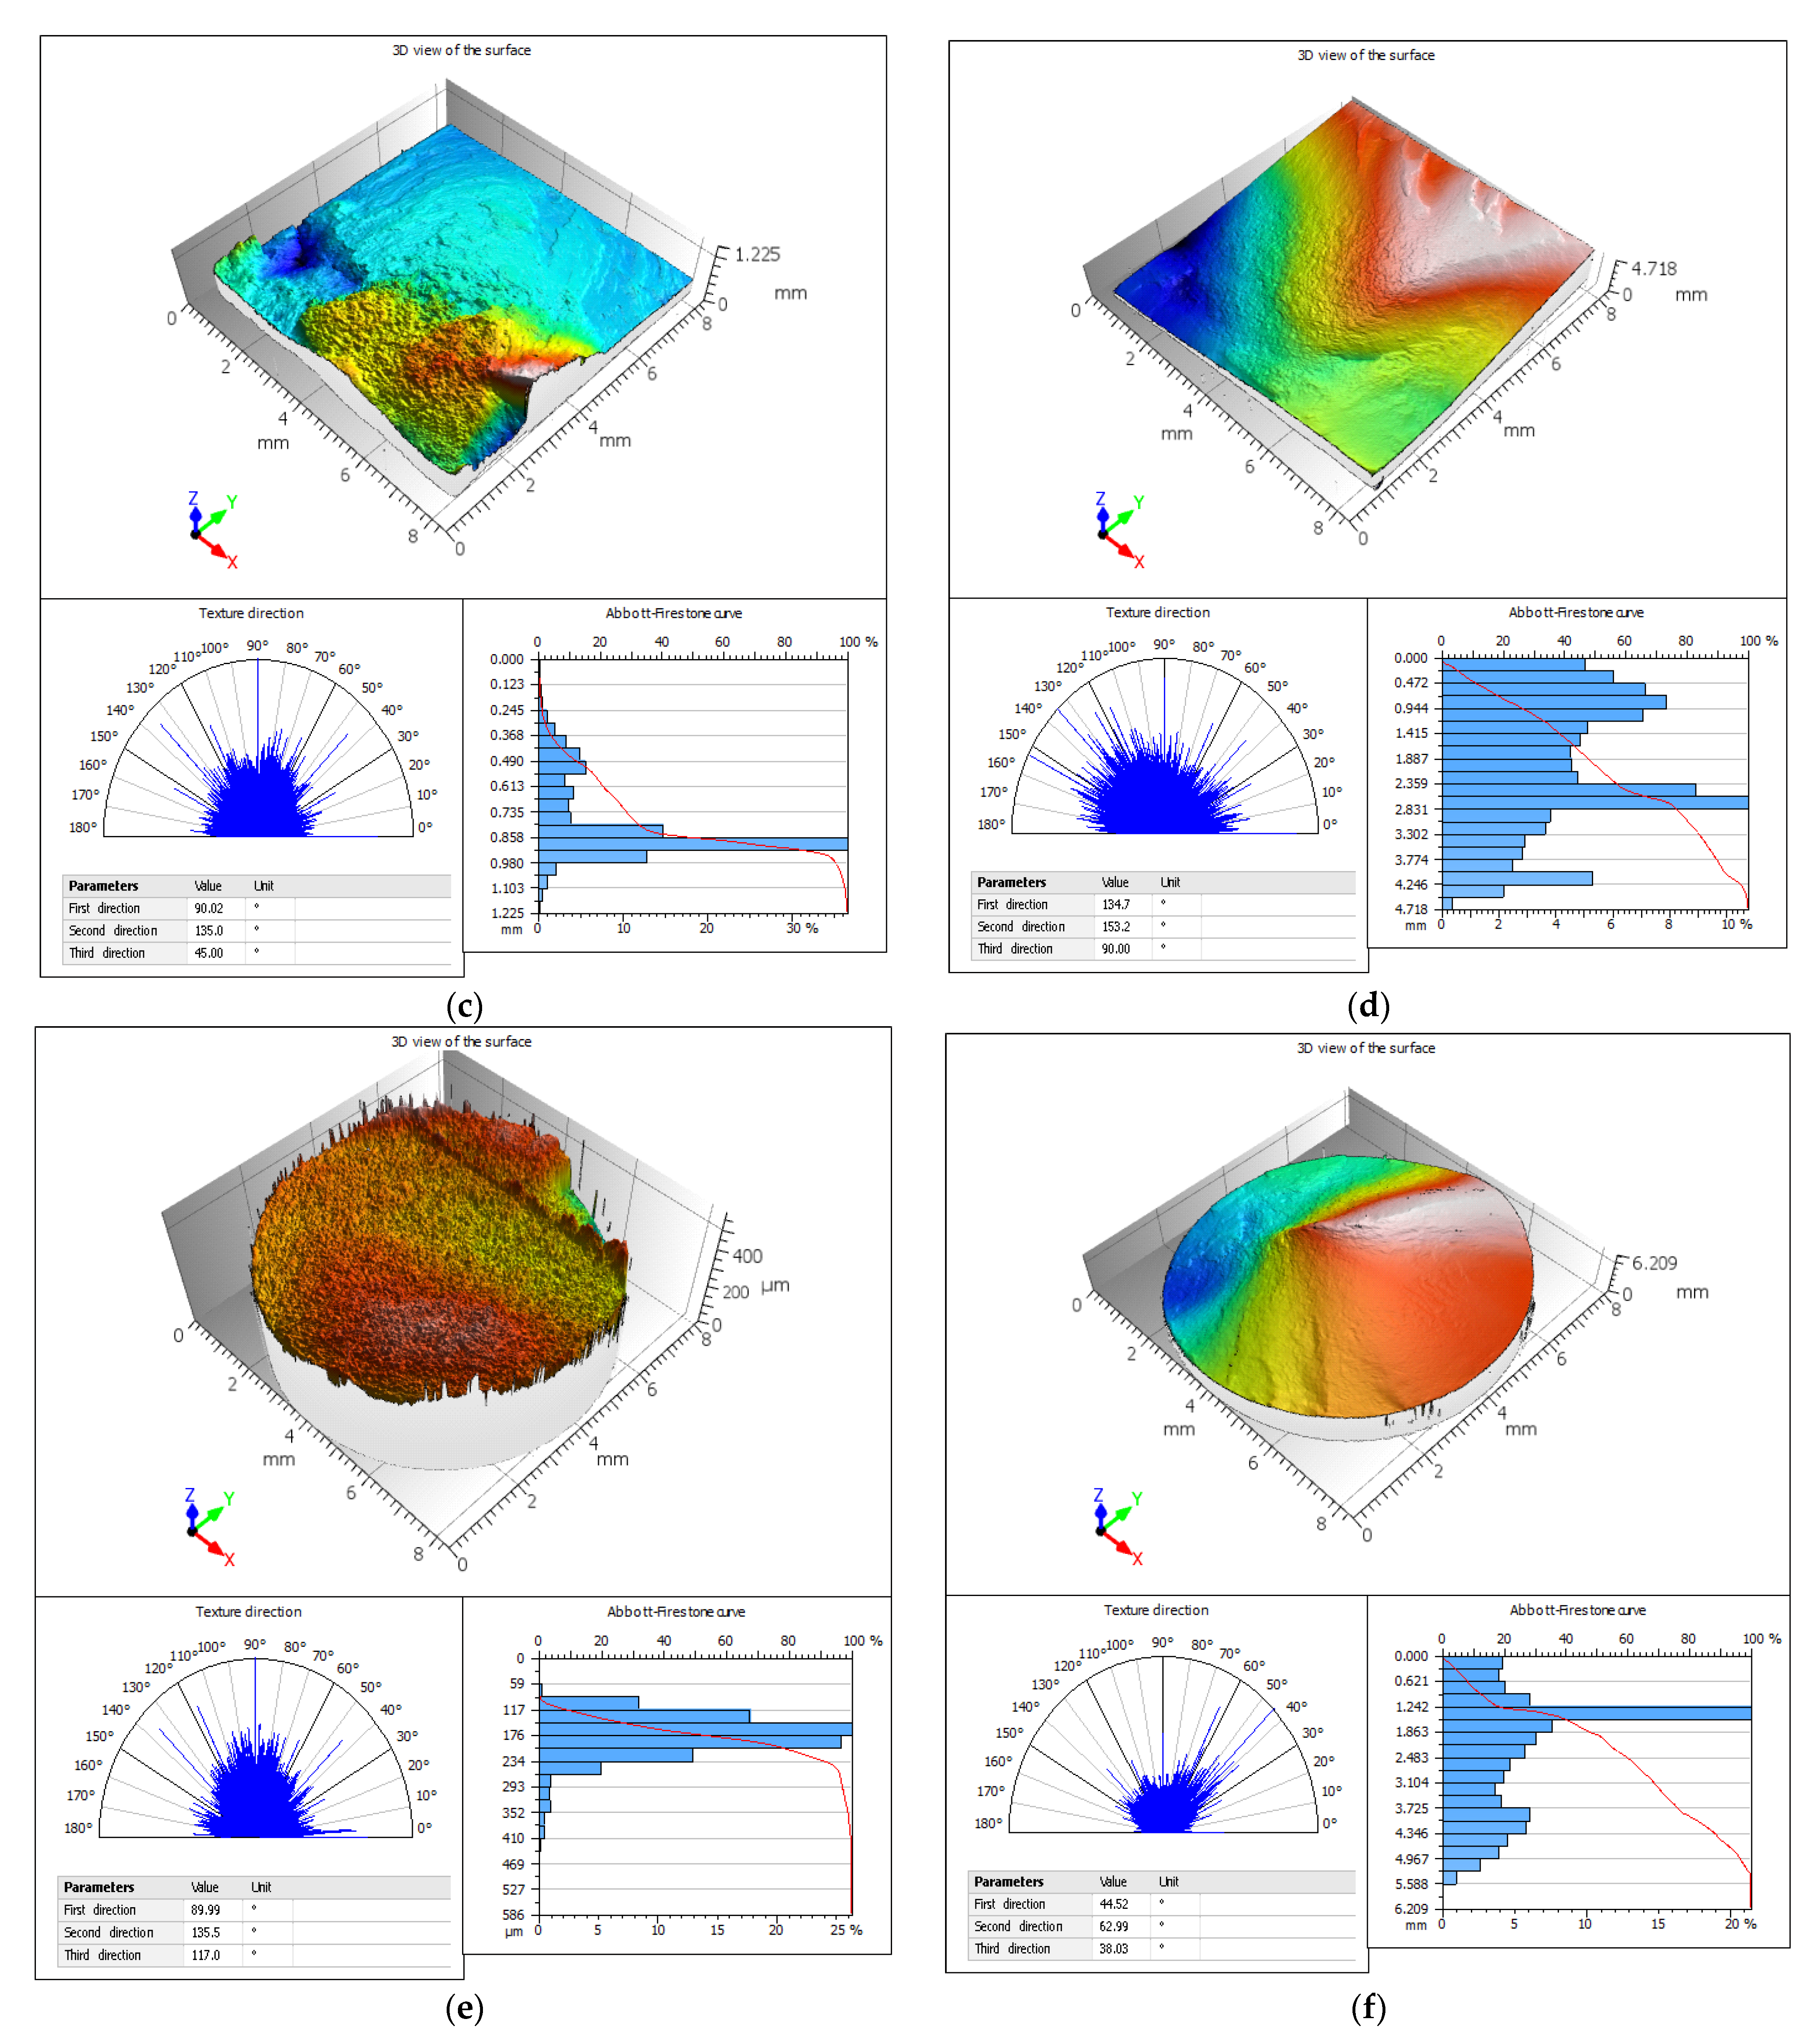
3.1. Measurement Results
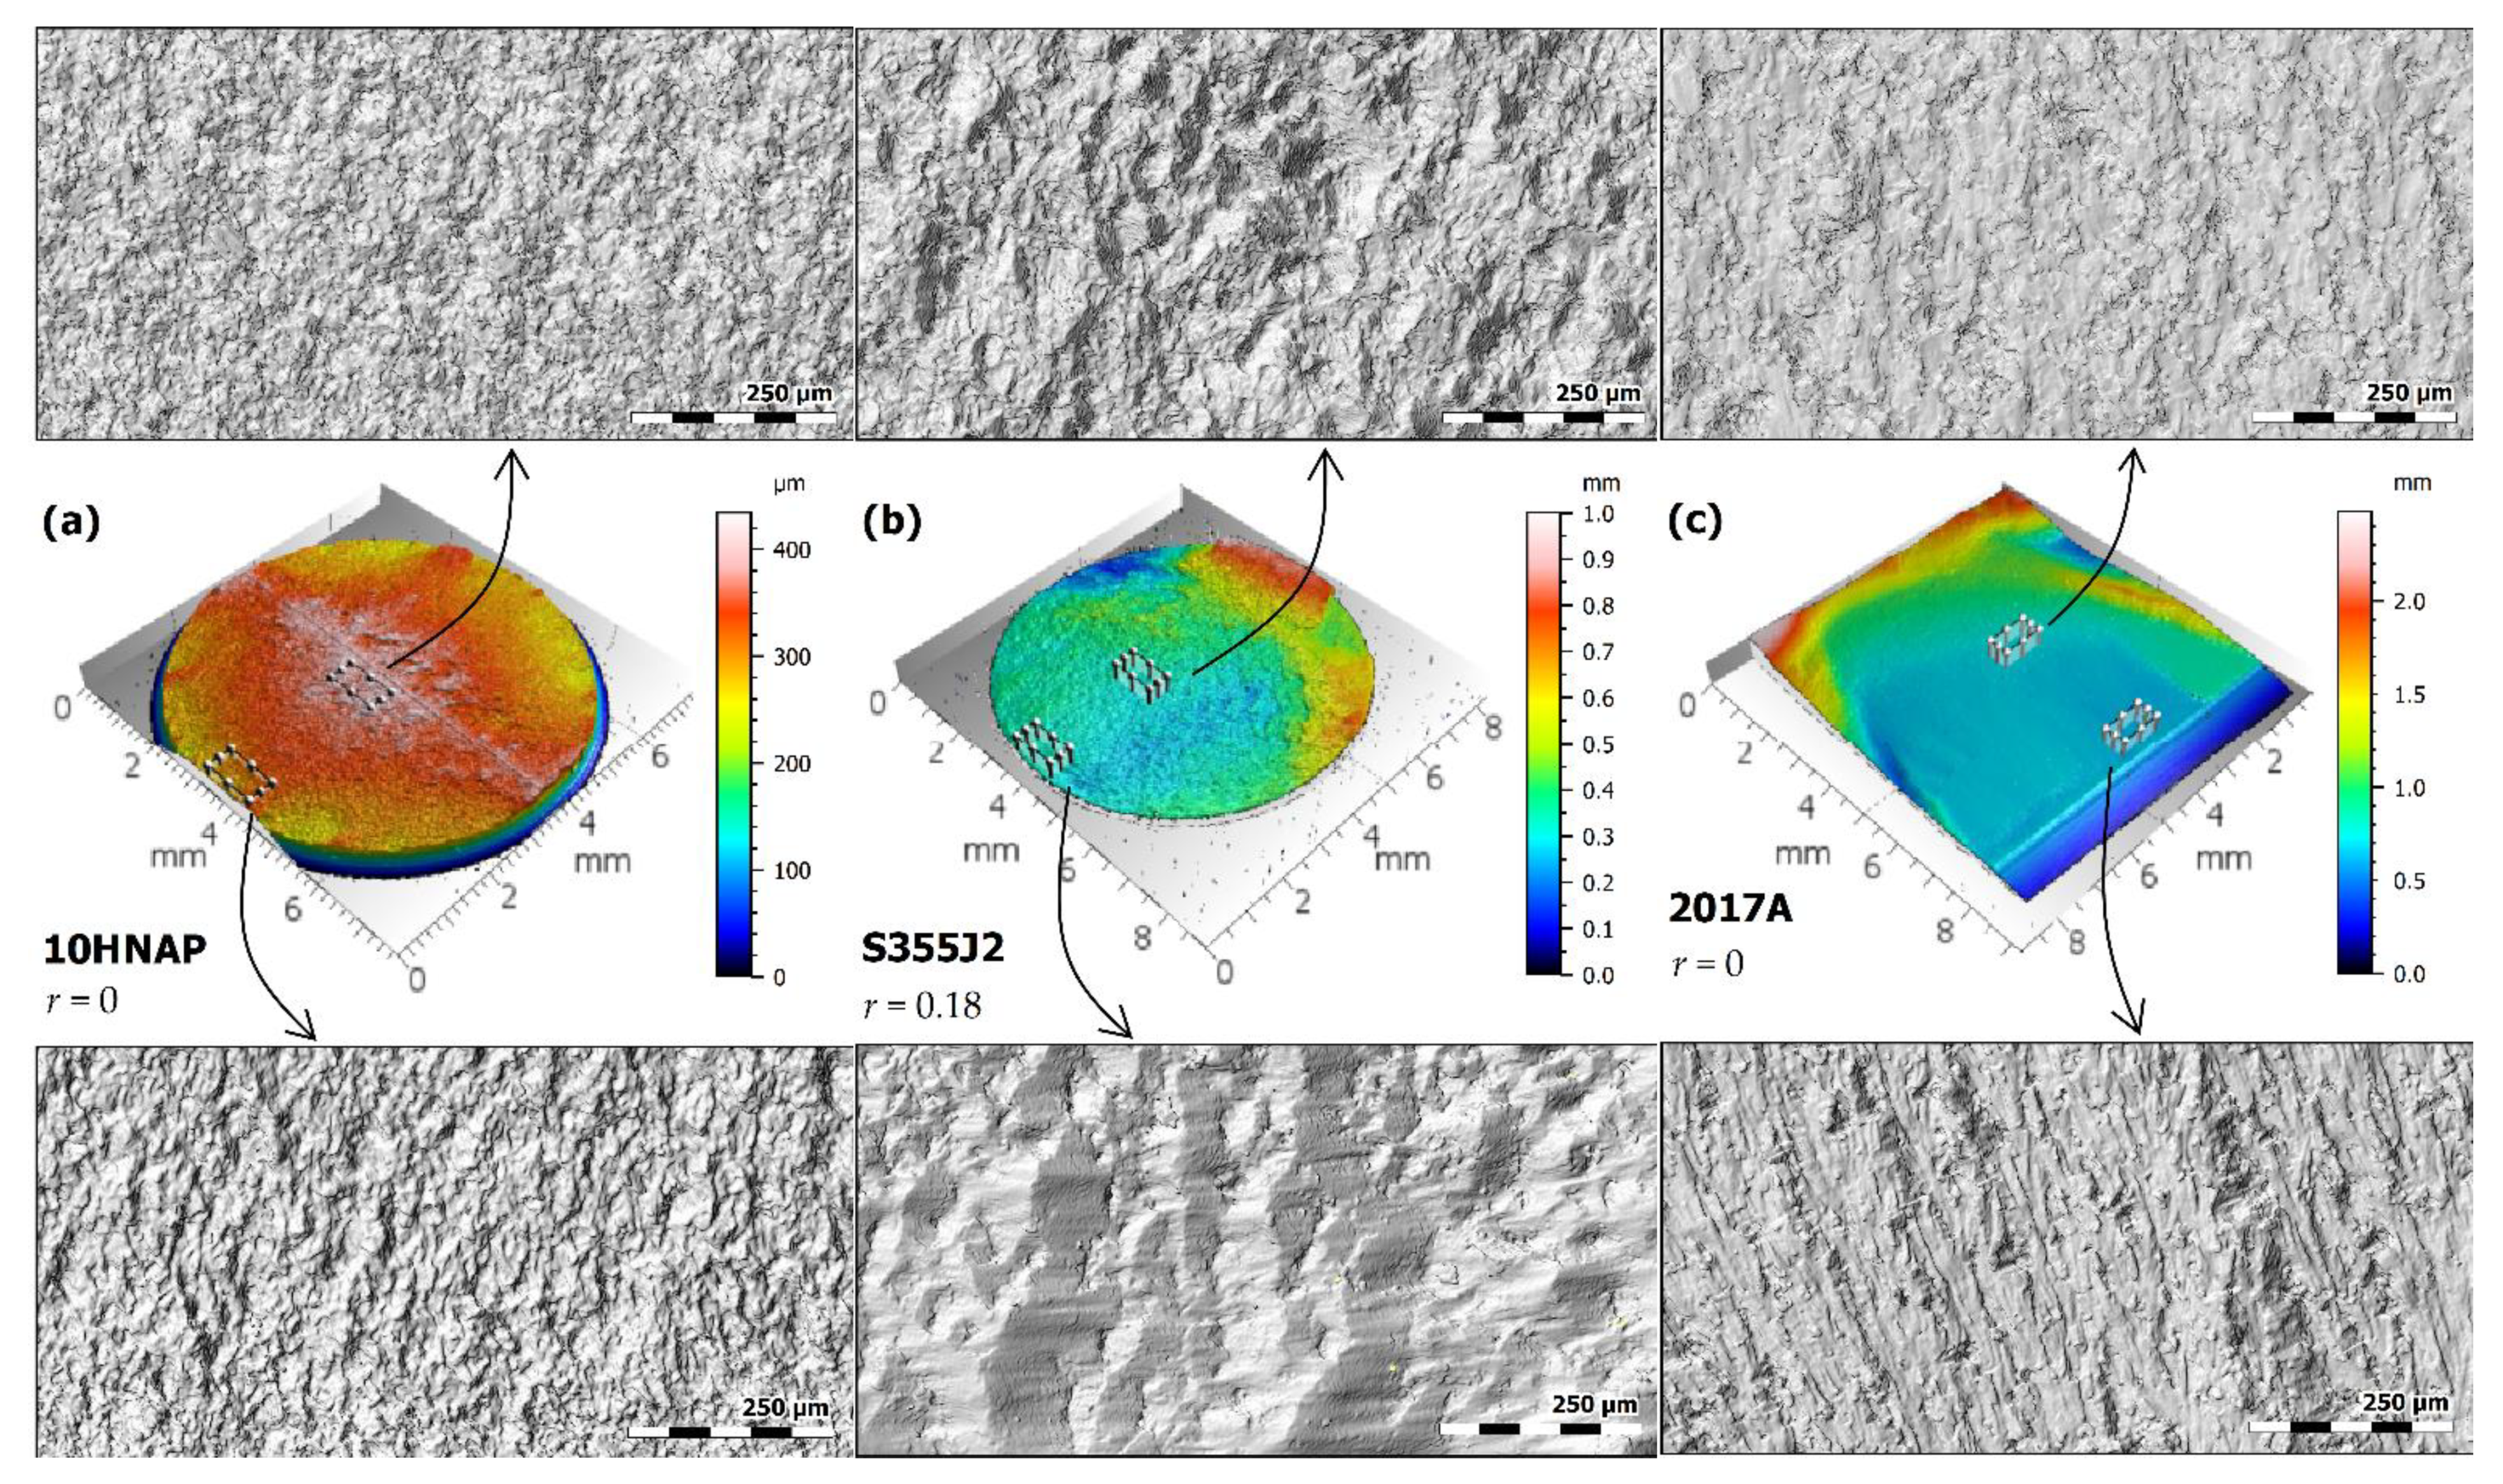
3.2. Individual Fracture Zones
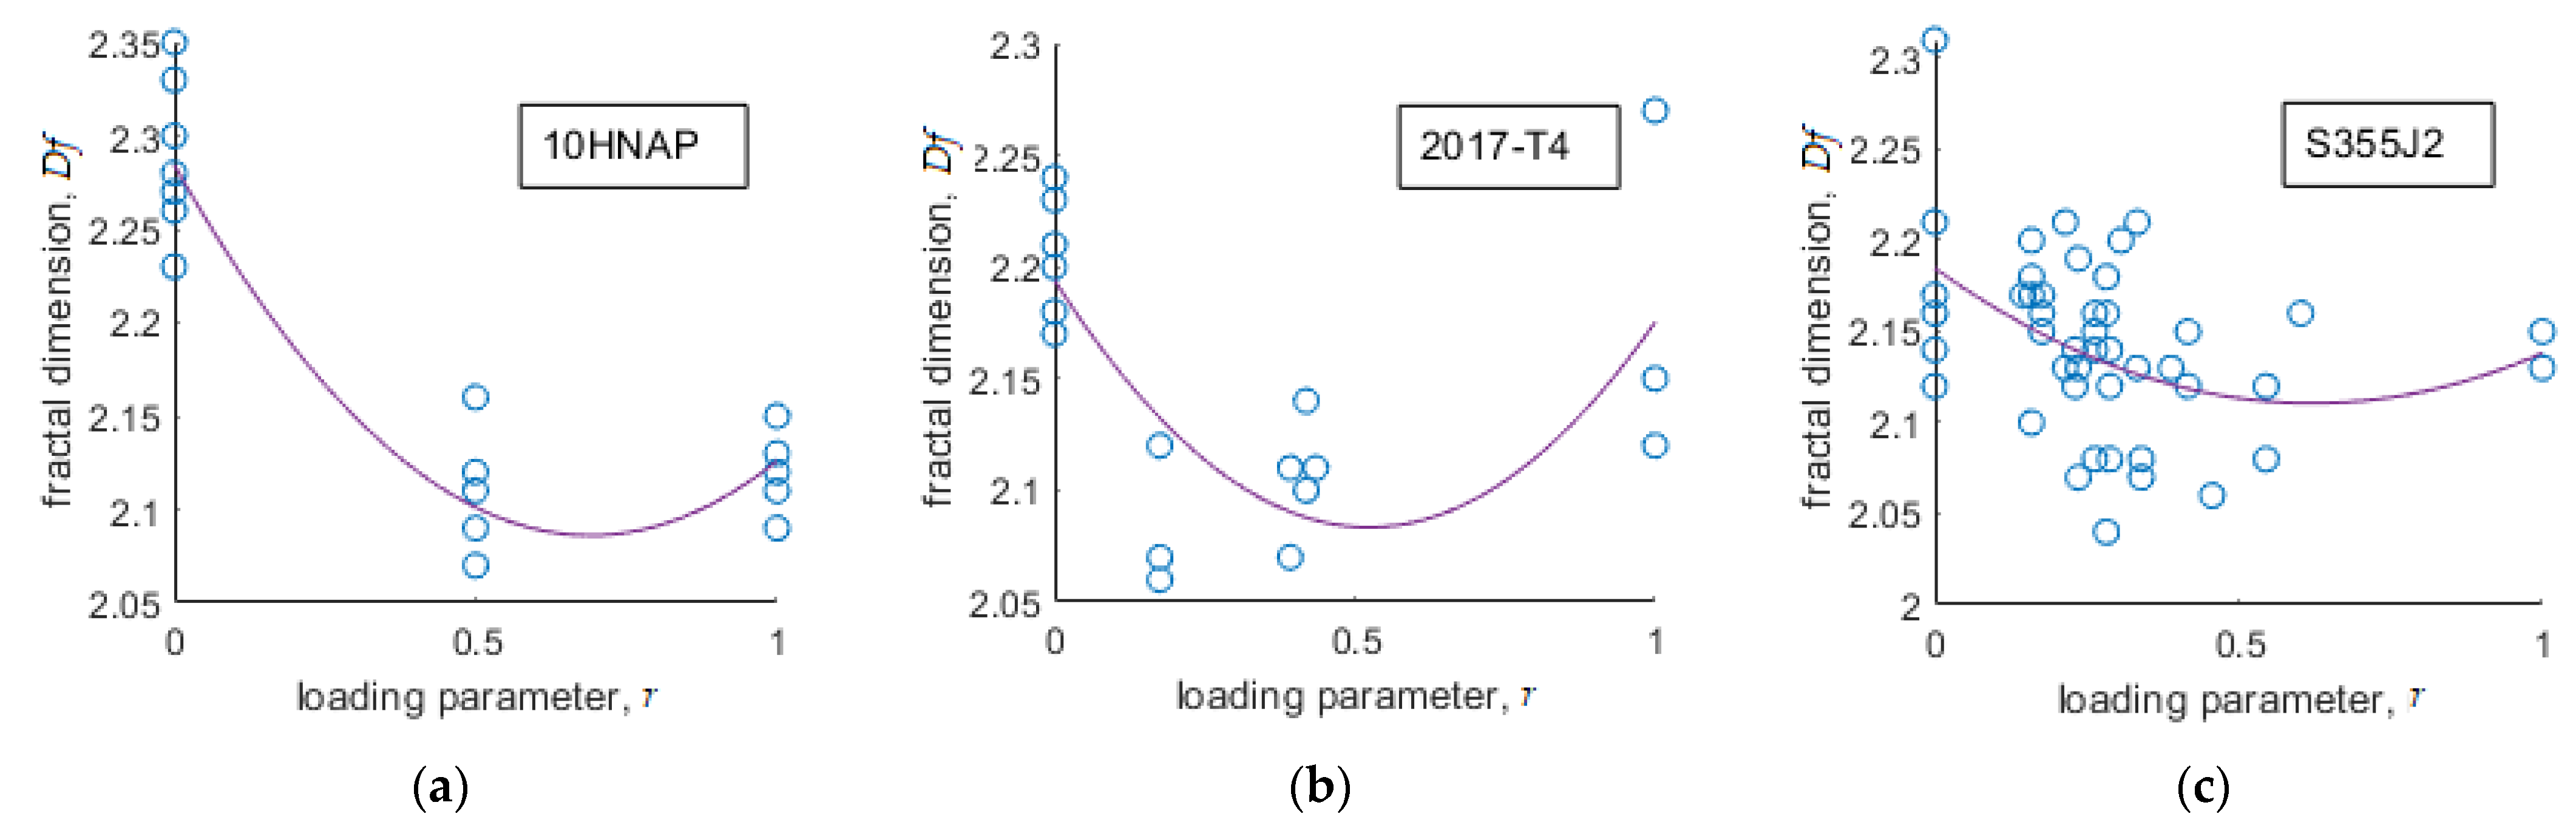
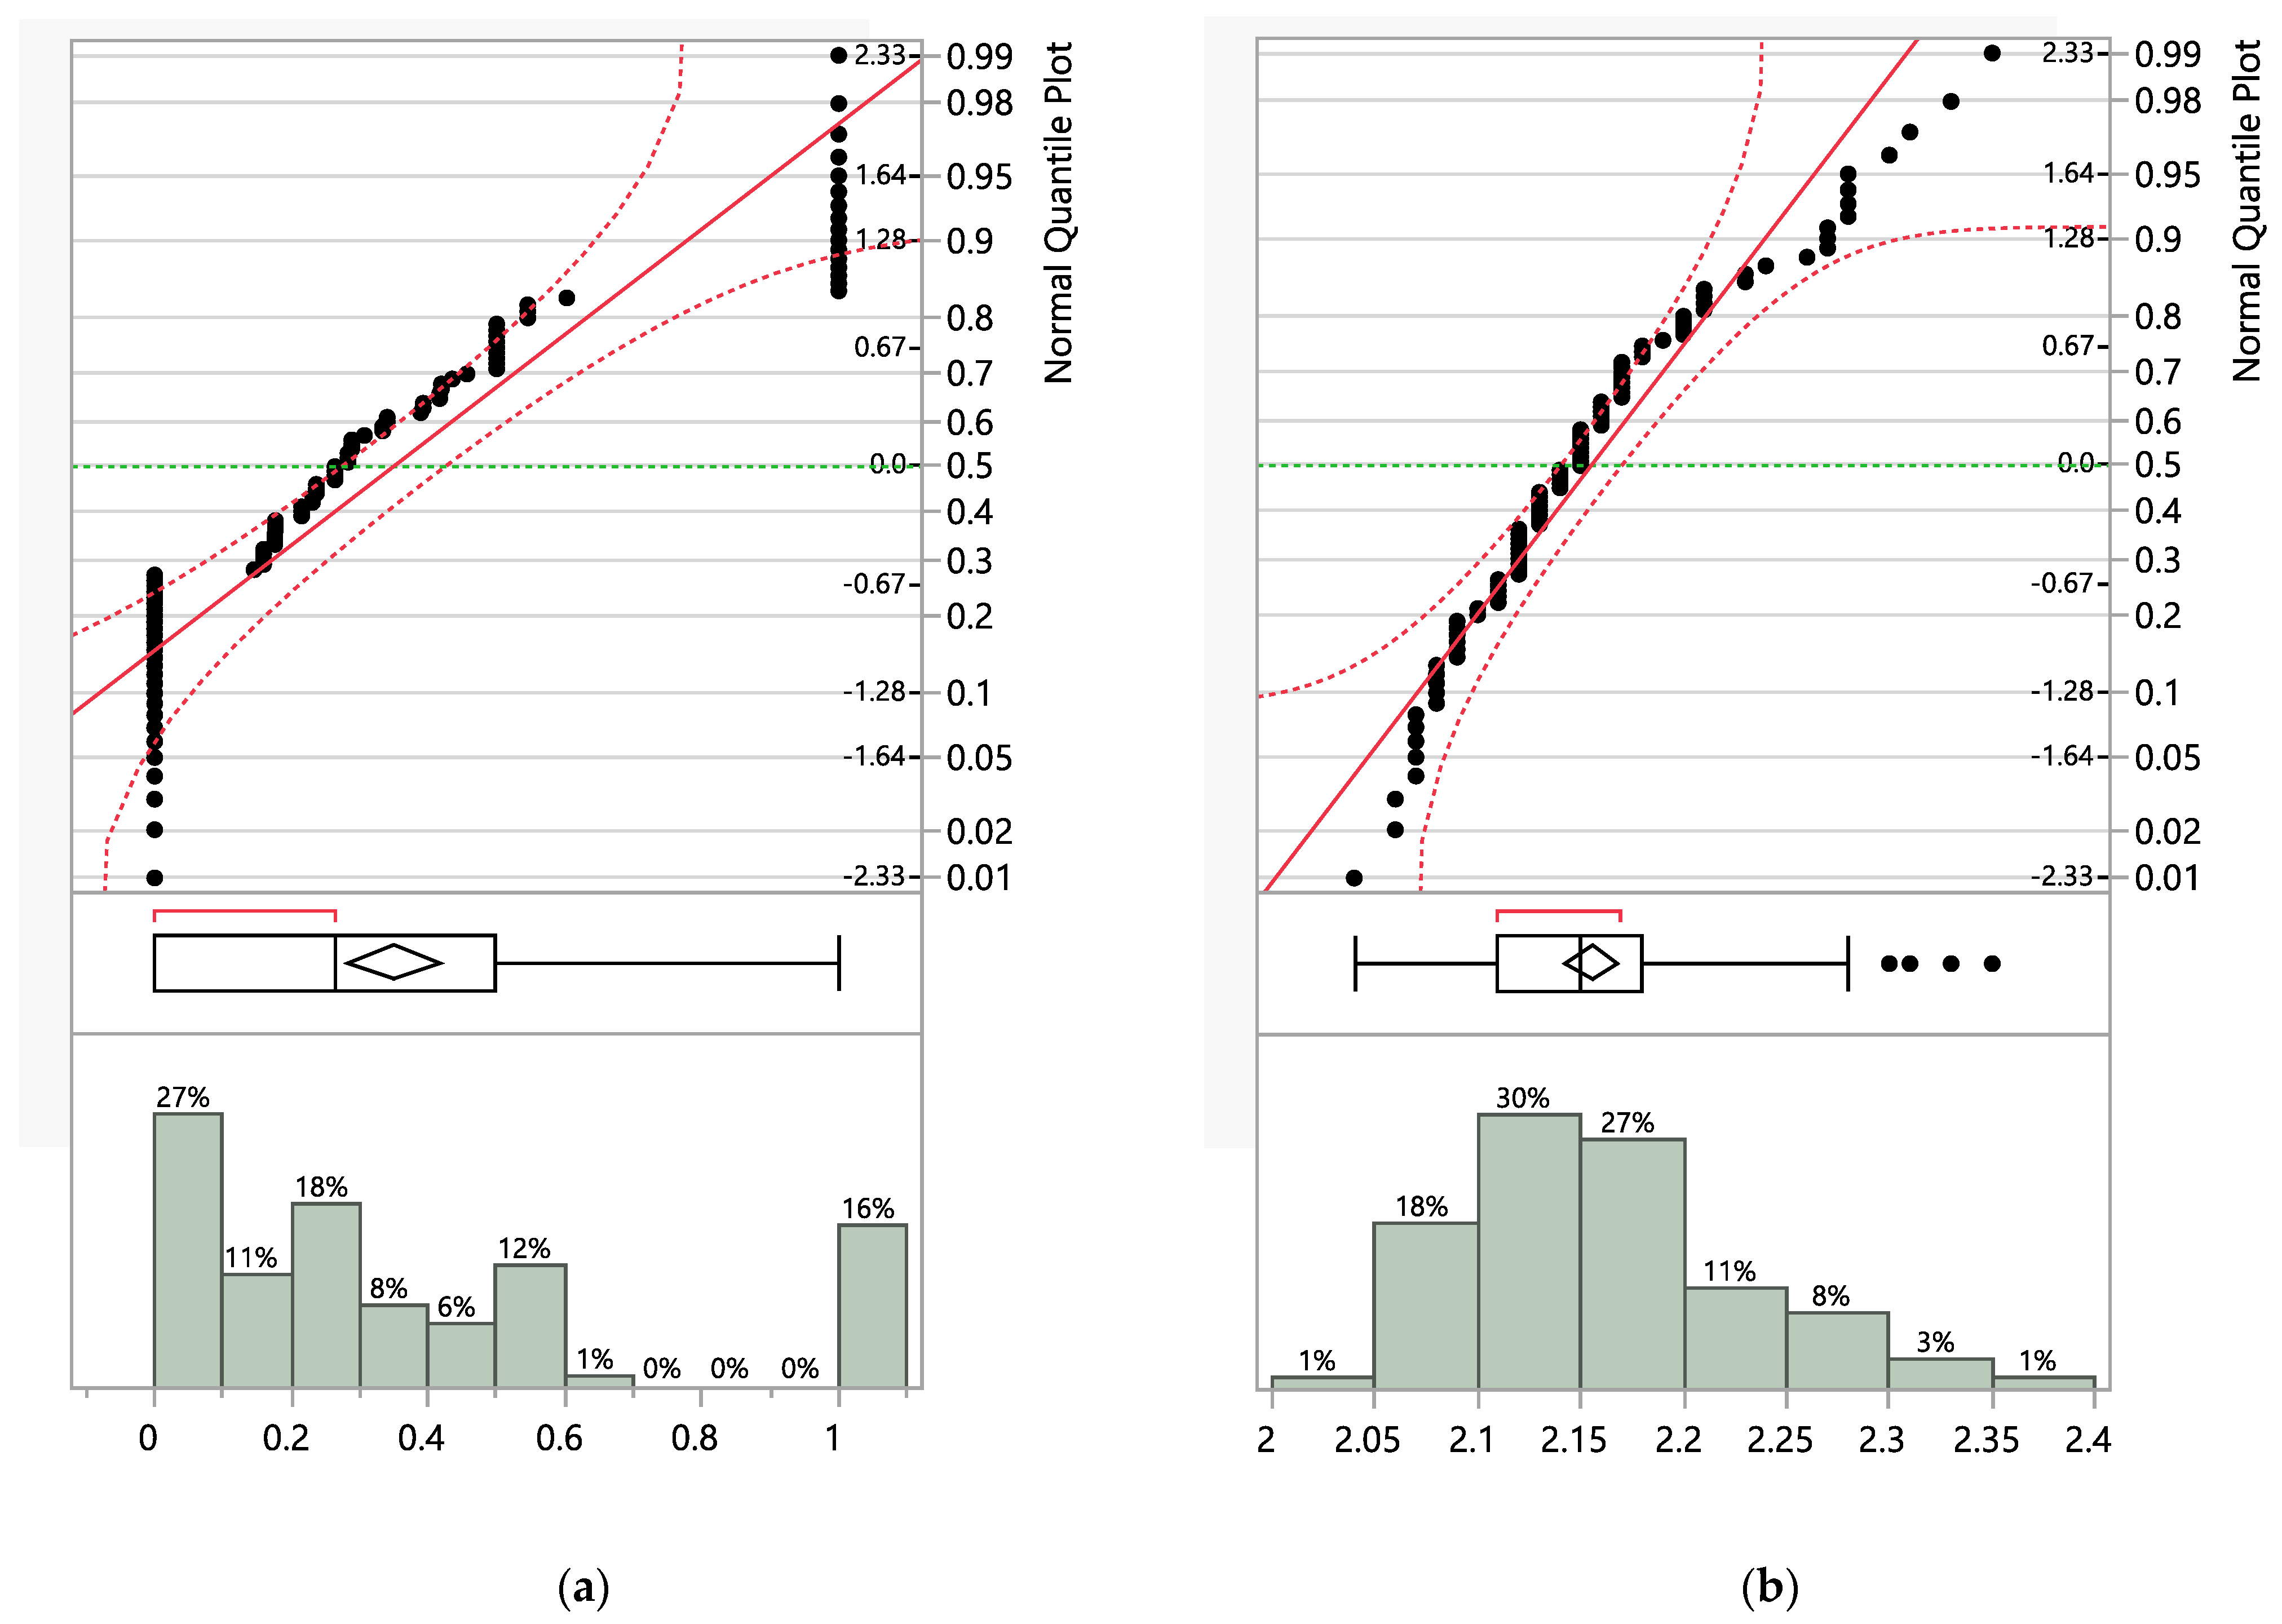
3.3. Statistical Dependencies of Fractal Dimensions
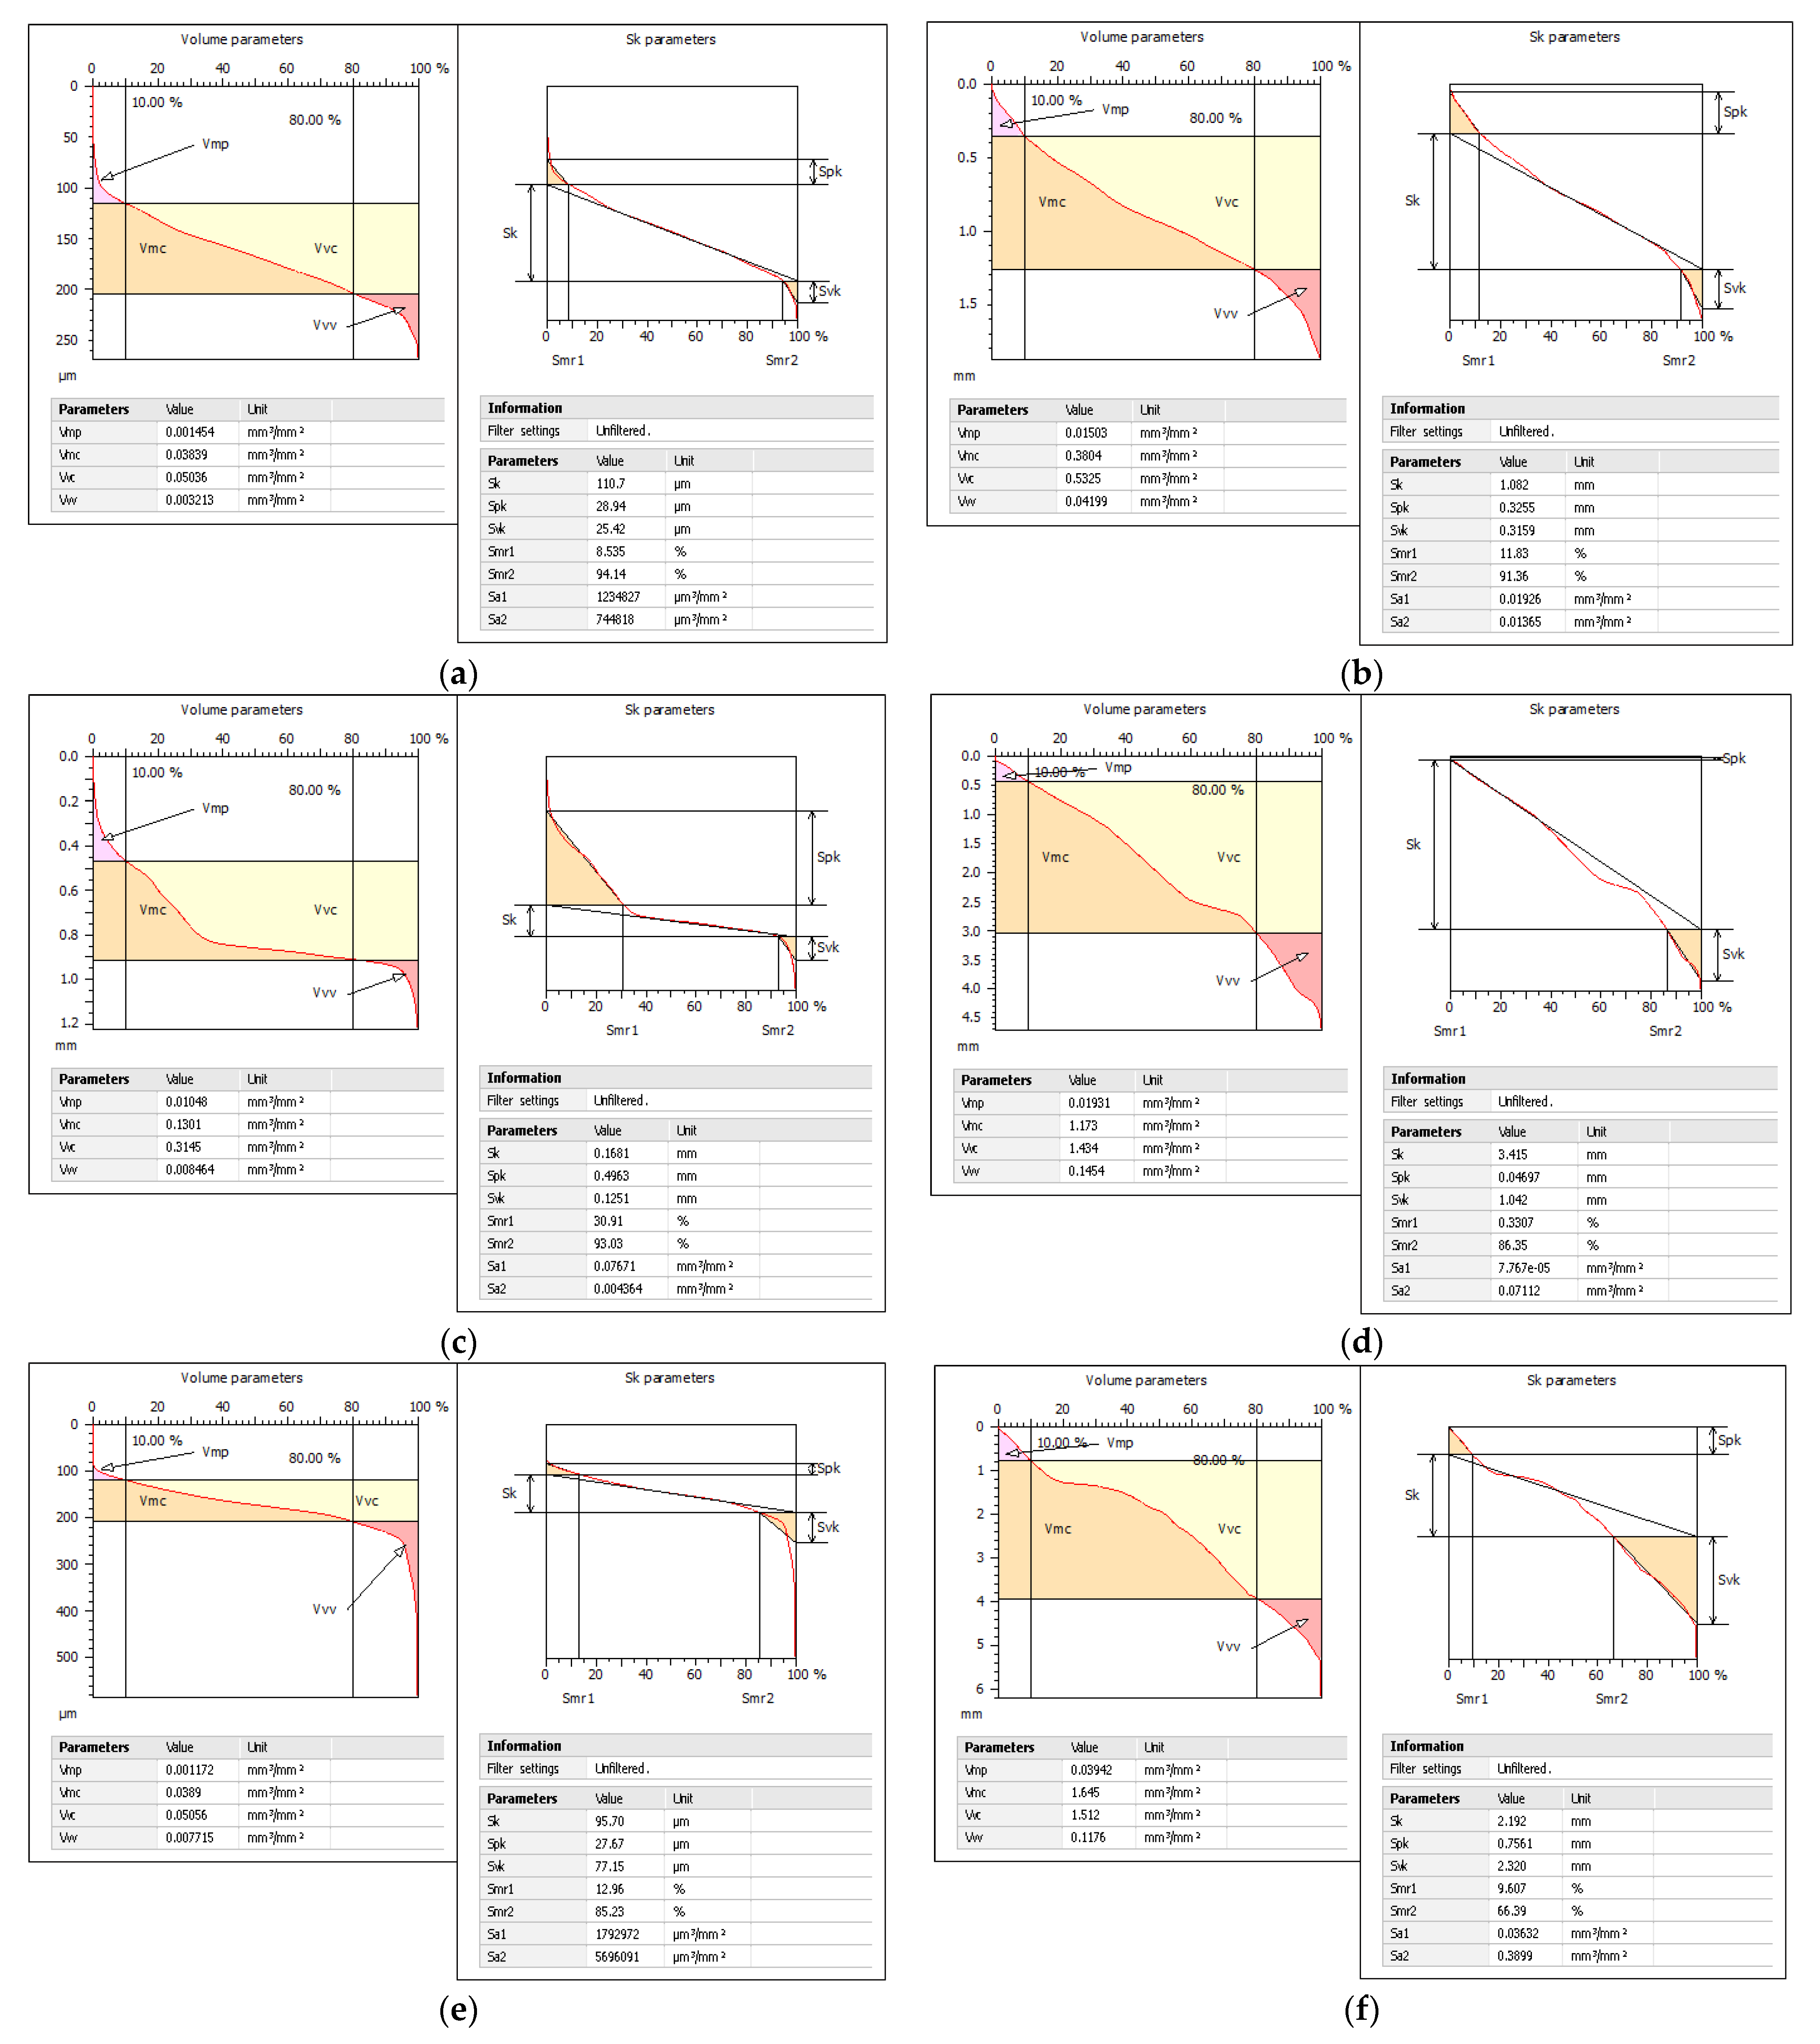
3.4. Fracture Surface Parameters for Extremal Fractal Dimensions Cases
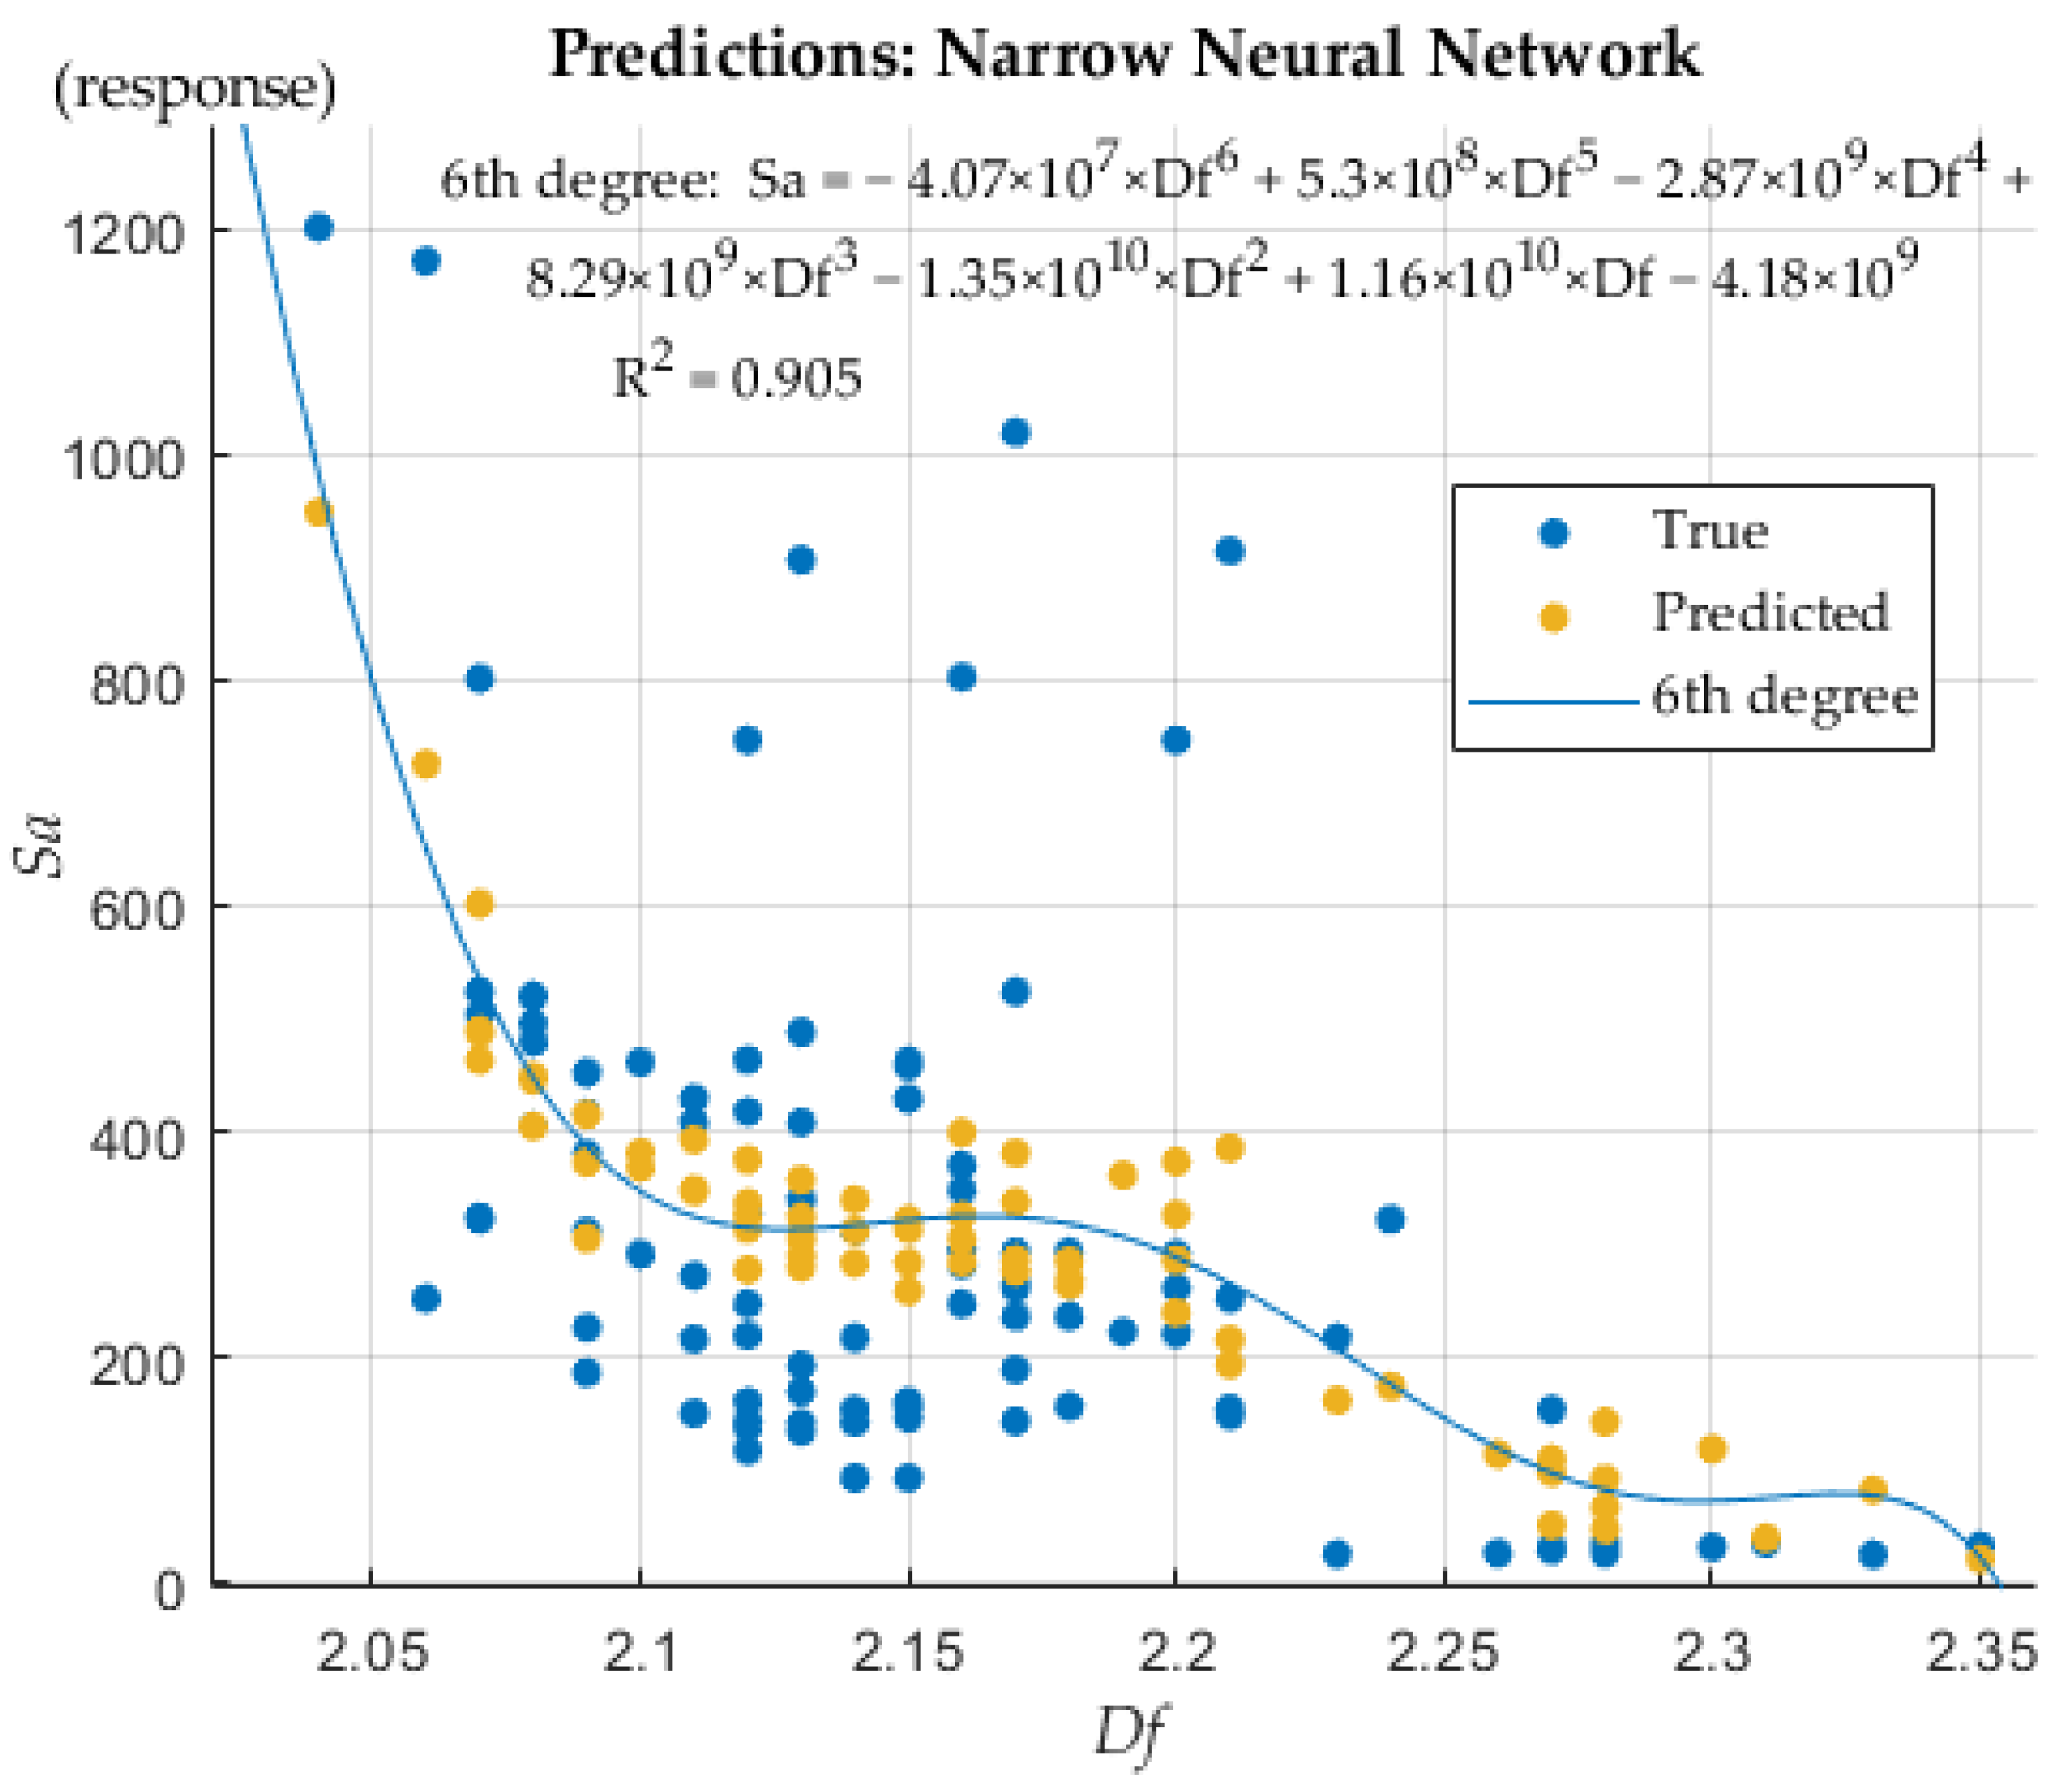
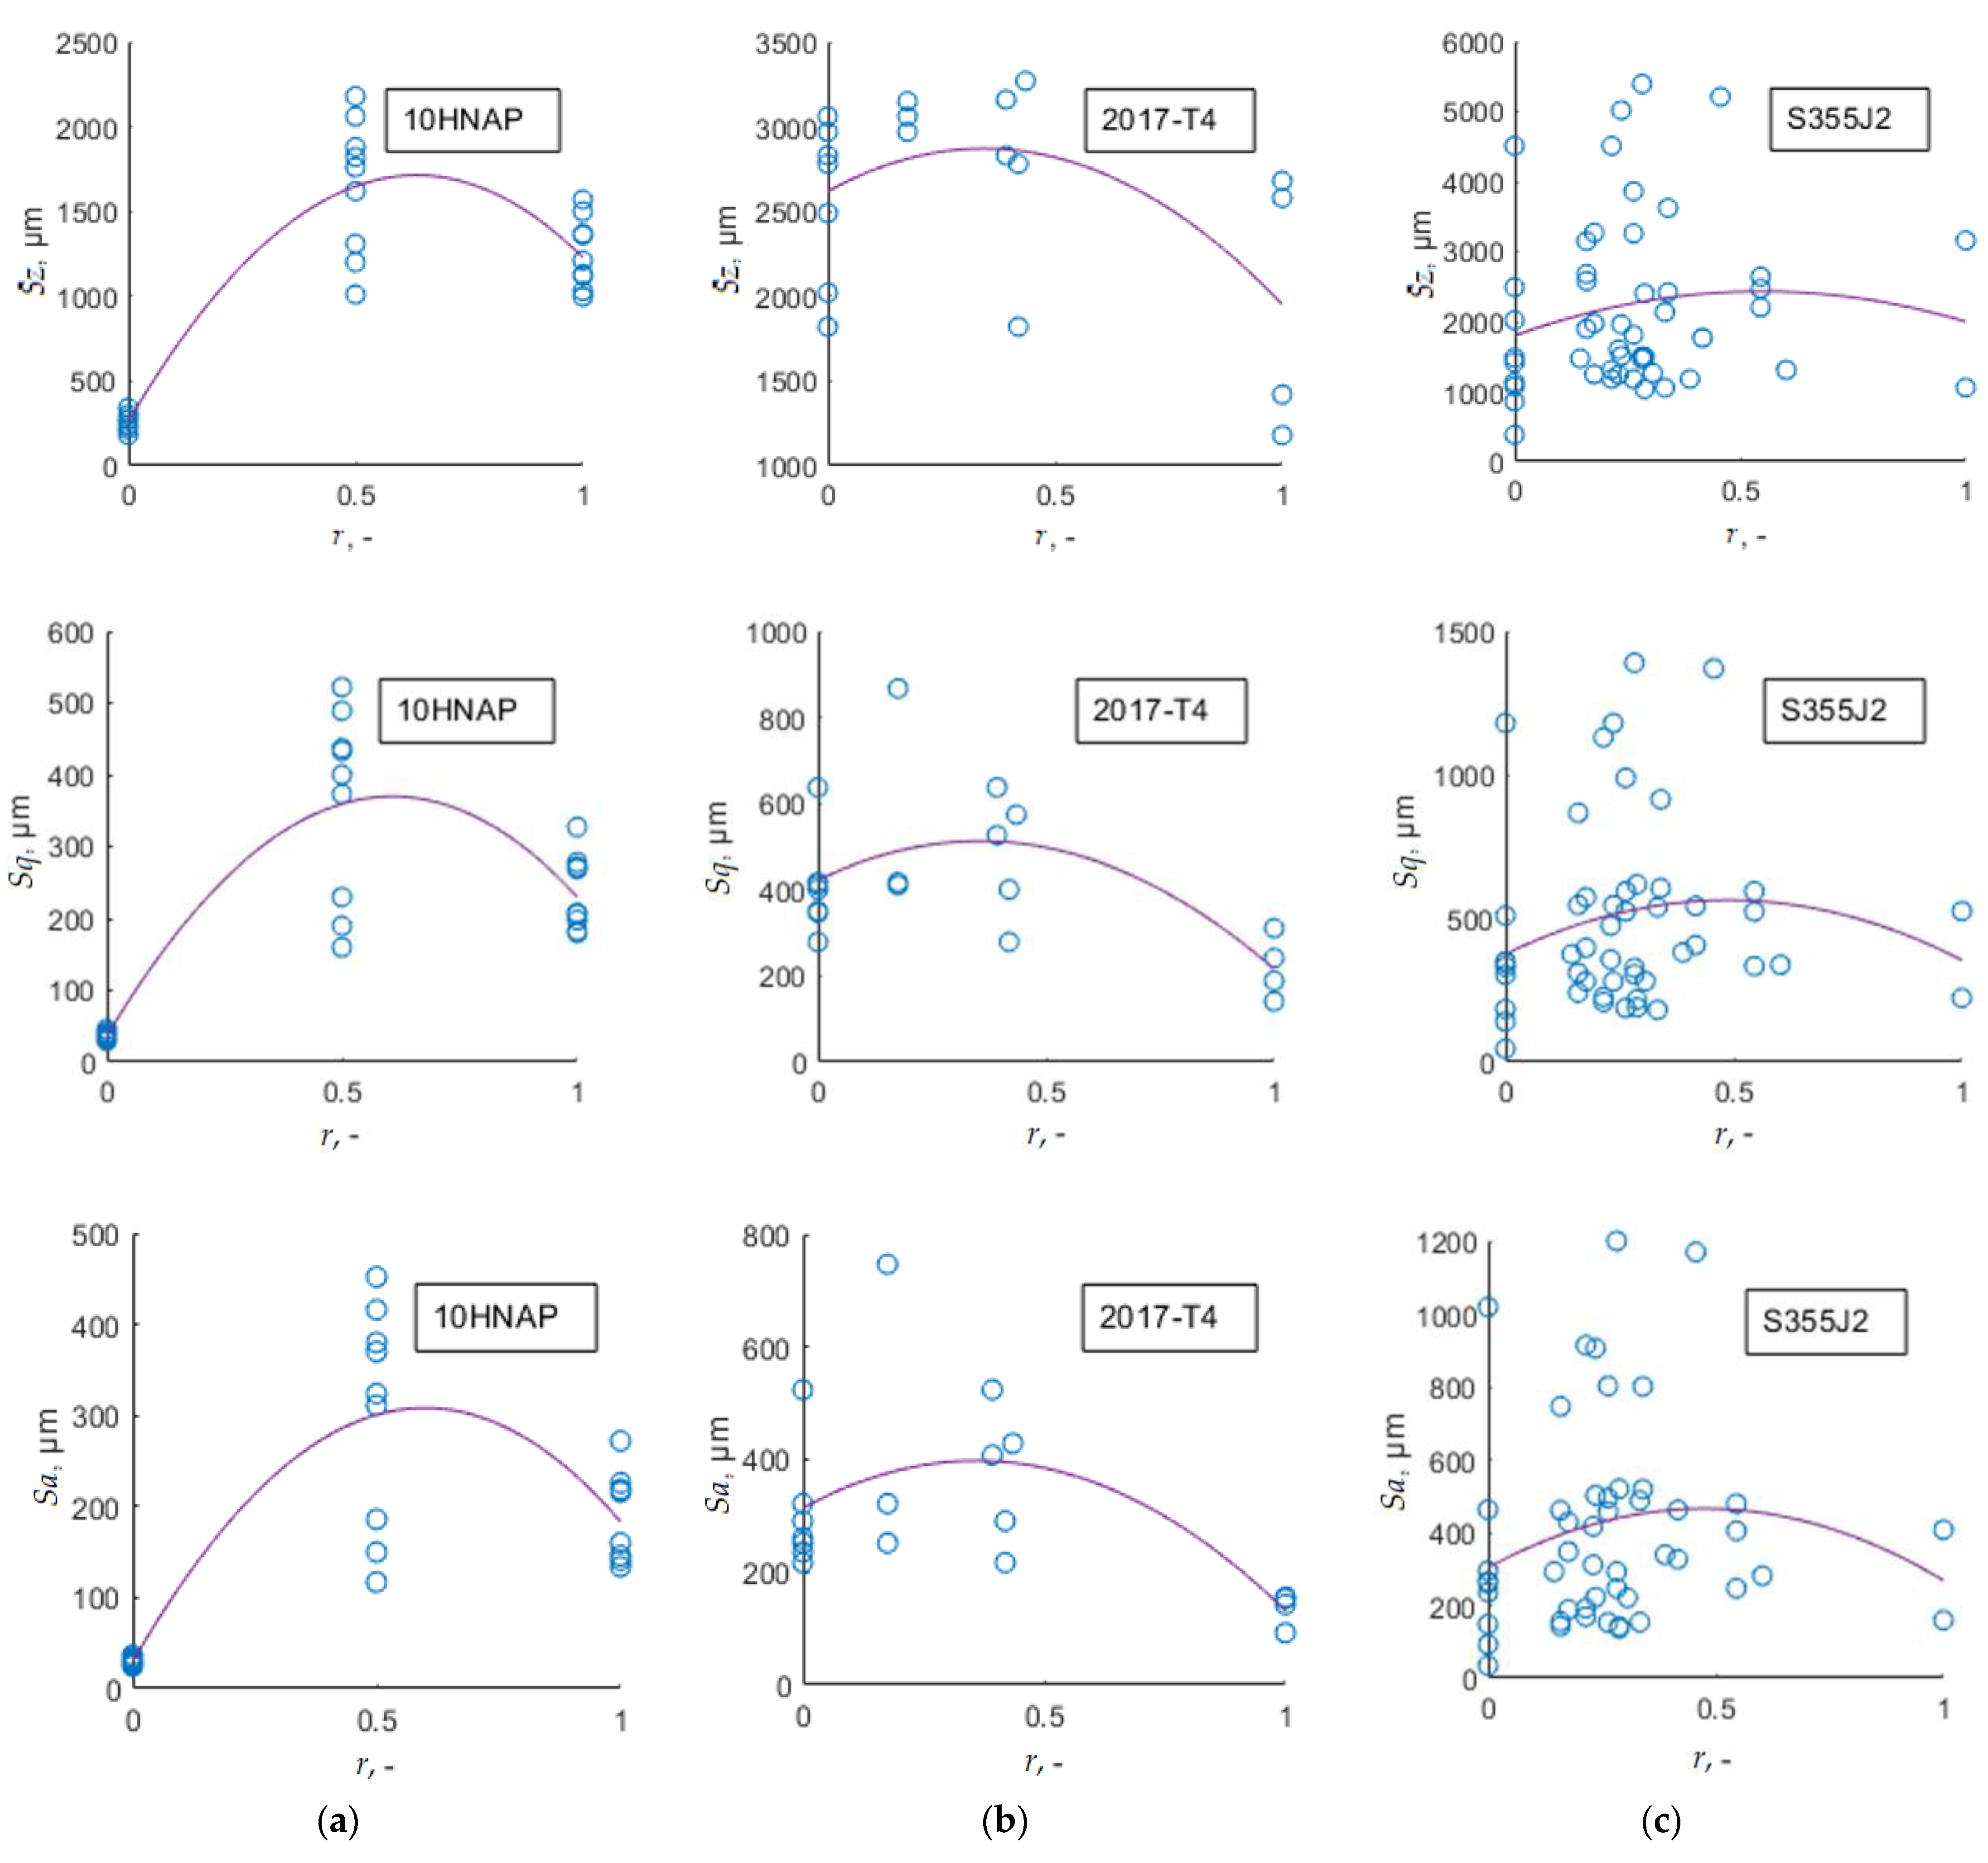
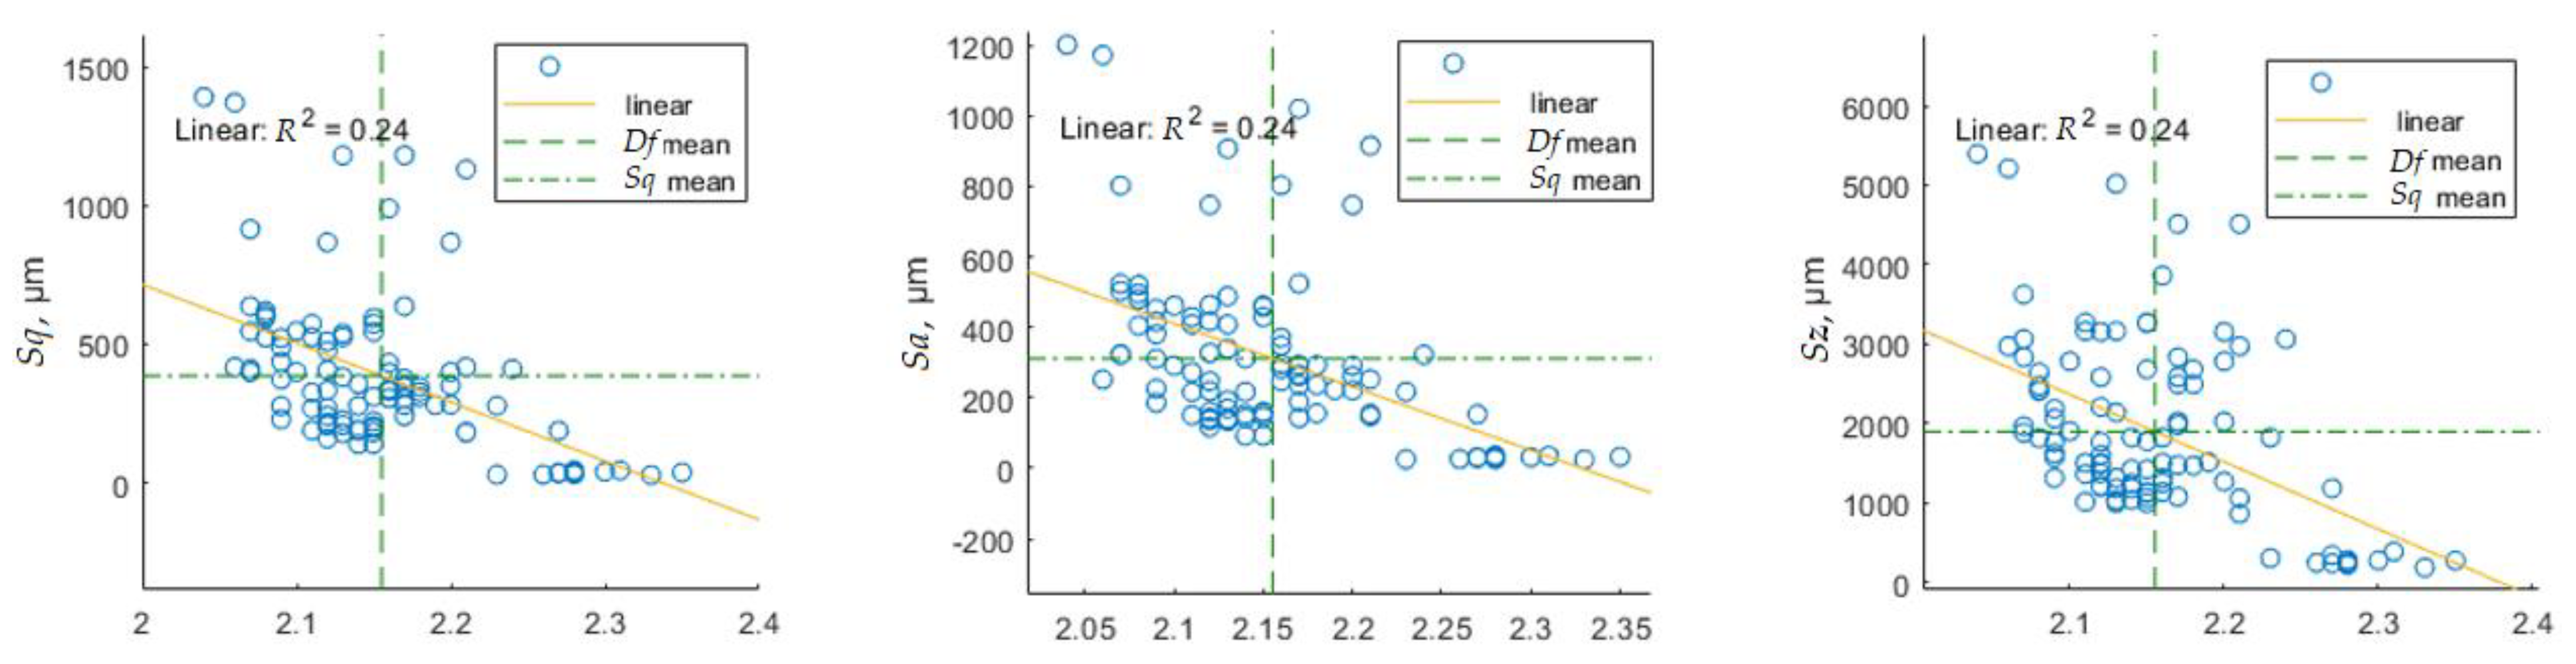
3.5. Relationship between Df and Areal Surface Parameters
3.6. Material and Loading Model Based on Fracture Surface Topography
4. Conclusions
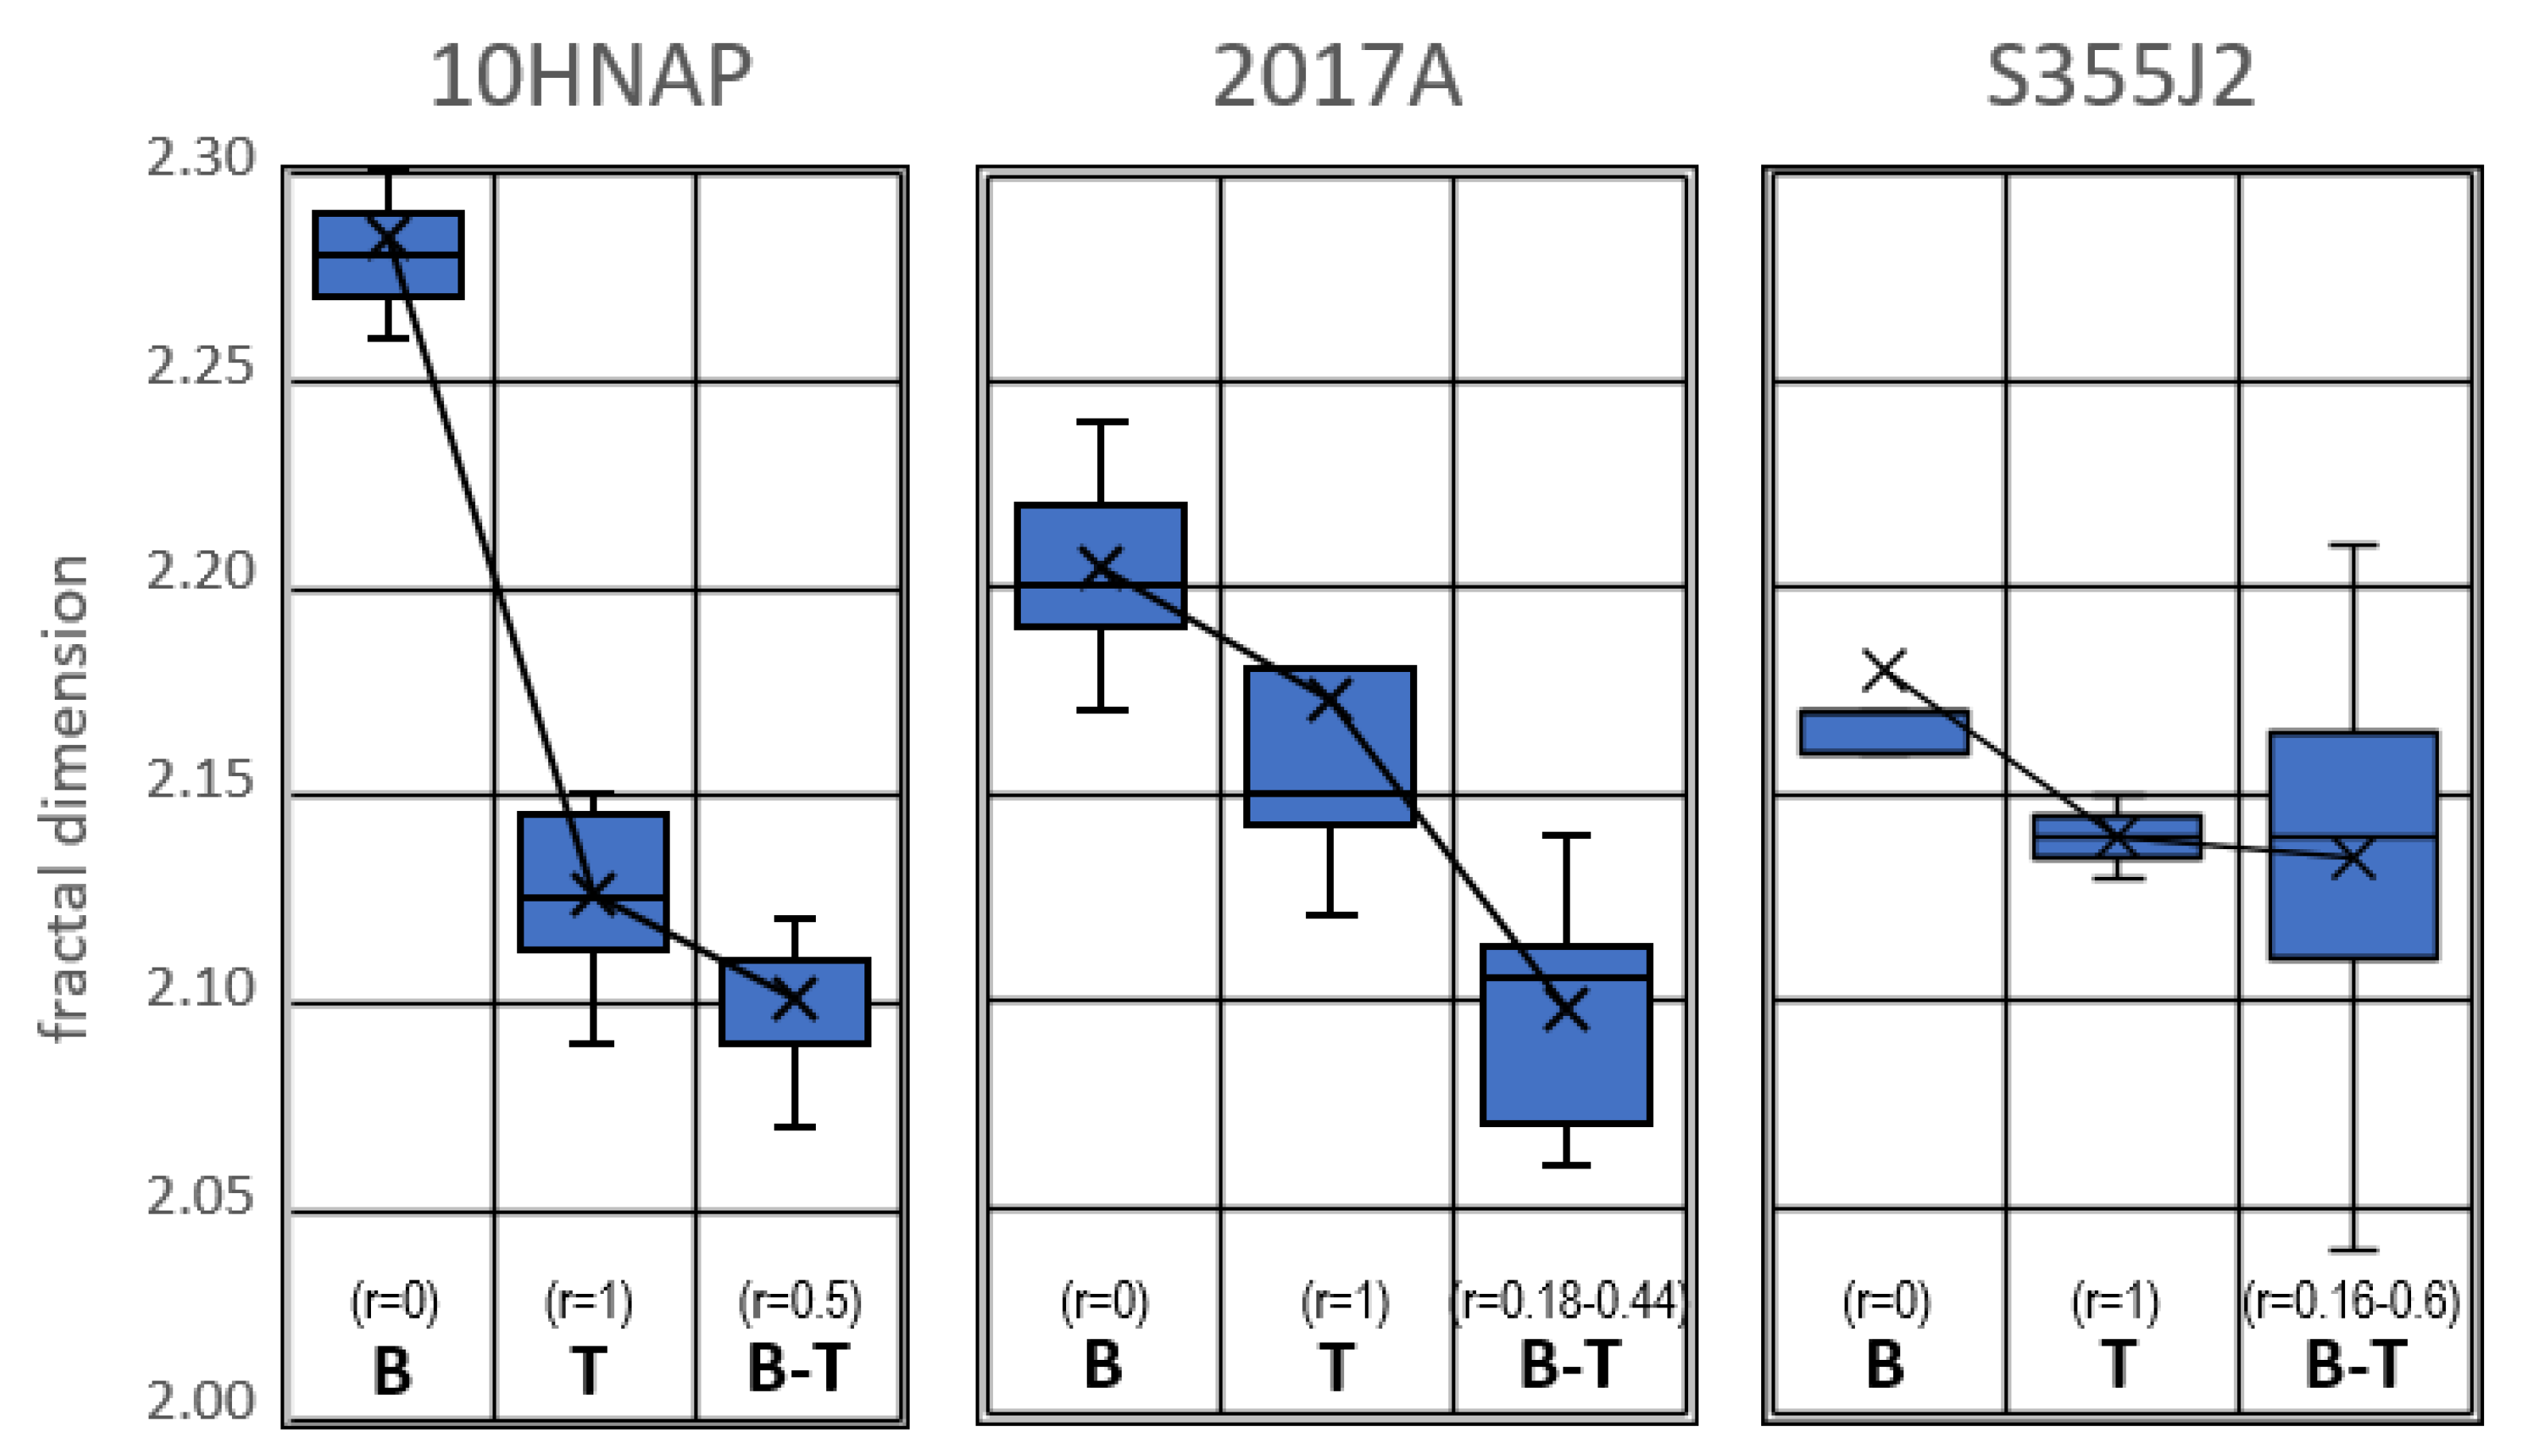
- For all investigated specimens, the largest values of Df are for bending, slightly lower for torsion, and the smallest for combined loads;
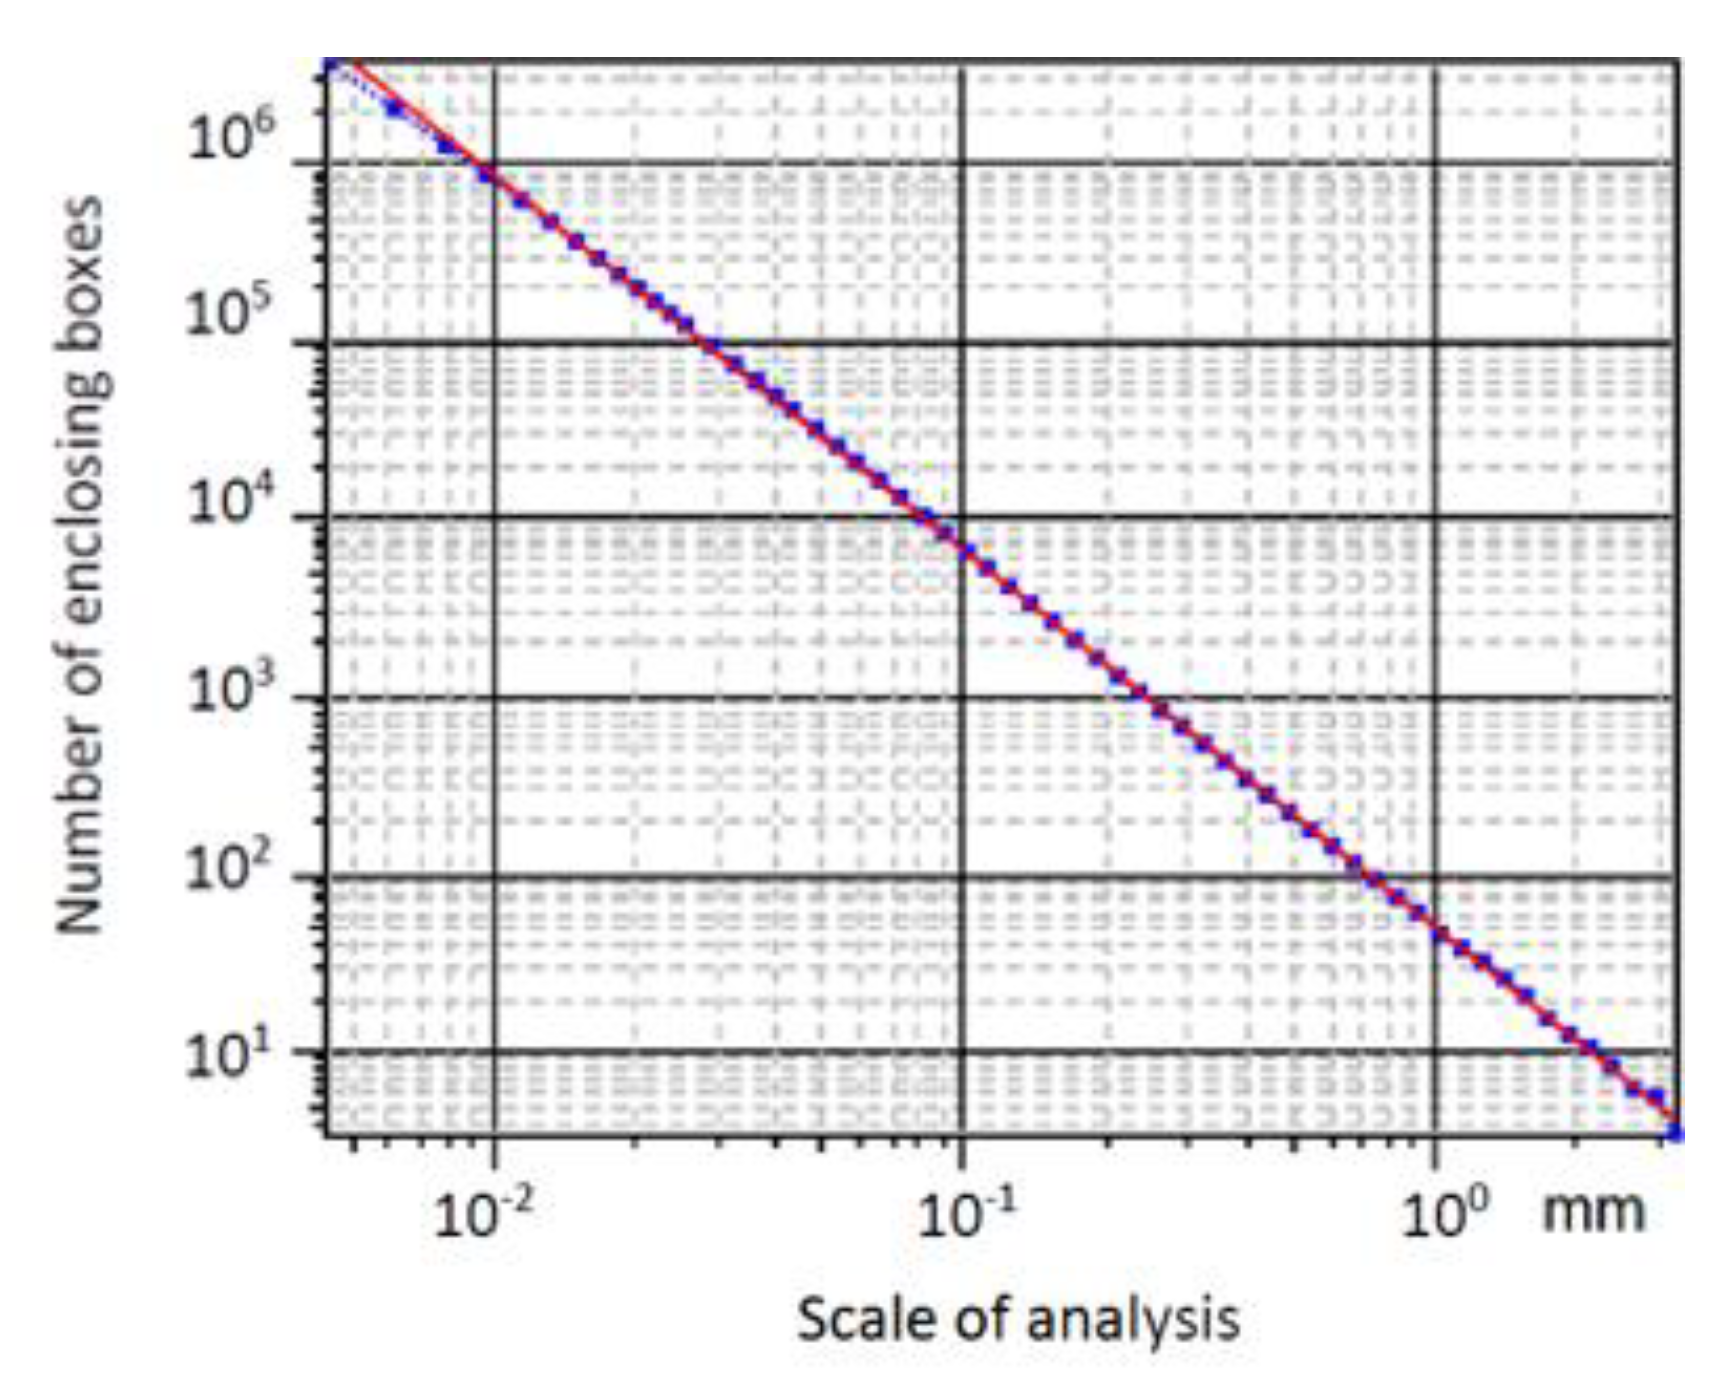
- The size distribution of peaks and valleys is well described by the fractal theory;
- The highest sensitivity of the Df parameter occurs for pure bending in ring-notched specimens;
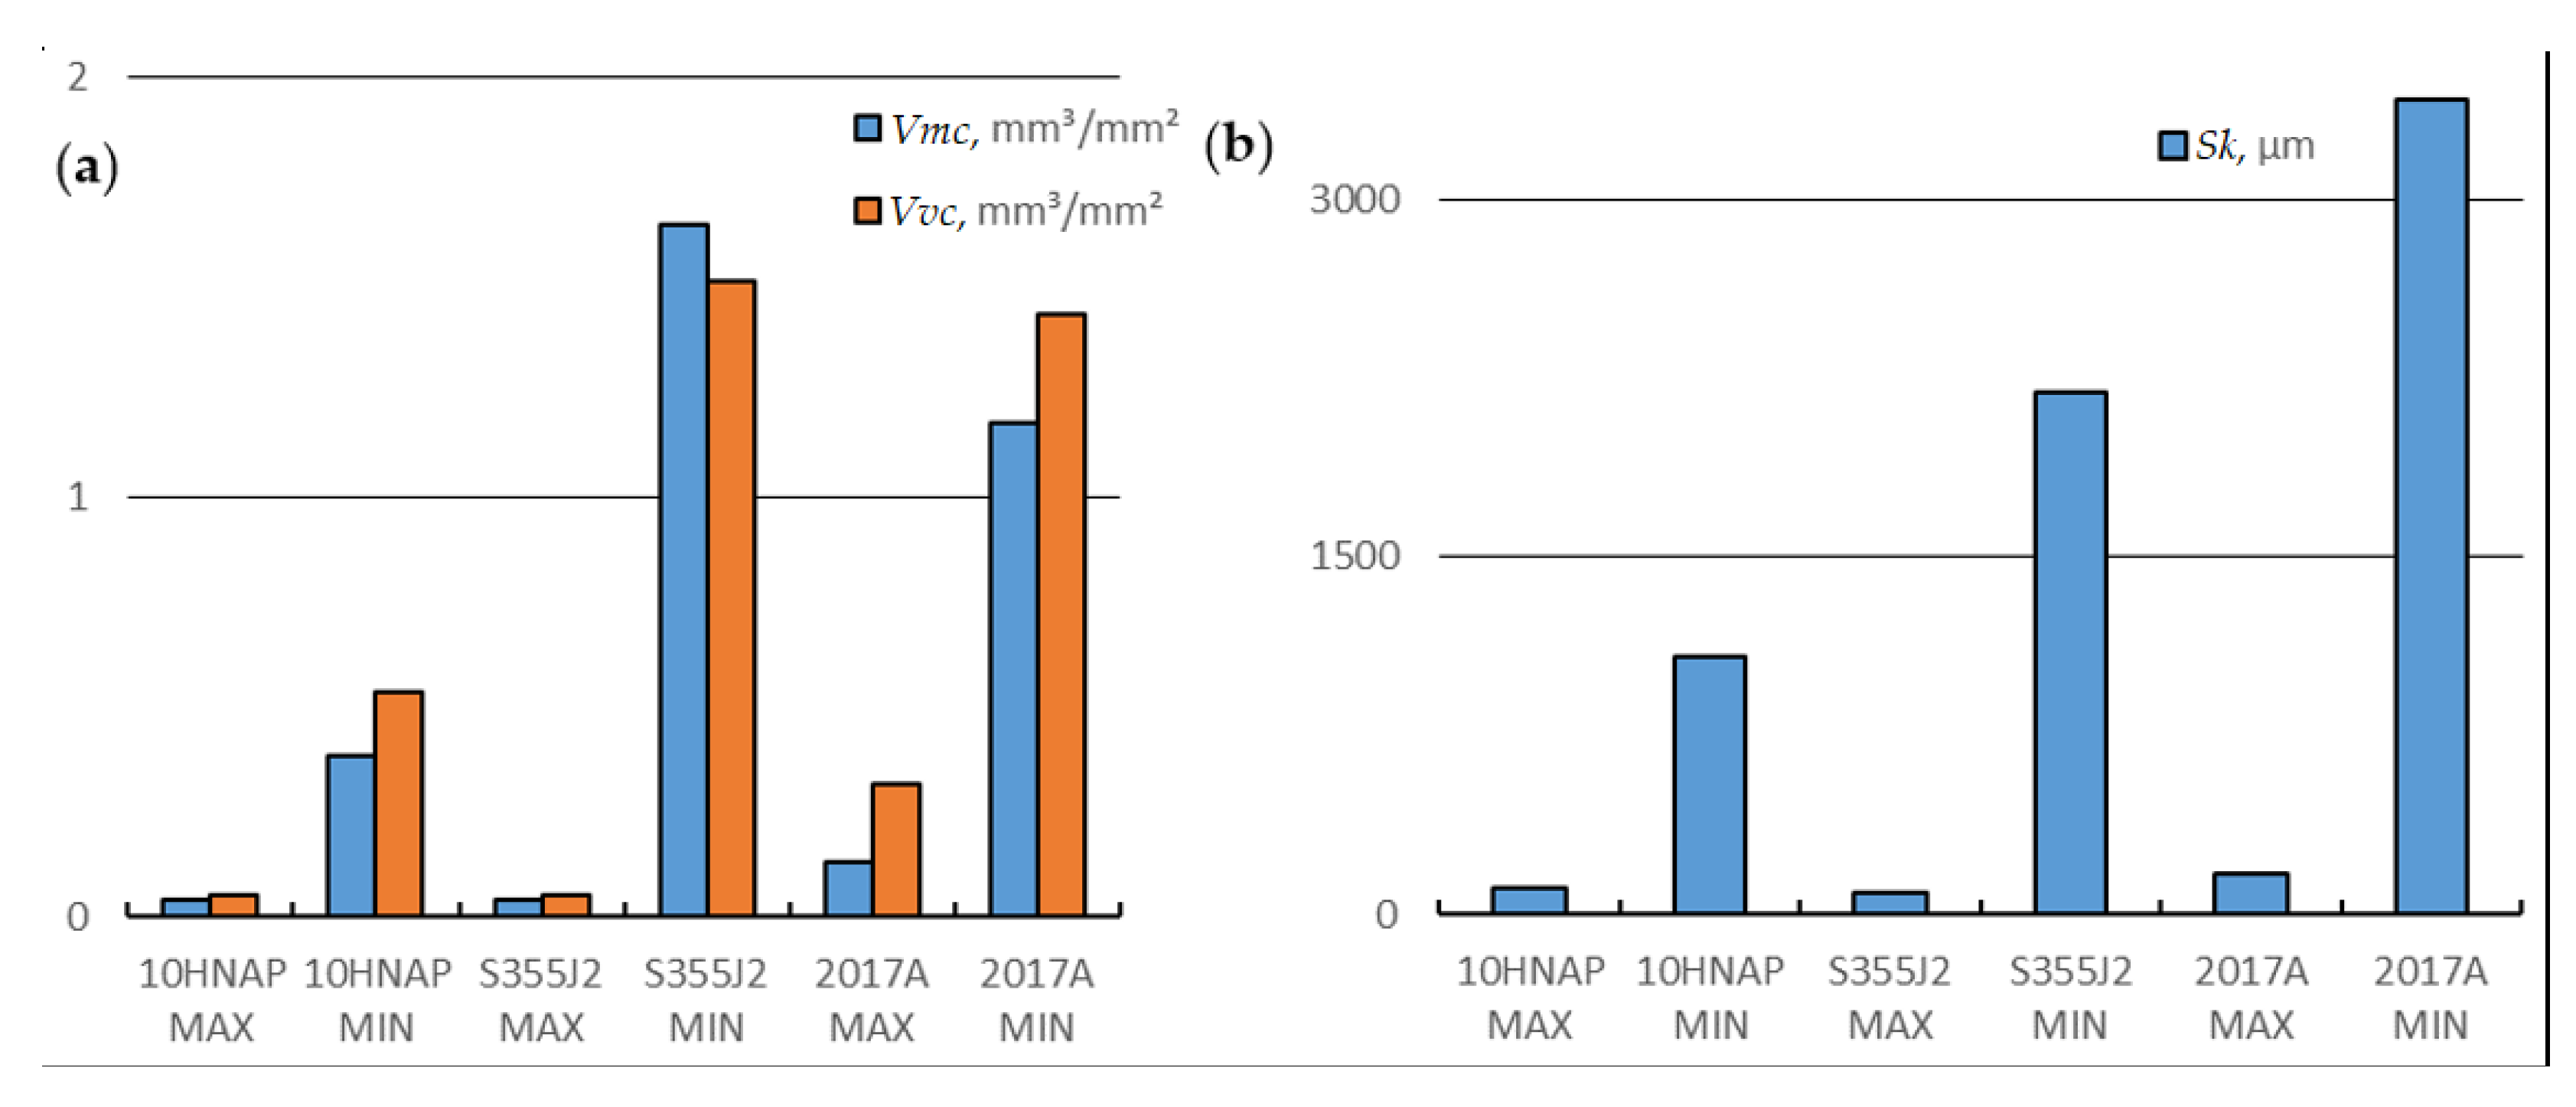
- Surface topography parameter values such as areal parameters Sx, volume parameters Vx and core height parameter Sk are significantly inversely related to the fractal dimension Df;
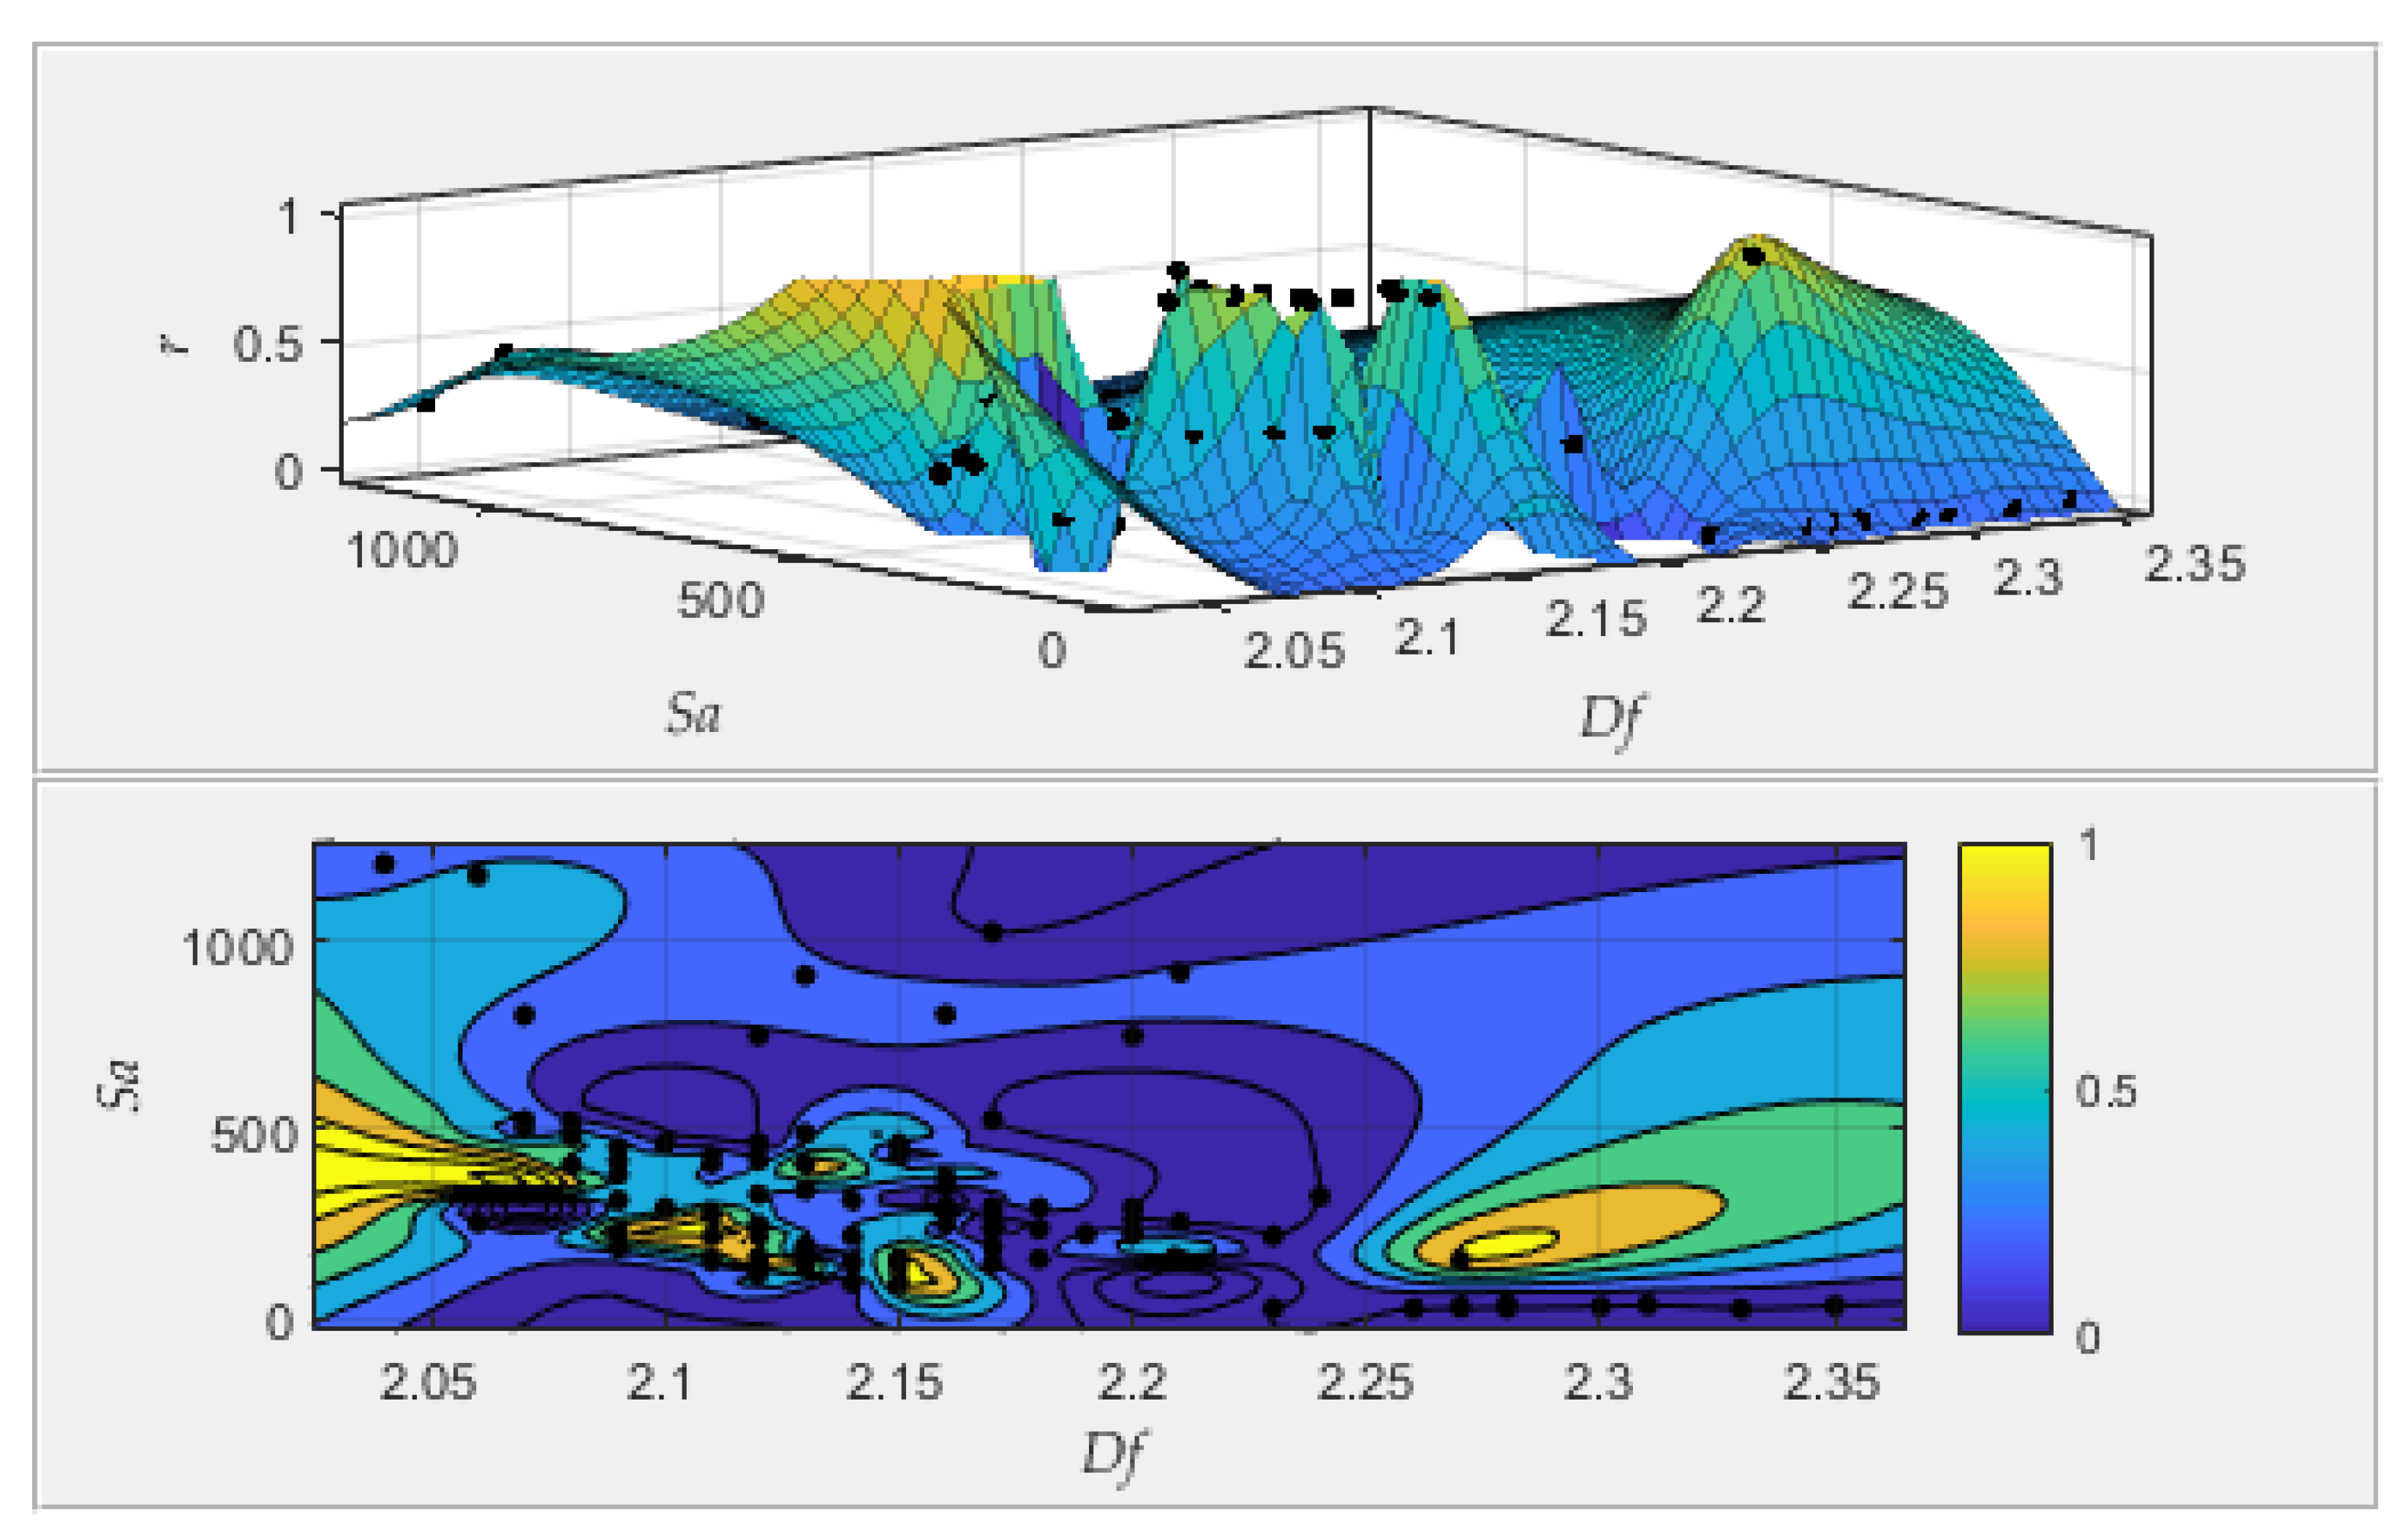
- Using Narrow Neural Network, it has been found a 6th degree type model, with the best fit arithmetical mean height Sa to fractal dimension Df, with a coefficient of determination R2 equal to 0.905;
- The obtained results show that the fracture surface topography is a function of the loading condition, which affects the fracture mechanisms;
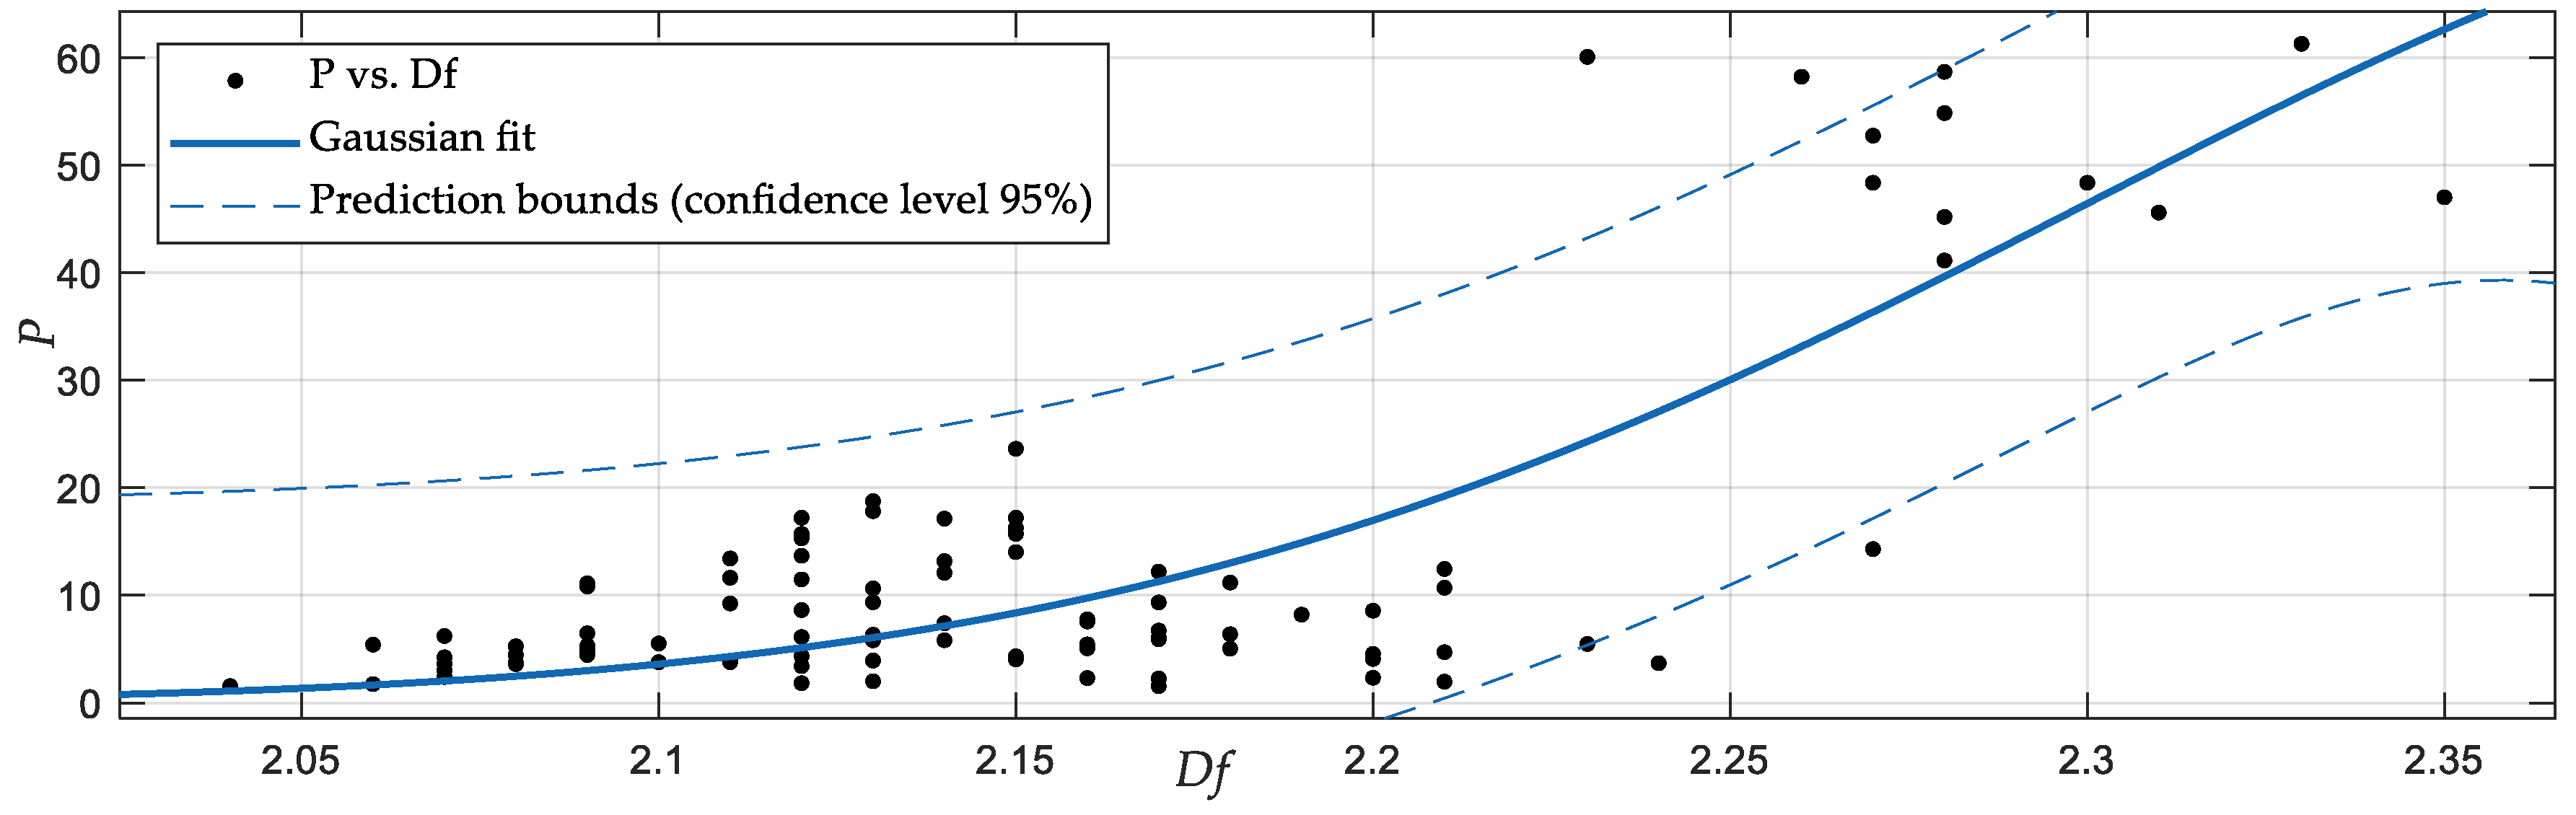
- Material and loading parameter P shows a rather good fit to fractal dimension Df, with R2 = 0.637, but different loading methods and materials still cause some discrepancies;
- The fractal dimension analysis of the total area method can be extended to other materials under bending-torsion fatigue;
- The presented results indicate that using only fractal dimension Df in a function of r is an inaccurate approach to clearly analyse the conditions under which the specimen was damaged. It should be mentioned that, apart from the r parameter other factors have an important impact on the fatigue crack mechanisms. However, the fracture surface morphology recaptures important stages of the fatigue crack process. Fractal dimension, in connection with other ratios of fractography, can be an effective tool for comprehensive failure analysis;
- The proposed method can be applied to the prediction of fracture behaviour and the cracking process in cases dependent on the loading conditions and features of the material.
Funding
Data Availability Statement
Acknowledgments
Conflicts of Interest
Nomenclature
| Df | - | fractal dimension |
| E | GPa | Young’s modulus |
| P | 1/mm | material and loading parameter |
| r | - | loading stress ratio |
| R | - | stress ratio |
| R2 | - | coefficient of determination |
| Sa | µm | arithmetical mean height |
| Sk | µm | core height |
| Smr1, Smr2 | % | areal material ratio |
| Sp | µm | maximum peak height |
| Spk | µm | reduced peak height |
| Sq | µm | root mean square height |
| Sv | µm | maximum pit height |
| Svk | µm | reduced dale height |
| Sz | µm | maximum height |
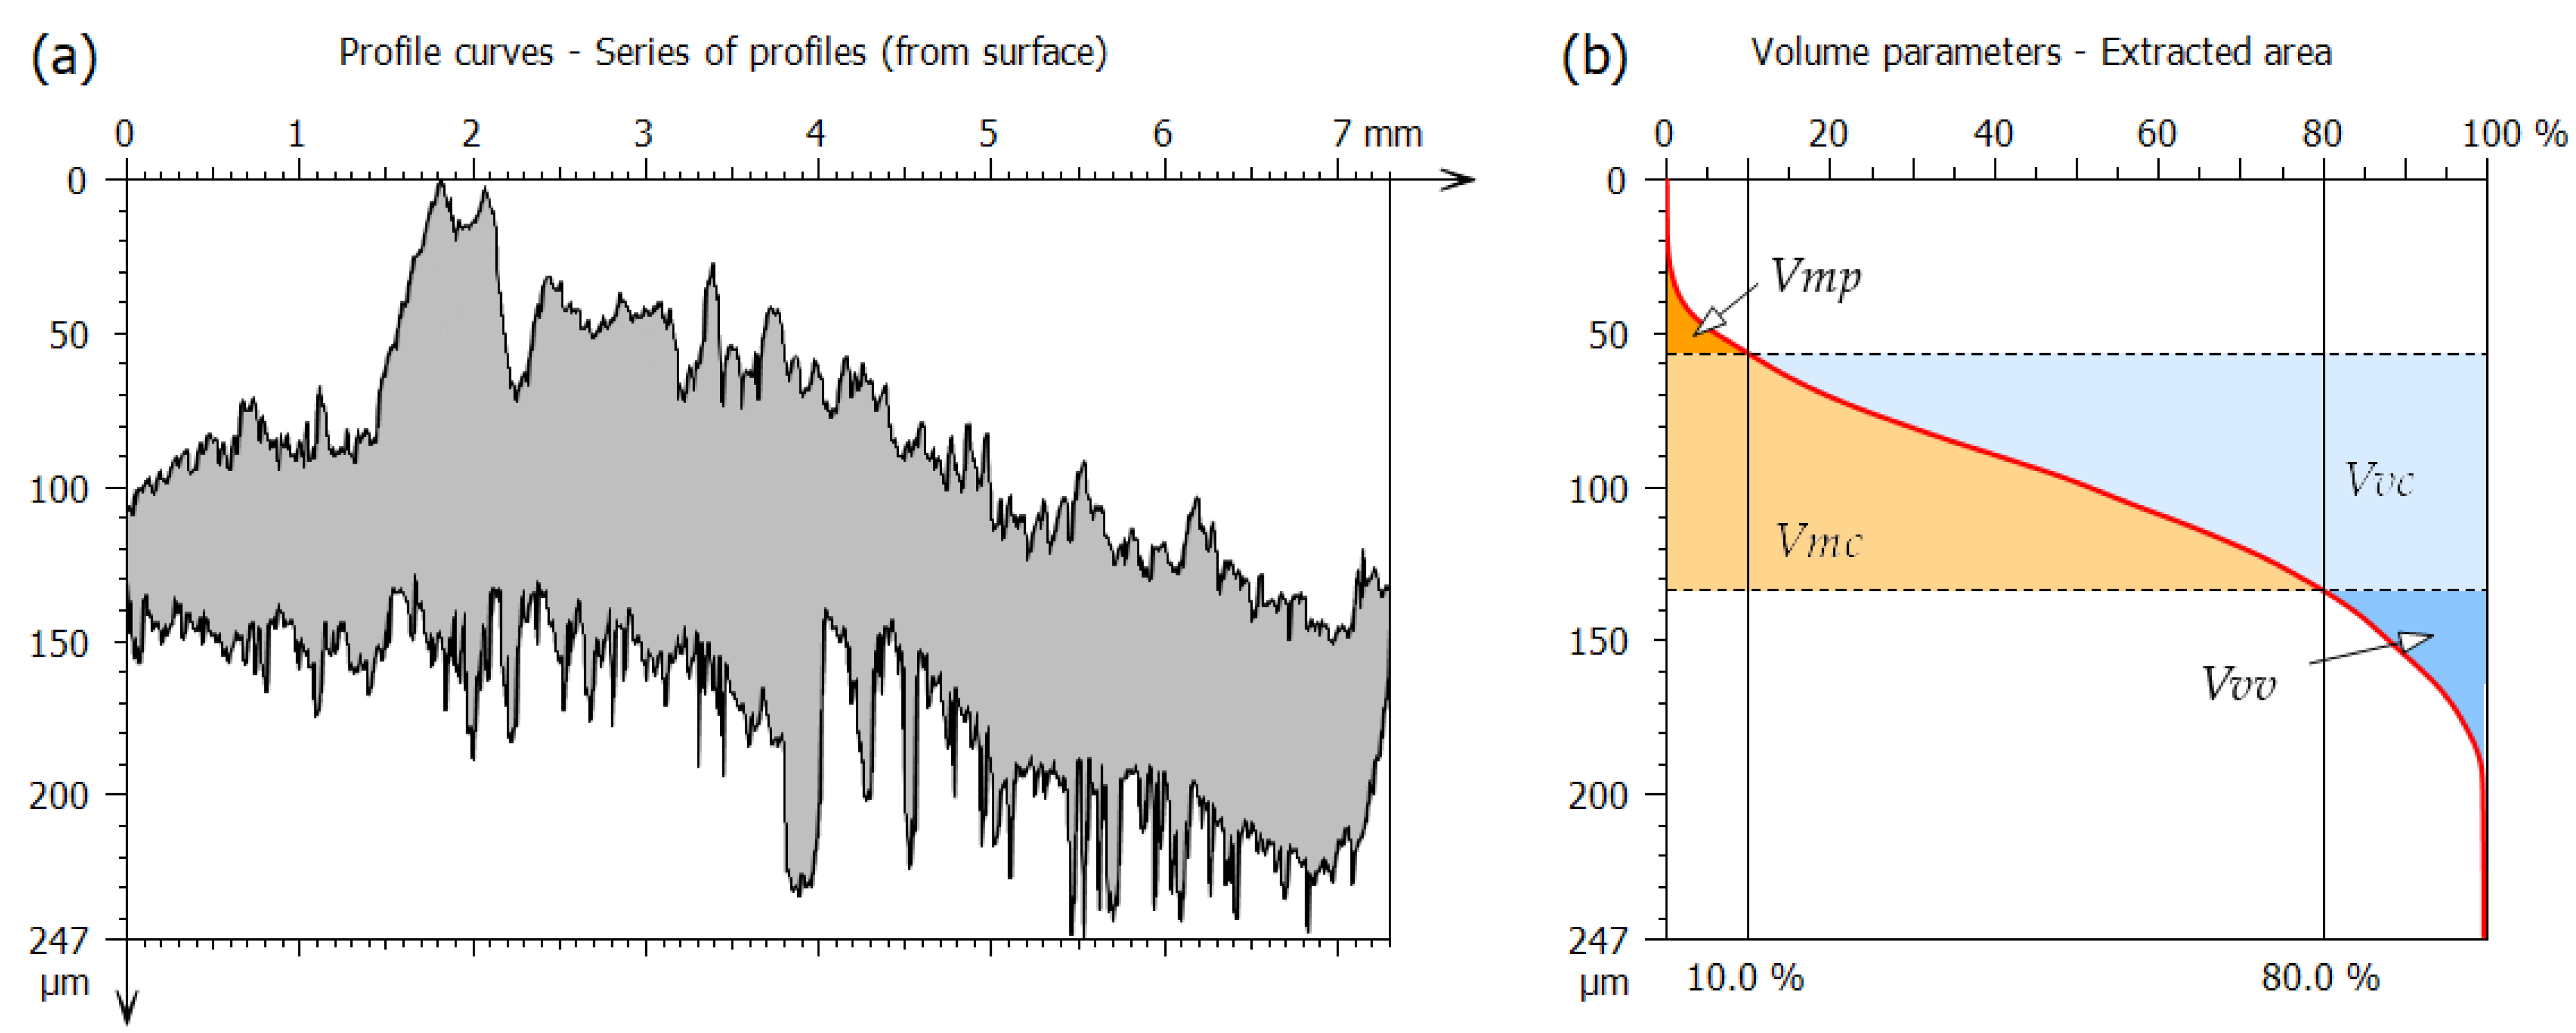
| Vmc | mm³/mm² | core material volume |
| Vmp | mm³/mm² | peak material volume |
| Vvc | mm³/mm² | core void volume |
| Vvv | mm³/mm² | pit void volume |
| σmax | MPa | maximum normal stress |
| σy | MPa | Yield stress |
| τmax | MPa | maximum shear stress |
| MSE | - | Mean Squared Error; is the square of the RMSE |
| MAE | - | Mean Absolute Error; is always positive and similar to the RMSE, but less sensitive to outliers |
| PCA | - | Principal Component Analysis |
| RMSE | - | Root Mean Square Error; is always positive and its units match the units of response |
Appendix A

| 10HNAP Steel | 2017-T4 Aluminium Alloy | S355J2 Steel | ||||||||||||
|---|---|---|---|---|---|---|---|---|---|---|---|---|---|---|
| Df | Sq | Sz | Sa | r | Df | Sq | Sz | Sa | r | Df | Sq | Sz | Sa | r |
| 2.28 | 34 | 216 | 28 | 0.00 | 2.18 | 347 | 2490 | 236 | 0.00 | 2.16 | 332 | 1133 | 295 | 0.00 |
| 2.27 | 35 | 236 | 29 | 0.00 | 2.20 | 351 | 2020 | 261 | 0.00 | 2.21 | 185 | 859 | 148 | 0.00 |
| 2.23 | 31 | 301 | 25 | 0.00 | 2.23 | 279 | 1820 | 217 | 0.00 | 2.31 | 46 | 383 | 35 | 0.00 |
| 2.27 | 39 | 341 | 31 | 0.00 | 2.21 | 418 | 2970 | 252 | 0.00 | 2.17 | 305 | 1073 | 266 | 0.00 |
| 2.28 | 39 | 236 | 34 | 0.00 | 2.17 | 637 | 2830 | 524 | 0.00 | 2.12 | 510 | 1483 | 463 | 0.00 |
| 2.28 | 32 | 276 | 26 | 0.00 | 2.20 | 401 | 2780 | 291 | 0.00 | 2.17 | 1180 | 4510 | 1020 | 0.00 |
| 2.33 | 29 | 182 | 25 | 0.00 | 2.24 | 411 | 3060 | 322 | 0.00 | 2.14 | 141 | 1420 | 93 | 0.00 |
| 2.26 | 32 | 243 | 26 | 0.00 | 2.27 | 189 | 1180 | 153 | 1.00 | 2.17 | 347 | 2490 | 236 | 0.00 |
| 2.28 | 46 | 269 | 37 | 0.00 | 2.15 | 141 | 1420 | 93 | 1.00 | 2.17 | 351 | 2020 | 261 | 0.00 |
| 2.35 | 39 | 269 | 32 | 0.00 | 2.12 | 242 | 2580 | 143 | 1.00 | 2.15 | 223 | 1057 | 159 | 1.00 |
| 2.30 | 41 | 271 | 31 | 0.00 | 2.15 | 311 | 2680 | 156 | 1.00 | 2.13 | 526 | 3160 | 408 | 1.00 |
| 2.13 | 180 | 998 | 141 | 1.00 | 2.14 | 279 | 1820 | 217 | 0.42 | 2.16 | 306 | 1502 | 247 | 0.28 |
| 2.11 | 269 | 1360 | 216 | 1.00 | 2.06 | 418 | 2970 | 252 | 0.18 | 2.04 | 1390 | 5394 | 1202 | 0.28 |
| 2.12 | 208 | 1210 | 160 | 1.00 | 2.07 | 637 | 2830 | 524 | 0.39 | 2.13 | 227 | 1182 | 193 | 0.21 |
| 2.15 | 198 | 996 | 160 | 1.00 | 2.10 | 401 | 2780 | 291 | 0.42 | 2.13 | 209 | 1312 | 169 | 0.21 |
| 2.15 | 206 | 1120 | 160 | 1.00 | 2.07 | 411 | 3060 | 322 | 0.18 | 2.1 | 547 | 1898 | 461 | 0.16 |
| 2.09 | 278 | 1570 | 226 | 1.00 | 2.12 | 867 | 3150 | 747 | 0.18 | 2.06 | 1370 | 5211 | 1172 | 0.46 |
| 2.11 | 327 | 1500 | 272 | 1.00 | 2.11 | 526 | 3160 | 408 | 0.39 | 2.12 | 218 | 1498 | 137 | 0.29 |
| 2.12 | 272 | 1370 | 219 | 1.00 | 2.11 | 574 | 3270 | 429 | 0.44 | 2.08 | 619 | 2404 | 520 | 0.29 |
| 2.15 | 183 | 1130 | 146 | 1.00 | - | - | - | - | - | 2.14 | 191 | 1035 | 142 | 0.29 |
| 2.13 | 180 | 1030 | 134 | 1.00 | - | - | - | - | - | 2.07 | 914 | 3621 | 802 | 0.34 |
| 2.09 | 230 | 1310 | 186 | 0.50 | - | - | - | - | - | 2.08 | 607 | 2419 | 519 | 0.34 |
| 2.12 | 160 | 1200 | 117 | 0.50 | - | - | - | - | - | 2.19 | 281 | 1509 | 222 | 0.24 |
| 2.09 | 373 | 1620 | 311 | 0.50 | - | - | - | - | - | 2.17 | 282 | 1977 | 189 | 0.18 |
| 2.11 | 190 | 1010 | 150 | 0.50 | - | - | - | - | - | 2.18 | 328 | 1464 | 293 | 0.28 |
| 2.09 | 437 | 1760 | 380 | 0.50 | - | - | - | - | - | 2.07 | 547 | 1960 | 503 | 0.24 |
| 2.09 | 489 | 2180 | 416 | 0.50 | - | - | - | - | - | 2.13 | 1180 | 5017 | 907 | 0.24 |
| 2.16 | 433 | 1820 | 370 | 0.50 | - | - | - | - | - | 2.12 | 408 | 1765 | 327 | 0.42 |
| 2.09 | 522 | 2060 | 452 | 0.50 | - | - | - | - | - | 2.15 | 544 | 1771 | 463 | 0.42 |
| 2.07 | 400 | 1880 | 324 | 0.50 | - | - | - | - | - | 2.08 | 595 | 2642 | 479 | 0.55 |
| - | - | - | - | - | - | - | - | - | - | 2.08 | 524 | 2471 | 405 | 0.55 |
| - | - | - | - | - | - | - | - | - | - | 2.13 | 539 | 2135 | 488 | 0.33 |
| - | - | - | - | - | - | - | - | - | - | 2.12 | 334 | 2204 | 247 | 0.55 |
| - | - | - | - | - | - | - | - | - | - | 2.08 | 525 | 1811 | 495 | 0.26 |
| - | - | - | - | - | - | - | - | - | - | 2.12 | 475 | 1601 | 417 | 0.23 |
| - | - | - | - | - | - | - | - | - | - | 2.16 | 339 | 1309 | 282 | 0.60 |
| - | - | - | - | - | - | - | - | - | - | 2.14 | 357 | 1242 | 312 | 0.23 |
| - | - | - | - | - | - | - | - | - | - | 2.21 | 182 | 1055 | 154 | 0.33 |
| - | - | - | - | - | - | - | - | - | - | 2.17 | 376 | 1473 | 293 | 0.15 |
| - | - | - | - | - | - | - | - | - | - | 2.2 | 282 | 1265 | 221 | 0.31 |
| - | - | - | - | - | - | - | - | - | - | 2.16 | 399 | 1248 | 348 | 0.18 |
| - | - | - | - | - | - | - | - | - | - | 2.13 | 382 | 1182 | 339 | 0.39 |
| - | - | - | - | - | - | - | - | - | - | 2.21 | 1130 | 4510 | 915 | 0.21 |
| - | - | - | - | - | - | - | - | - | - | 2.15 | 595 | 3260 | 458 | 0.26 |
| - | - | - | - | - | - | - | - | - | - | 2.16 | 989 | 3860 | 803 | 0.26 |
| - | - | - | - | - | - | - | - | - | - | 2.2 | 867 | 3150 | 747 | 0.16 |
| - | - | - | - | - | - | - | - | - | - | 2.15 | 574 | 3270 | 429 | 0.18 |
| - | - | - | - | - | - | - | - | - | - | 2.14 | 189 | 1180 | 153 | 0.26 |
| - | - | - | - | - | - | - | - | - | - | 2.17 | 242 | 2580 | 143 | 0.16 |
| - | - | - | - | - | - | - | - | - | - | 2.18 | 311 | 2680 | 156 | 0.16 |
References
- Qian, J.; Fatemi, A. Mixed mode fatigue crack growth: A literature survey. Eng. Fract. Mech. 1996, 55, 969–990. [Google Scholar] [CrossRef]
- Tomczyk, A.; Seweryn, A. Experimental investigation and modeling of damage accumulation of EN-AW 2024 aluminum alloy under creep condition at elevated temperature. Materials 2021, 14, 404. [Google Scholar] [CrossRef]
- Merson, E.; Danilov, V.; Merson, D.; Vinogradov, A. Confocal laser scanning microscopy: The technique for quantitative fractographic analysis. Eng. Fract. Mech. 2017, 183, 147–158. [Google Scholar] [CrossRef]
- Cisko, A.; Jordon, J.; Avery, D.; Liu, T.; Brewer, L.; Allison, P.; Carino, R.; Hammi, Y.; Rushing, T.; Garcia, L. Experiments and Modeling of Fatigue Behavior of Friction Stir Welded Aluminum Lithium Alloy. Metals 2019, 9, 293. [Google Scholar] [CrossRef] [Green Version]
- Djukic, M.B.; Sijacki Zeravcic, V.; Bakic, G.M.; Sedmak, A.; Rajicic, B. Hydrogen damage of steels: A case study and hydrogen embrittlement model. Eng. Fail. Anal. 2015, 58, 485–498. [Google Scholar] [CrossRef]
- Martelo, D.; Sampath, D.; Monici, A.; Morana, R.; Akid, R. Correlative analysis of digital imaging, acoustic emission, and fracture surface topography on hydrogen assisted cracking in Ni-alloy 625+. Eng. Fract. Mech. 2019, 221, 106678. [Google Scholar] [CrossRef]
- Slámečka, K.; Šesták, P.; Vojtek, T.; Kianicová, M.; Horníková, J.; Šandera, P.; Pokluda, J. A Fractographic Study of Bending/Torsion Fatigue Failure in Metallic Materials with Protective Surface Layers. Adv. Mater. Sci. Eng. 2016, 2016, 1–6. [Google Scholar] [CrossRef] [Green Version]
- Branco, R.; Costa, J.D.M.; Berto, F.; Razavi, S.M.J.; Ferreira, J.A.M.; Capela, C.; Santos, L.; Antunes, F. Low-cycle fatigue behaviour of AISI 18Ni300 maraging steel produced by selective laser melting. Metals 2018, 8, 32. [Google Scholar] [CrossRef] [Green Version]
- Fonte, M.; Romeiro, F.; Freitas, M. Environment effects and surface roughness on fatigue crack growth at negative R-ratios. Int. J. Fatigue 2007, 29, 1971–1977. [Google Scholar] [CrossRef]
- Macek, W.; Branco, R.; Trembacz, J.; Costa, J.D.; Ferreira, J.A.M.; Capela, C. Effect of multiaxial bending-torsion loading on fracture surface parameters in high-strength steels processed by conventional and additive manufacturing. Eng. Fail. Anal. 2020, 118, 104784. [Google Scholar] [CrossRef]
- Quinn, J.B.; Quinn, G.D.; Kelly, J.R.; Scherrer, S.S. Fractographic analyses of three ceramic whole crown restoration failures. Dent. Mater. 2005, 21, 920–929. [Google Scholar] [CrossRef]
- Huang, H.M.; Tsai, C.M.; Chang, C.C.; Lin, C.T.; Lee, S.Y. Evaluation of loading conditions on fatigue-failed implants by fracture surface analysis. Int. J. Oral Maxillofac. Implant. 2005, 20, 854–859. [Google Scholar] [CrossRef]
- Macek, W.; Owsiński, R.; Trembacz, J.; Branco, R. Three-dimensional fractographic analysis of total fracture areas in 6082 aluminium alloy specimens under fatigue bending with controlled damage degree. Mech. Mater. 2020, 147, 103410. [Google Scholar] [CrossRef]
- Macek, W. Post-failure fracture surface analysis of notched steel specimens after bending-torsion fatigue. Eng. Fail. Anal. 2019, 105, 1054–1071. [Google Scholar] [CrossRef]
- Branco, R.; Costa, J.D.; Berto, F.; Kotousov, A.; Antunes, F.V. Fatigue crack initiation behaviour of notched 34CrNiMo6 steel bars under proportional bending-torsion loading. Int. J. Fatigue 2020, 130, 105268. [Google Scholar] [CrossRef]
- Fonte, M.; Infante, V.; Reis, L.; Freitas, M. Failure mode analysis of a diesel motor crankshaft. Eng. Fail. Anal. 2017, 82, 681–686. [Google Scholar] [CrossRef]
- Adamczak, S.; Zmarzły, P. Research of the influence of the 2D and 3D surface roughness parameters of bearing raceways on the vibration level. J. Phys. Conf. Ser. 2019, 1183, 012001. [Google Scholar] [CrossRef]
- Lou, S.; Zhu, Z.; Zeng, W.; Majewski, C.; Scott, P.J.; Jiang, X. Material ratio curve of 3D surface topography of additively manufactured parts: An attempt to characterise open surface pores. Surf. Topogr. Metrol. Prop. 2021, 9, 015029. [Google Scholar] [CrossRef]
- Li, J.; Du, Q.; Sun, C. An improved box-counting method for image fractal dimension estimation. Pattern Recognit. 2009, 42, 2460–2469. [Google Scholar] [CrossRef]
- Leach, R. Characterisation of Areal Surface Texture; Springer: Berlin/Heidelberg, Germany, 2013; ISBN 9783642364587. [Google Scholar] [CrossRef]
- Senin, N.; Thompson, A.; Leach, R.K. Characterisation of the topography of metal additive surface features with different measurement technologies. Meas. Sci. Technol. 2017, 28, 095003. [Google Scholar] [CrossRef]
- Zak, K. Cutting mechanics and surface finish for turning with differently shaped CBN tools. Arch. Mech. Eng. 2017, 64, 347–357. [Google Scholar] [CrossRef] [Green Version]
- Lu, W.; Zhang, P.; Zhai, W.; Wang, J.; Liu, X.; Jiang, X. Impact of surface topography on torsional fretting wear of the blade bearing interface under different lubrication conditions. Surf. Topogr. Metrol. Prop. 2019, 7, 015017. [Google Scholar] [CrossRef]
- Podulka, P. The Effect of Surface Topography Feature Size Density and Distribution on the Results of a Data Processing and Parameters Calculation with a Comparison of Regular Methods. Materials 2021, 14, 4077. [Google Scholar] [CrossRef]
- Giusca, C.L.; Leach, R.K.; Helary, F.; Gutauskas, T.; Nimishakavi, L. Calibration of the scales of areal surface topography-measuring instruments: Part 1. Measurement noise and residual flatness. Meas. Sci. Technol. 2012, 23, 035008. [Google Scholar] [CrossRef]
- Dobrzanski, P.; Pawlus, P. Digital filtering of surface topography: Part II. Applications of robust and valley suppression filters. Precis. Eng. 2010, 34, 651–658. [Google Scholar] [CrossRef]
- ISO-ISO 16610-21:2011-Geometrical Product Specifications (GPS)—Filtration—Part 21: Linear Profile Filters: Gaussian Filters. Available online: https://www.iso.org/standard/50176.html (accessed on 21 August 2021).
- Ţălu, Ş.; Matos, R.S.; Pinto, E.P.; Rezaee, S.; Mardani, M. Stereometric and fractal analysis of sputtered Ag-Cu thin films. Surf. Interfaces 2020, 21, 100650. [Google Scholar] [CrossRef]
- Prajapati, D.K.; Ahmed, S. Analysis of micro-friction stir welding surfaces using fractal methodologies. Surf. Topogr. Metrol. Prop. 2020, 8, 035011. [Google Scholar] [CrossRef]
- Cao, J.; Zeng, Z.; Zhang, F.; Guo, D.; Hou, Z. Effect of Cooling Rates on the Local—Overall Morphology Characteristics of Solidification Structure at Different Stages for High Carbon Steel. Metals 2021, 11, 1291. [Google Scholar] [CrossRef]
- Issa, M.A.; Issa, M.A.; Islam, M.S.; Chudnovsky, A. Fractal dimension-a measure of fracture roughness and toughness of concrete. Eng. Fract. Mech. 2003, 70, 125–137. [Google Scholar] [CrossRef]
- Charkaluk, E.; Bigerelle, M.; Iost, A. Fractals and fracture. Eng. Fract. Mech. 1998, 61, 119–139. [Google Scholar] [CrossRef]
- Carpinteri, A.; Chiaia, B.; Cornetti, P. A scale-invariant cohesive crack model for quasi-brittle materials. Eng. Fract. Mech. 2001, 69, 207–217. [Google Scholar] [CrossRef]
- Kotowski, P. Fractal dimension of metallic fracture surface. Int. J. Fract. 2006, 141, 269–286. [Google Scholar] [CrossRef]
- Sahu, S.; Yadav, P.C.; Shekhar, S. Fractal Analysis as Applied to Fractography in Ferritic Stainless Steel. Metallogr. Microstruct. Anal. 2017, 6, 598–609. [Google Scholar] [CrossRef]
- Macek, W. Fractal analysis of the bending-torsion fatigue fracture of aluminium alloy. Eng. Fail. Anal. 2019, 99, 97–107. [Google Scholar] [CrossRef]
- Macek, W.; Branco, R.; Korpyś, M.; Łagoda, T. Fractal dimension for bending–torsion fatigue fracture characterisation. Measurement 2021, 184, 109910. [Google Scholar] [CrossRef]
- Macek, W.; Branco, R.; Szala, M.; Marciniak, Z.; Ulewicz, R.; Sczygiol, N.; Kardasz, P. Profile and Areal Surface Parameters for Fatigue Fracture Characterisation. Materials 2020, 13, 3691. [Google Scholar] [CrossRef] [PubMed]
- Macek, W.; Marciniak, Z.; Branco, R.; Rozumek, D.; Królczyk, G.M. A fractographic study exploring the fracture surface topography of S355J2 steel after pseudo-random bending-torsion fatigue tests. Measurement 2021, 178, 109443. [Google Scholar] [CrossRef]
- Rozumek, D.; Faszynka, S. Surface cracks growth in aluminum alloy AW-2017A-T4 under combined loadings. Eng. Fract. Mech. 2020, 226, 106896. [Google Scholar] [CrossRef]
- Kaplonek, W.; Nadolny, K. Advanced 3D laser microscopy for measurements and analysis of vitrified bonded abrasive tools. J. Eng. Sci. Technol. 2012, 7, 661–678. [Google Scholar]
- Tanaka, M.; Kato, R.; Fujita, T. Review of fractal analysis of fracture surfaces in various materials using three-dimensional images reconstructed by stereo matching method. Strength Fract. Complex. 2020, 12, 143–162. [Google Scholar] [CrossRef]
- Carpinteri, A.; Spagnoli, A.; Vantadori, S. An approach to size effect in fatigue of metals using fractal theories. Fatigue Fract. Eng. Mater. Struct. 2002, 25, 619–627. [Google Scholar] [CrossRef]
- Macek, W. Fracture Areas Quantitative Investigating of Bending–Torsion Fatigued Low-Alloy High-Strength Steel. Metals 2021, 11, 1620. [Google Scholar] [CrossRef]
- Slámečka, K.; Ponížil, P.; Pokluda, J. Quantitative fractography in bending-torsion fatigue. Mater. Sci. Eng. A 2007, 462, 359–362. [Google Scholar] [CrossRef]
- Macek, W.; Branco, R.; Costa, J.D.; Pereira, C. Strain sequence effect on fatigue life and fracture surface topography of 7075-T651 aluminium alloy. Mech. Mater. 2021, 160, 103972. [Google Scholar] [CrossRef]
- Haigh, J.; Conover, W.J. Practical Nonparametric Statistics. J. R. Stat. Soc. Ser. A 1981, 144, 370–371. [Google Scholar] [CrossRef]
- Pan, W.; Li, X.; Wang, L.; Mu, J.; Yang, Z. Influence of surface topography on three-dimensional fractal model of sliding friction. AIP Adv. 2017, 7, 095321. [Google Scholar] [CrossRef] [Green Version]


| Material | Reference | ||
|---|---|---|---|
| 10HNAP | 0; 0.5; 1 | −1 | [14] |
| S355J2 | 0; 0.16–0.6; 1 | −1 | [39] |
| 2017-T4 | 0; 0.18–0.44; 1 | −1; −0.5; 0 | [40] |
| Specimen | Entire Fracture | Initiation | Propagation |
|---|---|---|---|
| 10HNAP (r = 0) | 2.280 | 2.230 | 2.224 |
| S355J2 (r = 0.18) | 2.170 | 2.088 | 2.176 |
| 2017-T4 (r = 0) | 2.300 | 2.180 | 2.172 |
| Loading Mode | Averaged Fractal Dimension | ||
|---|---|---|---|
| 10HNAP | 2017-T4 | S355J2 | |
| Bending (B) | 2.28 | 2.20 | 2.18 |
| Torsion (T) | 2.13 | 2.17 | 2.14 |
| Bending-Torsion (B-T) | 2.10 | 2.10 | 2.13 |
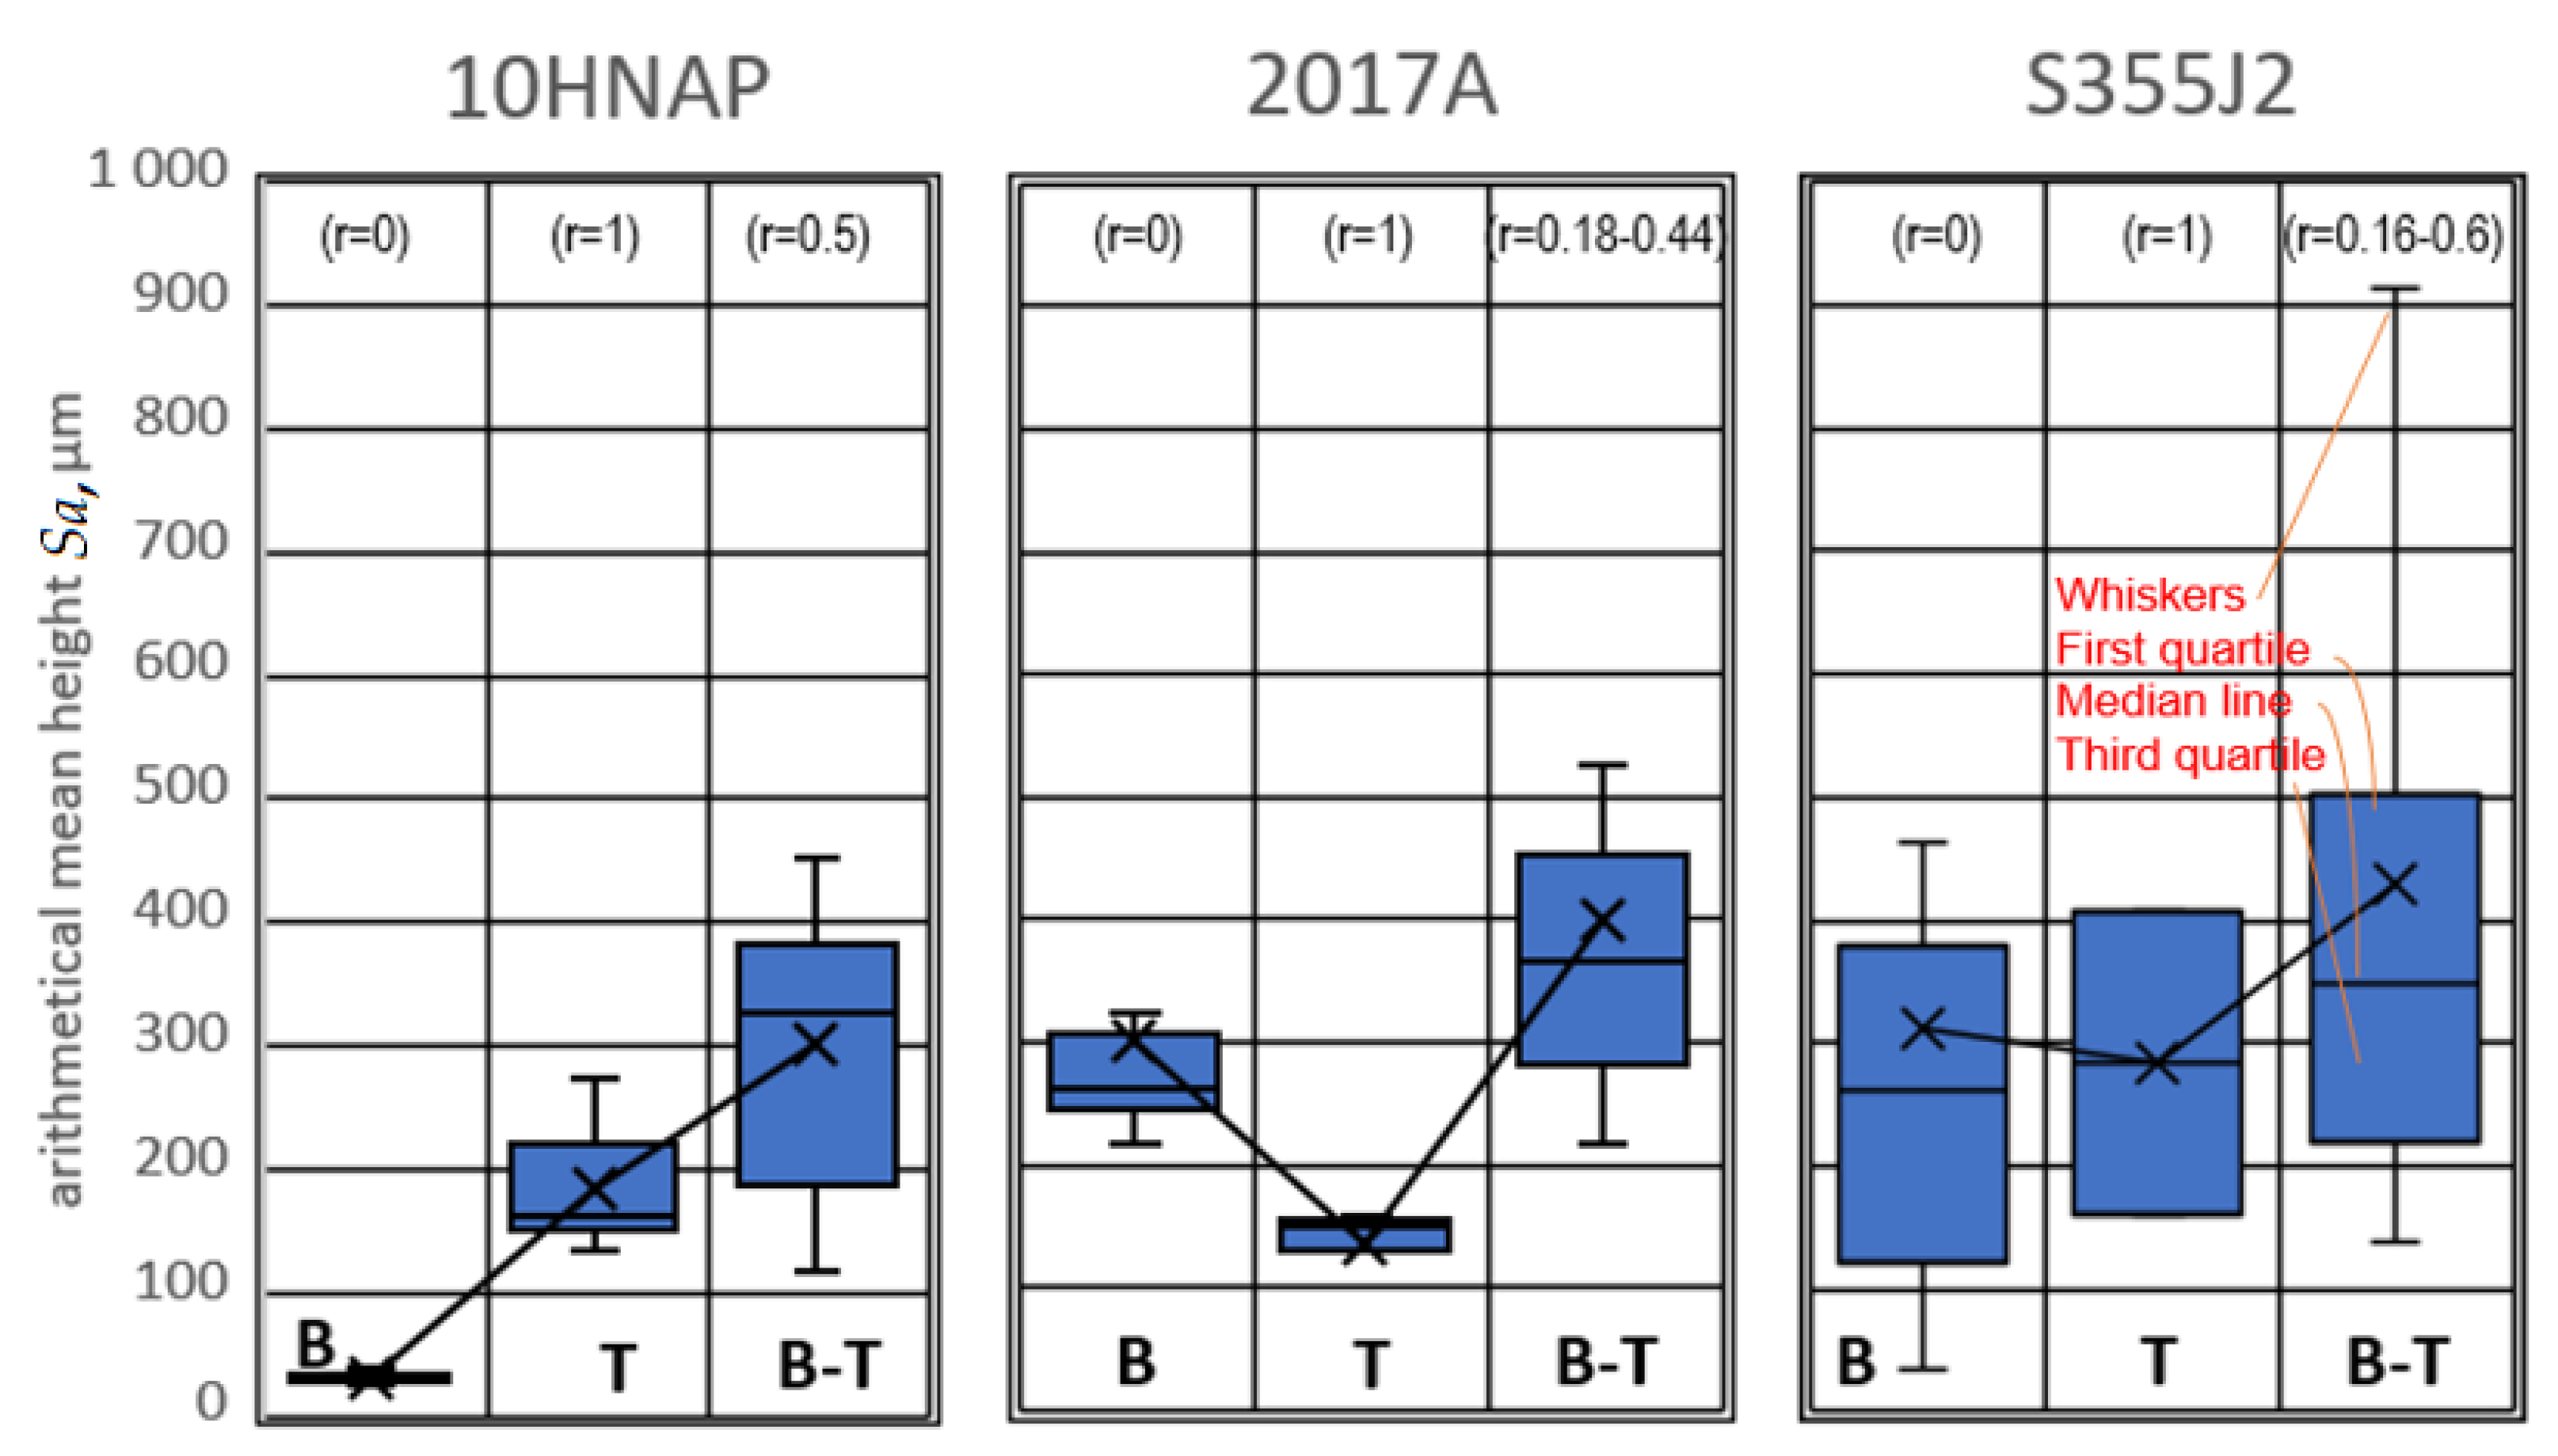
| Parameter | Specimen | ||
|---|---|---|---|
| 10HNAP | 2017-T4 | S355J2 | |
| Df max. | B | B | B |
| Df min. | B-T | B-T | B-T |
| Sa max. | B-T | B-T | B-T |
| Sa min. | B | T | T |
| RMSE | R2 | MSE | MAE |
|---|---|---|---|
| 202.66 | 0.31 | 41072 | 145.98 |
| Curve Fitting, General Model Gaussian | Goodness of Fit |
|---|---|
| f(x) = a × exp(−((x − b)/c)2) | SSE: 8383 |
| Coefficients: | R2: 0.637 |
| a = 76.3 | Adjusted R2: 0.6294 |
| b = 2.435 | RMSE: 9.345 |
| c = 0.1918 |
Publisher’s Note: MDPI stays neutral with regard to jurisdictional claims in published maps and institutional affiliations. |
© 2021 by the author. Licensee MDPI, Basel, Switzerland. This article is an open access article distributed under the terms and conditions of the Creative Commons Attribution (CC BY) license (https://creativecommons.org/licenses/by/4.0/).
Share and Cite
Macek, W. Correlation between Fractal Dimension and Areal Surface Parameters for Fracture Analysis after Bending-Torsion Fatigue. Metals 2021, 11, 1790. https://doi.org/10.3390/met11111790
Macek W. Correlation between Fractal Dimension and Areal Surface Parameters for Fracture Analysis after Bending-Torsion Fatigue. Metals. 2021; 11(11):1790. https://doi.org/10.3390/met11111790
Chicago/Turabian StyleMacek, Wojciech. 2021. "Correlation between Fractal Dimension and Areal Surface Parameters for Fracture Analysis after Bending-Torsion Fatigue" Metals 11, no. 11: 1790. https://doi.org/10.3390/met11111790
APA StyleMacek, W. (2021). Correlation between Fractal Dimension and Areal Surface Parameters for Fracture Analysis after Bending-Torsion Fatigue. Metals, 11(11), 1790. https://doi.org/10.3390/met11111790